
Performance Assessment of a Newly Constructed Skewed ...
14
Performance Assessment of a Newly Constructed Skewed Half-Through Railway Bridge Using Integrated Sensing Weiwei Lin, Ph.D., A.M.ASCE 1 ; Liam J. Butler, Ph.D., P.Eng. 2 ; Mohammed Z. E. B. Elshafie, Ph.D., M.ASCE 3 ; and Campbell R. Middleton, Ph.D., C.Eng., CPEng 4 Abstract: Half-through steel plate girder bridges are widely used across the United Kingdom’s railway network. However, few studies have investigated their real in-service behavior. Concurrently, the use of advanced sensor systems, such as those utilizing fiber-optic sensors, have begun to find widespread use in structural health monitoring due to their high accuracy and long-term stability and durability. In this paper, the real performance of a newly constructed skewed half-through plate girder railway bridge was assessed using an integrated fiber optic monitor- ing system installed during the bridge’s construction. Monitoring data recorded during the passage of 12 separate trains consisted of strains measured along the length of the main steel plate girders and crossbeams. Based on available design and construction information, a three- dimensional finite-element model capable of simulating the railway bridge’s response was constructed and used to investigate and provide comparisons with monitoring results of the performance of such bridges under passing trains. The influence of track cant on load distribution between the two main girders was discussed, and the live load utilization percentage of the main girders was estimated to be approximately 37% of its design capacity. In addition, the effect of different transverse crossbeam end-connection details (pinned or moment connected) and the influence of axle load distribution through track ballast on the overall response of the bridge structure were evaluated. The results obtained in this study have not only led to the establishment of a comprehensive performance baseline for the newly constructed bridge for long-term condition monitoring but may also be used for improving the design and in-service structural evaluation of such bridges. DOI: 10.1061/ (ASCE)BE.1943-5592.0001334. © 2018 American Society of Civil Engineers. Author keywords: Half-through railway bridge; Structural health monitoring; Fiber optic sensors; Numerical analysis; Performance assessment. Introduction Plate girder bridges consisting of two main longitudinal girders, multiple transverse cross girders, and a composite reinforced con- crete deck are widely used in bridge structures because they provide an economical design and rapid form of construction. This form of bridge became popular in the late 1800s for railroad bridge con- struction (Kopare and Upase 2015). Plate girder bridges typically consist of either a full-depth beam type or a half-through type (Fig. 1), depending on minimum clearance requirements. A half- through bridge configuration is widely used in railway bridges where the available clearance between the rail surface and the clear- ance beneath the bridge is too shallow to accommodate the full depth of the structural elements spanning between the bridge sup- ports. Moreover, it is sometimes not possible to arrange a bridge span square to the feature that it crosses, particularly where it is im- portant to maintain a relatively straight alignment of a roadway or rail line above or below the bridge; in these cases, a skewed configu- ration is required. This skewed arrangement increases the span length and gives rise to additional torsional effects resulting in rela- tively complex support reactions. For continuous composite bridges with span lengths of up to approximately 200 ft (61 m), plate girder bridges represent the majority of the bridge population (Knight 1984). In recent years, research on both straight and skewed plate girder bridges has been performed. Sakurai et al. (2002) reported their studies on two plate girder skew bridges based on numerical analysis techniques, focusing on the effects of skew and bending at piers. Quadrato et al. (2010) presented their findings of an investigation of the connection details and bracing layouts for sta- bility bracing of skewed steel plate girder bridges. The results indicated that the use of split pipe stiffeners (allowing perpendic- ular connections to the cross-frame connection tab) provided a stiffer connection between the cross frame and the girder while increasing its torsional stiffness. Kaliyaperumal et al. (2011) pre- sented advanced modeling techniques for steel plate girder rail- way bridges where eigenvalue analyses and time history dynamic analyses were carried out. The results demonstrated that a full bridge model using a combination of beam and shell elements could provide a reasonably accurate and computationally efficient way of capturing the dynamic behavior of the bridge. Zhou et al. (2016) investigated the effects of a cross-frame layout on lateral flange bending stresses in skewed steel plate girder bridges. The findings of that study showed that cross frames placed parallel to the angle of skew [Fig. 2(a)] produced significantly lower lateral flange bending stresses compared with cases in which cross 1 Associate Professor, Dept. of Civil and Environmental Engineering, Waseda Univ., Shinjuku-ku, Tokyo 169-8555, Japan (corresponding author). Email: [email protected] 2 Research Associate, Dept. of Engineering, Univ. of Cambridge, Trumpington St., Cambridge CB2 1PZ, UK. Email: [email protected]; Group Leader, Lloyd’s Registration Foundation Programme on Data-Centric Engineering, Alan Turing Institute, London NW1 2DB, UK. 3 Lecturer, Dept. of Engineering, Univ. of Cambridge, Trumpington St., Cambridge CB2 1PZ, UK. Email: [email protected] 4 Professor, Dept. of Engineering, Univ. of Cambridge, Trumpington St., Cambridge CB2 1PZ, UK. Email: [email protected] Note. This manuscript was submitted on December 18, 2017; approved on July 16, 2018; published online on November 12, 2018. Discussion pe- riod open until April 12, 2019; separate discussions must be submitted for individual papers. This paper is part of the Journal of Bridge Engineering, © ASCE, ISSN 1084-0702. © ASCE 04018107-1 J. Bridge Eng. J. Bridge Eng., 2019, 24(1): 04018107 Downloaded from ascelibrary.org by University of Virginia on 11/13/18. Copyright ASCE. For personal use only; all rights reserved.
-
Upload
khangminh22 -
Category
Documents
-
view
0 -
download
0
Transcript of Performance Assessment of a Newly Constructed Skewed ...

Performance Assessment of a Newly Constructed SkewedHalf-Through Railway Bridge Using Integrated Sensing
Weiwei Lin, Ph.D., A.M.ASCE1; Liam J. Butler, Ph.D., P.Eng.2; Mohammed Z. E. B. Elshafie, Ph.D., M.ASCE3;and Campbell R. Middleton, Ph.D., C.Eng., CPEng4
Abstract: Half-through steel plate girder bridges are widely used across the United Kingdom’s railway network. However, few studies haveinvestigated their real in-service behavior. Concurrently, the use of advanced sensor systems, such as those utilizing fiber-optic sensors, havebegun to find widespread use in structural health monitoring due to their high accuracy and long-term stability and durability. In this paper, thereal performance of a newly constructed skewed half-through plate girder railway bridge was assessed using an integrated fiber optic monitor-ing system installed during the bridge’s construction. Monitoring data recorded during the passage of 12 separate trains consisted of strainsmeasured along the length of the main steel plate girders and crossbeams. Based on available design and construction information, a three-dimensional finite-element model capable of simulating the railway bridge’s response was constructed and used to investigate and providecomparisons with monitoring results of the performance of such bridges under passing trains. The influence of track cant on load distributionbetween the two main girders was discussed, and the live load utilization percentage of the main girders was estimated to be approximately37% of its design capacity. In addition, the effect of different transverse crossbeam end-connection details (pinned or moment connected) andthe influence of axle load distribution through track ballast on the overall response of the bridge structure were evaluated. The results obtainedin this study have not only led to the establishment of a comprehensive performance baseline for the newly constructed bridge for long-termcondition monitoring but may also be used for improving the design and in-service structural evaluation of such bridges. DOI: 10.1061/(ASCE)BE.1943-5592.0001334.© 2018 American Society of Civil Engineers.
Author keywords: Half-through railway bridge; Structural health monitoring; Fiber optic sensors; Numerical analysis; Performanceassessment.
Introduction
Plate girder bridges consisting of two main longitudinal girders,multiple transverse cross girders, and a composite reinforced con-crete deck are widely used in bridge structures because they providean economical design and rapid form of construction. This form ofbridge became popular in the late 1800s for railroad bridge con-struction (Kopare and Upase 2015). Plate girder bridges typicallyconsist of either a full-depth beam type or a half-through type(Fig. 1), depending on minimum clearance requirements. A half-through bridge configuration is widely used in railway bridgeswhere the available clearance between the rail surface and the clear-ance beneath the bridge is too shallow to accommodate the fulldepth of the structural elements spanning between the bridge sup-ports. Moreover, it is sometimes not possible to arrange a bridge
span square to the feature that it crosses, particularly where it is im-portant to maintain a relatively straight alignment of a roadway orrail line above or below the bridge; in these cases, a skewed configu-ration is required. This skewed arrangement increases the spanlength and gives rise to additional torsional effects resulting in rela-tively complex support reactions. For continuous composite bridgeswith span lengths of up to approximately 200 ft (61m), plate girderbridges represent the majority of the bridge population (Knight1984).
In recent years, research on both straight and skewed plategirder bridges has been performed. Sakurai et al. (2002) reportedtheir studies on two plate girder skew bridges based on numericalanalysis techniques, focusing on the effects of skew and bendingat piers. Quadrato et al. (2010) presented their findings of aninvestigation of the connection details and bracing layouts for sta-bility bracing of skewed steel plate girder bridges. The resultsindicated that the use of split pipe stiffeners (allowing perpendic-ular connections to the cross-frame connection tab) provided astiffer connection between the cross frame and the girder whileincreasing its torsional stiffness. Kaliyaperumal et al. (2011) pre-sented advanced modeling techniques for steel plate girder rail-way bridges where eigenvalue analyses and time history dynamicanalyses were carried out. The results demonstrated that a fullbridge model using a combination of beam and shell elementscould provide a reasonably accurate and computationally efficientway of capturing the dynamic behavior of the bridge. Zhou et al.(2016) investigated the effects of a cross-frame layout on lateralflange bending stresses in skewed steel plate girder bridges. Thefindings of that study showed that cross frames placed parallel tothe angle of skew [Fig. 2(a)] produced significantly lower lateralflange bending stresses compared with cases in which cross
1Associate Professor, Dept. of Civil and Environmental Engineering,Waseda Univ., Shinjuku-ku, Tokyo 169-8555, Japan (correspondingauthor). Email: [email protected]
2Research Associate, Dept. of Engineering, Univ. of Cambridge,Trumpington St., Cambridge CB2 1PZ, UK. Email: [email protected];Group Leader, Lloyd’s Registration Foundation Programme on Data-CentricEngineering, Alan Turing Institute, London NW1 2DB, UK.
3Lecturer, Dept. of Engineering, Univ. of Cambridge, TrumpingtonSt., Cambridge CB2 1PZ, UK. Email: [email protected]
4Professor, Dept. of Engineering, Univ. of Cambridge, TrumpingtonSt., Cambridge CB2 1PZ, UK. Email: [email protected]
Note. This manuscript was submitted on December 18, 2017; approvedon July 16, 2018; published online on November 12, 2018. Discussion pe-riod open until April 12, 2019; separate discussions must be submitted forindividual papers. This paper is part of the Journal of Bridge Engineering,© ASCE, ISSN 1084-0702.
© ASCE 04018107-1 J. Bridge Eng.
J. Bridge Eng., 2019, 24(1): 04018107
Dow
nloa
ded
from
asc
elib
rary
.org
by
Uni
vers
ity o
f V
irgi
nia
on 1
1/13
/18.
Cop
yrig
ht A
SCE
. For
per
sona
l use
onl
y; a
ll ri
ghts
res
erve
d.

frames were staggered and placed perpendicular to the girder line[Fig. 2(c)]. Hendy and Jones (2009) investigated buckling cases forhalf-through plate girder bridges where the effective length for buck-ling is shorter than the half wavelength for buckling and demon-strated that the series of correction curves used in BS 5400–3 (BSI2000) were unnecessary. Different from previous studies, thisresearch aims to investigate the actual in-service behavior of suchbridges by using both modern sensing technologies and finite-element (FE) modeling.
Despite previous studies on half-through plate girder bridges,the actual in-service performance of such bridges (e.g., the effectof end connections of crossbeams, the influence of track cant andaxle load distribution scenarios) has not yet been investigated.With the development of robust fiber optic (FOS) sensing tech-nologies, these systems are being used increasingly worldwidefor assessing and better understanding the in-service performanceof bridges. FOS techniques offer several distinct advantages overtraditional electrical-based strain sensors such as having greateraccuracy and reduced wiring requirements and being noncorro-sive in nature and electromagnetically inert. Recently, FOS hasbeen used in structural monitoring under static and dynamic in-service conditions (Regier and Hoult 2014; Scarella et al. 2017;Webb et al. 2017), for fatigue assessment (Wijesinghe et al.2013), and for scour measurement (Zarafshan et al. 2012; Konget al. 2017) in bridge structures.
This paper provides an analysis of data obtained from a newlyconstructed “self-sensing” skewed half-through railway bridgeinstrumented with an advanced network of fiber-optic sensors. Theprimary contributions of this study include the following:• Testing and demonstrating the effectiveness of the integrated
sensing system for capturing the response of the bridge super-structure elements under passing trains;
• Constructing and validating a three-dimensional (3D) linearFE model of a skewed half-through bridge using data obtainedfrom the sensor network;
• Evaluating the effect of variations in load distribution and thecrossbeam end connection details on the bridge’s response;and
• Assessing the live load utilization percentage of the primarystructural elements by comparing information gathered fromthe monitoring data, the validated FE model predictions, andEurocode design equations.
To the best of the authors’ knowledge, this study represents thefirst time in which such an extensive and advanced fiber-opticbased monitoring system has been used to quantify and assessthe in-service performance of a skewed half-through railwaybridge. This sensing capability is leveraged through detaileddata and numerical analyses to investigate the actual effects ofcritical design factors (e.g., loading condition caused by eccen-tricity, centrifugal forces) on the behavior and the real in-serviceperformance of structural members (i.e., main plate girders andcrossbeams).
Description of the Instrumented Bridge
The bridge evaluated in this study is referred to as IntersectionBridge 20A and is located along the West Coast Main (railway)Line, in Staffordshire, United Kingdom. This bridge represents animportant structure in a large rail upgrade and redevelopment pro-ject known as the Stafford Area Improvements Programme com-pleted in 2016. The bridge was designed as a Network Rail“E-type” steel half-through bridge with a single skew span of26.84m, supported on four bearings on reinforced concrete abut-ments (Butler et al. 2016, 2018). The width of the bridge cross sec-tion (distance between the webs of the twin main girders) was7.3m. The bridge carries two new rail lines on ballasted track overanother existing heavily trafficked rail line. Design details of thecross section are shown in Fig. 3.
To achieve minimum structural depth requirements, a compositebeam and slab arrangement was adopted for the bridge deck. Thesuperstructure consists of a pair of main longitudinal steel I-girdersand a composite deck supported on secondary steel cross girders. Inthe design, web stiffeners were used to increase stability and avoidlocal buckling of the main girder top flanges and to prevent webbuckling. Additional flange plates (doubler plates) were used in theregion of greatest moment near the midspan. Two different flangethicknesses of 60mm and 120mmwere used for the girder end sec-tion and the midspan sections (i.e., doubler plates), respectively.Transverse crossbeams, with alternating pinned and moment con-nections were spaced at every 1.5 m. To provide lateral bucklingrestraint to the top flanges, U-frames consisting of vertical webstiffeners were used on the main girders at locations correspond-ing to moment-connected crossbeam locations. Typical cross-beam arrangements in skewed half-through railway bridges aredepicted in Fig. 2.
The crossbeams supporting the concrete deck were arrangedorthogonal to the main girders in the center region of the bridgeand in a fanned pattern near both ends of the bridge. Fig. 4presents the plan view of the bridge superstructure. Glass-fiberreinforced polymer (GFRP) panels were placed between adja-cent cross girders (without using any bonding materials) as per-manent formwork for concrete deck casting, as shown in Fig. 5.Composite action between the concrete slab and steel cross-beams was accomplished using a double row of shear stud con-nectors welded along the top flange of the transverse cross-beams. Construction of the bridges’ piled foundations started inDecember 2014, and the bridge was opened to commercial railtraffic in April 2016. The west elevation and top view of thecompleted bridge are shown in Fig. 6.
Monitoring Program and Sensor System
Using the integrated fiber optic monitoring system, strain measure-ments were taken in order to investigate the mechanical perform-ance of the bridge under normal in-service operating conditions.
(a) (b)
Fig. 1. Typical cross sections for plate girder bridges: (a) full-depthtype; and (b) half-through type.
(a) (b) (c)
Fig. 2. Typical crossbeam arrangements in skewed half-through rail-way bridges: (a) skew crossbeams; (b) hybrid square crossbeams withfanned crossbeams near supports; and (c) square crossbeams.
© ASCE 04018107-2 J. Bridge Eng.
J. Bridge Eng., 2019, 24(1): 04018107
Dow
nloa
ded
from
asc
elib
rary
.org
by
Uni
vers
ity o
f V
irgi
nia
on 1
1/13
/18.
Cop
yrig
ht A
SCE
. For
per
sona
l use
onl
y; a
ll ri
ghts
res
erve
d.

The strain variations of the instrumented main girders and cross-beams were measured under 12 live trains, as shown in Fig. 7.
Sensor System
Fiber optic strain sensors (FOS, Micron Optics, Atlanta, Georgia)based on fiber Bragg gratings (FBGs) were installed on the bridge
during its construction (see Butler et al. 2018 for further details).The FBGs used in this study were written in low bend loss fiberand contained sensor arrays with up to 20 individual FBGs spacedat 1-m intervals. They were produced with a GFRP coating inorder to provide adequate robustness and durability during instal-lation and operation. Field monitoring data was captured using afour-channel fiber-optic interrogator produced by Micron Optics
1500 TYP.
Mid-span of East Girder
Mid-span of West Girder
Concrete Deck NotShown for Clarity
Concrete Plinth and BearingDoubler Plates (Top andBottom flanges)
CB
-1
CB
-3
CB
-5
CB
-7
CB
-2
CB
-4
CB
-6
A
A
B B
Fig. 4. Bridge plan view and fiber optic sensor layout (unit: mm). TYP = typical.
RC deck
Cross beam GFRP plate formwork panel
FBG sensors
Fig. 5. Composite deck (section B–B) and permanent formwork arrangement.
CL EASTGIRDER
CLWEST
GIRDER
Fibre Optic Strain and TEMP Sensor ArraysTop & Bottom (20 FBGs Per Array)
Cross-Beam FBG Strain and TEMP SensorArrays (7 FBGs Per Array)
Transverse WebStiffeners
Fig. 3. Bridge cross-section (section A–A) and sensor locations (unit: mm). CL = centerline; FBG = fiber Bragg grating; and TEMP = temperature.
© ASCE 04018107-3 J. Bridge Eng.
J. Bridge Eng., 2019, 24(1): 04018107
Dow
nloa
ded
from
asc
elib
rary
.org
by
Uni
vers
ity o
f V
irgi
nia
on 1
1/13
/18.
Cop
yrig
ht A
SCE
. For
per
sona
l use
onl
y; a
ll ri
ghts
res
erve
d.

(Atlanta, Georgia) (sm130-700) in combination with aMicron OpticsChannel Multiplexer (sm041), which allows the system to simultane-ously interrogate a total of 16 channels (with up to 20 FBGs per chan-nel) at a sampling frequency of 250Hz. Measurements from a total of108 FBG strain and temperature sensors installed on the main girders,crossbeams, and within the concrete deck are reported as part of thisstudy. Eq. (1) was used to convert the change in wavelength meas-ured using the FBG sensors to a change in strain (D«m)
Dɛm ¼ 1kɛ
Dλλ0
� �(1)
where the optical coefficient k« = 0.78; and Dl /l 0 is the relativechange in wavelength (Kreuzer 2006). Note that FBG sensors arealso highly sensitive to temperature changes; however, it wasassumed that during the passage of a train no significant change inambient temperature was experienced. Eighty FBG strain sensors intotal (20 sensors per array) were installed along the top and bottomflanges of both main girders. A total of 28 strain FBG sensors (7sensors per array) were installed along both top and bottom flangesof two adjacent midspan crossbeams (one pin-connected and onemoment-connected) and one skewed crossbeam at the bridge end,as shown in Fig. 4. Some of the sensors installed on the main girdersandmiddle crossbeams of the bridge are shown in Fig. 8.
Train Types
The primary rail loading passing over the bridge consists of two typ-ical UK train types including the London Midland Class 350 Desiro
(Type-1) and the Cross Country Class 221 Super Voyager (Type-2).Schematic drawings of both train types, which include axle spacingand axle weights, are given in Fig. 9. These axle weights are referredto as unladen axle loads because no live load from passengers isincluded. Based on these schematics, the axle weights of train Type-2 are significantly larger than those of train Type-1. A total of 12trains and their associated strain responses were recorded during thisstudy. Train speeds were determined using the dynamic strain data(captured at 250Hz) and by considering the axle spacing and bridgelength. Video recordings of each train were also captured and usedto verify the calculated speeds. Note that the bridge carries two linesof rail traffic and, therefore, each recorded train has been designatedas either traveling along the west or east track. Train speeds variedbetween 117 km/h and 162 km/h, with an average speed of 143 km/h. Table 1 summarizes the various train numbers and their associatedtypes, direction of travel, and speed.
In the live train tests, passengers were present in trains in the in-service condition; however, the ratio of passenger live load to trainself-weight is not available because no data on the number of pas-sengers in different trains was available. According to the design in-formation, the average ratio of crush laden axle load (represents anextreme form of passenger loading or a train with serious capacitylimitations) to unladen axle load of the London Midland Class 350Desiro (train Type-1) is approximately 1.25, which is used as themaximum possible train load in real in-service condition for thistrain type. By assuming that the in-service passenger load is rela-tively small compared with the train self-weight (and the crush axleladen design axle load), the unladen axle load was used in the nu-merical analyses to compare with the measured results, whereas thecrush laden axle (design) load is used to assess the utilization of thebridge under service conditions.
Numerical Modeling
Model Building
The modeling of the bridge was carried out in three dimensionsusing the FE software TNO DIANA (version 9.4.4). Solid elements[eight nodes, 3 degrees of freedom (DOF) per node] were used tosimulate the concrete slab, and shell elements (four nodes, 5 DOFper node) were used to model the steel I-girders, crossbeams, andstiffeners, as shown in Fig. 10. Rebar elements (two nodes, with 1DOF at each node) were used for modeling the reinforcing bars inthe concrete slab. In the numerical modeling, the mesh generation(or element size) was constrained appropriately to avoid large
Fig. 7. Field measurement in live train tests. (Image by Liam J.Butler.)
Walkways Handrail
(a) (b)
Fig. 6. Completed bridge elevation and track section: (a) west elevation; and (b) top of bridge (northbound). (Images by Liam J. Butler.)
© ASCE 04018107-4 J. Bridge Eng.
J. Bridge Eng., 2019, 24(1): 04018107
Dow
nloa
ded
from
asc
elib
rary
.org
by
Uni
vers
ity o
f V
irgi
nia
on 1
1/13
/18.
Cop
yrig
ht A
SCE
. For
per
sona
l use
onl
y; a
ll ri
ghts
res
erve
d.

aspect ratios (<2.0, in this study). The mesh quality was tested toensure that no element deviated significantly from its theoreticallyideal element size. The mesh quality tests included investigatingelement angles, aspect ratios, positioning of the midside node forhigher order elements, and the extent of warping.
Because the composite section was designed as a full connectionvia a double layer of shear studs, a complete connection (perfectshear transfer) was assumed at the steel–concrete interface and wasmodeled by using eight-noded interface elements assigned withvery large stiffness. To simplify the model geometry, fully fixedend connections were assumed whenmodeling the transverse cross-beams connected to the main girder webs. Ancillary structures suchas steel access walkways, ballast, and prestressed concrete sleeperswere not modeled explicitly in the numerical simulation.Concentrated moving loads were applied to simulate the instantane-ous position of the moving axle loads of a train. In order to avoid
imposing stress concentrations on the concrete deck, the concen-trated loads were applied along rail tracks that were modeled usingbeam elements (two nodes, with 6 DOF at each node). Because theneutral axis of the total transverse section of the bridge was withinthe depth of the concrete deck, the contribution of the rail track stiff-ness to the bridge’s flexural stiffness was assumed to be negligible,which is further demonstrated and discussed in the following sec-tions. Rocker-type bearings were used on the real structure, andthus pinned and roller boundary connections were assumed whenmodeling the bridge supports. As previously mentioned, GFRP pan-els were used as permanent formwork for casting the reinforcedconcrete deck. The panels were laid between adjacent crossbeamswithout the use of any adhesive or mechanical connectors.Therefore, GFRP plates were assumed to have no significant contri-bution to the linear–elastic response of the structure and were there-fore not included in the model. A similar modelingmethod has been
Sensor locations
Sensor locations
(a) (b)
Fig. 8. Fiber optic sensors arrangement in main girders and crossbeams: (a) FBG sensors on main girder flanges; and (b) FBG sensors on crossbeamflanges. (Images by Liam J. Butler.)
11.57m11.57m11.57m11.57m
13.30m 13.30m 13.30m 13.30m
Wheel set-1 Wheel set-2 Car-1 Wheel set-1 Wheel set-2Car-2 Wheel set-1 Wheel set-2Car-3 Wheel set-1 Wheel set-2Car-4
Wheel set-1 Wheel set-2 Car-1 Wheel set-1 Wheel set-2Car-2 Wheel set-1 Wheel set-2 Car-3 Wheel set-1 Wheel set-2Car-4
(a)
(b)
Fig. 9. Axle spacing and axle loads of train Types-1 and -2: (a) train Type-1: LondonMidland Class 350 Desiro; and (b) train Type-2: Cross CountryClass 221 Super Voyager.
© ASCE 04018107-5 J. Bridge Eng.
J. Bridge Eng., 2019, 24(1): 04018107
Dow
nloa
ded
from
asc
elib
rary
.org
by
Uni
vers
ity o
f V
irgi
nia
on 1
1/13
/18.
Cop
yrig
ht A
SCE
. For
per
sona
l use
onl
y; a
ll ri
ghts
res
erve
d.

employed in several previous studies by the authors (Lin et al. 2013,2014, 2016, 2017a, b) and will be validated by comparing the nu-merical predictions with the in-service monitoring results obtainedfrom this bridge.
Material Properties
Because the purpose of this study was to investigate the structuralperformance of the under service condition, material properties ofall structural members were considered as ideally elastic. The mate-rial properties assigned to the various structural elements werebased on actual measured or specified properties used within theconstructed bridge. Material tests were performed on the deck con-crete and the average 28-day compressive strength of the concretewas 47.1MPa (equivalent cylinder strength). Materials test resultsfor the compressive strength (and elastic modulus) of the bridgedeck concrete on the day of the field monitoring were not available,and therefore the elastic modulus of concrete was estimated usingthe 28-day concrete compressive strength. Given that the concretedeck slab is located at a depth that is relatively close to the neutral
axis depth of the half-through bridge section, it was assumed thatthe elastic modulus of concrete will have little effect on the overallelastic response of the bridge under live loads. Based on the meas-ured compressive strength, a calculated elastic modulus of concreteof 35.0GPa [determined according to the Eurocode and Eq. (2),where fcm denotes the mean compressive strength of concrete inMPa] and a Poisson’s ratio of 0.2 were used in the numerical model.The structural steel was assigned to a nominal yield strength of355MPa and a nominal ultimate tensile strength of 490MPa for themain girders, crossbeams, and stiffeners. Steel reinforcing barswithin the concrete bridge deck were assigned a nominal yieldstrength of 500MPa and a nominal ultimate tensile strength of540MPa. Perfect bond with no slip between the reinforcing barsand the surrounding concrete was assumed.
Ec ¼ 22 fcm=10½ �0:3GPa (2)
Modeling of Transient Loading
According to Eurocode 1 (BS EN 1991–2:2003, Clause 6.4.4) (EU2003), for a simply supported bridge with a span shorter than 40mand with a designed train speed of less than or equal to 200 km/h, adynamic analysis is not required if its first natural bending fre-quency is within specified limits that are governed by impact crite-ria. For the bridge in this study, the span length is 26.8m, the designtrain speed is 160 km/h (<200km/h) and its first natural bendingfrequency was calculated to be well within the limits specified inEurocode 1. Therefore, a dynamic analysis was not required for thetarget bridge according to Eurocode 1. Instead, the transient axleloads were applied statically as moving concentrated loads. Inthe numerical analyses, successive moving loads considering dis-tance between axle loads were applied along the railway tracks tosimulate axle loads of the live trains traveling over the bridge. Thenumerical results (e.g., strain) were taken for each correspondingtrain location, and the timing data can be determined according tothe train’s moving distance and speed. The applied static loads were
Fig. 10. FE model details of the skewed plate girder bridge: (a) steel girder; (b) steel girder and concrete slab; (c) reinforcement; and (d) completemodel.
Table 1. Train numbering and information
Train number Type Track side Speed (km/h) Cars (n)
1 1 East 147 42 150 43 West 160 44 162 45 2 East 117 46 144 47 142 48 142 49 West 128 510 136 511 160 512 133 4
© ASCE 04018107-6 J. Bridge Eng.
J. Bridge Eng., 2019, 24(1): 04018107
Dow
nloa
ded
from
asc
elib
rary
.org
by
Uni
vers
ity o
f V
irgi
nia
on 1
1/13
/18.
Cop
yrig
ht A
SCE
. For
per
sona
l use
onl
y; a
ll ri
ghts
res
erve
d.
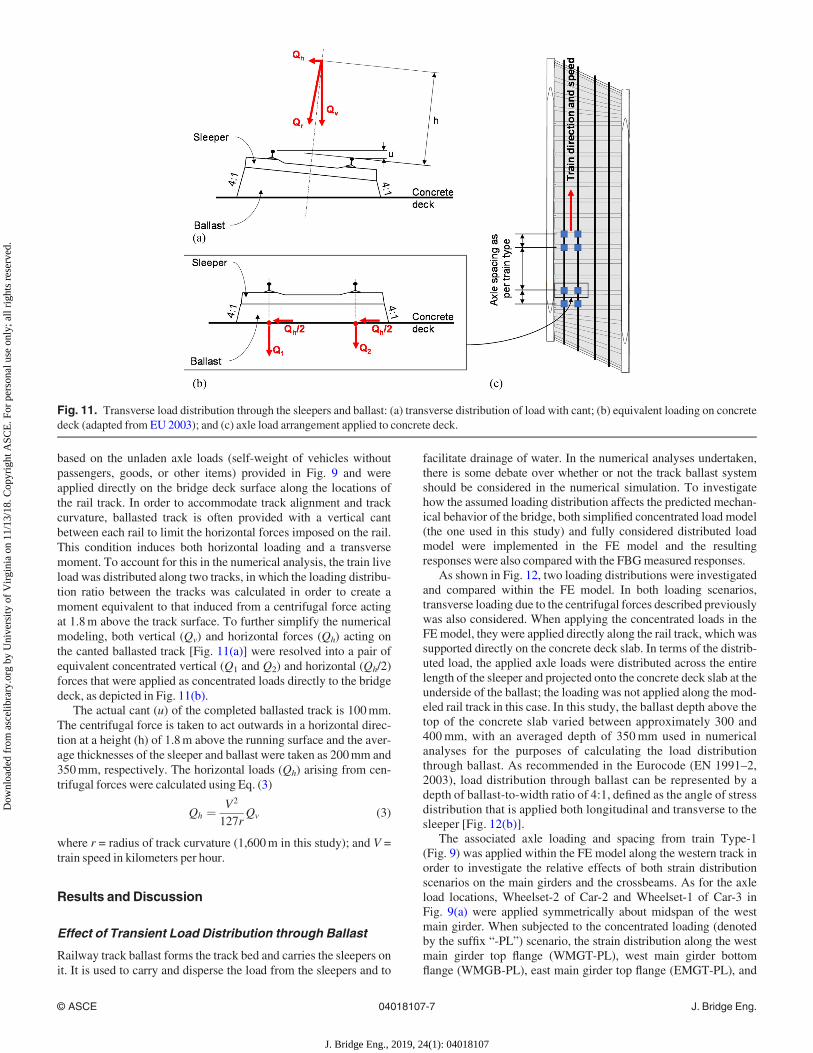
based on the unladen axle loads (self-weight of vehicles withoutpassengers, goods, or other items) provided in Fig. 9 and wereapplied directly on the bridge deck surface along the locations ofthe rail track. In order to accommodate track alignment and trackcurvature, ballasted track is often provided with a vertical cantbetween each rail to limit the horizontal forces imposed on the rail.This condition induces both horizontal loading and a transversemoment. To account for this in the numerical analysis, the train liveload was distributed along two tracks, in which the loading distribu-tion ratio between the tracks was calculated in order to create amoment equivalent to that induced from a centrifugal force actingat 1.8m above the track surface. To further simplify the numericalmodeling, both vertical (Qv) and horizontal forces (Qh) acting onthe canted ballasted track [Fig. 11(a)] were resolved into a pair ofequivalent concentrated vertical (Q1 and Q2) and horizontal (Qh/2)forces that were applied as concentrated loads directly to the bridgedeck, as depicted in Fig. 11(b).
The actual cant (u) of the completed ballasted track is 100mm.The centrifugal force is taken to act outwards in a horizontal direc-tion at a height (h) of 1.8m above the running surface and the aver-age thicknesses of the sleeper and ballast were taken as 200mm and350mm, respectively. The horizontal loads (Qh) arising from cen-trifugal forces were calculated using Eq. (3)
Qh ¼ V2
127rQv (3)
where r = radius of track curvature (1,600m in this study); and V =train speed in kilometers per hour.
Results and Discussion
Effect of Transient Load Distribution through Ballast
Railway track ballast forms the track bed and carries the sleepers onit. It is used to carry and disperse the load from the sleepers and to
facilitate drainage of water. In the numerical analyses undertaken,there is some debate over whether or not the track ballast systemshould be considered in the numerical simulation. To investigatehow the assumed loading distribution affects the predicted mechan-ical behavior of the bridge, both simplified concentrated load model(the one used in this study) and fully considered distributed loadmodel were implemented in the FE model and the resultingresponses were also compared with the FBGmeasured responses.
As shown in Fig. 12, two loading distributions were investigatedand compared within the FE model. In both loading scenarios,transverse loading due to the centrifugal forces described previouslywas also considered. When applying the concentrated loads in theFEmodel, they were applied directly along the rail track, which wassupported directly on the concrete deck slab. In terms of the distrib-uted load, the applied axle loads were distributed across the entirelength of the sleeper and projected onto the concrete deck slab at theunderside of the ballast; the loading was not applied along the mod-eled rail track in this case. In this study, the ballast depth above thetop of the concrete slab varied between approximately 300 and400mm, with an averaged depth of 350mm used in numericalanalyses for the purposes of calculating the load distributionthrough ballast. As recommended in the Eurocode (EN 1991–2,2003), load distribution through ballast can be represented by adepth of ballast-to-width ratio of 4:1, defined as the angle of stressdistribution that is applied both longitudinal and transverse to thesleeper [Fig. 12(b)].
The associated axle loading and spacing from train Type-1(Fig. 9) was applied within the FE model along the western track inorder to investigate the relative effects of both strain distributionscenarios on the main girders and the crossbeams. As for the axleload locations, Wheelset-2 of Car-2 and Wheelset-1 of Car-3 inFig. 9(a) were applied symmetrically about midspan of the westmain girder. When subjected to the concentrated loading (denotedby the suffix “-PL”) scenario, the strain distribution along the westmain girder top flange (WMGT-PL), west main girder bottomflange (WMGB-PL), east main girder top flange (EMGT-PL), and
Fig. 11. Transverse load distribution through the sleepers and ballast: (a) transverse distribution of load with cant; (b) equivalent loading on concretedeck (adapted from EU 2003); and (c) axle load arrangement applied to concrete deck.
© ASCE 04018107-7 J. Bridge Eng.
J. Bridge Eng., 2019, 24(1): 04018107
Dow
nloa
ded
from
asc
elib
rary
.org
by
Uni
vers
ity o
f V
irgi
nia
on 1
1/13
/18.
Cop
yrig
ht A
SCE
. For
per
sona
l use
onl
y; a
ll ri
ghts
res
erve
d.

east main girder bottom flange (EMGB-PL) were summarized fortrains Nos. 3 and 4 (Type-1) as shown in Fig. 13(a). Similarly, thestrain distribution on the main girders considering the distributedloading scenario was also included in Fig. 13(a) (the suffix “-DL”refers to the distributed load scenario). In addition, the strain distri-butions on the bottom flange of the middle crossbeam (midspancrossbeam with moment end connections) under both concentratedload and distributed load scenarios were compared in Fig. 13(b).The results indicate that the crossbeam strain responses predictedby both loading scenarios were very similar (i.e., within 4%). TheFE-predicted strain response for both the main girders and thecrossbeams also closely matched the FBG measured response.Therefore, it can be concluded that the simplified concentrated load-ing model can be used to evaluate the performance of both maingirders and crossbeams while having a negligible effect on the pre-dicted results. Subsequent FE results presented are based on theresponses derived based on the concentrated loading model.
Main Girder Strain Distribution, Load Sharing, and LiveLoad Utilization
As described above, 80 FBG sensors (20 FBG sensors per array)were installed along the top and bottom flanges of both main gird-ers. To investigate the strain variation of the main girders, thestrains at the midspan section of the bridge were compared with theFEM strains generated due to the applied transient loading. Forthe purpose of investigating the load distribution between the maingirders, the strain variation on top and bottom flanges (Figs. 14–17)of both main girders were reported. Due to the significantly lowertrain speed for train No. 5, the results from train No. 5 were notincluded in Fig. 16. Because of the inconsistent train speeds and dif-ferent number of train cars, the strain results from train No. 9 only isprovided as an example in Fig. 17.
The strain variation of the top and bottom flanges of the maingirders when the London Midland Class 350 Desiro trains (trainType-1) passed over the bridge is shown in Fig. 14. The longitudinalstrain increases gradually (until « approximates 20 m« ) as theWheelset-1 of Car-1 [Fig. 9(a)] crosses the midspan of the bridge.Considering the relatively short car length (20.4m) and wheelsetspacing (14.17m) compared with the bridge span length (26.84m),Wheelset-2 of Car-1 (and Wheelset-1 of Car-2) is still being sup-ported by the bridge at the time when Wheelset-1 of Car-1 passesover the bridge. This superposition of consecutive wheelset loadscauses an additional increase in strain response at the midspan priorto a decrease in strain. The peak strain increased to 32 m« when theintermediate point of Wheelset-2 of Car-1 and Wheelset-1 of Car-2
was located at approximately the midspan of the bridge. The strainthen decreased from 32 m« to 18 m« before increasing once morewhen the remaining wheelsets passed over the midspan fiber opticsensors. Similar behavior was observed in all sensors on the maingirders, indicating that the strain response of the main girdersreflects the global behavior of the bridge.
The measured time versus strain measurements were also com-pared with the FE model results. The comparison indicates that thenumerical results predict a similar loading versus time history butpredict slightly larger strain values on the top flanges (similar for alltrains recorded). Even though unladen axle loads were implementedwithin the numerical analysis, the strain response predicted by thenumerical analysis was still slightly larger compared with the FOSmeasured results. This comparison suggests that the actual bridgestiffness under service conditions is larger than that predicted by theFEmodel. This is presumably because of the neglected contributionof bridge accessories in the numerical analyses. In bridge design,the accessory structural members [e.g., the handrail and walkwayshown in Fig. 6(b)] are generally ignored, but they can contribute tothe bridge stiffness in service condition, which was similar to whathad been found in a previous study (Lin et al. 2016). Therefore, itcan be concluded that the current bridge design method for plategirder bridges is relatively conservative andwell within the requiredsafety margin in terms of the flexural strain. In terms of structuralhealth evaluation or assessment for such bridges, however, the con-tribution of bridge accessories should be taken into account if acloser prediction of behavior is to be obtained.
Another interesting observation relates to the load distributionbetween the two main girders. For twin girder bridges, the loaddistribution between the two main girders is critically importantfor both bridge serviceability (e.g., to limit deflection) and forproviding realistic estimates of remaining fatigue life that closelyrelated to in-service stress levels. The load distribution betweenthe two main girders can be determined according to the maxi-mum normal strain on the two main girders, which is summarizedin Table 2. For the sake of discussion, « lgt, « lgb, «ulgt, and «ulgb
denote strains on the top flange of the loaded main girder, bottomflange of the loaded main girder, top flange of the unloaded maingirder, and bottom flange of the unloaded main girder, respec-tively. The ratios of «ulgt:« lgt and «ulgb:« lgb represent the load dis-tribution ratio between unloaded and loaded main girders. Whentrains passed on the track near the east girder side, the averageratios of «ulgt:« lgt and «ulgb:« lgb were 0.46 and 0.57, respectively.When trains passed on the track near the west girder side, how-ever, the average ratios of «ulgt:« lgt and «ulgb:« lgb decreased to0.39 and 0.29, respectively. These results indicate that the load
Fig. 12. Axle load distribution scenarios: (a) concentrated load; and (b) area load distribution.
© ASCE 04018107-8 J. Bridge Eng.
J. Bridge Eng., 2019, 24(1): 04018107
Dow
nloa
ded
from
asc
elib
rary
.org
by
Uni
vers
ity o
f V
irgi
nia
on 1
1/13
/18.
Cop
yrig
ht A
SCE
. For
per
sona
l use
onl
y; a
ll ri
ghts
res
erve
d.

distribution factor for the west main girder is much larger thanthat of the east main girder; that is, the west main girder is consis-tently carrying a larger portion of the live loading as compared
with the east main girder. Considering the similar structural sys-tem and live train loads when trains traveled near either the eastor west main girder side, the load distribution difference is
1 2 3 4 5 6 7
-40
-30
-20
-10
0
10
20
30
40
Stra
in (m
icro
stra
in)
Time (s)
Train No.1, top, test Train No.2, top, test Train No.1, bot, test Train No.2, bot, test Top, FEM Bot, FEM
1 2 3 4 5 6 7
-40
-30
-20
-10
0
10
20
30
40
Stra
in (m
icro
stra
in)
Time (s)
Train No.1, top, test Train No.2, top, test Train No.1, bot, test Train No.2, bot, test Top, FEM Bot, FEM
(a) (b)
Fig. 14. Flexural strains at midspan of each main girder for trains passing on the east girder side (train Type-1): (a) east main girder; and (b) westmain girder. Bot = bottom.
4 8 12 16 20
-40
-20
0
20
40
60
Stra
in (m
icro
stra
in)
Distance from the girder end (m)
WMGT-PL WMGB-PL EMGT-PL EMGB-PL WMGT-DL WMGB-DL EMGT-DL EMGB-DL WMGT-TR3 WMGB-TR3 EMGT-TR3 EMGB-TR3 WMGT-TR4 WMGB-TR4 EMGT-TR4 EMGB-TR4
0 1 2 3 4 5 6 7-5
0
5
10
15
20
25
30
35
Test-PL Test-DL FEM-TR3 FEM-TR4
Stra
in (m
icro
stra
in)
Distance from the cross girder end (m)(a) (b)
Fig. 13. Normal strain distribution onmain girders and crossbeams: (a) strain distribution onmain girders; and (b) strain distribution on bottom flangeof the crossbeam. TR3 = train No. 3; and TR4 = train No. 4.
1 2 3 4 5 6 7
-40
-30
-20
-10
0
10
20
30
40
Stra
in (m
icro
stra
in)
Time (s)
Train No.3, top, test Train No.4, top, test Train No.3, bot, test Train No.4, bot, test Top, FEM Bot, FEM
1 2 3 4 5 6 7
-40
-30
-20
-10
0
10
20
30
40
Stra
in (m
icro
stra
in)
Time (s)
Train No.3, top, test Train No.4, top, test Train No.3, bot, test Train No.4, bot, test Top, FEM Bot, FEM
(a) (b)
Fig. 15. Flexural strains at midspan of each main girder for trains passing on the west girder side (train Type-1): (a) bottom flange; and (b) top flange.Bot = bottom.
© ASCE 04018107-9 J. Bridge Eng.
J. Bridge Eng., 2019, 24(1): 04018107
Dow
nloa
ded
from
asc
elib
rary
.org
by
Uni
vers
ity o
f V
irgi
nia
on 1
1/13
/18.
Cop
yrig
ht A
SCE
. For
per
sona
l use
onl
y; a
ll ri
ghts
res
erve
d.

assumed to be caused by the eccentricity and centrifugal forcesdue to the curved rail track and track cant. This difference in loaddistribution between the two main girders also highlights the im-portance of considering the effects of cant and track curvature inrailway bridge design and in-service evaluation.
The design live loading for the bridge is based on Load Model71 (LM71) specified in BS EN 1991-2 (EU 2003), as shown inFig. 18. In order to assess the percentage utilization of the maingirders due to live loading, the maximum compressive strain on thetop flange and maximum tensile strain on the bottom flange of themain girders under 12 live trains are summarized and illustrated inFig. 19. By applying LM71 in the numerical model, the maximumcompressive and tensile strains under design live load (i.e., designstrains) were determined to be –185 m« and 166 m« , respectively.Based on the monitoring data, a maximum compressive strainresponse of –55 m« was measured during the passage of train No.10, which was approximately 30% of the design strain. As dis-cussed previously, the average ratio of crush laden axle load to unla-den axle load is approximately 1.25. Multiplying the maximumrecorded strain response (i.e., –55 m« ) by 1.25 represents an upperbound estimate of the maximum strain response. Therefore, the
resulting upper bound on the live load utilization percentage ofthe main girder will be approximately 37% under crush laden axleload (train with maximum possible number of passengers).Likewise, the maximum tensile strain of 48 m« recorded for trainNo. 10 represents a live load utilization percentage of approxi-mately 29% (upper bound of 36% for crush laden axle load).Therefore, by considering the maximum recorded strains withinthe top and bottom flanges, when a single train passes over thebridge (for all trains considered in this study), the maximum(upper bound value) percentage utilization of the main girders isapproximately 37% of their intended design loading and wellwithin safe operating conditions.
Crossbeam Strain Response
As discussed previously, sensors were installed along the top andbottom flanges of two adjacent crossbeams located near the centerof the bridge span. Both of the instrumented crossbeams had differ-ent end connection details with one being a pinned (6-bolt end plate)connection and the other a moment (10-bolt stiffened extended endplate) connection [Fig. 8(b)]. This section evaluates the strain
2 3 4 5 6 7 8-60
-40
-20
0
20
40
60
Stra
in (m
icro
stra
in)
Time (s)
Train No.6, Top, test Train No.7, Top, test Train No.8, Top, test Train No.6, Bot, test Train No.7, Bot, test Train No.8, Bot, test Top, FEM Bot, FEM
2 3 4 5 6 7 8-60
-40
-20
0
20
40
60
Stra
in (m
icro
stra
in)
Time (s)
Train No.6, Top, test Train No.7, Top, test Train No.8, Top, test Train No.6, Bot, test Train No.7, Bot, test Train No.8, Bot, test Top, FEM Bot, FEM
(a) (b)
Fig. 16. Flexural strains at midspan of each main girder for trains passing on the east girder side (train Type-2): (a) east main girder; and (b) westmain girder. Bot = bottom.
1 2 3 4 5 6 7-60
-40
-20
0
20
40
60
Stra
in (m
icro
stra
in)
Time (s)
Train No.9, Top, test Train No.9, Bot, test Top, FEM Bot, FEM
1 2 3 4 5 6 7-60
-40
-20
0
20
40
60
Stra
in (m
icro
stra
in)
Time (s)
Train No.9, Top, test Train No.9, Bot, test Top, FEM Bot, FEM
(a) (b)
Fig. 17. Flexural strains at midspan of each main girder for trains passing on the west girder side (train Type-2): (a) east main girder; and (b) westmain girder. Bot = bottom.
© ASCE 04018107-10 J. Bridge Eng.
J. Bridge Eng., 2019, 24(1): 04018107
Dow
nloa
ded
from
asc
elib
rary
.org
by
Uni
vers
ity o
f V
irgi
nia
on 1
1/13
/18.
Cop
yrig
ht A
SCE
. For
per
sona
l use
onl
y; a
ll ri
ghts
res
erve
d.

response of the crossbeam with moment end connections and acomparison between both crossbeam end connection types is pro-vided in the following section. Based on the strain measurements,the neutral axis of the crossbeam (moment end connections) whenacting fully compositely with the concrete deck slab was found tobe located near the top flange of the steel crossbeam, thus the meas-ured strains at those sensors were relatively small (i.e.,< 5 m« ).Therefore, only strain variation along the bottom flange of the cross-beam has been reported herein. Due to the location of the railwaytracks relative to the FBG sensors on the crossbeam below, themax-imum strain does not occur at the midspan of the crossbeam.Instead, it occurs east of the midspan for trains passing on the easttrack and west of the midspan when trains are passing on the westtrack. Accordingly, the results for sensors located east of midspan(CB-3 in Fig. 4) and west of midspan (CB-5) were reported in orderto investigate the strain variation under trains passing over the eastand west track, respectively. The numerically derived predicted
strains at the corresponding sensor locations were also comparedwith the measured results.
The strain variation with time at CB-3 on the bottom flange ofthe middle crossbeam for when trains Nos. 1 and 2 passed over thebridge is shown in Fig. 20(a). When each wheelset passed over themiddle crossbeam, the strain at CB-3 increased as a wheelsetapproached and decreased as a wheelset moved away from themeasured section. Unlike the observed strain response of the maingirders, the distinct peaks corresponding to individual wheelset (orbogies) can be identified within the crossbeam strain response.
The numerically derived predictions are also provided in Fig. 20(a).The speeds of the two trains were 147 km/h and 150 km/h, respec-tively, and an average speed of 148 km/h was assumed in movingload analysis in the FE model. The comparison in Fig. 20(a) showsthat, except for some peak strain points, the numerical results agreewell with the actual measurements in both magnitude and fre-quency of the strain response. Similar results were also confirmedfor other trains as shown in Fig. 20(b) and Fig. 21. Based on theFE-predicted strains and confirmed by the measurement results,the axle loads are more globally distributed along the longitudinalmain girders, whereas the crossbeams experience a more localizedstrain response. Although beyond the scope of the current study,the sensing system was able to capture this localized strainresponse with a high level of detail, which could be used as a moni-toring tool for characterizing the fatigue characteristics of thecrossbeams and their end connections.
Effect of Connection Conditions at Crossbeam Ends
As described previously, the crossbeams on the bridge are con-nected to the webs of the main girders with alternating pinned(6-bolt end plate) and moment (10-bolt stiffened extended endplate) connections. Although pinned and moment connections wereassumed for each respectively in the design as shown in Fig. 22,their actual performance in real service is still unknown. The meas-ured responses of both pinned and moment crossbeams were eval-uated and compared under passing trains in order to investigate the
Table 2.Maximum strains on main girders
Strain
Train direction
Train near east main girder side Train near west main girder side
Train Number
1 2 5 6 7 8 3 4 9 10 11 12
« lgt (m« ) −39 −41 −42 −42 −39 −41 −43 −43 −53 −55 −54 −50« lgb (m« ) 28 32 35 33 32 32 40 40 46 48 47 47«ulgt (m« ) −18 −18 −17 −20 −19 −19 −19 −17 −20 −19 −19 −21«ulgb (m« ) 17 19 18 18 19 19 11 12 13 15 13 14«ulgt:« lgt 0.46 0.42 0.41 0.48 0.49 0.45 0.44 0.38 0.38 0.35 0.35 0.41«ulgb:« lgb 0.59 0.59 0.53 0.55 0.58 0.59 0.28 0.30 0.29 0.30 0.28 0.30
0.8m 1.6m 1.6m 1.6m 0.8m
qvk=80kN/m qvk=80kN/m 250kN 250kN250kNQvk=250kN
Fig. 18. Design LoadModel 71 (LM71) and characteristic values for vertical loads.
1 2 3 4 5 6 7 8 9 10 11 12-200
-150
-100
-50
0
50
100
150
200
-55µ
48µ
166µ
Stra
in (m
icro
stra
in)
Live train No
Top flange-service load Bottom flange-service load Top flange-design load Bottom flange-design load
-185µ
Fig. 19. Live load utilization assessment summary for the maingirders.
© ASCE 04018107-11 J. Bridge Eng.
J. Bridge Eng., 2019, 24(1): 04018107
Dow
nloa
ded
from
asc
elib
rary
.org
by
Uni
vers
ity o
f V
irgi
nia
on 1
1/13
/18.
Cop
yrig
ht A
SCE
. For
per
sona
l use
onl
y; a
ll ri
ghts
res
erve
d.

effects of end connection details on the dynamic strain distributionalong the crossbeams.
During monitoring, strain on both pinned and moment-connected crossbeams was measured only for trains Nos. 1 and 3(train Type-1). When train No. 1 passed on the east track, themaximum strain occurred at FBG CB-3. The strain variation atFBG CB-3 at the adjacent pinned and moment connections in themidspan is illustrated in Fig. 23(a). Similar strain variations (bothin magnitude and distribution) were observed in both crossbeamswith pinned and moment connections. Similar results were alsoconfirmed in the measured strains under train No. 3, as indicatedin Fig. 23(b). By also considering the results shown in Figs. 19and 20, it can be concluded that the crossbeam with pinned endconnections behaved similarly to the crossbeam with moment endconnections. This may be the result of the compositely connectedconcrete slab, which acts to redistribute the live loading betweenadjacent crossbeams. From the design details shown in Fig. 22and results shown in Fig. 23, it may be inferred that the boltedconnection of the pinned crossbeams may be considered to besemirigid and to provide a certain amount of fixity and momentresistance. By also considering the comparisons in Figs. 20 and21, it may be concluded that modeling pinned connections asmoment (fully-fixed) connections had no significant effect on the
FE results. Providing more accurate estimates through experi-mental testing, FE modeling, and in situ sensing of the real con-nection ratio (i.e., joint fixity) at the transverse girder end connec-tions is an area requiring further investigation and research.
0 1 2 3 4 5 6 70
10
20
30
40
50
60
Stra
in (m
icro
stra
in)
Time (s)
FEM Train No.1 Train No.2
0 1 2 3 4 5 6 70
10
20
30
40
50
60Fl
exur
al s
train
(mic
rost
rain
)
Time (s)
FEM Train No.3 Train No.4
(a) (b)
Fig. 20. Midspan flexural strain of the moment-connected crossbeam (train Type-1): (a) train passing near east main girder side (CB-3); and (b) trainpassing near west main girder side (CB-5).
0 1 2 3 4 5 6 70
10
20
30
40
50
60
Flex
ural
stra
in (m
icro
stra
in)
Time (s)
FEM Train No.6 Train No.7 Train No.8
0 1 2 3 4 5 6 70
10
20
30
40
50
60
Flex
ural
stra
in (m
icro
stra
in)
Time (s)
FEM Train No.9
(a) (b)
Fig. 21. Midspan flexural strain of the moment-connected crossbeam (train Type-2): (a) train passing near east main girder side (CB-3); and (b) trainpassing near west main girder side (CB-5).
Stiffener
Exterior stiffener
Moment (fixed) connection assumed
Pinned connection assumed
Main girderflange
Main girder web
Fig. 22. Crossbeams with pinned andmoment end connections.
© ASCE 04018107-12 J. Bridge Eng.
J. Bridge Eng., 2019, 24(1): 04018107
Dow
nloa
ded
from
asc
elib
rary
.org
by
Uni
vers
ity o
f V
irgi
nia
on 1
1/13
/18.
Cop
yrig
ht A
SCE
. For
per
sona
l use
onl
y; a
ll ri
ghts
res
erve
d.

Conclusions
A structural monitoring system consisting of a network of 108 FBGfiber optic sensors was designed and installed to investigate the per-formance of a newly constructed skewed half-through railwaybridge during its first several months in service. Detailed strain var-iations on both the main girders and crossbeams were recordedfrom field measurements during the passage of 12 passenger trains.A 3D FE model was then constructed to simulate the response ofthe bridge under representative live loading as specified accordingto Eurocode 1. Based on the presented results, the following conclu-sions were drawn:• The effect of transient load distribution through ballasted
track was investigated for the purposes of simplifying the FEmodel. Concentrated and distributed (area) load distributionscenarios were implemented within the FE model and theircorresponding effect on the strain response of the main gird-ers and crossbeams were compared. It was found that bothload distribution models resulted in very similar predictedresponses and the simplified concentrated loading couldtherefore be used for predicting the structural behavior of therailway bridge.
• Both the strain response of and load sharing between the twomain girders were evaluated using the FBG measured strainsrecorded for all 12 monitored train passage events. Based onthe calculated relative strain percentages of each girder, signif-icant differences in load sharing between the two main girderswere confirmed. This is believed to be the result of the com-plex load distribution path through the ballasted track and theadditional lateral loading arising from centrifugal forcescaused by track curvature and cant.
• The strain variations along the main girders were comparedwith the numerical prediction results. The comparison sug-gests that that secondary bridge accessories such as accesswalkways and handrails may contribute significantly to the in-service bridge stiffness. The live load utilization percentage ofthe main girders in service was also evaluated, and the resultsindicate that the bridge structural capacity is currently only37% utilized and the bridge is operating well within the in-service safety limits.
• A 3D FE model was built to investigate the behavior of theskewed half-through plate girder bridge. The FE-predictedstrain variations along both the main girders and crossbeamsdue to live trains agreed well with the actual measured results,demonstrating the validity of the proposed FE model.
• The FOS strain measurements provided a sufficient level of re-solution to be able to confirm the differences in FE-predictedstrain distribution between the crossbeams and main girders.They confirmed that the axle loads were more globally distrib-uted along the main girders compared with the more localizedstrain response experienced by the crossbeams. As part offuture work, it is hypothesized that the installed monitoringsystem can be used as a fatigue assessment tool.
• The measured strain response along two transverse cross-beams, each with different end connection details, located nearthe midspan of the bridge, were compared with the FE-predicted results. The crossbeam with moment end connec-tions experienced a very similar strain response to the cross-beam with pinned end connections. This behavior may stemfrom the compositely connected reinforced concrete bridgedeck slab, which may help to redistribute much of the verticalloading carried by the crossbeams.Overall, the installed FOS network proved to be robust and capa-
ble of capturing the in-service strain response of the primary struc-tural bridge elements in great detail. The results obtained in thisstudy can be used to not only gain a better understanding of the in-service performance but also for improving both the design andstructural evaluation methods of such bridges.
Acknowledgments
The authors gratefully acknowledge the Engineering and PhysicalSciences Research Council (EPSRC) and Innovate UK for fundingthis research through the Centre for Smart Infrastructure (CSIC)Innovation and Knowledge Centre (EPSRC Grant EP/L010917/1).The authors also acknowledge the on-site assistance of JasonShardelow of CSIC; James Oliver, Matthew Timmis, BradStanaway, and Phil Holland of Laing O’Rourke; Ruth Platt andMike Henwood of Atkins; and Robert Dean of Network Rail forproviding their invaluable support for this project. Data related tothis publication is available at the University of Cambridge datarepository.
References
BSI. 2000.Design of steel bridges. BS 5400: Part 3. London: BSI.Butler, L. J., N. Gibbons, C. R. Middleton, and M. Z. E. B. Elshafie. 2016.
“Integrated fibre-optic sensor networks as tools for monitoring strain de-velopment in bridges during construction.” In Proc., 19th Congress of
0.0 0.5 1.0 1.5 2.0 2.5 3.0
0
10
20
30
40
50
Stra
in (m
icro
stra
in)
Time (s)
Fixed CB Pinned CB
0.0 0.5 1.0 1.5 2.0 2.5 3.0
0
10
20
30
40
50
Stra
in (m
icro
stra
in)
Time (s)
Fixed CB Pinned CB
(a) (b)
Fig. 23. Strain variation on bottom flange of crossbeams: (a) train No. 1; and (b) train No. 3.
© ASCE 04018107-13 J. Bridge Eng.
J. Bridge Eng., 2019, 24(1): 04018107
Dow
nloa
ded
from
asc
elib
rary
.org
by
Uni
vers
ity o
f V
irgi
nia
on 1
1/13
/18.
Cop
yrig
ht A
SCE
. For
per
sona
l use
onl
y; a
ll ri
ghts
res
erve
d.

IABSE: Challenges in Design and Construction of an Innovative andSustainable Built Environment, edited by L. Elfgren, J. Jonsson, M.Karlsson, L. Rydberg-Forssbeck, and B. Sigfid, 1762–1770. Zurich,Switzerland: Int. Assoc. of Bridge and Structural Engineering.
Butler, L. J., W. Lin, J. Xu, N. Gibbons, M. Z. E. B. Elshafie, and C. R.Middleton. 2018. “Monitoring, modelling and assessment of a self-sensing railway bridge during construction.” J. Bridge Eng. 23 (10):04018076. https://doi.org/10.1061/(ASCE)BE.1943-5592.0001288.
EU. 2003. Eurocode 1: Actions on structures—Part 2: Traffic loads onbridges. BS EN 1991-2. Brussels, Belgium: EU.
Hendy, C. R., and R. P. Jones. 2009.“ Lateral buckling of steel plate gird-ers for bridges with flexible lateral restraints or torsional restraints.”In Vol. 162 of Proc., Institution of Civil Engineers—BridgeEngineering, edited by B. Mawson, 25–33. London: Institution ofCivil Engineers.
Kaliyaperumal, G., B. Imam, and T. Righiniotis. 2011. “Advanced dynamicfinite element analysis of a skew steel railway bridge.” Eng. Struct. 33(1): 181–190. https://doi.org/10.1016/j.engstruct.2010.10.003.
Knight, R. P. 1984. “Economical Steel Plate Girder Bridges.” Eng. J. Am.Inst. Steel Constr. 21: 89–93.
Kong, X., S. C. M. Ho, G. Song, and C. S. Cai. 2017. “Scour monitoringsystem using fiber Bragg grating sensors and water-swellable poly-mers.” J. Bridge Eng. 22 (7): 04017029. https://doi.org/10.1061/(ASCE)BE.1943-5592.0001062.
Kopare, S. D., and K. S. Upase. 2015. “Analysis of plate girder bridge forClass-AA loadings (tracked vehicles).” Int. J. Emerging Trends in Sci.Technol. 2 (6): 2645–2655.
Kreuzer, M. 2006. Strain measurement with fibre Bragg grating sensors.Darmstadt, Germany: HBMGmbH.
Lin, W., N. Taniguchi, and T. Yoda. 2017a. “A preventive strengtheningmethod for steel columns: Experimental study and numerical analyses.”J. Constr. Steel Res. 138 (Nov): 357–368. https://doi.org/10.1016/j.jcsr.2017.07.019.
Lin, W., N. Taniguchi, T. Yoda, M. Hansaka, S. Satake, and Y. Sugino.2017b. “Renovation of existing steel railway bridges: Field test and nu-merical simulation.” Adv. Struct. Eng. 21 (6): 809–823. https://doi.org/10.1177/1369433217732498.
Lin, W., T. Yoda, and N. Taniguchi. 2016. “Effects of bridge accessories insteel–concrete composite railway bridges in service condition.” J.Bridge Eng. 21 (2): 04015050. https://doi.org/10.1061/(ASCE)BE.1943-5592.0000809.
Lin, W., T. Yoda, N. Taniguchi, and M. Hansaka. 2013. “Performance ofstrengthened hybrid structures renovated from old railway steelbridges.” J. Constr. Steel Res. 85 (Jun): 130–139. https://doi.org/10.1016/j.jcsr.2013.03.002.
Lin, W., T. Yoda, N. Taniguchi, S. Satake, and H. Kasano. 2014.“Preventive maintenance on welded connection joints in aged steel rail-way bridges.” J. Constr. Steel Res. 92 (Jan): 46–54. https://doi.org/10.1016/j.jcsr.2013.10.012.
Quadrato, C., W. Wang, A. Battistini, A. Wahr, T. Helwig, K. Frank, andM. Engelhardt. 2010. Cross-frame connection details for skewed steelbridges. Rep. No. FHWA/TX-11/0-5701-1. Prepared for Texas Dept. ofTransportation. Austin, TX: Univ. of Texas at Austin, Center forTransportation Research.
Regier, R., and N. A. Hoult. 2014. “Distributed strain behavior of a rein-forced concrete bridge: Case study.” J. Bridge Eng. 19 (12): 05014007.https://doi.org/10.1061/(ASCE)BE.1943-5592.0000637.
Sakurai, N., T. Noro, H. Watanabe, S. Tachibana, and N. Mizoguchi.2002. “An analytical study on two-plate-girders skew bridges.” InSpecial issue on basic endeavor toward the circulative economicsociety. Nippon Steel Technical Rep. No. 86. 94–98. Tokyo: NipponSteel.
Scarella, A., G. Salamone, S. K. Babanajad, A. De Stefano, and F. Ansari.2017. “Dynamic brillouin scattering–based condition assessment ofcables in cable-stayed bridges.” J. Bridge Eng. 22 (3): 04016130.https://doi.org/10.1061/(ASCE)BE.1943-5592.0001010.
Webb, G. T., P. J. Vardanega, N. A. Hoult, R. A. Fidler, P. J. Bennett, andC. R. Middleton. 2017. “Analysis of fiber-optic strain-monitoring datafrom a prestressed concrete bridge.” J. Bridge Eng. 22 (5): 05017002.https://doi.org/10.1061/(ASCE)BE.1943-5592.0000996.
Wijesinghe, B. H. M. P., S. A. Zacharie, K. D. Mish, and J. D. Baldwin.2013. “Design and development of in situ fatigue sensors for structuralhealth monitoring of highway bridges.” J. Bridge Eng. 18 (4): 297–307.https://doi.org/10.1061/(ASCE)BE.1943-5592.0000361.
Zarafshan, A., A. Iranmanesh, and F. Ansari. 2012. “Vibration-basedmethod and sensor for monitoring of bridge scour.” J. Bridge Eng.17 (6): 829–838. https://doi.org/10.1061/(ASCE)BE.1943-5592.0000362.
Zhou, J., C. Bennett, A. Matamoros, J. Li, and S. Rolfe. 2016. Skewed SteelBridges: Effect of Cross-Frame Layout on Lateral Flange BendingStresses. Rep. No. K-TRAN: KU-13-3. Topeka, KS: Kansas Dept. ofTransportation.
© ASCE 04018107-14 J. Bridge Eng.
J. Bridge Eng., 2019, 24(1): 04018107
Dow
nloa
ded
from
asc
elib
rary
.org
by
Uni
vers
ity o
f V
irgi
nia
on 1
1/13
/18.
Cop
yrig
ht A
SCE
. For
per
sona
l use
onl
y; a
ll ri
ghts
res
erve
d.