Method MD-99 Polar Volatile Organic Compounds in Pulp ...
30
NCASI METHOD MD-99 POLAR VOLATILE ORGANIC COMPOUNDS IN PULP INDUSTRY WASTEWATERS BY MICRODISTILLATION AND GC-FID NCASI West Coast Regional Center Organic Analytical Program July 1999
-
Upload
khangminh22 -
Category
Documents
-
view
2 -
download
0
Transcript of Method MD-99 Polar Volatile Organic Compounds in Pulp ...
NCASI METHOD MD-99
POLAR VOLATILE ORGANIC COMPOUNDS IN PULP INDUSTRYWASTEWATERS BY MICRODISTILLATION AND GC-FID
NCASIWest Coast Regional CenterOrganic Analytical Program
July 1999


Acknowledgments
This method is authored by Alex Gholson, Senior Research Scientist, and Dean Hoy,Research Associate, with assistance from Diana Cook, Senior Research Scientist, all ofNCASI West Coast Regional Center. Mark Bruce of Wadsworth Alert Labs (now Quanterra)developed the microdistillation technique and also provided valuable input duringdevelopment of this method.
For more information about this method, contact:
Alex Gholson, Ph.D.Senior Research ScientistNCASI West Coast Regional CenterP.O. Box 458Corvallis, OR 97339(541) [email protected]
John Pinkerton, Ph.D.Vice President, Air QualityNCASIP.O. Box 13318Research Triangle Park, NC 27709(919) [email protected]
For information about NCASI publications, contact:
Publications CoordinatorNCASIPO Box 13318Research Triangle Park, NC 27709(919) [email protected]
National Council for Air and Stream Improvement, Inc. (NCASI). 2000. Methods Manual -Polar volatile organic compounds in pulp industry wastewaters by microdistillation andGC-FID. Research Triangle Park, NC: National Council for Air and Stream Improvement,Inc.
2000 by the National Council for Air and Stream Improvement, Inc.

Disclaimer:
The mention of trade names or commercial products does not constitute endorsement orrecommendation for use. The microdistillation step has been included in the Third Update ofSW-846 as Method 5031.
This method is included in the NCASI Methods Manual as a PROPOSED method. Thepurpose of including proposed methods in the NCASI Methods Manual is to make it knownthat a method is under development and to solicit comment regarding the technical merit andapplicability of the method. This method should not be construed as having been rigorouslyvalidated on any matrix; therefore, those electing to apply the method are stronglyencouraged to conduct rigorous QA/QC or validation such that the quality of the datagenerated can be evaluated. Please note that PROPOSED methods are not suitable for use asregulatory monitoring or compliance methods.

1 July 1999
NCASI METHOD MD-99
POLAR VOLATILE ORGANIC COMPOUNDS IN PULP INDUSTRYWASTEWATERS BY MICRODISTILLATION AND GC-FID
1.0 Scope and Application
1.1 This method describes a procedure for separating nonpurgable, water-soluble, andvolatile organic compounds from pulp mill treatment plant influent and effluentwastewaters using azeotropic distillation. The azeotropic microdistillation techniquewas first described by Bruce, Lee, and Stephens (1) and has been included asMethod 5031 in the Third Update of SW-846. This method optimizes themicrodistillation technique for pulp mill matrices and integrates it into a completeanalytical method. Prepared samples are analyzed by gas chromatography (GC) withflame ionization detection (FID). The method has been evaluated and found to worksuccessfully for the compounds listed in Table 1.
1.2 The estimated method detection limits (MDL) determined for an effluent sample andthe calibration range of the method are also listed in Table 1. The MDLs for a samplemay differ from those listed, depending on the nature of interferences in the samplematrix. The method has been single-laboratory validated for waste treatmentinfluents and effluents from kraft and sulfite mills with and without bleach plants.
1.3 Additional compounds may be separated successfully using this method, and themethod may be applicable to other matrices in a pulp mill. However, this methodmay be used to detect and measure additional analytes and for different matrices onlyafter establishing acceptable accuracy and precision data for each additional analyte ormatrix.
2.0 Summary of Method
2.1 Water-soluble nonpurgable organic compounds are selectively removed from acomplex aqueous matrix by azeotropic distillation. A 40-mL sample is distilled andcompounds which either distill at lower boiling points than water (e.g., methanol) orthat form azeotropes with water are concentrated into the first 300 µL of condensatecollected. Most of the semi- and non-volatile compounds which could causeinterferences remain in the boiling flask. As the distillate condenses, most water-soluble organics remain in the condensate while the hydrophobic volatile organicsescape into the atmosphere. Concentration factors for the target compounds havebeen found to range from 70 to 230.
2.2 An internal standard is spiked before distillation to correct fordistillation/condensation variables as well as for instrument drift. A recovery spike isadded to the condensate before analysis to determine the recovery of the internalstandard. The concentrated condensate is analyzed by direct aqueous injection GC-FID. Because the FID analysis is nonspecific, confirmation that no native compounds

NCASI Method MD-99—Polar VOCs in Pulp Industry Wastewaters by Distillation and GC-FID
2 July 1999
interfere with the internal standard or the recovery standard is required for each newsample matrix encountered. Column resolution is critical to ensure separation of thetarget analytes and a daily resolution check is required.
2.3 If analyte concentrations are high (>1000 µg/L) and the matrix is clean (no salts orcorrosives), the distillation step may be omitted and samples can be analyzed by directaqueous injection. Calibration and validation of accuracy and precision will berequired if the distillation step is omitted. To improve the selectivity of the method,GC/mass spectrometry (MS) can be used with a loss in sensitivity and precision dueto the disruptive effects water has on the MS. Independent validation is required ifGC/MS is used.
3.0 Definitions
The definitions and purposes below are specific to this method, but have beenconformed to common usage as much as possible.
3.1 Units of weight and measure
3.1.1 Lliter
3.1.2 mgmilligram
3.1.3 mLmilliliter
3.1.4 µgmicrogram
3.1.5 µLmicroliter
3.2 Definition of terms, acronyms, and abbreviations
3.2.1 AzeotropeLiquid mixture of two or more substances which behaves like asingle substance, in that it boils at a constant temperature and the vaporsreleased have a constant composition
3.2.2 Internal standardCompound not present in a sample spiked at a knownamount into the sample before distillation and used to calculate theconcentration of the target analytes
3.2.3 MayThis action, activity, or procedural step is neither required norprohibited.
3.2.4 Must notThis action, activity, or procedural step is prohibited.
3.2.5 MustThis action, activity, or procedural step is required.
NCASI Method MD-99—Polar VOCs in Pulp Industry Wastewaters by Microdistillation and GC-FID
3 July 1999
3.2.6 Recovery standardCompound not present in a sample spiked at a knownamount after the condensate is collected and used to determine the internalstandard recovery
3.2.7 ShouldThis action, activity, or procedural step is suggested but not required.
4.0 Interferences
4.1 Method interferences
Contaminants in solvent, reagents, glassware, and other sample processing hardwarecan lead to discrete artifacts and/or elevated baselines in the chromatograms. All ofthe following materials must be demonstrated to be free from interferences under theconditions of the analysis by running laboratory method blanks daily.
4.1.1 Glassware must be cleaned as soon as possible after use by rinsing severaltimes with hot tap water followed by several rinses with volatile organic-freewater. Prior to use, glassware should be drained and heated in a circulatinglaboratory oven above 110°C until completely dry.
4.1.2 All glassware must be kept and stored away from areas where volatile solventssuch as acetone and methanol are being used. Ovens used to dry glasswareshould not contain glassware that has been rinsed with these solvents.
4.1.3 Volatile organic-free water can be obtained by distilling deionized water untilthe first 15 to 20% of the water has been removed. Store the remainingportion in an organic-free environment (e.g., under an N2 atmosphere).
4.1.4 After distillation of a sample containing high concentrations of volatileorganic compounds, one or more blanks should be analyzed to check for crosscontamination.
4.2 Matrix interferences
Contaminants in the sample can interfere with the analysis by coeluting with aninternal standard, recovery standard, or analyte. Sample contaminants can alsointerfere with the distillation step, chromatographic separation, or the FIDdetermination. The extent of matrix interferences will vary considerably from sourceto source, depending upon the nature and diversity of the matrix being sampled.
4.2.1 Internal standard interference in influent samples have been observed from theresults of the method evaluation. Multiple internal standards have been usedto correct this problem.
4.2.2 To ensure that an internal standard interference is not present in the samplematrix, a trial microdistillation should be performed without addition ofinternal standard or recovery standard whenever a sample of unknown

NCASI Method MD-99—Polar VOCs in Pulp Industry Wastewaters by Distillation and GC-FID
4 July 1999
composition is first encountered. Any signal identified as the internal standardor recovery standard would suggest an interference exists and an alternateinternal standard should be used. Recovery of greater than 100% for theinternal standard during a routine analysis is a good indicator that a matrixcompound is interfering.
5.0 Safety
5.1 Good laboratory safety practices should ensure safe operation of this method.Adequate eye protection, a lab coat, and gloves should be worn at all times and aportable exhaust vent should be used if the apparatus is used outside of a fume hood.
5.2 Acrylonitrile has an IARC 2A classification (probable carcinogen) and is an OSHAselect carcinogen. Special precautions will be required to handle this compound.
5.3 This method does not address all safety issues associated with its use. The laboratoryis responsible for maintaining a safe work environment and a current awareness file ofOSHA regulations regarding the safe handling of the chemicals specified in thismethod. A reference file of material safety data sheets (MSDSs) should be availableto all personnel involved in these analyses.
6.0 Equipment and Supplies
Note: Brand names, suppliers, and part numbers are cited for illustrative purposesonly. No endorsement is implied. Equivalent performance may be achieved usingequipment and materials other than those specified here, but demonstration ofequivalent performance that meets the requirements of this method is theresponsibility of the laboratory.
6.1 Sampling equipment
Glass storage containers of at least 40 mL volume with Teflon-coated silicone linedscrew caps are required.
6.2 Microdistillation system equipment
6.2.1 Wadsworth VOC3 System, Shamrock Glass (302-629-5500), or equivalent(Figure 1)
6.2.1.1 Round-bottom flask, 100-mL, 14/20 ground glass joint
6.2.1.2 Fractionation column, 14/20 ground glass joint, 1.6-cm OD, 1.3-cmID, 60-cm length
6.2.1.3 Glass reducing union, 14/20 ground glass joint to 6-mm OD tubing

NCASI Method MD-99—Polar VOCs in Pulp Industry Wastewaters by Microdistillation and GC-FID
5 July 1999
6.2.2 Column packing, spherical glass beads, 5-mm diameter
6.2.3 Pipe insulation, polyurethane foam, 4-cm OD, 1.5-cm ID, 55-cm length
6.2.4 Keck clamps for 14/20 joints
6.2.5 Stainless steel reducing union, 1/4 in. to 1/16 in. with PTFF ferrules
6.2.6 Air condenser, 40 cm 1/16 in. OD PTFE tubing
6.2.7 Heating mantle, 100-mL round-bottom flask, 230 watts
6.2.8 Heating mantle temperature controller
6.2.9 Porous boiling stones (not Teflon chips)
6.2.10 Autosampler vials, 2-mL, with Teflon-lined caps
6.3 Analytical equipment
6.3.1 Gas chromatographMust have a splitless injection port for capillary column,sub-ambient temperature program capabilities, and a FID
6.3.2 GC column30- x 0.53-mm ID with 1.0-µm film of bonded Carbowax(J&W DB-Wax or equivalent)
6.3.3 Data system to record chromatogram, retention times, and measure areas ofpeaks
6.4 Other equipment
6.4.1 Oven large enough to dry the fractionation column (60 cm)
6.4.2 Analytical balance capable of weighing ±0.0001 g
7.0 Reagents and Standards
7.1 Volatile organic-free water
Water should be deionized or distilled and purged with nitrogen until free frominterfering compounds. If blank problems persist, distill off 15 to 20% and keep whatremains. Store the water under a nitrogen purge until ready to use.
7.2 Standards
7.2.1 Internal standard—Weigh (to nearest 0.1 mg) 50 mg of 2,2,2-trifluoroethanoland dilute to volume in a 25-mL volumetric flask with volatile organic-freewater. Transfer the solution into a bottle with a Teflon-lined screw cap, and

NCASI Method MD-99—Polar VOCs in Pulp Industry Wastewaters by Distillation and GC-FID
6 July 1999
store under refrigeration in an atmosphere free of solvent vapors. 2-Chloroacetonitrile can be prepared in the same manner for use as analternative internal standard or recovery standard
7.2.2 Recovery standard—Weigh (to nearest 0.1 mg) 50 mg of 2,2,2-trichloroethanol and dilute to volume in a 25-mL volumetric flask withvolatile organic-free water. Transfer solution into a bottle with a Teflon-linedscrew cap and store under refrigeration in an atmosphere free of solventvapors.
7.2.3 Primary standard stock solutions—Prepare individual primary stock solutionsof the compounds listed in Table 1 by weighing (to the nearest 0.1 mg) 250mg of each compound, except 4-methyl-2-propanone (MIBK) andacetophenone, into a 10-mL volumetric flask and dilute to volume withvolatile organic-free water. MIBK is prepared by weighing 125 mg into 10mL and acetophenone is prepared by weighing 50 mg into 10 mL. Lowerconcentrations are required for MIBK and acetophenone because of thesolubility limitations. The primary stocks are transferred into bottles withTeflon-lined caps and stored in a refrigerator free of solvent vapors. Theprimary standards have been found to be stable for up to six months.
Note: Acetaldehyde is a gas at room temperature (boiling point 21°C) and allglassware that comes in contact with the neat standard needs to be chilled to4°C (prior to use).
7.2.4 Working standard solutionsUsing a 1-mL syringe add 0.8 mL of MIBKprimary solution, 2.0 mL of acetophenone and methanol primary solutions,and 0.4 mL of the remaining primary solutions to a 100-mL volumetric flaskand dilute with organic free water. Transfer the working solution into bottleswith Teflon-lined screw caps and store in a refrigerator free of solvent vapors.The working standards have been found to be stable for up to six months ifkept isolated from potential contaminating solvents.
7.3 pH adjustment solutions
7.3.1 Sulfuric acidConcentrated sulfuric acid (H2SO4, 95 to 98% ACS reagentgrade) diluted 1:1 with volatile organic-free water by carefully adding the acidto the water.
7.3.2 Sodium hydroxideFive grams of sodium hydroxide (NaOH, 97+% ACSreagent grade) was dissolved into 100 mL of volatile organic-free water.
7.3.3 Potassium hydrogentartrate (KO2CCH(OH)CH(OH)CO2H, 99%) baked in anoven at 110°C to remove residual ethanol.

NCASI Method MD-99—Polar VOCs in Pulp Industry Wastewaters by Microdistillation and GC-FID
7 July 1999
8.0 Sample Collection, Preservation, and Storage
8.1 Sample collection
All equipment which comes in contact with the sample should be constructed ofglass, Teflon, or stainless steel. Grab samples must be collected in glass containershaving a Teflon-lined silicone-septum-lined screw cap. Composite samples should berefrigerated during the sampling process. Samples should be collected with aminimum of headspace present, but do not have to be headspace-free.
8.2 Sample preservation
Biologically active samples should be preserved by one of the following methods.
8.2.1 Adjust to pH 2 using 1:1 sulfuric acid immediately after sample collection.
8.2.2 Add potassium hydrogentartrate at a rate of 6 g/L to the sample container priorto sample collection.
8.3 Sample storage
Store the sample in the dark at 4°C for up to 24 days. Distillates should be analyzedwithin 14 days. Samples and distillates should be stored in areas free of volatileorganic solvents.
9.0 Quality Control
9.1 Quality assurance program
Each laboratory that uses this method should operate a formal quality assuranceprogram. The minimum requirements of this program consist of an initialdemonstration of laboratory capability, and ongoing analyses of standards and blanksas a test of continued performance. Laboratory performance is compared toestablished performance criteria to determine if the results of analyses meet theperformance characteristics of the method.
9.2 Background checks
9.2.1 Method blankA method blank analysis must be performed after the dailycalibration check is performed and should be performed after a high-levelsample (>1000 µg/L) has been distilled and before low-level samples will beanalyzed. A method blank consists of distilling a 40-mL aliquot of the volatileorganic-free water with the internal and recovery standards added. The levelof each compound in the method blank should be below the method detectionlimit (MDL), and must be five times lower than the concentration found in asample before the concentration can be reported without a flag. If high blanklevels are encountered, clean the glassware and recheck the blank, check the

NCASI Method MD-99—Polar VOCs in Pulp Industry Wastewaters by Distillation and GC-FID
8 July 1999
source of volatile organic-free water for contamination, and replace ifnecessary. Check the standards to determine if they have becomecontaminated and prepare fresh solutions if necessary.
9.2.2 Field blankA field blank should be performed with each set of samplescollected. A field blank is a sample of volatile organic-free water that is sentwith the sample container to the site, transferred in the field to a samplecontainer, transported back to the laboratory, stored, and analyzed with theother samples from the set. The level of each compound in the field blankshould be below the MDL and must be five times lower than the concentrationfound in a sample before the concentration can be reported without a flag.
9.3 Calibration verification
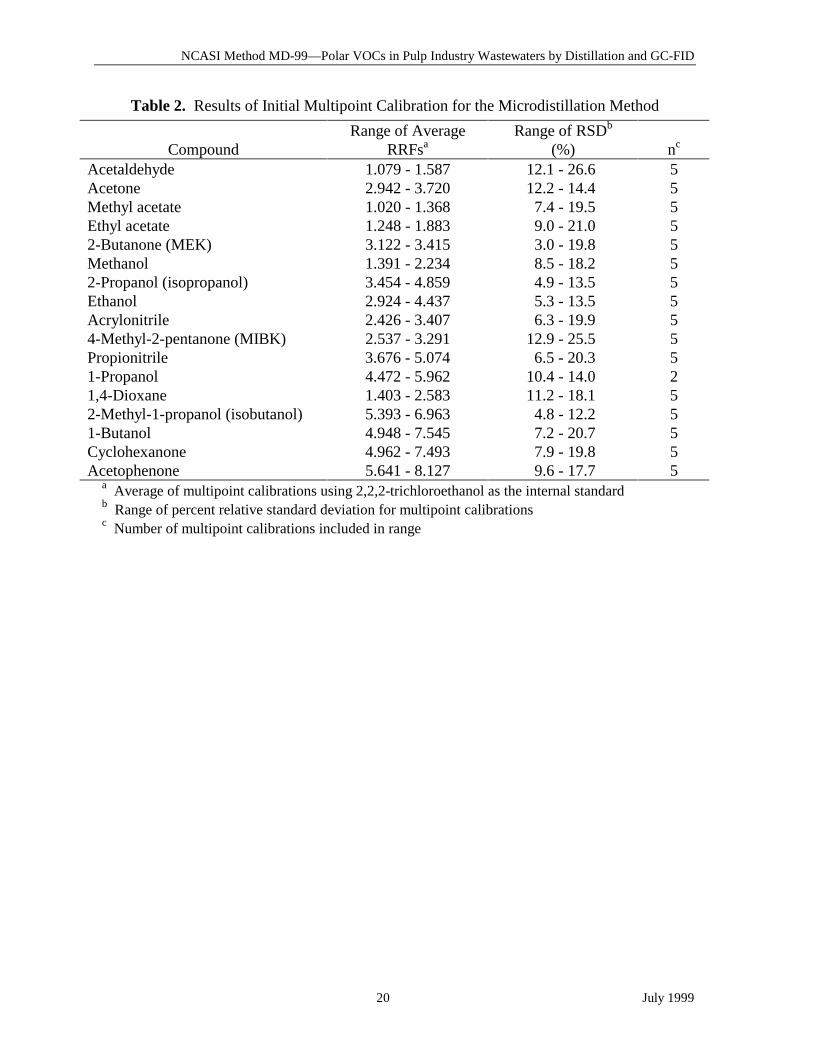
9.3.1 Initial calibration checkThe linearity of the GC-FID analyses must bechecked by microdistillation of a minimum of five different standards at levelsranging from 10 to 10,000 µg/L for all compounds except methanol, which iscalibrated from 50 to 50,000 µg/L (range can be smaller if project dataobjectives warrant). Relative response factors are calculated for eachcompound at each level. Table 2 lists the ranges of average response factorsand relative standard deviations found using the internal standard,2,2,2-trifluoroethanol. The relative standard deviation of the mean must beless than 25%. If a standard deviation of less than 25% cannot be achieved thefollowing corrective action should be taken.
9.3.1.1 If the relative response factors are high at lower concentrations,check the method blank to determine if the system is contaminatedand eliminate the contamination.
9.3.1.2 If the relative response factors are low at the lower concentrationlevels, the injection port and column may be dirty and should beserviced (replace liner and clip the column).
9.3.1.3 If compounds can not be detected at the lower calibration range, thecalibration range will have to be adjusted.
9.3.1.4 If relative response factors are lower at the high concentration levels,the detector may be saturated and the calibration range will need tobe lowered.
9.3.1.5 If relative response factors are both high and low at highconcentrations, the chromatographic resolution may be lost due tocolumn overloading and the calibration range may need to belowered.

NCASI Method MD-99—Polar VOCs in Pulp Industry Wastewaters by Microdistillation and GC-FID
9 July 1999
9.3.1.6 If relative response factors show variation at one level, carefullyrepeat that level. If relative response factors vary randomly, repeatthe calibration being careful to spike the correct volume and insurethat both the fractionation columns are completely dry and theglassware is clean.
9.3.1.7 If the calibration range is changed, the operating range of the methodmust be changed accordingly and at least four standards must beanalyzed within that range.
9.3.2 Daily calibration check
Every day before samples are analyzed the calibration must be verified bydistilling a mid-level calibration standard. The recovery for the compoundsmust be between 75 and 125%. If the check fails to meet this criterion, thecheck is to be repeated. If it continues to fail, the cause for the failure must beidentified and corrected or the initial multipoint calibration must be repeated.
9.4 GC resolution check
The resolution of the critical separation between 2-butanone and methanol must bechecked on the daily calibration run using Equation 1.
Equation 1
( ) ( )RW W
RT RTMeOH MEK
MeOH MEK=+
−2
*
where:R = resolutionWMeOH = width of the methanol peakWMEK = width of the 2-butanone peakRTMeOH = retention time of the methanol peakRTMEK = retention time of the 2-butanone peak
If the resolution falls below 1.5, then the column needs to be replaced. Carbowaxcolumns are susceptible to oxidation and damage from water and need to be checkedfrequently. A typical column will last approximately three months with regular use.
9.5 Recovery and precision checks
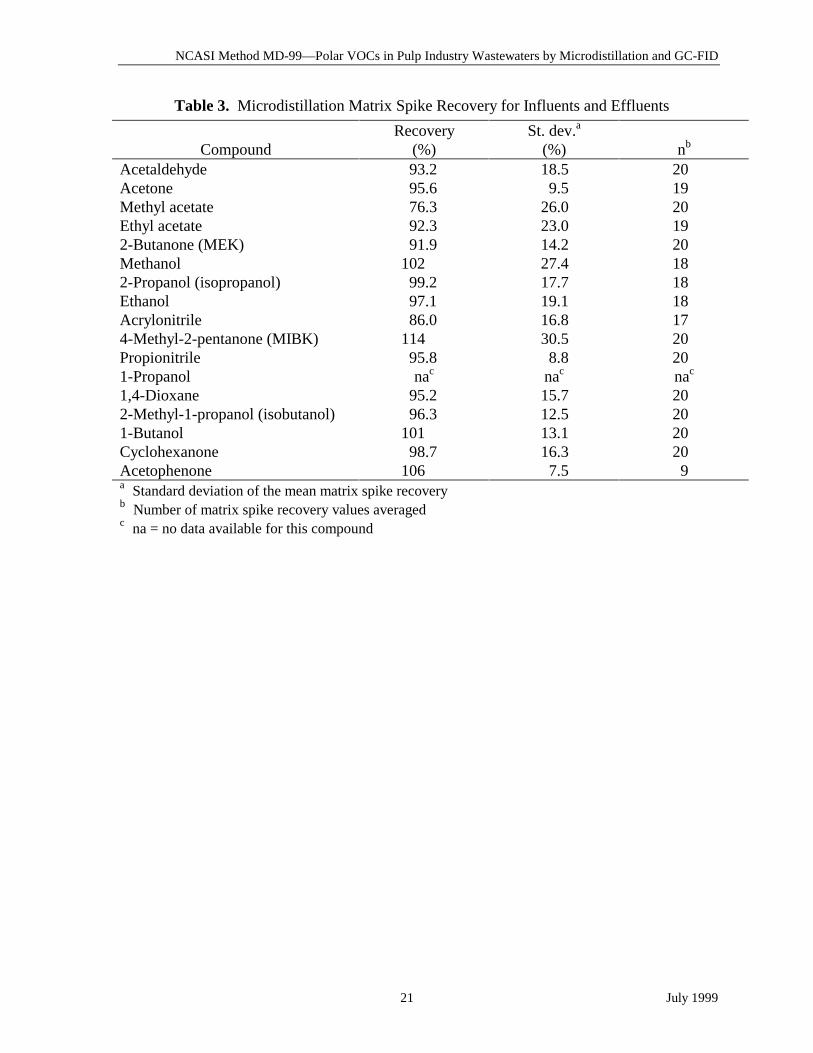
9.5.1 Matrix spikesTo estimate the method recovery, a matrix spike should be runwith each sample set (at least one in ten) and when a new sample matrix isencountered. The matrix spike concentration should be at least two times thenative concentration. Table 3 shows the recoveries found during the initialvalidation of this method. Recoveries of between 65 and 125% should be

NCASI Method MD-99—Polar VOCs in Pulp Industry Wastewaters by Distillation and GC-FID
10 July 1999
obtained for all compounds except methyl acetate which should have arecovery of between 40 and 120%.
9.5.2 Duplicate analysesTo estimate the method’s precision, duplicates should berun with each sample set (at least one in ten samples) and when a new samplematrix is encountered. The relative percent differences between duplicatesshould be within 20%. The precision found during the initial methodvalidation can be found in Table 4.
9.5.3 Depending upon specific program requirements, field replicates and fieldspikes of the analytes of interest into samples may be required to assess theprecision and accuracy of the sampling and sample transporting techniques.
10.0 Calibration and Standardization
10.1 Calibration conditions
Calibration for this method includes the microdistillation step as well as theinstrumental analysis. The calibration standards are distilled as described in Section11.0. The collected condensate is analyzed by GC-FID using the conditions below.
Parameter Setting
Injector 1-µL splitless with 0.35-min split vent time at 110°CSyringe rinse water
Carrier gas Helium at 4-mL/min
Column 30-m x 0.53-mm ID with 1.0-µm film of DB-Wax (J&W)
Oven ProgramInitial Temperature 10°C and hold for 1 minRate 1 20°C/min to 20°CRate 2 6°C/min to 120°CRate 3 12°C/min to 200°C hold for 3 min
Detector FIDTemperature 250°CFuel 30 mL/min hydrogenOxidant 300 mL/min airMake-up 25 mL/min nitrogen
10.2 Method calibration procedure
10.2.1 A calibration is performed by spiking a volume of the working stock solutionand 10 µL of the internal standard solution (500 µg/L 2,2,2-trifluoroethanol)into 40 mL of volatile organic-free water. No pH adjustment is made for

NCASI Method MD-99—Polar VOCs in Pulp Industry Wastewaters by Microdistillation and GC-FID
11 July 1999
calibration standards. The sample is distilled according to Section 11.0. Afterthe collection of the distillate add 10 µL of the recovery check standard(500 µg/L 2,2,2-trichloroethanol).
10.2.2 For a five-point calibration covering a range of 10 to 10,000 µg/L for allcompounds (except methanol, range 50 to 50,000 µg/L), step 10.2.1 isrepeated with working stock volumes of 4, 20, 100, 800, and 4000 µL. Ablank with no working stock solution spiked should also be included with theinitial calibration.
10.2.3 Instrument linearity is established by generating relative response factors(RRF) for each compound at each level of the calibration using Equation 2.
Equation 2
RRFA
A
C
Cii
IS
IS
i
=
*
where:RRFi = relative response factor for compound iAi = area of the peak for compound iAIS = area of the peak for the internal standardCIS = concentration of internal standard in the sample (µg/L)Ci = concentration of compound i in the sample (µg/L)
The mean RRF is calculated for each compound using Equation 3.
Equation 3
RRFRRF
niMi=
∑
where:RRFiM = mean relative response factor for compound in = number of levels in the calibration range
The relative standard deviation is calculated for each mean RRF usingEquation 4.

NCASI Method MD-99—Polar VOCs in Pulp Industry Wastewaters by Distillation and GC-FID
12 July 1999
Equation 4
RSDi =( )
( )RRF RRF
nRRF x
i iM−−
∑ 2
1/ iM 100
where:RSDi = percent relative standard deviation of the mean relative response
factor for compound i
The mean relative response factor is used to calibrate for the compound andcalculate the compound concentration in a sample. The RSD is used to checkthe linearity of the calibration as described in Section 9.3.1.
10.2.4 The recovery of the internal standard is determined by calibrating the internalstandard response relative to the recovery standard response using Equation 5.
Equation 5
RRFA
A
C
CISIS
RS
RS
IS
=
*
where:RRFIS = relative response factor for the internal standardAis = area of the peak for the internal standardARS = area of the peak for the recovery standardCIS = concentration of internal standard in the sample (µg/L)CRS = concentration of the recovery standard in the sample (µg/L)
A mean RRFIS is calculated for the initial calibration using Equation 6.
Equation 6
RRFRRF
nISMIS=
∑
where:RRFISM = mean relative response factor for the internal standardn = number of determinations from the initial calibration

NCASI Method MD-99—Polar VOCs in Pulp Industry Wastewaters by Microdistillation and GC-FID
13 July 1999
11.0 Procedure
11.1 Assemble apparatus
11.1.1 The microdistillation apparatus is pictured in Figure 1. To assemble theapparatus first fill the fractionation column with glass beads to within 5 cm ofthe top. Rinse the column with hot tap water followed by volatile organic-freewater and dry in an oven at 110°C. Follow this same procedure for allglassware, metal fitting, and PTFE tubing used for the microdistillation.
11.1.2 Place the round-bottom flask in the heating mantle. Insert the fractionationcolumn into the flask and insert the glass adapter into the top of thefractionation column. Attach the metal reducing union to the 6-cm glass tubeon the glass adapter using a PTFE ferrule (finger tight). Attach the PTFE tubeto the 1/16-in. fitting of the metal reducing union (be careful not to crimp thetubing when tightening the fitting). Position the other end of the PTFE tubeinto a 2-mL autosampler vial with a 300-µL volume mark on the outside.Secure the total apparatus.
11.2 Microdistillation
11.2.1 Add 40 mL of a well mixed sample to the 100-mL round-bottom flask. Asmaller volume of sample can be used, but the volume has to be brought to 40mL using volatile organic-free water.
11.2.2 If the sample pH is less than 4 or higher than 9, adjust the pH to between 6and 7 using sodium hydroxide or sulfuric acid solution (Section 7.3).
11.2.3 Add 10 µL of the internal standard solution (Section 7.2.1) into the flask andthe appropriate volume of working standard solution for calibration or matrixspike samples (Section 7.2.4). Add a boiling stone and return the flask to theapparatus.
11.2.4 Add heat to the sample to bring it to a boil in two to four minutes. Use of pipeinsulation (Section 6.2.3) to insulate the fractionation column will shorten thetime required for the distillation to occur. Collect the first 300 µL of distillatein the autosample vial.
Note: Once steam starts to collect in the condenser section, it normally takesless than 20 seconds for 300 µL of distillate to collect. After 30 seconds, thecondenser quits working and steam blows the collected distillate out of thevial invalidating the analysis.

NCASI Method MD-99—Polar VOCs in Pulp Industry Wastewaters by Distillation and GC-FID
14 July 1999
11.2.5 As the distillate collects in the insert, slowly back the condenser line out of thevial as it fills. This allows the bubbles that form to escape without dislodgingor stripping the distillate from the vial. Remove the free end when the 300-µLvolume is achieved. Turn off the heating mantel and back it away from theflask.
11.2.6 At this time add 10 µL of the recovery solution (Section 7.2.2). Seal the vialand store at 4°C until the distillate is analyzed.
11.3 GC-FID analysis
11.3.1 The instrumental conditions described in Section 10.1 are used.
11.3.2 Daily calibration checks and resolution checks must be performed (Sections9.3.2 and 9.4).
11.3.3 A method blank must be analyzed (Section 9.3.2).
11.3.4 The sample distillates are analyzed.
12.0 Data Analysis
12.1 Qualitative identification
12.1.1 Compound identification is made by the comparison of relative retention time(RRT) of a sample peak to that found for a compound in the calibrationstandard. The RRT for a compound in a sample should be within ±0.006 RRTunits of the mean relative retention time for the compound in the initialcalibration. When a peak’s RRT falls within the window of more than onecompound, the compound whose RRT matches most closely is assigned to thepeak. Table 5 shows the mean retention times and standard deviations of themean RRT found during the method validation study for spiked effluent andinfluent samples. The relative retention time is calculated using Equation 7.
Equation 7
RRTRT
RTii
IS
=
where:
RRTi = relative retention time of compound iRTi = retention time of compound iRTIS = retention time of the reference standard

NCASI Method MD-99—Polar VOCs in Pulp Industry Wastewaters by Microdistillation and GC-FID
15 July 1999
12.1.2 Confirmation of identificationsBecause the FID is nonspecific, whensamples of unknown compositions are encountered, confirmation of anyidentified compound should be performed. Full scan GC/MS is an idealmethod to use for confirmation, but it is not as sensitive as GC-FID and isprone to interferences due to water. Analysis of the sample on a second GCcolumn with different separation characteristics can be used to confirmidentifications. A megabore DB-624 column has been used successfully forconfirmations.
12.2 Sample quantification
When a compound has been identified, use Equation 8 to determine the concentrationof the compound.
Equation 8
CA
ARRF Ci
i
ISiM IS=
* *
where:Ci = concentration of compound i (µg/L)
12.3 Internal standard recovery
The recovery of the internal standard relative to the recovery standard is calculatedwith Equation 9.
Equation 9
RA
A
C
CRRFIS
IS
RS
RS
ISISM=
* * *100
where:
RIS = recovery of internal standard in percent

NCASI Method MD-99—Polar VOCs in Pulp Industry Wastewaters by Distillation and GC-FID
16 July 1999
12.4 Matrix spike recovery
Matrix spike recovery is calculated using Equation 10.
Equation 10
( )R
C C
CMS
iMS i
MS
=−
*100
where:RMS = matrix spike recovery in percentCiMS = concentration of compound i in the matrix spike sample (µg/L)CMS = concentration of compound i spiked in the sample (µg/L)
The spiked concentration should be at least twice the native concentration for therecoveries to be valid.
12.5 Duplicate analysis
Precision is estimated by calculating the relative percent difference between duplicateanalysis using Equation 11.
Equation 11
RPDC C
Cm
=−1 2
100*
where:RPD = relative percent differenceC1 = concentration in the first of duplicate analysesC2 = concentration in the second of duplicate analysesCM = mean of the two duplicate analyses
12.6 Sample dilution
If the concentration found for any of the compounds is above the calibration range,then the samples have to be diluted in one of two ways.
12.6.1 Distillate dilutionThe collected distillate can be diluted up to a factor of tenby adding volatile organic-free water. No correction in the calculation isrequired if this method is used because the internal standard is diluted as wellas is the sample.
12.6.2 Sample dilutionA smaller volume of sample can be distilled by adding theadjusted volume of sample to a volume of volatile organic-free water whose

NCASI Method MD-99—Polar VOCs in Pulp Industry Wastewaters by Microdistillation and GC-FID
17 July 1999
sum equals 40 mL. The same amount of internal standard is added to thediluted sample. The sample concentration is calculated by multiplying theconcentration calculated by Equation 8 by the dilution factor which iscalculated using Equation 12.
Equation 12
DFVS
=40
where: DF = dilution factorVS = volume of sample added (mL)
13.0 Method Performance
13.1 This method has been single-laboratory validated for the analysis of kraft and sulfitepulp and paper mill influent and effluent from treatment systems. The results of themethod evaluation have been presented previously and contain information leading tothe selection of the procedure described here (2). A summary of matrix spikerecoveries for both effluents and influents have been combined in Table 3. Estimatesof method precision based on pooling of duplicate results for influents and effluentsare shown in Table 4.
13.2 Method precision was found to be a function of concentration. A series of spikedeffluent samples were analyzed to determine the relationship between relativestandard deviation and concentration (3). The relationship was found to be describedby the exponential function obtained with Equation 13.
This relationship allows determination of the concentration at which a specifiedprecision can be obtained. The procedure also allows a more reliable detection limitto be determined. Table 6 lists the regression determined detection limits for eachcompound and the experimentally determined constants A and B for Equation 13.
Equation 13
( )RSD
Ae
C
BC
= *100
where:RSD = relative standard deviationA and B are constantsC = concentration in (µg/L)

NCASI Method MD-99—Polar VOCs in Pulp Industry Wastewaters by Distillation and GC-FID
18 July 1999
13.3 Matrix spike recovery can also be determined as a function of concentration using thesame data set described in Section 13.2. The recovery for most of the compounds wasfound to fall within the 70 to 130% acceptance window over the total range ofconcentrations spiked. The four compounds whose recoveries fell outside that rangefor one or more spike levels are shown in Figure 2. Although the range of recoverieswas greater for these compounds, the recoveries were scattered and did not show atrend with concentration. These results indicate that the bias for the method isconsistent throughout the calibrated range of the method.
14.0 Pollution Prevention
Pollution prevention approaches were not evaluated for this method.
15.0 Waste Management
15.1 It is the laboratory’s responsibility to comply with all federal, state, and localregulations governing waste management, particularly hazardous waste identificationrules and land disposal restrictions. In addition it is the laboratory’s responsibility toprotect air, water, and land resources by minimizing and controlling all releases fromfume hoods and bench operations. Compliance with any sewage discharge permitsand regulations is required.
15.2 Samples containing acids at a pH of less than 2 are hazardous and must be neutralizedbefore being poured down a drain or must be handled as hazardous waste.
15.3 For further information on waste management, consult The Waste ManagementManual for Laboratory Personnel, available from the American Chemical Society,Department of Government Relations and Science Policy, 115 Sixteenth Street NW,Washington, DC 20036.
16.0 References
1. Bruce, M.L., Lee, R.P., and Stephens, M.W. Concentration of water-soluble volatileorganic compounds from aqueous samples by azeotropic microdistillation.Environmental Science and Technology 26(1992): 160-63.
2. Gholson, A., Cook, D., and Hoy, D. Evaluation of the microdistillation method(Method 5031) for measuring volatile water-soluble compounds in pulp milltreatment influents and Effluents. Presented at US EPA/ACS 12th Annual WasteTesting and Quality Assurance Symposium, Washington, DC, July, 1996.
3. Gholson, A., Cook, D., and LaFleur, L. Application of a regression based detectionlimit determination for volatile water soluble compounds in pulp mill effluent usingmicrodistillation (SW-846 Method 5031). Presented at US EPA 19th AnnualConference on Analysis of Pollutants in the Environment, Norfolk, VA, May, 1996.
NCASI Method MD-99—Polar VOCs in Pulp Industry Wastewaters by Microdistillation and GC-FID
19 July 1999
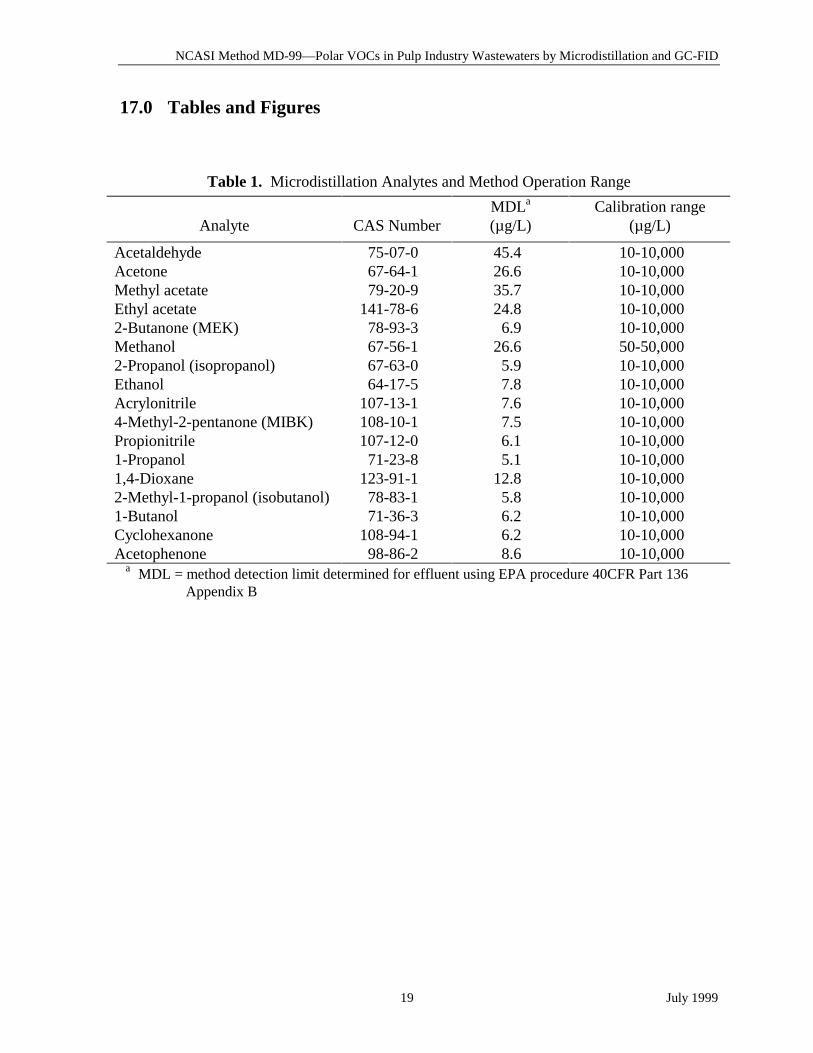
17.0 Tables and Figures
Table 1. Microdistillation Analytes and Method Operation Range
Analyte CAS NumberMDLa
(µg/L)Calibration range
(µg/L)
Acetaldehyde 75-07-0 45.4 10-10,000Acetone 67-64-1 26.6 10-10,000Methyl acetate 79-20-9 35.7 10-10,000Ethyl acetate 141-78-6 24.8 10-10,0002-Butanone (MEK) 78-93-3 6.9 10-10,000Methanol 67-56-1 26.6 50-50,0002-Propanol (isopropanol) 67-63-0 5.9 10-10,000Ethanol 64-17-5 7.8 10-10,000Acrylonitrile 107-13-1 7.6 10-10,0004-Methyl-2-pentanone (MIBK) 108-10-1 7.5 10-10,000Propionitrile 107-12-0 6.1 10-10,0001-Propanol 71-23-8 5.1 10-10,0001,4-Dioxane 123-91-1 12.8 10-10,0002-Methyl-1-propanol (isobutanol) 78-83-1 5.8 10-10,0001-Butanol 71-36-3 6.2 10-10,000Cyclohexanone 108-94-1 6.2 10-10,000Acetophenone 98-86-2 8.6 10-10,000
a MDL = method detection limit determined for effluent using EPA procedure 40CFR Part 136Appendix B
NCASI Method MD-99—Polar VOCs in Pulp Industry Wastewaters by Distillation and GC-FID
20 July 1999
Table 2. Results of Initial Multipoint Calibration for the Microdistillation Method
CompoundRange of Average
RRFsaRange of RSDb
(%) nc
Acetaldehyde 1.079 - 1.587 12.1 - 26.6 5Acetone 2.942 - 3.720 12.2 - 14.4 5Methyl acetate 1.020 - 1.368 7.4 - 19.5 5Ethyl acetate 1.248 - 1.883 9.0 - 21.0 52-Butanone (MEK) 3.122 - 3.415 3.0 - 19.8 5Methanol 1.391 - 2.234 8.5 - 18.2 52-Propanol (isopropanol) 3.454 - 4.859 4.9 - 13.5 5Ethanol 2.924 - 4.437 5.3 - 13.5 5Acrylonitrile 2.426 - 3.407 6.3 - 19.9 54-Methyl-2-pentanone (MIBK) 2.537 - 3.291 12.9 - 25.5 5Propionitrile 3.676 - 5.074 6.5 - 20.3 51-Propanol 4.472 - 5.962 10.4 - 14.0 21,4-Dioxane 1.403 - 2.583 11.2 - 18.1 52-Methyl-1-propanol (isobutanol) 5.393 - 6.963 4.8 - 12.2 51-Butanol 4.948 - 7.545 7.2 - 20.7 5Cyclohexanone 4.962 - 7.493 7.9 - 19.8 5Acetophenone 5.641 - 8.127 9.6 - 17.7 5
a Average of multipoint calibrations using 2,2,2-trichloroethanol as the internal standardb Range of percent relative standard deviation for multipoint calibrationsc Number of multipoint calibrations included in range
NCASI Method MD-99—Polar VOCs in Pulp Industry Wastewaters by Microdistillation and GC-FID
21 July 1999
Table 3. Microdistillation Matrix Spike Recovery for Influents and Effluents
CompoundRecovery
(%)St. dev.a
(%) nb
Acetaldehyde 93.2 18.5 20Acetone 95.6 9.5 19Methyl acetate 76.3 26.0 20Ethyl acetate 92.3 23.0 192-Butanone (MEK) 91.9 14.2 20Methanol 102 27.4 182-Propanol (isopropanol) 99.2 17.7 18Ethanol 97.1 19.1 18Acrylonitrile 86.0 16.8 174-Methyl-2-pentanone (MIBK) 114 30.5 20Propionitrile 95.8 8.8 201-Propanol nac nac nac
1,4-Dioxane 95.2 15.7 202-Methyl-1-propanol (isobutanol) 96.3 12.5 201-Butanol 101 13.1 20Cyclohexanone 98.7 16.3 20Acetophenone 106 7.5 9a Standard deviation of the mean matrix spike recoveryb Number of matrix spike recovery values averagedc na = no data available for this compound

NCASI Method MD-99—Polar VOCs in Pulp Industry Wastewaters by Distillation and GC-FID
22 July 1999
Table 4. Microdistillation Precision Estimate from Pooled Duplicate Results
Effluent Precision Influent Precision
CompoundRSDa
(%) nbRSDa
(%) nb
Acetaldehyde 21.5 7 4.6 11Acetone 11.4 8 4.1 11Methyl acetate 13.0 4 8.4 7Ethyl acetate 11.6 4 9.1 52-Butanone (MEK) 5.3 4 4.5 11Methanol 21.7 9 9.1 112-Propanol (isopropanol) 2.3 4 10.9 10Ethanol 4.4 4 12.0 11Acrylonitrile 5.7 4 5.2 54-Methyl-2-pentanone (MIBK) 9.1 4 14.3 5Propionitrile 3.5 6 2.3 91-Propanol nac nac nac nac
1,4-Dioxane 10.0 4 11.9 92-Methyl-1-propanol (isobutanol) 2.4 4 1.7 111-Butanol 3.9 4 11.0 11Cyclohexanone 6.5 4 14.5 11Acetophenone 8.0 5 16.0 6
a Relative standard deviation of pooled duplicatesb Number of duplicate data points with both values above the MDLc na = no data available for this compound

NCASI Method MD-99—Polar VOCs in Pulp Industry Wastewaters by Microdistillation and GC-FID
23 July 1999
Table 5. Microdistillation Mean Relative Retention Times and Standard Deviations forEffluents and Influents
Effluent InfluentCompound Mean RRTa sb Mean RRTa sb
Acetaldehyde 0.1916 0.0016 0.1930 0.0033Acetone 0.3049 0.0021 0.3071 0.0045Methyl acetate 0.3257 0.0022 0.3274 0.0041Ethyl acetate 0.4156 0.0021 0.4170 0.00392-Butanone (MEK) 0.4339 0.0021 0.4357 0.0037Methanol 0.4455 0.0016 0.4477 0.00272-Propanol (isopropanol) 0.5025 0.0016 0.5039 0.0026Ethanol 0.5136 0.0016 0.5151 0.0024Acrylonitrile 0.6021 0.0015 0.6034 0.00244-Methyl-2-pentanone (MIBK) 0.6275 0.0016 0.6289 0.0025Propionitrile 0.6672 0.0014 0.6684 0.00221-Propanol 0.6992 0.0019 0.7003 0.00301,4-Dioxane 0.7389 0.0013 0.7400 0.00192-Methyl-1-propanol (isobutanol) 0.8097 0.0011 0.8108 0.00161-Butanol 0.9285 0.0012 0.9293 0.0012Cyclohexanone 1.1789 0.0013 1.1795 0.0013Acetophenone 1.6133 0.0030 1.6140 0.00192,2,2-Trichloroethanol (recovery std) 1.6468 0.0032 1.6472 0.0019
Internal StandardRetention
Time (min)sb
(min)Retention
Time (min)sb
(min)2,2,2-Trifluoroethanol 14.99 0.045 14.99 0.028
a RRT = retention time relative to the internal standard 2,2,2-trifluoroethanolb s = standard deviation of the mean RRT

NCASI Method MD-99—Polar VOCs in Pulp Industry Wastewaters by Distillation and GC-FID
24 July 1999
Table 6. Regression Based Detection Limit and Precision Estimate Coefficients forEffluents
CompoundRBDLa
(µg/L) Ab Bb
Acetaldehyde 45.4 19.3 0.005Acetone 26.6 8.79 0.002Methyl acetate 35.7 5.62 0.009Ethyl acetate 24.8 6.40 0.0052-Butanone (MEK) 6.9 1.85 0.010Methanol nac nac nac
2-Propanol (isopropanol) 5.9 1.52 0.008Ethanol 7.8 2.64 0.011Acrylonitrile 7.6 1.94 0.0134-Methyl-2-pentanone (MIBK) 7.8 2.32 0.014Propionitrile 6.1 1.53 0.0101-Propanol nac nac nac
1,4-Dioxane 12.8 3.04 0.0102-Methyl-1-propanol (isobutanol) 5.8 1.81 0.0071-Butanol 6.2 2.08 0.008Cyclohexanone 6.2 2.14 0.009Acetophenone 8.6 2.86 0.011
a RBDL = regression based detection limit described in Reference 3b Regression variables for the exponential regression of standard deviation versus concentration as
described in Equation 14c na = no data available for this compound

NCASI Method MD-99—Polar VOCs in Pulp Industry Wastewaters by Microdistillation and GC-FID
25 July 1999
Figure 1. Azeotropic Microdistillation System

NCASI Method MD-99—Polar VOCs in Pulp Industry Wastewaters by Distillation and GC-FID
26 July 1999
Figure 2. Percent Recovery Versus Concentration of Compounds Which Have ValuesOutside 70 to 130 Percent for the Microdistillation of Pulp Mill Effluent
AcetaldehydeMethyl acetate
2-Butanone
Ethanol
40
70
100
130
1 10 100 1000 10000
Concentration (µg/L)
Rec
over
y (%
)