Biological monitoring for exposure to volatile organic compounds (VOCs) (IUPAC Recommendations 2000
52
Pure Appl. Chem., Vol. 72, No. 3, pp. 385–436, 2000. © 2000 IUPAC Republication or reproduction of this report or its storage and/or dissemination by electronic means is permitted without the need for formal IUPAC permission on condition that an acknowledgment, with full reference to the source, along with use of the copyright symbol ©, the name IUPAC, and the year of publication, are prominently visible. Publication of a translation into another language is subject to the additional condition of prior approval from the relevant IUPAC National Adhering Organization. 385 INTERNATIONAL UNION OF PURE AND APPLIED CHEMISTRY CHEMISTRY AND HUMAN HEALTH DIVISION CLINICAL CHEMISTRY SECTION COMMISSION ON TOXICOLOGY* BIOLOGICAL MONITORING FOR EXPOSURE TO VOLATILE ORGANIC COMPOUNDS (VOCs) (IUPAC Recommendations 2000) Prepared for publication by R. HEINRICH-RAMM 1 , M. JAKUBOWSKI 2 , B. HEINZOW 3 , J. MOLIN CHRISTENSEN 4 , E. OLSEN 4 , and O. HERTEL 5 1 Central Institute of Occupational Health, Adolph-Schönfelder-Str. 5, D-22083 Hamburg, Germany; 2 Institute of Occupational Medicine, POB 199, 8 Sw. Teresy Str., PL-90 950 Łódz, Poland; 3 State Institute of Nature and Environment, Hamburger Chaussee 25, D-24220 Flintbek, Germany; 4 National Institute of Occupational Health, Lersø Park Allè 105, DK- 2100 Copenhagen Ø, Denmark; 5 National Environmental Research Institute, Frederiksborg vej 399, P.O. Box 358, DK-4000 Roskilde, Denmark *Membership of the Commission during the preparation of this report (1993–2000) was as follows: Chairman: J. H. Duffus (UK, 1998–2000); R. Cornelis (Belgium, 1993–1997); Secretary: D. M. Templeton (Canada, 2000), B. Heinzow (Germany, 1993–1999); Titular Members: J. M. Christensen (Denmark, 1993–2000); R. Heinrich- Ramm (Germany, 1998–2000); M. Jakubowski (Poland, 1993–1997); R. P. Nolan (USA, 1998–2000); M. Nordberg (Sweden,2000); E. Olsen (Denmark, 2000); Associate Members: I. Dési (Hungary, 1996–2000); O. Hertel (Denmark, 1998–2000); A. Lamberty (Belgium, 1993–1997); J. K. Ludwicki (Poland, 1998–2000); L. Nagymajényi (Hungary, 2000); D. Rutherford (Australia, 1993–1999); E. Sabbioni (Italy, 1996–2000); P. A. Schulte (USA, 1996–1999); K. T. Suzuki (Japan, 1998–2000); W. A. Temple (New Zealand, 1996–1999); M. Vahter (Sweden, 1993–1999); National Representatives: Z. Bardodej (Czech Republic, 1996–1999); W. King (Ireland, 1993–1997); J. Park (Korea, 1998–1999); F. J. R. Paumgartten (Brazil, 1996–2000); I. S. Pratt (Ireland, 2000); V. Ravindranath (India, 1996– 2000); M. Repetto Jimenez (Spain, 1993–1999); Zeliha Imra (Turkey, 1993–1997); Representative of IUTOX: C. Schlatter (Switzerland); Representative of IUPHAR: C. D. Klaassen (USA). Correspondence should be addressed to Dr. R. Heinrich-Ramm.
-
Upload
independent -
Category
Documents
-
view
0 -
download
0
Transcript of Biological monitoring for exposure to volatile organic compounds (VOCs) (IUPAC Recommendations 2000

Pure Appl. Chem., Vol. 72, No. 3, pp. 385–436, 2000.© 2000 IUPAC
Republication or reproduction of this report or its storage and/or dissemination by electronic means is permitted without theneed for formal IUPAC permission on condition that an acknowledgment, with full reference to the source, along with use of thecopyright symbol ©, the name IUPAC, and the year of publication, are prominently visible. Publication of a translation intoanother language is subject to the additional condition of prior approval from the relevant IUPAC National AdheringOrganization.
385
INTERNATIONAL UNION OF PURE AND APPLIED CHEMISTRY
CHEMISTRY AND HUMAN HEALTH DIVISIONCLINICAL CHEMISTRY SECTIONCOMMISSION ON TOXICOLOGY*
BIOLOGICAL MONITORING FOR EXPOSURE TOVOLATILE ORGANIC COMPOUNDS (VOCs)
(IUPAC Recommendations 2000)
Prepared for publication byR. HEINRICH-RAMM1, M. JAKUBOWSKI2, B. HEINZOW3,
J. MOLIN CHRISTENSEN4, E. OLSEN4, and O. HERTEL5
1Central Institute of Occupational Health, Adolph-Schönfelder-Str. 5, D-22083 Hamburg,Germany; 2Institute of Occupational Medicine, POB 199, 8 Sw. Teresy Str., PL-90 950 Łódz,
Poland; 3State Institute of Nature and Environment, Hamburger Chaussee 25, D-24220Flintbek, Germany; 4National Institute of Occupational Health, Lersø Park Allè 105, DK-
2100 Copenhagen Ø, Denmark; 5National Environmental Research Institute, Frederiksborgvej 399, P.O. Box 358, DK-4000 Roskilde, Denmark
*Membership of the Commission during the preparation of this report (1993–2000) was as follows:
Chairman: J. H. Duffus (UK, 1998–2000); R. Cornelis (Belgium, 1993–1997); Secretary: D. M. Templeton (Canada,2000), B. Heinzow (Germany, 1993–1999); Titular Members: J. M. Christensen (Denmark, 1993–2000); R. Heinrich-Ramm (Germany, 1998–2000); M. Jakubowski (Poland, 1993–1997); R. P. Nolan (USA, 1998–2000); M. Nordberg(Sweden,2000); E. Olsen (Denmark, 2000); Associate Members: I. Dési (Hungary, 1996–2000); O. Hertel (Denmark,1998–2000); A. Lamberty (Belgium, 1993–1997); J. K. Ludwicki (Poland, 1998–2000); L. Nagymajényi (Hungary,2000); D. Rutherford (Australia, 1993–1999); E. Sabbioni (Italy, 1996–2000); P. A. Schulte (USA, 1996–1999);K. T. Suzuki (Japan, 1998–2000); W. A. Temple (New Zealand, 1996–1999); M. Vahter (Sweden, 1993–1999);National Representatives: Z. Bardodej (Czech Republic, 1996–1999); W. King (Ireland, 1993–1997); J. Park (Korea,1998–1999); F. J. R. Paumgartten (Brazil, 1996–2000); I. S. Pratt (Ireland, 2000); V. Ravindranath (India, 1996–2000); M. Repetto Jimenez (Spain, 1993–1999); Zeliha Imra (Turkey, 1993–1997); Representative of IUTOX:C. Schlatter (Switzerland); Representative of IUPHAR: C. D. Klaassen (USA).
Correspondence should be addressed to Dr. R. Heinrich-Ramm.

386 R. HEINRICH-RAMM et al.
© 2000 IUPAC, Pure and Applied Chemistry 72, 385–436
Biological monitoring for exposure to volatileorganic compounds (VOCs)
(IUPAC Recommendations 2000)
Abstract: This paper deals with the appropriate application of biological monitoring(BM) for exposure to volatile organic compounds (VOCs). Sampling guidelines,approved analytical procedures, quality control systems, detailed aspects for theinterpretation of biomonitoring data, a compilation of international biologicalaction values for VOC exposure at the workplace (e.g., BAT, BEI®), and state ofthe art reference values are outlined or referred to in this review for recommendationas guidelines for health professionals in occupational and environmental settings.
VOCs are frequently encountered at the workplace, in daily routines andwidely used consumer products. They cover a broad spectrum of chemical classeswith different physicochemical and biological properties. Inhalation is a prominentroute of exposure due to their volatility but many VOCs can quite readily be absorbedthrough the skin. BM allows assessment of the integrated exposure by differentroutes including inhalation and concomitant dermal and oral uptake—a helpfultool for relating exposure to body burden and possible health effects. Because ofthe different toxicological profiles of VOCs, no uniform approach for BM can berecommended. VOCs in blood and urinary VOC metabolites are most often appliedfor BM. Limit values for workplace exposure have been established for manyVOCs. In this field, profound analytical methodology and extensive experienceexist in numerous international scientific laboratories for reliable routine application.Contamination and loss of VOCs during specimen collection, storage and sampletreatment, and applied calibration procedure are the most important uncertaintiesfor analytical quantification of VOCs in blood. For interpretation of the analyticalresults appropriate time of sampling, according to toxicokinetics of the compound,is crucial due to VOC elimination with short but differing biological half-lives.Lifestyle factors (such as smoking habits, alcohol consumption, and dietary habits),workload, personal working habits, exposure to VOC mixtures and endogeousfactors (as genetic polymorphism for VOC metabolizing enzymes, body mass)contribute to BM results and have to be considered in detail. Future analyticalwork should focus on the improvement of analytical methodology of VOCdetermination in body fluids at low-level environmental exposure and evaluationof corresponding reference intervals.

Biological monitoring for exposure to volatile organic compounds 387
© 2000 IUPAC, Pure and Applied Chemistry 72, 385–436
CONTENTS
1. INTRODUCTION2. TOXICOKINETICS
2.1 Absorption2.1.1 Pulmonary absorption (absorption through the lungs)2.1.2 Cutaneous absorption (absorption through the skin)
2.2 Distribution2.3 Elimination2.4 Toxicokinetic modeling
2.4.1 Correlation model2.4.2 Compartment model2.4.3 Physiologically based toxicokinetic model (PBPK)
2.5 Toxicokinetics and implication for exposure estimation2.5.1 Evaluation of the rate of absorption2.5.2 Evaluation of daily exposure2.5.3 Evaluation of cumulative exposure2.5.4 Kinetics in exhaled air
3. SAMPLING AND ANALYTICAL PROCEDURES, FACTORS AFFECTING UNCERTAINTYCOMPONENTS, AND QUALITY ASSURANCE3.1 Specimen collection3.2 Principles of analytical procedures for VOCs in body fluids and interference factors3.3 Quality assurance
4. UNCERTAINTY OF VOC ANALYSIS IN BODY FLUIDS5. BIOMONITORING OF EXPOSURE
5.1 Volatile organic compounds (VOCs)5.1.1 VOCs in blood5.1.2 VOCs in urine5.1.3 VOCs in exhaled air
5.2 VOC metabolites5.2.1 VOC metabolites in urine5.2.2 VOC metabolites in blood
5.3 Other5.4 Evaluation of exposure to mixtures5.5 Influence factors on biomonitoring results after VOC exposure
6. REFERENCE VALUES AND INTERVALS7. BIOMONITORING ACTION LEVELS
7.1 German BAT values7.2 ACGIH BEI values7.3 Finnish biomonitoring action levels7.4 Other biomonitoring action levels (Japan, France, Italy, United Kingdom, Poland)
8. CONCLUSIONS AND RECOMMENDATIONS9. LIST OF ACRONYMS
10. LIST OF TRADITIONAL NAMES AND THEIR EQUIVALENT IUPAC NAMESREFERENCES

388 R. HEINRICH-RAMM et al.
© 2000 IUPAC, Pure and Applied Chemistry 72, 385–436
1. INTRODUCTION
In recent years the assessment of exposure to hazardous substances has become an integral part of therisk assessment process for an increasing number of inorganic as well as organic chemical substances.Among chemicals of industrial importance the so-called volatile organic compounds (VOCs) belong toa broad scale of chemicals with high production levels all over the world and widespread applications inindustry, trade and private households. According to a definition given by the European Communitiesthe expression “volatile organic compound (VOC) means any organic compound having, at 293.15 K,a vapor pressure of 0.01 kPa or more, or having a corresponding volatility under the particular conditionof use” [1]).
As VOCs are defined by their vapor pressure, different chemical substance classes with differentsolubilities and toxicity profiles are covered by this term (Table 1). One of the most important industrialuses of the VOCs is their utility as solvents. Here, the term “organic solvents” will be understood as a“generic name for a group of chemical compounds or mixtures which are liquid in the temperaturerange of approximately 0–250 °C. They are volatile and relatively chemically inert. Solvents are usedindustrially to extract, dissolve or suspend materials not soluble in water (e.g., fats, lipids, resins andpolymers)” [2]. NOTE
NOTE We have retained in the text of the recommendations and in the tables the names of chemicalcompounds that have most frequently been encoutered in the literature, which can be described astraditional, semisystematic, or trivial names.
IUPAC, of course, is striving towards a uniform systematic naming of chemical substances andpresentation of formulae, which are embodied in IUPAC nomenclature books such as
A Guide to IUPAC Nomenclature of Organic CompoundsR. Panico, W. H. Powell, and J.-C. RicherBlackwell Scientific Publications, Oxford, 1993
Principles of Chemical Nomenclature – A Guide to IUPAC RecommendationsG. J. Leigh, H. A. Favre, and W. V. MetanomskiBlackwell Science, Oxford, 1998
Therefore, we are providing a listing of the traditional names and their equivalent IUPAC namesin Sect. 10.

Biological monitoring for exposure to volatile organic compounds 389
© 2000 IUPAC, Pure and Applied Chemistry 72, 385–436
Table 1 Types of chemical substances among the VOCs.
Type of substance Example Formula lg P1) Application/source
aromatic benzene C6H
62.13 car exhaust fumes,
hydrocarbons toluene C7H
82.69 lacquers, printing ink,
xylenes C8H
102.8–3.2 paint, tobacco smoke
aliphatic n-hexane C6H
14 mixtures lacquers, adhesives
hydrocarbons white spirit (e.g., branched gasoline, dry cleaningC
6/C
7-isomers) petrol
chlorinated dichloromethane CH2Cl
21.25 paint remover resins,
hydrocarbons chlorobenzene C6H
5Cl 2.84 rubbers, dry cleaning
tetrachloroethylene C2Cl
42.60
alcohols methanol CH3OH –0.82 chemical syntheses;
ethanol C2H
5OH beverages and diet
esters of ethyl acetate CH3COOC
2H
50.66 lacquers, solvents for
carboxylic acids resins
ketones 2-butanone CH3COC
2H
50.26 lacquers, resins
various:glycol ethers ethylene glycol HOC
2H
4OC
2H
5paint, printing ink
monoethyl etherethers methyl tert-butyl CH
3OC(CH
3)
3oxygenated fuels
etheramides dimethylformamide HCON(CH
3)
2lacquers, plastics
1) P = c(octanol)/c(blood); octanol/blood partition coefficient [3–5]
Few data are available internationally on the amount of solvents being produced. As one example,about 550 thousand tons of industrial solvents have been produced annually between 1986 and 1993 inGermany [6]. The 10 most often analyzed VOCs in German industrial solvent mixtures are xylenes,toluene, ethyl acetate, butyl acetate, ethylbenzene, butanol, acetone, and ethanol, followed by 2-pro-panol and 2-butanone [7]. A very similar ranking was observed in Danish companies [8]. In addition,these data indicate that VOC exposure is characterized by the simultaneous presence of several, typi-cally 5 to 10, substances belonging to different chemical classes.
Exposure assessment may be performed by ambient air monitoring and by biological monitoring.Here, the term “exposure” is defined as the concentration or amount of a chemical that reaches theorganism [9]. The following terms—given on an international seminar organized by CEC, NIOSH andOSHA [10] and being in line with recent IUPAC recommendations [9] and WHO guidelines on biologi-cal monitoring [11]—will be used within this paper:
Monitoring (in preventive health care) is “a systematic continuous or repetitive health-relatedactivity, designed to lead if necessary to corrective action”.
Biological monitoring (BM) is “a systematic continuous or repeated measurement and assess-ment of workplace agents or their metabolites either in tissues, secreta, excreta or any combination ofthese to evaluate exposure and health risk compared to an appropriate reference”. In this definition, BMis related to monitoring of exposure. A similar definition has been proposed for biomonitoring of envi-ronmental exposure [9].
390 R. HEINRICH-RAMM et al.
© 2000 IUPAC, Pure and Applied Chemistry 72, 385–436
In 1986 Zielhuis and Henderson [12] proposed the term biological effect monitoring (BEM) inorder to include early, possibly reversible biological effects (health-related response) into the conceptof BM: BEM is “the measurement and assessment of early biological effects, of which the relationshipto health impairment has not yet been established in exposed workers to evaluate exposure and/or healthrisk compared to an appropriate reference” as, for example, sister chromatid exchanges, micronucleianalysis, chromosomal aberration, MetHb (methemoglobin).
Recently, instrumental analysis has entered the field of biochemical effect monitoring referringpreferably to the quantification of in vivo formed adducts of the exposure chemical (or its metabolites)to macromolecules, including such proteins as hemoglobin or serum albumin, as well as DNA. Thedetection of increased susceptibility of individuals to chemicals (e.g., due to metabolizing capacity)may be used as biomarkers as well [13].
Another commonly used terminology for different BM types are the terms biological marker(biomarker) of exposure, of effect, and of susceptibility, respectively [14].
This paper concerns the area of biological monitoring (BM) of volatile organic compounds (VOCs).Biochemical and biological effect markers will only be described briefly (cf. Sect. 4.3) and are topics offurther investigation for their practical approaches in VOC exposure by the Commission on Toxicologyof IUPAC.
Biological monitoring provides data that pertain to individual workers. Therefore, their use mayinvolve important ethical problems that have to be solved before starting any biological monitoringprogram [15].
Biological monitoring (BM) of exposure to organic solvents has been applied as an important toolfor worker protection and turned out to be complementary, often even superior, to ambient monitoringof environmental and workplace exposures due to:
• uptake routes additional to inhalation such as skin or oral absorption,• differences in workload and personal working habits,• use and efficiency for personal protective devices,
Therefore, the individual uptake and its possible impact on the person’s health can be estimated.At present the main problems of evaluating an exposure to VOCs by means of BM include the
strategy of sampling, evaluation of exposure to mixtures, influence of inhibition and induction of me-tabolism on results of BM, and lack of commonly accepted protocols for studies aimed at evaluatingrelations between the degree of exposure and concentration of markers of exposure and/or early healtheffects.
While the idea of biomonitoring is generally accepted for exposure to metals, it is still less wellestablished for VOCs although these have widespread applications in industry and private households.As the IUPAC Commission on Toxicology regards the biomonitoring of VOCs as a very helpful tool inhealth protection of exposed persons, this review is intended to give a concise and up-todate introduc-tion to the field and to recommend the appropriate use of BM of VOCs especially for occupational andenvironmental health professionals with the main emphasis on sampling, handling, basic principles ofapplied analytical procedures, as well as on data interpretation.
2. TOXICOKINETICS
The relationship between environmental or occupational exposure, uptake, and the levels in blood,urine, or tissues is determined by the kinetic behavior of the VOCs. The time course of the concentrationof a substance in body fluids or the body burden is a result of the dose and the basic kinetic processes ofabsorption, distribution, and elimination which may be either via biotransformation (metabolism), and/or excretion (including exhalation). These processes are influenced by endogenous (e.g., genetic

Biological monitoring for exposure to volatile organic compounds 391
© 2000 IUPAC, Pure and Applied Chemistry 72, 385–436
Fig. 1 Elimination curves according to type of elimination kinetics: First-order (——) and zero-order kinetics(-------) presented in normal (a) and logarithmic scale (b).
phenotype, body mass, age, gender) and exogenous (e.g., workload, dietary habits, smoking) factors.Understanding of these factors is essential for biomonitoring of VOCs, selection of the appropriatebiological matrix and sampling time, and interpretation of analytical results.
The basic processes can be described by the extent to which the process occurs and the rate atwhich it occurs. The toxicokinetic parameters are usually calculated from the time course in bodyfluids, e.g., plasma or urine concentration time data. At usually occurring low VOC concentrations, theprocesses are linearly related to exposure and follow first-order kinetics; the time curve plotted on alogarithmic scale becoming a straight line. Following the peak of urinary metabolites at the end ofexposure (e.g., phenylglucuronide), or some time after the exposure (e.g., trichloroacetic acid), metabo-lite excretion usually appears to be monophasic [16]. When the exposure is high and an eliminatingprocess (e.g., metabolism) is saturated, the kinetics are independent of the degree of exposure andfollow zero-order kinetics (Figs. 1a and 1b).
The rate at which VOCs enter and leave the body through the lungs is mainly a function of thepartitioning of the compound between lipid and aqueous compartments in the body. Components withhigh lipid solubility will be stored in fatty tissues (lipophilic) and accumulate depending upon extentand duration of exposure. The kinetics of VOCs during the exposure phase show an initial rapid in-crease and level off afterwards. A corresponding pattern is observed during the elimination phase (rapidinitial decrease of VOC concentration that slows down with time) (Fig. 2).
In first-order kinetics the concentration decline is described by an exponential function, the rateconstant (k
e) indicates the fraction of the determinant in the body removed per unit of time. The biologi-
cal half-life (t½) of a substance in an organ, tissue, or body fluid denotes the time needed to reduce the
biological level of the substance by half. Half-life is inversely related to the elimination constant

392 R. HEINRICH-RAMM et al.
© 2000 IUPAC, Pure and Applied Chemistry 72, 385–436
Fig. 3 Phases of kinetic elimination of toluene from capillary blood after termination of exposure. The half-lifein capillary blood amounted in the three phases to 4 min; 1.8 h; 24.5 h. Two hours after the experiment theconcentration drops down to 15% of its maximum level, and to 2% during the next 16 h (data according toKostrzewski and Piotrowski [41]).
Fig. 2 Uptake and decay of p-xylene in a female subject exposed to 11 mg/m³ in a chamber for 10 h. The datafor exhaled air were fitted with a four-compartmental model (according to Wallace and Pellizzari [36]).
(ke = ln2/t
½). The overall time-course might be the result of several half-lives corresponding to the
elimination from different organs or compartments (Fig. 3).For substances with long half-lives the sampling time is not critical, but the shorter the half-life,
the more critical the sampling time becomes (Fig. 4 and Table 2).
2.1 Absorption
Absorption is the process of transfer of a VOC from the site of exposure, most commonly via theairways or across the skin, into the blood circulation.

Biological monitoring for exposure to volatile organic compounds 393
© 2000 IUPAC, Pure and Applied Chemistry 72, 385–436
The rate of absorption of volatile compounds differs in relation to their physicochemical proper-ties. Lipophilicity, water solubility, and protein binding have an important influence considering thebody composition of water, lipids and proteins. Lipid-soluble compounds can readily dissolve in mem-branes and diffuse into the body. Absorption from the lungs tends to be fast because of the large surfacearea and the thin alveoli membrane. Absorption is usually slow across the skin. The kinetic parameterwhich describes the absorption rate (k
a) is the absorption half-life; the parameter which describes the
extent of absorption is called bioavailability (F).
2.1.1 Pulmonary absorption (absorption through the lungs)
Lungs constitute the main route of absorption of VOCs under occupational and environmental conditions.The introduction of vapor of a given substance into the lungs results in a rise in the alveolar concentration(partial pressure) of that substance. If unimpeded, ventilation would cause the alveolar concentration torapidly reach the inspired concentration. However, the effect of ventilatory input is opposed by substance
Table 2 Classification of compounds according to elimination half-life andresulting sampling requirements (adapted from Fiserova [17]).
Half-life Sampling time reflects
< 2 h recent rate of absorption2–10 h exposure during the day sampling: end of shift/
beginning of next shift10–100 h exposure during the week sampling: end of shift/ work
week
Fig. 4 Effect of half-life (one-compartmental model) on contributions of exposures during the last presamplinghour, day, week, month, and half-year to biological levels of determinants. For example, if the determinant iseliminated with a half-life of 10 h, the biological level mainly reflects the exposure on the day prior to sampling(contribution 70%); to a relatively small extent, it reflects the exposure during previous hour and week(contributions 10% and 20%, respectively) (according to Droz et al. [37]).

394 R. HEINRICH-RAMM et al.
© 2000 IUPAC, Pure and Applied Chemistry 72, 385–436
uptake. The alveolar concentration is determined principally by the balance between ventilatory inputand the loss of substance through uptake by pulmonary blood.
The uptake of a substance is governed by two types of variables, those characteristic of the com-pound (blood/air partition coefficient) and those characteristic to the individual (workload, ventilationand circulation, alveolar-venous difference). Highly volatile, inert (stable) compounds are retained onlyin alveoli. Their uptake accounts for about 57% of the amount in minute ventilation, which is thefraction of minute ventilation that reaches the alveoli. Low volatile compounds, water-soluble com-pounds, and reactive compounds are retained also in respiratory airways, and therefore, their retentionis higher [16].
Gas uptake increases in proportion to the magnitude of the gas partial pressure difference be-tween alveoli and pulmonary venous blood. This difference diminishes when all body tissues achieveequilibrium with the alveolar partial pressure. When the alveolar-venous gas partial pressure differenceequals zero, gas uptake from the lungs ceases. Conversely, the difference is greatest at the beginning ofexposure.
As results of all these processes, the uptake of VOCs in lungs at the beginning of exposure is highand then decreases when it approaches steady state (equilibrium between partial gas pressure of alveoliand pulmonary venous blood) after 2–3 h. During the early exposure phase blood levels of VOCsincrease rapidly and then level off (Fig. 2).
The uptake during steady state is different for particular compounds amounting to 90% for aniline,80% for nitrobenzene, 50–70 % for aromatic hydrocarbons like benzene, toluene, xylenes, and 35% forcarbon disulfide [18].
Increase of physical workload results both in the increase of intake and uptake of VOCs. How-ever, the relative effect of an increase of ventilation and cardiac output varies for substances of differentblood/air partition coefficients [19].
2.1.2. Cutaneous absorption (absorption through the skin)
Many chemicals can be absorbed through the skin in toxic amounts, even when airborne concentrationsof the chemical are within legal limits.The significance of percutaneous absorption has probably beenunderestimated in industrial experience and in occupational health practice. VOCs considered to beabsorbed through the skin according to the notation of the German MAK and BAT commission [20] andthe U.S. ACGIH are summarized in Sect. 7, Table 12.
There are two forms of percutaneous absorption: transepidermal (through the epidermal cells)and appendageal (through the hair follices and sebaceous glands). The appendageal route offers greaterpermeability and plays an important role in the diffusion of ions and polar nonelectrolytes. However,the transepidermal route is generally more prominent.
Transepidermal transport occurs by passive diffusion. Penetration experiments have demonstratedthat the stratum corneum behaves like a passive diffusion barrier. The steady-state penetration flux canbe described by the expanded form of Fick’s law [21,22].
In the occupational environment, absorption through the skin occurs mainly as the result of con-tact of liquid compound (e.g., solvents) with the skin. The amount of absorbed compound depends onthe surface of contaminated skin, properties of compound (K
P, constant of permeability) and vehicle.
The rate of absorption of VOC amounts in general from 0.1 to 1.0 mg cm–2 h–1, e.g., benzene 0.4 [23];xylene 0.12 [24]; aniline 0.18– 0.72 [25]; toluene 0.6 [26]; trichloroethylene 0.6 [27].
Vapors may penetrate the skin if they are sufficiently soluble in the horny layer. In the occupa-tional environment such absorption seems of little significance. In the case of xylenes, styrene, toluene,1,1,1-trichloroethane and tetrachloroethylene the total skin absorption of the vapors contributed respec-tively 1.3; 1.4; 1.9; 0.9; and 1.1% of concomitant pulmonary absorption [28]. This route of absorption
Biological monitoring for exposure to volatile organic compounds 395
© 2000 IUPAC, Pure and Applied Chemistry 72, 385–436
is significant in the case of compounds that can be adsorbed on the skin. Absorption of phenol, aniline,and nitrobenzene is roughly proportional to the concentration of vapor in the air and can be character-ized by the absorption coefficient of about 0.2–0.4 m3h–1, which means that exposed subjects can absorbthe amount of compound contained in 0.2–0.4 m3 of air through the skin per hour [18]. Absorption ofdimethylformamide and 2-butoxyethanol vapors through the skin has also been described [29].
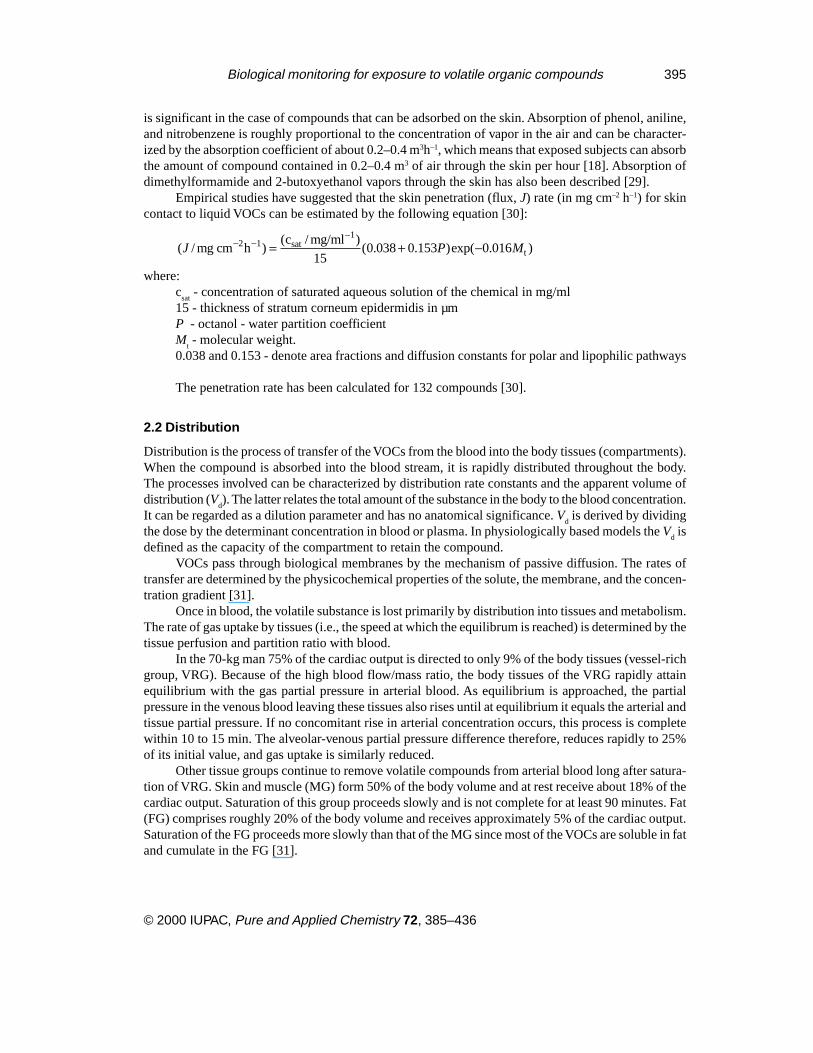
Empirical studies have suggested that the skin penetration (flux, J) rate (in mg cm–2 h–1) for skincontact to liquid VOCs can be estimated by the following equation [30]:
( / )( / )
( . . )exp( . )J P Mmg cm hc mg/mlsat
t- -
-= + -2 1
1
150 038 0 153 0 016
where:c
sat - concentration of saturated aqueous solution of the chemical in mg/ml
15 - thickness of stratum corneum epidermidis in µmP - octanol - water partition coefficientM
t - molecular weight.
0.038 and 0.153 - denote area fractions and diffusion constants for polar and lipophilic pathways
The penetration rate has been calculated for 132 compounds [30].
2.2 Distribution
Distribution is the process of transfer of the VOCs from the blood into the body tissues (compartments).When the compound is absorbed into the blood stream, it is rapidly distributed throughout the body.The processes involved can be characterized by distribution rate constants and the apparent volume ofdistribution (V
d). The latter relates the total amount of the substance in the body to the blood concentration.
It can be regarded as a dilution parameter and has no anatomical significance. Vd is derived by dividing
the dose by the determinant concentration in blood or plasma. In physiologically based models the Vd is
defined as the capacity of the compartment to retain the compound.VOCs pass through biological membranes by the mechanism of passive diffusion. The rates of
transfer are determined by the physicochemical properties of the solute, the membrane, and the concen-tration gradient [31].
Once in blood, the volatile substance is lost primarily by distribution into tissues and metabolism.The rate of gas uptake by tissues (i.e., the speed at which the equilibrum is reached) is determined by thetissue perfusion and partition ratio with blood.
In the 70-kg man 75% of the cardiac output is directed to only 9% of the body tissues (vessel-richgroup, VRG). Because of the high blood flow/mass ratio, the body tissues of the VRG rapidly attainequilibrium with the gas partial pressure in arterial blood. As equilibrium is approached, the partialpressure in the venous blood leaving these tissues also rises until at equilibrium it equals the arterial andtissue partial pressure. If no concomitant rise in arterial concentration occurs, this process is completewithin 10 to 15 min. The alveolar-venous partial pressure difference therefore, reduces rapidly to 25%of its initial value, and gas uptake is similarly reduced.
Other tissue groups continue to remove volatile compounds from arterial blood long after satura-tion of VRG. Skin and muscle (MG) form 50% of the body volume and at rest receive about 18% of thecardiac output. Saturation of this group proceeds slowly and is not complete for at least 90 minutes. Fat(FG) comprises roughly 20% of the body volume and receives approximately 5% of the cardiac output.Saturation of the FG proceeds more slowly than that of the MG since most of the VOCs are soluble in fatand cumulate in the FG [31].

396 R. HEINRICH-RAMM et al.
© 2000 IUPAC, Pure and Applied Chemistry 72, 385–436
2.3 Elimination
There are two basic mechanisms of elimination of VOCs from the body—metabolism and excretion.Metabolism eliminates a substance by converting it into a different chemical, the metabolite. Metabolitesmay undergo further metabolism or are eliminated by an excretory process. Excretion of VOCs and/ortheir metabolites can occur via body fluids (mainly urine, faeces, and expired air) and can be characterizedby the rate of elimination (k
e).
Lipid-soluble compounds are readily reabsorbed in the kidney tubules and are poorly excreted.Only a small fraction, about 1% of the dose of lipophilic aromatic VOCs [32] can be found unchangedin the urine. The main function of metabolism is to transform these compounds into more polar formsthat are readily excreted by the kidneys, mainly as conjugates with glycine, sulfuric acid, and glucu-ronic acid. Some compounds (metabolites) are excreted by glomerular filtration, others by tubular ex-cretion or diffusion. Depending upon the mechanism, the urinary metabolites are related to excretion ofsolids and might be adjusted to creatinine or to density, or to the urine volume without concentrationadjustment.
After termination of exposure the VOCs in unchanged form are excreted mainly in exhaled air.Elimination occurs nearly as a reversal of uptake, the levels drop rapidly at first and then much moreslowly.
Half-life is the most useful parameter to describe the elimination process. As shown from decaycurves, different half-lives can be observed, reflecting fractions from different body stores: an initialfast release from the blood (< 5 min), an intermediate phase in the muscle (min to h), and a longer phasefrom the fat (h up to d). The disparities in half-lives are a function of lipid/water partition coefficientsand of variations of exposure. Extent and length of exposure affect the elimination kinetics, because alonger and more intense exposure will deposit more compound in the adipose compartment. [33]
2.4 Toxicokinetic modeling
Most VOCs appear and disappear rapidly in biological fluids. Modeling of the kinetics of the selectedbiomarker in those VOCs might be helpful in the planning and interpretation of biomonitoring studies,e.g., for selecting sampling time. Toxicokinetic models provide tools to establish a relationship betweenexternal exposure and internal dose. Physiologically based pharmacokinetic (toxicokinetic) models(PBPK) have been developed to describe the time course of a substance in the body, an organ, orcompartment.
Three types of toxicokinetic models, relating available dose and internal dose will be treated inthis paper: Correlation models, compartment models based on data for half-lives (t
½) of substances in
the human body, and physiologically based toxicokinetic multicompartment models (PBPK).It is also possible to simulate the outcome of varying exposure, being either continuous or inter-
mittent. In Fig. 5 the effect of different k (or t½) is illustrated [37,38].
2.4.1 Correlation model
Pulmonary uptake (U) has been demonstrated to correlate with the air/blood partition coefficients andtime of exposure [34,35]. The model has the form:
U = k Kblood/air
t0.5
where k is a constant, Kblood/air
is the blood/air partition coefficient and t the time.

Biological monitoring for exposure to volatile organic compounds 397
© 2000 IUPAC, Pure and Applied Chemistry 72, 385–436
2.4.2 Compartment model
It is possible to construct kinetic models using input (absorption rate) and output (excretion rate) data,where the whole human body is considered as one or more compartments. The complexities of humanphysiology make it difficult to model the exact course of a compound in the body. Compartments aremathematical surrogates without physiological meaning, each compartment being defined by a rateconstant. The number of compartments is usually derived from the number of decays in the experimentaldata. For reason of simplicity, dose rate, cardiac output, and alveolar ventilation rate are assumed constantin a one-compartmental linear model.
A mass balance yield for a one-compartment model and for the dose accumulation phase:
Ú (d d/dt) dt = Vbody
Kblood /air
cair
(1–exp[–ke t])
where d is the dose,Vbody
is the volume of distribution (m3), cair
the concentration in the air inhaled (molem–3), t is the time (h) and k
e is the elimination rate constant.
The elimination curve for a multicompartmental model (i compartments) is described as the sumof the exponential functions:
c(t) = c01
e–k1 t + c
02 e–k
2 t + ... + c
0i e–k
i t
In most cases one- or two-compartment models are sufficient to describe the general kinetics ofVOCs and estimate appropriate sampling time points. It is advisable to take samples during the periodof slow decay rather than fast decay. More elaborate models have applied more compartments, e.g., to
Fig. 5 Effect of half-life (5 h and 50 h, respectively) on changes of biological levels during continuous andintermittent exposure (ordinate is an arbitrary scale for concentration in ambient air and in biological specimens)(according to Droz and Wu [38]).A: continuous exposure to a constant inspired concentrationB: intermittent occupational exposure to a constant inspired concentrationC: intermittent occupational exposure to a fluctuating, inspired concentration

398 R. HEINRICH-RAMM et al.
© 2000 IUPAC, Pure and Applied Chemistry 72, 385–436
describe the decay following p-xylene exposure (Fig. 2) [36].Data on half-lives are available from human volunteer studies and from monitoring people, who
have experienced excessive exposure, e.g., due to accidental spillage. When t½
for a substance is knownthe value of k can be calculated, because k is related to t
½ (assuming first-order kinetics) by the equation:
kt
= ln
/
2
1 2
where ln 2 is the logarithm of 2 (base e).
2.4.3 Physiologically based toxicokinetic model (PBPK)
Physiologically based toxicokinetic models provide a detailed description of a substance in the humanbody. In principal these models include the major organ systems, plus any site of interest, each representinga physiological compartment with its own blood flow, volume, uptake, and elimination process. Thedisadvantages are that they are more complex, need more input data, and cannot be solved analytically[39]. More compartments will give a more detailed description of the kinetics and more accurate result,provided that the large amount of input data for the equation are all of sufficient quality. If data for anadditional compartment are of low quality, it might be wiser not to increase the number of compartments.Consequently, the physiologically based toxicokinetic models found in the literature are of differentcomplexity. Commercial computer programs are available to solve the equations. The value of thesemodels, however, is limited for biomonitoring purposes. They are especially useful for risk assessmentin extrapolating data from animal experiments and estimation of concentrations at target sites. Thesemodels have been used for analysis of dichloromethane inhalation kinetics, carcinogenic risk assessmentof tetrachloroethylene, and regulatory risk assessement and standard setting of other VOCs [40].
2.5 Toxicokinetics and implication for exposure estimation
The application and interpretation of biological monitoring depend upon the sampling strategy, whichmust be based on the toxicokinetic properties of the substance. Generally, the following basic parameterscan be distinguished.
2.5.1 Evaluation of the rate of absorption
The half-life of the chemical in the given compartment of the body is so short that the concentration inbiological media reflects the actual exposure. An example can be the concentration of volatile solventsin blood and exhaled air in samples collected during exposure.
2.5.2 Evaluation of daily exposure
The half-life of the chemical in the body is sufficiently short (e.g., < 5 h) and biological level reflects thedose absorbed on a given day. Toluene, xylenes, and phenol belong to this group. In this case, biologicalmonitoring is useful in industrial toxicology even if the measured levels fluctuate significantly from dayto day. Time of sample collection at the end of exposure is recommended; under practical circumstancesthis will be 15–20 min after termination of exposure [41]. The use of biological monitoring inenvironments other than industry, where the source of exposure has not been identified, could givemisleading results.

Biological monitoring for exposure to volatile organic compounds 399
© 2000 IUPAC, Pure and Applied Chemistry 72, 385–436
2.5.3 Evaluation of cumulative exposure
The half-life of the VOC and its metabolites is very long (e.g., < 50 h), allowing substantial accumulationof the substances. Here, the fluctuations of levels from day to day and within one day are small and,therefore, the exact timing related to the source of exposure is not necessary. Under continuous exposurea steady state is reached after 6 half-lives.
Most VOCs do not belong to either of these classes, having neither very short nor very long half-lives. For substances such as nitrobenzene, trichloroethylene or tetrachloroethylene, biological levelsdepend both on the actual exposure during the day and on the past exposure over the last week.
This situation is common in the case of elimination of organic solvents from the fat tissue. Noneof the situations is usually clear enough to allow proper interpretation of the data without adequateknowledge of the toxicokinetic properties of the substances.
2.5.4 Kinetics in exhaled air
Analysis of exhaled breath/alveolar air can be used for the estimation of exposure to VOCs and might beput forward as biological equivalents to TLVs [42]. End-exhaled-air represents the alveolar airconcentration and mixed-exhaled-air represents the gas mixture coming from the dead space of thebronchial tree and the alveolar gas-exchange space. The mass-balance assumption for alveolar breathconcentrations can be described by:
calv
= f cair
S ai [1 – exp (–t / t
i)]
where calv
alveolar breath concentration, f = fraction of the parent compound exhaled at equilibrium, cair
ambient air concentration, ti = residence time in the compartment i , a
i = fraction of breath concentration
contributed by the compartment i at equilibrium, t = time of exposure and S ai = 1. The residence time
is the time it takes for a chemical to decline to 1/ e of its initial concentration in the compartment. Valuesfor estimates of t
i and f for some VOCs have been provided from inhalation chamber studies [42,43].
The exchange in alveoli is between air and blood. At equilibrium, there is no uptake, and the ratio ofconcentrations in blood and alveolar air is given by the blood/gas partition coefficient. After exposure,the exchange occurs between pulmonary venous blood and alveolar air. The contribution of compartmentsto the venous blood levels and hence alveolar air depends upon the time following exposure, thecompound’s solubility in tissues [16]. The estimated contribution of the main compartments to alveolarair concentration at equilibrium amounted to 30% for blood and fat respectively and 20% for the vessel-rich (VRG) and the vessel-poor groups (VPG) each [36].
The method of breath analysis by collection of exhaled air is noninvasive but bears some limita-tions (cf. Sect. 5.1.3): The VOC concentrations may fluctuate very rapidly and are very sensitive tominor changes in sampling time and preceding breath-holding time. Specifically, concentration differ-ences in mixed-exhaled air, end-exhaled air (alveolar air), and forced-exhaled air have to be taken intoaccount [16]. The risk of contamination reflecting the external air concentrations is always present.Individual variation has to be considered, such as gender, age, body mass index, and the effect ofexercise, since alveolar toluene concentrations tended to be higher in females and under exercise [46].For persons with altered pulmonary function this biomarker may not be suitable.
Recently, attempts have been made to improve sampling and measurement methods for breathanalysis [e.g., 44]. Portable systems have quite recently been applied for population based studies [36]in environmental settings [45].

400 R. HEINRICH-RAMM et al.
© 2000 IUPAC, Pure and Applied Chemistry 72, 385–436
3. SAMPLING AND ANALYTICAL PROCEDURES, FACTORS AFFECTINGUNCERTAINTY COMPONENTS, AND QUALITY ASSURANCE
3.1 Specimen collection
Due to the ubiquitous presence of VOCs in ambient and indoor air, special precautions must be taken toprotect sampling equipment and the specimen from contamination. On the other hand, losses duringspecimen collection, shipping, and storage due to the volatility of the VOC have to be minimized byappropriate procedures.
For the determination of internal exposure to volatile compounds in blood, the following mea-sures have been proven to be suitable:
• Disinfection of the skin with a hydrogen peroxide (H2O
2) solution (3%) or simply soap. Alco-
holic, phenolic, or other disinfectants are unsuitable. Similar precautions have been introducedfor forensic purposes in blood alcohol sampling.
• Blood is taken by venipuncture with stainless steel needle and 10 ml K-EDTA syringe (e.g.,Sarstedt Monovette).
• The blood is transferred by septum puncture, injected into a PTFE (polytetrafluoroethylene) linedrubber-stopped (Bördelcapped) head-space glass vial containing ammonium oxalate or liquidK-EDTA solution gently swirled until the anticoagulant is dissolved.
• The head-space glass vial must be thoroughly cleaned before use, and the vial and the rubberdiaphragm septum heated at 80 °C for at least several days (limited to 80 °C to prevent ammo-nium oxalate decomposition and septum deformation leading to reduced tightness) before cap-ping in an uncontaminated atmosphere (best choice: clean bench with activated carbon-filteredair, automated crimper system).
Applying this procedure, VOC losses or contamination are very unlikely to occur because of theimmediate separation of the blood specimen from the ambient atmosphere. A second advantage is thefact that the analytical procedure of gas chromatographic head-space analysis can be carried out in theidentical vial without further clean-up steps. The samples should be analyzed as soon as possible butexperience has shown that in many cases storage in a refridgerator at +4 °C for one week maximum orup to several months in the freezer at –18 °C is possible without VOC losses. Spiked blood standards foraromatic hydrocarbons (e.g., benzene, toluene, xylenes), chlorinated aliphatic compounds (e.g.,dichloromethane, trichloro-, tetrachloroethylene) as well as for alcohols and ketones in blood (e.g.,methanol, acetone, butanone) can be used for calibration at the µg/l level (mg/l for alcohols and ke-tones) up to several months if stored deep-frozen. The refrigerator or freezer must be uncontaminatedby solvents, standard solutions, etc. which has to be tested by parallel storage of control or blank speci-men. At freezer temperatures, long-time storage with perforated septum, however, should be avoidedbecause of reduced tightness [47]. Shipment of the samples in a cooler to the laboratory should beperformed as soon as possible, preferentially by express mail or courier.
For very low concentrations (ng/l level) concerns for contamination control during all steps ofspecimen handling increase dramatically. Here, anticoagulant, blood collecting apparatus and storagecontainer, blank water, laboratory air and analytical reagents have to be cleaned by special treatmentsbefore being free of VOC traces [48,49].
For urine collection, pre-cleaned (by rinsing with diluted nitric acid followed by ultrapure water)polyethylene screw cap vessels (volume 250 ml or up) are recommended for most VOC metabolites. Ifunchanged VOCs are to be determined in urine (e.g., for alcohols, ketones) an aliquote of the urine hasto be transferred into a head-space vial (without anticoagulant) after voiding.
Biological monitoring for exposure to volatile organic compounds 401
© 2000 IUPAC, Pure and Applied Chemistry 72, 385–436
For controlling contamination during specimen collection and shipping, the following procedureis recommended (field blanks):
A head-space vial filled with uncontaminated 5 ml ultrapure water (or blood with low but knownVOC content) is shipped and analyzed with each batch of the specimen samples. As blank for sampling,head-space vials filled with 15 ml ultrapure water or blood are prepared and for each sampling around10 ml are withdrawn and handled exactly like the blood specimen (see above), including storage andshipment.
3.2 Principles of analytical procedures for VOCs in body fluids and interference factors
The main analytical principle for the analysis of unchanged VOCs in blood and urine is the so-calledhead-space technique (static or dynamic) followed by capillary gas chromatography applying massselective, electron capture, photoionizaton or flame ionization, nitrogen-phosporous selective, or otherdetection. This technique is based on the physical laws by Henry/Dalton that state a proportionalitybetween the VOC blood concentration and the corresponding vapor pressure in a closed compartmentabove the blood specimen (head-space). Injection of an aliquot of this head-space gas from the blood-containing gas-tight vial by an automatic head-space sampler into a gas chromatograph enables theanalyst to estimate the VOC blood content, using an appropriate calibration with VOC-spiked bloodstandards. Due to the high dependence of the vapor pressure on temperature, the blood is incubated at aconstant temperature (approx. 40 to 60 °C) to obtain an increase in the gas-phase VOC concentration.Head-space analysis may also be applied to VOC determinations in urine.
Lower detection limits in the ng/l range for biomonitoring of environmental VOC exposure or forthe evaluation of reference values (cf. Sect. 6) can be achieved as follows: Techniques, such as dynamicmode, with purge-and-trap-technique or possibly by solid-phase microextraction [50,51,52] will in-crease the fraction of VOCs in the specimen that is subjected to gas chromatographic analysis, thusdecreasing the detection limit. These methods have, however, a higher degree of analytical problemsand uncertainty and should be restricted to well-equipped and specially trained scientific laboratories.
Analytical results for VOCs in blood seem to be to some extent dependent on the type of head-space technique applied (purge-and-trap vs. static). Especially for small VOC levels and without usingspecific techniques as shaking, heating of the blood vial, the static head-space results were distinctlylower (approx. 60–80 %) than those with the purge-and-trap technique. There was apparently a fractionof VOCs in blood that was not in immediate equilibrium with the head-space. This was not corrected byspiked blood standards unless they were allowed to equilibrate for a long time period (possibly severalweeks) [53].
Table 3 summarizes important interference factors during a head-space gas chromatographic pro-cedure of VOCs in body fluids. Among the numerous listed interference factors calibration conditionsseem to be one of the most important. In order to prepare blood standards of well-defined µg/l- or evenng/l-concentrations of an organic solvent with high volatility, several dilution/transferring steps have tobe carried out that are prone to systematic errors. The development of a reliable and standardized pro-cedure to prepare matrix calibration standards is highly recommended in this context.
Due to the low VOC levels in blood, direct spiking into blood cannot be performed reliably, anddiluted solutions of VOCs have to be prepared before spiking. Ethanol is an effective solvent for mostVOCs and is used successfully in many laboratories for preparing a VOC stock solution (adding, e.g.,100 µl VOCs to several ml ethanol in a volumetric flask, weighing the exact mass of VOCs and addingethanol to the mark). Ethanolic solutions of VOCs may be directly added to blood in small quantities(e.g., 100 µl to 10 ml blood) with stirring to prevent the blood from deproteinization. Ethanolic VOCsolutions can also be further diluted with physiological saline (aqueous sodium chloride solution,0.9%). This solution is isotonic to blood serum and can be added to blood in any volume without

402 R. HEINRICH-RAMM et al.
© 2000 IUPAC, Pure and Applied Chemistry 72, 385–436
coagulation or deproteinization. Finally, VOC blood standards should be transferred and stored in thosecrimped head-space vials that are used for the analytical measurement. All handling during VOC bloodstandard preparation should be organized in a way to prevent losses due to evaporation, from contami-nation, and from coagulation of the native blood. Baseline VOC levels of the blood used for standardpreparation have to be analyzed and taken into account for the calibration line. These base levels ofVOCs should be kept as low as possible.
Urinary VOC metabolites that are to be quantified for biomonitoring purposes will in generalhave to be separated from the aqueous urinary matrix by clean-up steps such as liquid/liquid extraction,solid-phase extraction, steam distillation, etc. before instrumental analysis. In many cases the metabo-lites have to be released from conjugation with e.g., glucuronic or sulfuric acids, amino acids by hy-drolysis. Especially for gas chromatography, derivatization may be required for the polar metabolites(e.g., carboxylic acids, alcohols, phenols). Thus, the analytical demands differ due to the individualproperties of the corresponding group of metabolites. Table 4 gives an overview of VOC metabolitessuitable for biomonitoring together with their principle of analytical determination.
General interference factors for urinary metabolites are inhomogeneity of matrix due to urinesedimentation and—for conjugated metabolites such as phenols, amines—incompleteness of hydroly-sis to the free analyte. The latter item is of major importance as the conjugated forms are rarely availableas calibrators. Numerous other factors depend on the applied analytical procedure and cannot be dis-cussed in detail here. For VOCs and their metabolites in biological fluids the combined analytical stan-dard uncertainties in general are at best 15 to 30%, depending on the actual concentration. Within theGerman external quality assessement scheme, the tolerance range accepted for the participating labora-tories was ± 39–51% of the assigned value for VOCs in blood and ± 18–30% for VOC metabolites inurine [55]. The assigned value is obtained by analyses in highly qualified reference laboratories, and thetolerance range is the threefold standard deviation of their results.
3.3 Quality assurance
To meet the demands for reliable VOC biomonitoring determinations is not an easy task. The lowanalyte levels require in part complex sample treatment procedures that have to be carried out with ahigh degree of reliability in order to allow an exposure evaluation. An approach widely applied today in
Table 3 Head-space gas chromatographic analysis of VOCs in blood and corresponding interference factors1).
Procedure Interference factors
Blood drawing Contamination by ambient air or disinfection chemicalsTransfer to a gas-tight vial Analyte loss due to high volatilityShipping, storage Analyte loss, contaminationIncubation (e.g., 40 min, 50 °C) Fluctuations in duration and temperature of incubationInjection of a head-space aliquot into the Analyte loss, memory effects, thermal discrimation of mixtures
gas chromatographSeparation of the gas mixture Insufficient separation, coelutionAnalyte detection Selectivity, linearity, sensitivity of the detectorCalibration Matrix effects, preparation of standards, analyte loss during
standard preparation, selection of an emulsifier, primary VOCcontent of matrix
Calculation of the analytical result Peak area quantification, extrapolation/range of linearity(electron capture detection)
1)interference factors include all factors that alter the result in vitro (accord. to [54])

Biological monitoring for exposure to volatile organic compounds 403
© 2000 IUPAC, Pure and Applied Chemistry 72, 385–436
order to achieve, maintain, and document the quality of the work of a biological monitoring laboratoryis the adoption of a quality management program [56–58]. Traditional internal quality control andexternal quality assurance are important parts of the quality management. The following measuresshould be applied for quality assurance:
• Give an exact protocol about the person’s working time and the individual exposure situation(e.g., workload, skin contact to VOCs, time of specimen collection with respect to the exposure)
• standardize all procedures during the pre-analytical phase that cannot be controlled by classicalquality control (see below) including conditions of specimen collection, shipping, and storage,
• work out and follow strictly a validated method, e.g., a Standard Operation Procedure (SOP) forthe complete analytical procedure of the VOC determination in body fluids. The U.S. BEI com-mittee refers to appropriate analytical procedures described in the literature in their BEI docu-ments [74]. Analytical procedures for selected VOCs are mentioned by the WHO [11]. Numerous
Table 4 Examples of important VOC urinary metabolites and their analytical determination.
VOC Metabolite/example Principle of Analyticalclean-up determination
Aromatic hydrocarbons Phenols/ o-cresol, Hydrolysis, steam distillation, RP-HPLC/UV2)
dimethylphenols, phenol SPE-RP1), extractive GC/ECD3)
derivatization
Carboxylic acids/ Extraction RP-HPLC/UVmandelic; t,t-muconic acid SPE-anion exchange
Aliphatic hydrocarbons Ketones/ Hydrolysis, SPE-cation GC/FID5)
2,5-hexanedione4) exchange, SPE-XAD
Chlorinated hydrocarbons Alcohols, phenols/ Hydrolysis, extraction RP-HPLC/UV4-chlorocatechol; steam distillation, SPE-RP, GC/ECDchlorophenols extraction, derivatization GC/MSD6)
Glycol ethers Alkoxyacetic acids/ Pre-extraction of matrix, GC/ECDEthoxyacetic acid derivatization, SPE-
adsorption7)
Dimethylformamide Methylformamide8) Extraction GC/NPD9)
Carbon disulfide 2-Thioxothiazolidine-4- Extraction RP-HPLC/UVcarboxylic acid
1) SPE-RP solid-phase extraction-reversed phase2) RP-HPLC/UV reversed phase high-performance liquid chromatography with UV detection3) GC/ECD gas chromatography/electron capture detection4) Sum of 2,5-hexanedione and 4,5-dihydroxy-2-hexanone5) GC/FID gas chromatography/flame ionization detection6) GC/MSD gas chromatography/mass selective detection7) SPE-adsorption solid-phase extraction-adsorption chromatography8) Sum of N-methylformamide (NMF) and N-hydroxymethyl-N-methylformamide (DMF-OH).9) GC/NPD gas chromatography/nitrogen selective detection
404 R. HEINRICH-RAMM et al.
© 2000 IUPAC, Pure and Applied Chemistry 72, 385–436
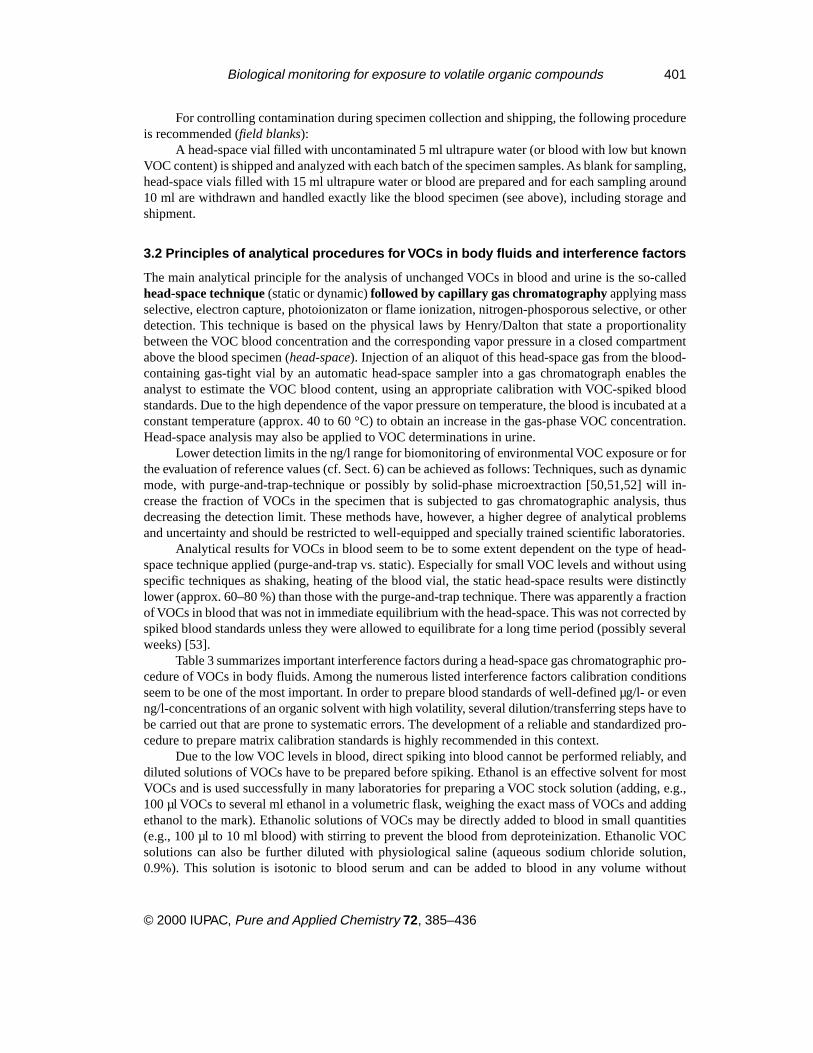
examples of SOPs for the quantification of VOCs and their metabolites in body fluids can befound in the collection of analytical methods by the MAK and BAT committee of the GermanScience Foundation [59]. These publications contain a set of reliable experimentally validatedanalytical procedures with sufficient specificity and sensitivity as well as practicability for theinvestigation of large groups of exposed persons.
• Establish a well-performing system of internal and external quality control. Unfortunately, thereare no commercially available control materials for VOCs in body fluids up to now so that eachlaboratory engaged in this field has to prepare its own. For selected urinary metabolites, spikedmatrix standards with assigned values of metabolite content can be purchased (e.g., Lyphochek byBioRad, ClinRep by Recipe, Munich/Germany). For the most important external quality controlthere exist several international schemes for VOCs and their metabolites in body fluids (Table 5)in concentrations relevant to occupational medicine.
4. UNCERTAINTY OF VOC ANALYSIS IN BODY FLUIDS
The result of a measurement is always an approximation of the true values. Therefore, when reportingresults of unchanged volatile organic compounds and/or their metabolites in biological fluids, it is nowaccepted that it is essential to give some quantitative indication of the uncertainty. The uncertainty of a
Table 5 International external quality assessment schemes for VOCs and their metabolites in body fluidsaccording to [60–64].
VOC/metabolite Body fluid Organization/Nation
Benzene Blood DGAUM1)/GermanyDichloromethane Blood DGAUM/GermanyEthylbenzene Blood DGAUM/GermanyTetrachloroethylene Blood DGAUM/GermanyToluene Blood DGAUM/GermanyTrichloromethane Blood DGAUM/GermanyTrichloroethylene Blood DGAUM/GermanyXylenes Blood DGAUM/GermanyButoxyacetic acid Urine DGAUM/Germanyo-Cresol Urine DGAUM/GermanyEthoxyacetic acid Urine DGAUM/Germany2,5-Hexanedione Urine FIOH2)/Finland JFOHO3)/JapanHippuric acid Urine DGAUM/Germany JFOHO/Japan KISCO4)/KoreaMandelic acid Urine DGAUM/Germany JFOHO/Japan FIOH/FinlandN-Methylformamide Urine DGAUM/Germany JFOHO/JapanMethylhippuric (toluric) acids Urine DGAUM/Germany JFOHO/Japan FIOH/Finlandtrans, trans-Muconic acid Urine DGAUM/GermanyPhenol Urine DGAUM/Germany FIOH/FinlandPhenylglyoxylic acid Urine DGAUM/Germany2-Thioxo-4-thiazolidine- Urine DGAUM/Germany
carboxylic acid (TTCA)Trichloroacetic acid Urine DGAUM/Germany JFOHO/Japan FIOH/Finland
1)Deutsche Gesellschaft für Arbeitsmedizin und Umweltmedizin/German Society of Occupational and EnvironmentalMedicine; Institute of Occupational, Social and Environmental Medicine at University Erlangen/Nuremberg, Germany2)Finnish Institute of Occupational Health; 3)Japan Federation of Occupational Health Organizations; 4) Korea IndustrialHealth Corporation

Biological monitoring for exposure to volatile organic compounds 405
© 2000 IUPAC, Pure and Applied Chemistry 72, 385–436
measurement result is an estimate of the limits between which the results are expected to vary with astated confidence level. It may be expressed as a standard deviation, the half-width of a confidenceinterval. Without such an indication it is not possible to compare biological measurement results, nor toassess the reliability of the result and the confidence that can be placed in any decision based on its use[65]. Furthermore, the EN 45000 [58] and ISO/IEC Guide 25 [56] require that the laboratory has estimatedthe uncertainty of the method included in the accreditation [66].
A basic premise of the uncertainty concept is that it is composed of contributions from manydifferent sources, so-called uncertainty components [67,68]. Uncertainty components are classifiedaccording to the method of evaluation: Type A describes a standard uncertainty evaluated by statisticalanalysis of series of observations, and Type B describes those uncertainty components that are evalu-ated by other means, i.e., evaluation from the literature data, from data obtained by other means or fromdata judged by an expert. The estimation procedure gives valuable information to the laboratory of theuncertainty components, which influence the total uncertainty of a measurement: The laboratory maybe able to improve the performance by reducing or eliminating the largest uncertainty component [69].
When estimating the total uncertainty of a measurement, all uncertainty components should beevaluated and assigned an uncertainty. They include preanalytical factors; sampling and transportation,preservation, matrix effects, dilution of the sample, calibration, etc. However, the preanalytical factorsare often complicated or impossible to estimate. In many cases, it is possible to reduce their contribu-tions by appropriate instruction and training. Those preanalytical factors that contribute with more than1/5 of the largest uncertainty component must be included in the uncertainty. The factors before sam-pling may often influence the result much more than the uncertainty of measurement, but they are notincluded in the estimation. Table 6 lists uncertainty components related to biological VOC-measure-ment results.
The uncertainty components are quantified using data from internal control charts, experimentaldata from method validation, reference materials or external quality assessment schemes, informationfrom the literature, etc. Measurement results should be corrected for known systematic effects. The totalstandard uncertainty of a VOC measurement result is then obtained by combining the standard uncer-tainties of the components according to the rules of combining variances. An expanded uncertainty isobtained by multiplying the combined standard uncertainty by a coverage-factor k. The choice of thefactor k is usually 2 or 3, based on the level of significance. In the case of a normal distribution, thefactor k = 2 means that limits of the overall uncertainty have a confidence level of approximately 95%.
5 BIOMONITORING OF EXPOSURE
In principle, two different types of exposure can be found for VOCs:In environmental settings, the exposure profile is often unknown. Therefore, a qualitative over-
Table 6 Type of uncertainties associated with biological VOC measurement results.
Sampling Calibration Analytical procedure
Nonrepresentative sampling Calibrator concentration and purity Definition of the measured entityContamination Analytical variability Volumetric equipmentDegradation/synthesis Nonrepresentative matrix Matrix effects, e.g.,
anticoagulants, hemolysisLoss by adsorption Nonlinearity of calibration function Specificity
Statistical estimation of the calibration Environmental factorsfunction

406 R. HEINRICH-RAMM et al.
© 2000 IUPAC, Pure and Applied Chemistry 72, 385–436
view of the VOCs present in the body fluids of the study group might be of interest before selectingVOCs for a quantitative analysis. Environmentally caused VOC levels are at least one order of magni-tude lower compared to occupational limit values in biological material (cf. Section 6, 7). Kinetic influ-ences are often not as distinct as in occupational settings where comparatively higher and fluctuatingexposure levels are to be expected.
At the workplace a typical VOC profile in body fluids starts with an initial increase in VOC leveloften followed by a steady state with nearly constant VOC level. After the end of exposure at work VOClevel decreases due to elimination by excretion and metabolism. In industry, VOC exposure is in generalwell characterized. Quantitative analysis of VOC levels in body fluids, the evaluation of thesebiomonitoring results with established occupational limit values are the main points of interest in theindustrially applied biomonitoring.
In the following section different approaches for biomonitoring of VOC exposure will be pre-sented and discussed along with their advantages and limitations in practical application.
5.1 Volatile organic compounds (VOCs)
5.1.1 VOCs in blood
The determination of the unchanged volatile organic compounds in blood is specific. For the majorityof the VOCs, they are not physiologically present in body fluids. Environmentally caused base bloodlevels lie in the ng/l range for most of the important industrial solvents in the aromatic hydrocarbons,and chlorinated aliphatic hydrocarbons classes. One of the VOC’s target organs is the central nervoussystem, because of its high perfusion and the usually high lipophility of VOCs, resulting in prenarcoticsymptoms during chronic exposure. VOCs in blood reflects the individual internal load and potentialCNS toxicity. This response is caused by the unchanged VOC and in general not by its metabolites.
The VOC level in blood is appropriate for biomonitoring nearly every VOC except for esters ofcarboxylic acids (e.g., ethyl acetate). These esters undergo rapid enzymatic hydrolysis by ester cleavageinto carboxylic acid and alcohol with half-lives of a few minutes [70]. Because of the high stability ofthe esterases this reaction might even continue in vitro after blood collection. A better choice for esterbiomonitoring would be to estimate the released alcohol moiety.
Another advantage of determining unchanged VOCs lies in the fact that due to the volatility of thesubstances the same analytical approach (head-space technique in combination with capillary gas chro-matography, cf. Sect. 3) allows the simultaneous quantification of all VOCs of interest in one bloodspecimen (at least if applying an universal detection system such as mass spectrometry). This is ofspecial interest for biomonitoring as occupational and environmental VOC exposure is characterized bycomplex mixtures of sometimes unknown composition.
A main drawback is its high dependence on the usually fast elimination kinetics of the VOC (cf.Sect. 2). With elimination half-lives of minutes to a few hours it is obvious that a specimen collectionstrategy and protocol has to be strictly followed for interpretation of a VOC quantification in blood. Thisis of utmost importance for fluctuating exposure profiles at work sites. Environmental exposure (e.g.,indoor atmosphere) might be characterized by a more steady ambient VOC content.
Three principle approaches in specimen collection points can be found in the literature:
• during exposure,• at the end of exposure,• a defined time period after end of exposure.
The first approach might be used in experimental studies as well as for environmental exposurebut is by far less acceptable for a systematic monitoring program at work sites because of hygienic,work processing, and other practical reasons. For occupational exposure, specimen collection at the end

Biological monitoring for exposure to volatile organic compounds 407
© 2000 IUPAC, Pure and Applied Chemistry 72, 385–436
of the shift (second possibility) and—to a lesser degree—after a given time after exposure (third) isfrequently used and is recommended in many biomonitoring guidelines (e.g., BAT and BEI values, cf.Sect. 7 [71–74]).
As pointed out in Section 2, elimination of VOCs from blood might be the result of several half-lives (cf. Fig. 3). It should be clearly stated here that the very short initial elimination phase with half-lives of several minutes, as found in experimental settings, is not covered in biomonitoring practice.After a lag of some 15 min the second phase of VOC elimination starts with half-lives of several hours.Blood collection should be done during that time period.
For half-lives of a few hours (second phase of elimination), the BAT refers to the blood level at theend of the shift (e.g., dichloromethane, styrene, toluene, xylenes), whereas for accumulating substances(e.g., tetrachloroethylene, 1,1,1-trichloroethane) sampling should be performed prior to the followingshift. In the latter case, the elapsed time from end of exposure to specimen collection is related to VOClevels in different body compartments. In the case of tetrachloroethylene, the increasing half-lives (t
½ of
the I, II and III phase of elimination amounting to about 1.5 h, 9 h and 56 h respectively) are reflectingconcentrations in blood, blood-rich organs such as brain, heart, liver, kidney, muscles, and fatty tissue,and less drained tissues such as cartilage and bones [75–77].
From the analytical point of view it might be advisible to choose the time of specimen collectionwith the highest VOC content—usually at the end of exposure especially for low VOC levels such asbenzene in blood. Today, benzene air concentrations at the workplace are about 1 ppm (at least in thedeveloped countries) causing benzene blood levels range at or below 5 µg/l. This is already of the sameorder of magnitude as the limit of determination for static head-space technique capillary gas chroma-tography. A change to the more sensitive dynamic head-space technique (cf. Sect. 3), however, wouldlead to a decrease in analytical accuracy due to the still high rate of interference for this analyticalprocedure.
Specimen collection at a defined period of time after the end of exposure might be less affected bysmall variation in timing, but there are very few VOC guidelines reported in the scientific literature thatcould be adopted for the evaluation of quantitative VOC body fluid levels. VOC concentrations in speci-mens collected after a definded period of exposure are influenced more by factors such as body fat,exercise, and smoking, since these specimens represent release (washout) from the fat compartment. Inaddition, exact kinetic parameters for the VOC elimination are generally unknown. Any extrapolation toother times after exposure is therefore impossible (with only few exceptions as, e.g., ethanol, tetrachlo-roethylene). Reconsideration is recommended if in future agreements a defined period of time after endof exposure (e.g., 15–20 minutes) should replace the present approach of end of exposure samplingbecause of the rapid decrease within the first few minutes after termination of exposure.
5.1.2 VOCs in urine
VOCs in urine is especially suitable for short-chain alcohols and ketones as they possess a high-to-medium water solubility. Thus, they are easily excreted in the urine without metabolism by a simplediffusion process (examples: acetone, 2-butanone, methyl isobutyl ketone, methanol). In many cases,determination of alcohols and ketones in urine is specific for exposure (no metabolic transformation),but in some cases (as for acetone) a high urinary base level exists, and the substance may also be formedby biotransformation of other VOCs (acetone is a metabolite of 2-propanol). Because the urinary specimenreflects a sampling period of several hours, it is correlated with the absorbed dose for specimens collectedat the end of exposure. Compared to VOCs in blood, kinetic influences are distinctly lower for VOCexcretion in urine. Other positive analytical aspects of biomonitoring are noninvasive urine collection,in contrast to blood venipuncture, and a higher concentration for the water-soluble VOCs in urine thanin blood (mg/l for the stated examples).

408 R. HEINRICH-RAMM et al.
© 2000 IUPAC, Pure and Applied Chemistry 72, 385–436
While excretion of unchanged VOCs is related to the urine/blood partition coefficient and tourinary volume, urinary concentrations VOC metabolites are significantly influenced by kidney func-tions, drinking habits, sweating, etc. To overcome this problem adjustment to either urinary density orcreatinine content in urine has been recommended in the literature [78–81]. Generally, before applyingany adjustment for urine concentration, the user should establish that a closer relationship exists be-tween the adjusted metabolite concentration in urine and the air concentration for the individual VOC.This is best accomplished through experimental or field studies. The German BAT group, and the U.S.BEI committee have established certain biological action levels with creatinine adjustments (cf. Table12, Sect. 7). Examples are BEIs for carbon disulfide, chlorobenzene, ethylene glycol ethers, n-hexane;BAT values for 4-chlorocatechol excretion after chlorobenzene exposure. It is suggested that spontane-ous urinary specimens with extreme relative densities (higher than 1.024 or less than 1.010) or creati-nine concentration less than 0.5 g/l or higher than 2.5 g/l should be excluded from analysis in order toprevent the analyst and physician from misinterpretation (e.g., in case of altered renal function).
VOC excretion in urine has been recommended for biomonitoring purposes by few scientificgroups [82–86] for other chemical classes of VOCs (e.g., aromatic and chlorinated hydrocarbons).Arguments for this are the noninvasive specimen collection, the minor kinetic influences in comparisonwith the VOC levels in blood, and the simultaneous quantification of mixture compounds in a singleurine sample. Arguments against the use of VOCs in urine include (1) the small percentage of lipophilicVOCs excreted in the urine, (2) increased analytical requirements necessary to detect these low levels,(3) high probablity of VOC loss during the pre-analyical phase, and (4) more complex sample handling[87]. Table 7 shows blood and urinary concentrations for some VOCs at ambient air concentrations ofthe actual German MAK levels and demonstrates that distinctly higher blood concentrations are ob-served at the same time of specimen collection.
5.1.3 VOCs in exhaled air
The main advantage of VOCs in exhaled air is the noninvasive specimen collection. In addition, specificitycan be assumed as the unchanged VOCs are measured. Drawbacks, however, are as follows: (1) practicaland analytical deficiencies with sampling, shipping, and storage of alveolar air. Recently considerableattempts have been undertaken to overcome these preanalytical difficulties [43–45] for environmentalpopulation studies. (2) For persons with altered pulmonary function, systematic errors in the specimencollection process might occur that are caused by the individual and cannot be eliminated by improvedanalytics. (3) Elimination in alveolar air is as highly affected by toxicokinetic influences as blood, sosampling time recommendations have to be followed very strictly. (4) In general, measurement of VOCs
Table 7 Comparison of blood and urinary VOC concentrations corresponding to actualGerman MAK values [71] at end of shift. Blood concentrations refer to German BAT values[71] while urinary concentrations were calculated with quantitative relationships betweenurinary and environmental concentrations for occupational exposure by Pezzagno et al. [83].
VOC in blood VOC in urineVOC MAK value 1998 (BAT 1998) acc. to [83]
ml/m3 µg/l µg/lToluene 50 1000 110Xylenes 100 1500 170Tetrachloroethylene 50 1) 1000 1) 2) 1251,1,1-Trichloroethane 200 550 2) 550
1) MAK /BAT values valid until 1996; tetrachloroethylene will then be classified as carcinogen.2) Time of specimen collection: 16 h after shift (prior to next shift)

Biological monitoring for exposure to volatile organic compounds 409
© 2000 IUPAC, Pure and Applied Chemistry 72, 385–436
in exhaled air is not as sensitive to exposure as measurement of VOCs in blood. Applying the currentlyavailable methods to similar environmental exposure scenarios, breath measurements tend to reportmore non-detects than blood mesurements. This is especially true with very low level exposures [53].Summarizing, this biomarker can be recommended only to a limited degree.
5.2 VOC metabolites
5.2.1 VOC metabolites in urine
Metabolite excretion may be a superior parameter for biological monitoring if the relevant toxicity ofthe exposure chemical is caused by the metabolite or its precursor and not by the unaltered chemicalitself. Examples for this situation are: 2,5-hexanedione for n-hexane exposure, ethoxyacetic acid forethylene glycol ethers. Other advantages, due to the urine sampling period and to longer half-lives ofmany VOC metabolites, are a more integrative measure for exposure compared to the VOC concentrationin blood. Blood reflects the actual exposure level shortly before specimen collection (e.g., toluric acidsin urine/xylenes in blood). Other examples for VOC metabolites suitable for biomonitoring may befound in Table 12 in Sect. 7. For practical biomonitoring purposes, the amount of VOC metaboliteexcreted must be in sufficient quantity to detect and must exceed background levels in a non-exposedpopulation. VOC metabolite levels are, in general, not affected by determinant loss or contaminationduring preanalytical phase and clean-up. The analytical requirements for the metabolites’ quantificationdiffer to a large degree on the excreted amount, chemical properties of the metabolite (in vitro stability,polarity, etc.) (cf. Sect. 3).
The following disadvantages have to be stated: Unspecificity in terms of either an observed “base”level for unexposed persons or because the metabolite may be formed by several exposure chemicalsindependently. In the first case (example: hippuric acid) details of the quantity of “normal” physiologi-cal excretion (reference values, upper reference limit as defined by IUPAC ComTox and IFCC [88,89])have to be known for an appropriate interpretation of biological data in relation to the exposure situa-tion. In the second case (example: mandelic acid that occurs as a metabolite after styrene as well asethylbenzene exposure) and for complex exposure situations an additional, specific parameter (the VOClevel in blood) may be required. Table 8 gives a short overview about specificity of urinary VOC me-tabolites commonly applied in biomonitoring.
5.2.2 VOC metabolites in blood
In some cases metabolite levels in blood may be more relevant for biological monitoring than those inurine. Carbon monoxide is a metabolite of dichloromethane and the portion of COHb(carboxyhemoglobin) reflects the internal dose of dichloromethane as well as its health impact. 2,2,2-Trichloroethanol seems to be responsible for the central nervous symptoms caused by trichloroethyleneas the parent substance. With the brain as the target organ, blood levels of 2,2,2-trichloroethanol reflectits brain concentration and are thus more relevant to neurotoxicity than urinary metabolite levels [90].
5.3 Other
For some VOCs, biological effect parameters can be applied for exposure effects in addition to dosemonitoring (example among the VOCs: induced elevated Met-Hb levels for aromatic amines or nitrocompounds). BEI values for aniline and nitrobenzene exposure refer to Met-Hb levels of 1.5%.
Another approach of biological monitoring is the use of VOC adducts to macromolecules, namelyprotein adducts—especially those of hemoglobin or albumin. Several examples for corresponding BAT/

410 R. HEINRICH-RAMM et al.
© 2000 IUPAC, Pure and Applied Chemistry 72, 385–436
EKA values after VOC exposure may be found in Table 12 (cf. Sect. 7). For aromatic amines (e.g.,aniline) and nitro compounds (e.g., nitrobenzene) nitroso-metabolites bind to thiol groups of hemoglo-bin. The resulting sulfinic acid amide hemoglobin conjugate remains stable in vivo for erythrocyte lifetime (approx. 120 days) [91]. In vitro, the conjugate may be cleaved after erythrocyte isolation byalkaline hydrolysis to release the parent compound (e.g., aniline) that can be determined by gas chro-matography/mass spectrometry analysis after clean-up.
Table 8 Specificity of urinary metabolites of selected VOC applied for biomonitoring.
MetaboliteVOC Urinary metabolite specificity Remark
benzene phenol low* diet, metabolite ofaromatic amino acids
trans, trans-muconic acid medium metabolite of sorbic acid(preservative)
S-phenylmercapturic acid high
toluene hippuric acid low* diet, sodium benzoate(preservative)
o-cresol high
xylenes methylhippuric acids highdimethylphenols high
ethylbenzene mandelic acid mediumphenylglyoxylic acid medium metabolite formation by
styrene mandelic acid medium styrene and ethylbenzene1)
phenylglyoxylic acid medium
1,1,1-trichloroethane trichloroacetic acid medium metabolite formation bytetrachloroethylene trichloroacetic acid medium several chlorinated hydro-trichloroethylene trichloroacetic acid medium carbons
vinyl chloride thiodiglycolic acid low-medium metabolite formation byseveral VOCs (e.g., 1,2-dichloroethane) and drugs(carbocysteine)
ethylene glycol ethoxyacetic acid highmonoethyl ether
n-hexane 2,5-hexanedione (total) medium metabolite formation in vitroby physiologically excretedprecursors
isopropyl alcohol acetone medium physiological acetoneexcretion
1)This fact has no practical implication for occupational settings as coexposure of styrene and ethylbenzene seems not tooccur.* This VOC metabolite is not recommended to be used in practical biomonitoring mainly because of its low specificity andsensitivity.

Biological monitoring for exposure to volatile organic compounds 411
© 2000 IUPAC, Pure and Applied Chemistry 72, 385–436
For alkylating compounds (e.g., acrylonitrile), a specific terminal hemoglobin adduct of the par-ent compound is released by derivatization in vitro (so-called Edman-degradation). The resulting sub-stituted amino acid (cyanoethylvaline) can be quantified by instrumental analysis.
These protein adduct levels might be related closer to the relevant “target dose” than the VOCs inblood, for instance. The link between protein adduct level and risk assessment which would be veryhelpful especially for carcinogenic compounds has, however, not yet been established.
5.4 Evaluation of exposure to mixtures
In many industrial settings as well as for environmental exposure situations persons are exposed tocomplex VOC mixtures. They are of different and changing compositions. Two common practicalapproaches for applying biological monitoring for VOC mixture exposure exist:
• Single VOC measurement in human biological material and interpretation as a so-called “leadingcompound”,
• “fingerprint” measurements of VOC mixtures in body fluids as a qualitative assessment.
Both approaches are inadequate from the toxicological point of view. For most solvent combina-tions that are present at work sites we either do not know their combinated toxicology, or whethersynergistic toxicological mechanisms exist that would exclude this approach (e.g., butanone/ n-hexaneor 2-hexanone) [92,93].
In industrial hygiene it is common practice to add up the fractions of mixture compounds inrelation to airborne limit values and conclude occupational safety if the sum of these fractions is below1. A similiar approach has been suggested by Ogata [94] for biological monitoring assuming no interac-tion at all. This proposal cannot be recommended because mixture components may possess diversetoxicological profiles including different target organs, kinetics, and possible synergistic effects (seeabove for examples).
5.5 Influence factors on biomonitoring results after VOC exposure
Influence factors are defined according to the International Federation of Clinical Chemistry (IFCC)and affect the biomonitoring results in vivo [54]. Their impact on VOC biomonitoring data is consideredto be quite high. Some of the most important ones, such as kinetics, lack of specificity of urinarymetabolites, nutritional influences on base levels, lifestyle factors (smoking, ethanol consumption, drugs),and different urinary dilution have already been mentioned above (cf. Sect. 2 to 5.3). Other importantinfluence factors might be induction or inhibition of VOC metabolizing enzymes and geneticpolymorphism of specific enzymes.
Studies of experimental animals exposed to very high VOC concentrations point to a possibleinfluence of enzymatic induction or competitive inhibition on the toxicity and metabolism of VOCs [95,96]. It was suggested that the induction or inhibition of microsomal enzymes may also affect the resultsof biological monitoring of exposure.
In vivo, the extent of hepatic metabolism of chemical substances is determined by the relationbetween the metabolic clearance and the hepatic blood flow [97]. At current exposures occuring inoccupational environments, hepatic blood flow rate limits the metabolism. This might lead to the im-pression that enzyme induction might not be of major importance for the current industrial exposuresituation. This conclusion, however, does not take into account the relevant contributions of extrahe-patic metabolism/phase II enzymes to the overall metabolic clearance.
Metabolic interactions—although very common in practice—have not been studied in a system-atic and comprehensive manner according to literature data, possibly because the combinations of the

412 R. HEINRICH-RAMM et al.
© 2000 IUPAC, Pure and Applied Chemistry 72, 385–436
chemicals are large and the exposure intensities vary greatly. There is, however, a set of experimentalstudies with human volunteers as well as a limited number of field studies available. Table 9 summa-rizes data on experimental studies of combined VOC exposure and effects on metabolism.
Field studies for effects on VOC metabolism after combined exposure mostly for aromatic hydro-carbons [107–114] are summarized in Table 10.
Table 9 Experimental exposure of volunteers to solvent mixtures: effects on metabolism [98] (either themaximum non-effective dose or the minimum effective dose is given when two or more concentrations weretested).
Combination Effect References
25 ppm1) benzene + 100 ppm toluene No change in clearance Sato and Nakajima (1979) [99]
66 ppm toluene + 21 ppm p-xylene No effect on both Wallen et al. (1985) [100]
50 ppm toluene + 40 ppm m-xylene No effect on both Tardif et al. (1993) [101]
95 ppm toluene + 80 ppm m-xylene Mutual metabolic Tardif et al. (1993) [101]suppression
200 ppm m-xylene +400 ppm No effect on both Savolainen et al. (1981) [102]1,1,1-trichloroethane
150 ppm m-xylene Mutual metabolic Engström et al. (1984) [103]+ 150 ppm ethylbenzene suppression
100 ppm m-xylene Decrease in m-xylene Liira et al. (1988) [104]+ 200 ppm 2-butanone metabolism, but no effect
on that of 2-butanone
71 ppm m-xylene + 69 ppm toluene No effect on xylene Jakubowski and Kostrzewskimetabolism (1989) [105]
69 ppm m-xylene Increase in xylene Jakubowski and Kostrzewski+ 72 ppm n-butyl acetate metabolism (1989) [105]
49 ppm m-xylene Increase in xylene Jakubowski and Kostrzewski+ 46 ppm n-butyl acetate metabolism (1989) [105]
69 ppm m-xylene + 68 ppm n-hexane No effect on xylene Jakubowski and Kostrzewskimetabolism (1989) [105]
69 ppm m-xylene + 69 ppm n-butanol No effects on xylene Jakubowski and Kostrzewskimetabolism (1989) [105]
46 ppm m-xylene + 45 ppm toluene No effects on xylene Jakubowski and Kostrzewskimetabolism (1989) [105]
72 ppm styrene + 517 ppm acetone No effect on styrene Wigaeus et al. (1984) [106]metabolism
1) ppm: ml/m3
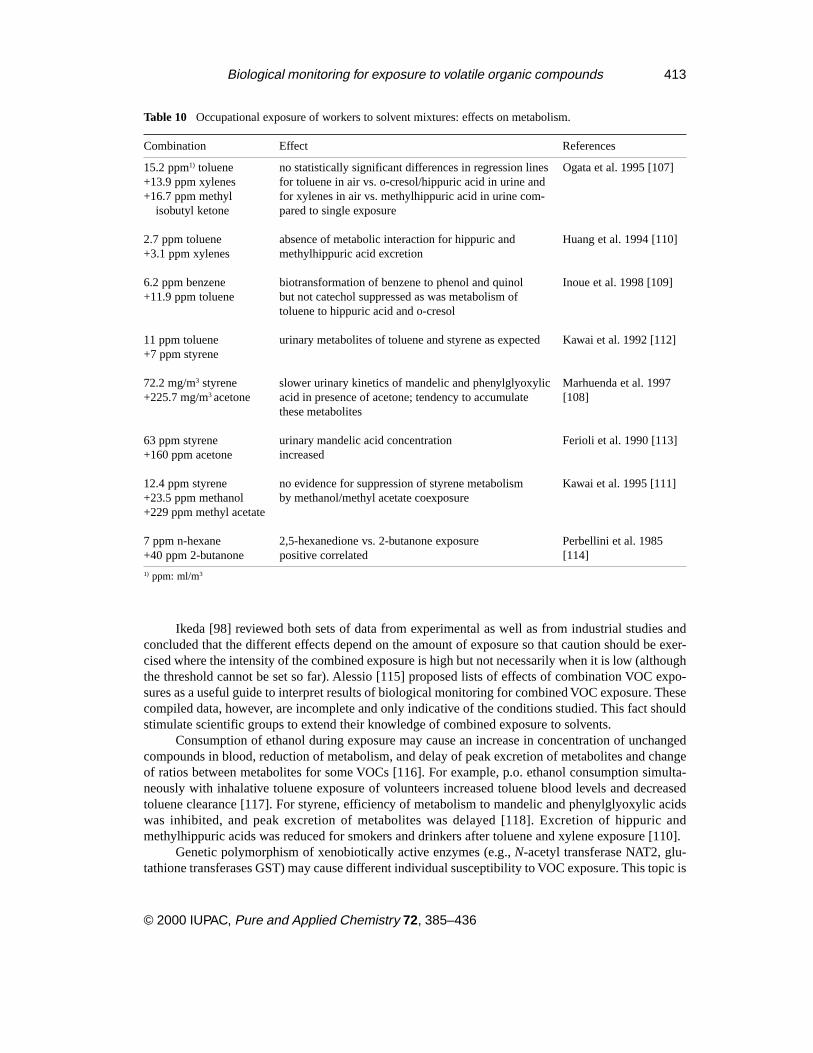
Biological monitoring for exposure to volatile organic compounds 413
© 2000 IUPAC, Pure and Applied Chemistry 72, 385–436
Ikeda [98] reviewed both sets of data from experimental as well as from industrial studies andconcluded that the different effects depend on the amount of exposure so that caution should be exer-cised where the intensity of the combined exposure is high but not necessarily when it is low (althoughthe threshold cannot be set so far). Alessio [115] proposed lists of effects of combination VOC expo-sures as a useful guide to interpret results of biological monitoring for combined VOC exposure. Thesecompiled data, however, are incomplete and only indicative of the conditions studied. This fact shouldstimulate scientific groups to extend their knowledge of combined exposure to solvents.
Consumption of ethanol during exposure may cause an increase in concentration of unchangedcompounds in blood, reduction of metabolism, and delay of peak excretion of metabolites and changeof ratios between metabolites for some VOCs [116]. For example, p.o. ethanol consumption simulta-neously with inhalative toluene exposure of volunteers increased toluene blood levels and decreasedtoluene clearance [117]. For styrene, efficiency of metabolism to mandelic and phenylglyoxylic acidswas inhibited, and peak excretion of metabolites was delayed [118]. Excretion of hippuric andmethylhippuric acids was reduced for smokers and drinkers after toluene and xylene exposure [110].
Genetic polymorphism of xenobiotically active enzymes (e.g., N-acetyl transferase NAT2, glu-tathione transferases GST) may cause different individual susceptibility to VOC exposure. This topic is
Table 10 Occupational exposure of workers to solvent mixtures: effects on metabolism.
Combination Effect References
15.2 ppm1) toluene no statistically significant differences in regression lines Ogata et al. 1995 [107]+13.9 ppm xylenes for toluene in air vs. o-cresol/hippuric acid in urine and+16.7 ppm methyl for xylenes in air vs. methylhippuric acid in urine com-
isobutyl ketone pared to single exposure
2.7 ppm toluene absence of metabolic interaction for hippuric and Huang et al. 1994 [110]+3.1 ppm xylenes methylhippuric acid excretion
6.2 ppm benzene biotransformation of benzene to phenol and quinol Inoue et al. 1998 [109]+11.9 ppm toluene but not catechol suppressed as was metabolism of
toluene to hippuric acid and o-cresol
11 ppm toluene urinary metabolites of toluene and styrene as expected Kawai et al. 1992 [112]+7 ppm styrene
72.2 mg/m3 styrene slower urinary kinetics of mandelic and phenylglyoxylic Marhuenda et al. 1997+225.7 mg/m3 acetone acid in presence of acetone; tendency to accumulate [108]
these metabolites
63 ppm styrene urinary mandelic acid concentration Ferioli et al. 1990 [113]+160 ppm acetone increased
12.4 ppm styrene no evidence for suppression of styrene metabolism Kawai et al. 1995 [111]+23.5 ppm methanol by methanol/methyl acetate coexposure+229 ppm methyl acetate
7 ppm n-hexane 2,5-hexanedione vs. 2-butanone exposure Perbellini et al. 1985+40 ppm 2-butanone positive correlated [114]
1) ppm: ml/m3

414 R. HEINRICH-RAMM et al.
© 2000 IUPAC, Pure and Applied Chemistry 72, 385–436
currently under extensive scientific investigation, and knowledge in this field will probably increasesignificantly within the next decade. Several recent studies suggest a relationship between VOC expo-sure, polymorphism-related differences in susceptibility, health effects, and results of biomonitoring.
Persons occupationally exposed to trichloroethylene and carrying at least one functional GST T1or GST M1 gene had a higher risk for renal cell cancer than those with negative genotypes [119] due toa more pronounced glutathione transferase dependent formation of the reactive metabolite S-(1,2-dichlorovinyl)-L-cysteine [120]. Another example for a polymorphism effect might be found for NAT 2positive persons (“fast acetylators”). These individuals have a higher risk for colon cancer probablycaused by dietary heterocyclic aryl amines, but a lower risk for bladder cancer after occupational expo-sure to aromatic amines than slow acetylators [121]. Acute methyl bromide exposure [122] led to severeneurotoxic symptoms and comparatively low levels of S-methylcysteine adducts in albumin and globinfor one person with normal red cell GST T1 activity (“conjugator”) whereas another patient withoutdetectable enzyme activity (“non-conjugator”) showed only mild and reversible effects and distinctlyhigher adducts levels. This was interpreted as a possible relationship between methyl bromide neuro-toxicity and GST-dependent formation of toxic metabolites such as methanethiol.
6. REFERENCE VALUES AND INTERVALS
For the interpretation of biological monitoring data of VOC exposure, an exact knowledge of the baselineconcentration of these analytes and their metabolites in the relevant biological material is required.These so-called reference values have been defined by the IFCC as measured values in samples of areference sample group, statistically adequate numerically to represent the reference population [89]. Areference interval is the interval between, and including, two reference limits that are derived from thestatistical distribution of reference values. However, frequently it is not possible to produce the requirednumber of reference values. In this case, the calculation of indicative reference intervals and referencelimits from a lower number of reference values may be based on the statistically well-defined confidenceor tolerance intervals as has been recommended by IUPAC [88].
For VOCs in blood the current data on reference values are quite limited and represent an analyti-cal borderline situation because, for most laboratories, these levels are below the corresponding analyti-cal limits of detection. Despite the lack of detailed data for many VOC reference values, the presentknowledge seems to be sufficient for the interpretation of exposure levels found in occupational bio-logical monitoring. For environmental exposures, e.g., of persons living near dry-cleaning shops, refer-ence values are often not available. For these cases it is recommended to include a well-defined controlreference group with minimal exposure in each biological monitoring study (applying an identicalanalytical design).
Table 11 gives an overview of literature data for the important aromatic hydrocarbons in wholeblood for occupationally unexposed persons. This class of VOCs is comparatively well investigatedconcerning baseline values. For benzene in blood, an upper normal level (according to the 95 percentileof the reference values) of about 500 ng/l for nonsmokers has been found by three independent scien-tific groups in the United States, Italy, and Germany. For toluene, the corresponding concentrationreaches several µg/l. These two compounds are of special interest for environmental toxicology due toa widespread use for many indoor applications (toluene) or due to a high environmental exposure causedmainly by automobile exhaust for a proven human carcinogen (benzene). Corresponding data for uri-nary metabolites can be found in Table 13, Sect. 7.3.

Biological monitoring for exposure to volatile organic compounds 415
© 2000 IUPAC, Pure and Applied Chemistry 72, 385–436
Table 11 Human blood concentration (ng/l) for aromatic hydrocarbons in whole blood of occupationallyunexposed persons.
Year of Number 95thAnalyte Publication of persons Mean Median Range Percentile Reference
benzene 1988 8 nonsmokers 127 127 49–191 Perbellini et al. [123]11 smokers 584 578 109–1136
1989 581) 332 235 10–1657 Brugnone et al. [124]1989 13 nonsmokers 218 190 112–455 Hajimiragha et al.
14 smokers 547 493 287–947 [129])1991 8 nonsmokers 176 165 80–300 Angerer et al. [130]
2 smokers 211 180 130–4301991 15 nonsmokers 262 202–345 Chriske et al. [132]1991 21 nonsmokers 239 216 83–571 Goergens et al. [133]
9 nonsmokers 163 144 52–2781992 67 nonsmokers 247 220 <60–780 540 Angerer et al. [131]
26 smokers 335 280 <60–920 5501992 293 nonsmokers 205 163 7–924 514 Brugnone et al. [126]
138 smokers 381 291 7–2241 9011994 8832) 130 61 480 Ashley et al. [135]1994 25 nonsmokers 111 99 50–219 Kok and Ong [82]
50 smokers 329 316 81–6291996 nonsmoker 241 Fustinoni et al. [136]
smokers 3651998 171 nonsmokers 123 110 15–462 Brugnone et al. [137]
72 smokers 264 210 28–940
toluene 1989 371) 830 573 23–5013 Brugnone et al. [124]1989 13 nonsmokers 1630 1141 495–4614 Hajimiragha et al.
14 smokers 2133 2001 1316–3804 [129]1991 15 nonsmokers 809 514–1058 Chriske et al. [132]1991 21 nonsmokers 576 460 210–1383 Goergens et al. [133]
9 nonsmokers 384 425 79–5581993 179 nonsmokers 809 424 –8241 3393 Wang et al. [134]
53 smokers 897 606 –4153 27221994 6042) 520 280 1500 Ashley et al. [135]1995 2692) 1100 500 7100 Brugnone et al. [128]
(98perc.)1996 nonsmokers 759 Fustinoni et al. [136]
smokers 1327
ethyl 1989 13 nonsmokers 651 431 175–2284 Hajimiragha et al.benzene 14 smokers 837 533 378–2697 [129,123]
1991 15 nonsmokers 226 128–355 Chriske et al. [132]1991 21 nonsmokers 252 108 30–918 Goergens et al. [133]
9 nonsmokers 148 115 46–3401994 6312) 110 60 250 Ashley et al. [135]1996 nonsmokers 140 Fustinoni et al. [136]
smokers 233
m/p- 1989 13 nonsmokers 1580 1094 548–5602 Hajimiragha et al.xylene 14 smokers 1705 1490 916–3008 [129]
Table continues on next page.

416 R. HEINRICH-RAMM et al.
© 2000 IUPAC, Pure and Applied Chemistry 72, 385–436
Table 11 Continued.
Year of Number 95thAnalyte Publication of persons Mean Median Range Percentile Reference
m/p 1991 15 nonsmokers 590 339–940 Chriske et. al. [132]xylene 1991 21 nonsmokers 687 378 170–2287 Goergens et. al. [133](cont’d.) 9 nonsmokers 479 405 234–924
1994 6492) 370 190 780 Ashley et al. [135]
o-xylene 1989 13 nonsmokers 409 324 129–1472 Hajimiragha et. al.14 smokers 463 352 236–1130 [129]
1991 15 nonsmokers 191 106–291 Chriske et. al. [132]1991 21 nonsmoker 223 134 46–872 Goergens et al. [133]
9 nonsmokers 153 118 50–3401994 7112) 140 110 300 Ashley et al. [135]
total 1996 nonsmoker 604 Fustinoni et al. [136]xylenes smokers 794
styrene 1989 33 177 155 0–854 Brugnone et al. [124]1993 81 221 172 7–963 512 Brugnone et al. [127]1994 6572) 74 41 180 Ashley et al. [135]
cumene 1989 33 176 147 31–929 Brugnone et al. [124]
1) Significant differences between smokers and nonsmokers (benzene: mean 485 vs. 130 ng/l; toluene: mean 1135 vs. 472ng/l)2) Smoking status not mentioned
7 BIOMONITORING ACTION LEVELS
Biological monitoring is extensively applied to field studies and other experimental designs oftoxicological and medical research. In addition, it is used on a broad scale in practical occupationalmedicine in many developed countries. In some of them biological threshold values have been developedto control the workers’ exposure. On an international level several Council Directives of the EuropeanCommunities deal with health protection of industrially exposed workers, some of them bringing forwardthe idea of biological monitoring for selected chemicals, e.g., lead (80/1107/EEC; 82/605/EEC) [138,139]. A currently adopted “Council Directive on the protection of the health and safety of workers fromthe risks related to chemical agents at work” (98/24/EC) [140] suggests establishing biological limitvalues (in addition to airborne occupational exposure limits) on a European level.
7.1 German BAT values
In Germany, the first set of “Biologische Arbeitsstoff-Toleranz-Werte, BAT” (biological tolerance values)has been recommended in 1980 by a scientific expert group of the “Deutsche Forschungsgemeinschaft”(German Research Foundation) [141]. BAT values are published as a list being updated annually combinedwith airborne threshold limit values for occupational exposure, the so-called “MaximaleArbeitsplatzkonzentrationen MAK” (maximum workplace concentrations) [71]. Presently, BAT valueshave been developed for 43 substances. Among them more than two third are VOCs [72].
The legal implementations of the BAT values are given by the fact that their annual list is adoptedby the Federal Ministry for Employment and Social Affairs as Technical Guidelines [142,143]. There-

Biological monitoring for exposure to volatile organic compounds 417
© 2000 IUPAC, Pure and Applied Chemistry 72, 385–436
fore, employers are advised to apply biological monitoring. Performance of biomonitoring in occupa-tional settings is regulated in a recently passed Technical Guideline [144]. For substances with provendermal absorption under usual working conditions biological monitoring is mandatory [145].
BAT values are defined as “the maximum permissible quantity of a chemical substance or itsmetabolites or the maximum permissible deviation from the norm of biological parameters induced bythese substances in exposed humans. ... BAT values are conceived as ceiling values for healthy indi-viduals. ...BAT values are intended to protect employees from impairment of health at work.“
For carcinogenic compounds “exposure equivalents for carcinogenic substance,Expositionsäquivalente für krebserzeugende Arbeitsstoffe, EKA “have been investigated by the Com-mission. An EKA value is based on the relationship of the air concentration of a carcinogen and that ofthe substance or its metabolites in biological material. From this relationship, the internal exposurewhich results from uptake of the substance exclusively by inhalation may be determined.
Two main approaches are applied so far in order to establish BAT values:
• correlation between air and biological concentrations derived by results of several independentfield studies,
• health-based values as for dichloromethane exposure (CO-Hb) or aromatic amines or nitro com-pounds (MetHb).
In addition, experience from long-term medical supervision of occupationally exposed workers,data of experimental exposure studies as well as pharmacokinetic models provide further sources ofknowledge to substantiate the BAT concept.
7.2 ACGIH BEI values
The U.S. Biological Exposure Indices (BEI) are developed by the American Conference of GovernmentalIndustrial Hygienists (ACGIH), with the first values published in the early 1980s. Although BEIs arenot considered to represent a legal standard, the ACGIH as an important professional society of industrialhygienists offers a highly accepted guidance for the interpretation of biological exposure data. Thecurrent booklet of BEIs contains 22 volatile organic compounds for which BEIs have been developedout of a total of 35 [73].
BEI values represent the levels of analytes that are most likely to be observed in specimenscollected from a healthy worker who has been exposed to chemicals to the same extent as a worker withinhalation exposure to the TLV (Threshold Limit Value). BEIs are understood as “advisory levels”that may be exceeded by individuals of an observed group. Industrial hygiensts or occupational physi-cians are expected to reduce the exposure if BEIs are exceeded for a longer time period or if the BEI isexceeded for a substantial group within the exposed population.
Table 12 lists these BAT/BEI values for volatile organic substances.As can be seen from Table 12, the quantitative values of BAT and BEI differ in some cases (e.g.,
butanone) although the scientific documentations cited for both categories [72,74] clearly show thateach value is derived from the same scientific data pool, applying the same recommended samplingtime and based on the same principle of evaluation (field studies/correlation between air and biologicalconcentrations). The main reason for the difference lies in the different definitions (BAT/ “ceiling val-ues for healthy individuals”; BEI/ “ levels that are most likely to be observed”—see above). In severalother cases deviations between BAT and BEI values are caused by different levels of their airbornestandards (MAK and TLV-TWA, respectively). The German Commission for the Investigation of HealthHazards of Chemical Compounds in the Work Area as well as the U.S. working group of the AmericanConference of Governmental Industrial Hygienist are currently engaged to harmonize their occupa-tional limit values for air and biological concentrations.

418 R. HEINRICH-RAMM et al.
© 2000 IUPAC, Pure and Applied Chemistry 72, 385–436
7.3. Finnish biomonitoring action levels
For several VOCs, the Finnish Institute of Occcupational Health recommends so-called biomonitoringaction levels as listed in Table 13 together with the corresponding upper reference limit values. Some ofthem are directly health-based, other have been extrapolated from the relationship between exposure atthe Finnish occupational exposure limit and the biological measurement [146, 147]. These values arenot binding to the employer.
For phenol in urine and TTCA in urine indicative limit values are recommended by the Ministryfor Social Affairs and Health with the objective that “the employer has to consider these limit valueswhen assessing the exposure to the chemicals in question“ [148]. In 1998, two further indicative valuesfor urinary mandelic acid (as a biomarker of ethylbenzene exposure) and for blood toluene were givenby the Ministry of Social Affairs and Health [149,150].
7.4. Other biomonitoring action levels (Japan, France, Italy, United Kingdom, Poland)
The Japan Society for Occupational Health (JSOH) recommends Occupational Exposure Limits Basedon Biological Monitoring (OEL-B) for several substances, among them the VOC n-hexane for which anOEL-B of 3 mg/g creat. 2,5-hexanedione in urine (after acid hydrolysis) and 0.3 mg/g creat. 2,5-hexanedione in urine (without acid hydrolysis) has been established [151] for a sampling time at end ofshift at end of work week. For toluene, OEL-B of 0.6 mg/l (toluene in blood) and 0.06 mg/l (toluene inurine) were set in 1999 for sampling within 2h before shift end in the second half of work week [152].OEL-Bs are defined as values at or below which adverse health effects do not appear in most workerswho are exposed to the chemical.
In France, a Scientific Group for the Monitoring of Workplace Environments publishes Biologi-cal Exposure Indices IBE (Indificateurs Biologiques d’Exposition) based on the BEI by ACGIH afterconsideration of the French situation. For aniline, benzene, chlorobenzene, N,N-dimethylformamide,ethylbenzene, carbon disulfide, furfural, n-hexane, methanol, 2-butanone, nitrobenzene, phenol, sty-rene, toluene, 1,1,1-trichloroethane, trichloroethylene, and xylenes the values are identical to the BEIlisted in Table 12 while for tetrachloroethylene levels of 1 mg/l in blood (prior to last shift of the workweek) and 7 mg/l for trichloroacetic acid in urine (end of work week) are recommended [153].
The Italians, through the “Fondazione Clinica del Lavoro”, have established biological equivalentconcentrations (LBE, Limiti Biologici Equivalenti) for a variety of VOCs. These values are principallyVOCs in urine and are guidelines (Table 14, [154]).
In the United Kingdom, the framework of legislation for the use of biomonitoring is set out by theControl of Substances Hazardous to Health Regulation 1994. However, there is no requirement in thoseregulations for compliance with biological monitoring guidance values [155]. Two types of biologicalmonitoring guidance values may be set in the United Kingdom—the health-based health guidancevalues and the practicable benchmark guidance values (set at the 90th percentile of available biomonitoringresults collected from a representative sample of workplaces with good occupational hygiene practice).For several VOCs, health guidance values have been established by the Health and Safety Executive[156] which are listed in Table 15.
Biological exposure indices for VOCs recommended in Poland are summarized in Table 16 [157].
Text continues on page 427.

Biological m
onitoring for exposure to volatile organic compounds
419
© 2000 IU
PAC
, Pure and A
pplied Chem
istry 72, 385–436
Table 12 Biological monitoring of volatile organic compounds—international biological limit values for occupational exposure.
Boiling Vapor Skinpoint pressure absorp- Biological monitoring Sampling
Substance CAS # °C hPa tion analyte Biological limit value time
Acetone 67-64-1 56 240 - - Acetone in urine BAT1) 80 mg/l end of shiftBEI2) (100 mg/l)4)
Acrylonitrile 107-13-1 77 116 H3) Cyanoethylvaline in erythrocytes no BAT values are established as at any timeacrylonitrile is a carcinogen;
S3) quantitative correlations for thelisted parameters are given inrelation to ambient air concentra-tions in the range of 0.14 to 3 ml/m3
Aniline 62-53-3 184 64 H Aniline, free in urine BAT: 1 mg/l after several shiftsAniline, released from aniline BAT: 100 µg/lhemoglobin conjugate (whole end of shiftblood)
S Total p-aminophenol in urine BEI: 50 mg/g creatinineMethemoglobin in blood BEI: 1.5% of hemoglobin during or end of shift
Benzene 71-43-2 80 101 H Benzene in blood no BAT values are established end of shiftS-Phenylmercapturic acid in urine as benzene is a human carcinogen;trans, trans-Muconic acid in urine quantitative correlations for the
listed parameters are given inrelation to ambient airconcentration of benzene in therange of 0.3–6 ml/m3
S S-Phenylmercapturic acid in urine BEI: 25 µg/g creatinine end of shift
2-Butanone 78-93-3 79.6 105 H 2-Butanone in urine BAT: 5 mg/l end of shift- BEI: 2 mg/l
Carbon 75-15-0 46.3 400 H 2-Thioxothiazolidine-4- BAT: 4 mg/g creatinine end of shiftdisulfide S carboxylic acid in urine BEI: 5 mg/g creatinine
Table continues on next page

420R
. HE
INR
ICH
-RA
MM
et al.
© 2000 IU
PAC
, Pure and A
pplied Chem
istry 72, 385–436
Table 12 Continued.
Boiling Vapor Skinpoint pressure absorp- Biological monitoring Sampling
Substance CAS # °C hPa tion analyte Biological limit value time
Carbon 56-23-5 76.5 120 H Carbon tetrachloride in blood BAT: 70 µg/l end of exposuretetrachloride S after several shifts
Chlorobenzene 108-90-7 131.7 12 - Total 4-chlorocatechol in urine BAT: 70/300 mg/g creatinine prior/end of shiftBEI: 150 mg/g creatinine end of shift
- Total p-chlorophenol in urine BEI: 25 mg/g creatinine end of shift
Dichloro- 75-09-2 40.1 475 - CO-Hb in blood BAT: 5% end of shiftmethane - Dichloromethane in blood BAT: 1 mg/l end of shift
N,N-Dimethy- 127-19-5 166 3 H N-Methacetamide in urine BEI: 30 mg/g creatinine end of shift at endacetamide S of work week
N,N-Dimethy- 68-12-2 153 3.5 H N-Methyformamide in urine BAT: 15 mg/l end of shiftformamide S BEI: (40 mg/g creatinine)4)
Ethylbenzene 100-41-4 136.2 9 H Ethylbenzene in blood BAT: 1.5 mg/l end of shift- Mandelic acid in urine BEI: 1.5 g/g creatinine end of shift at end
of work weekMandelic and phenyl glyoxylic acid BAT: 2000 mg/g creatininein urine
Ethylene glycol 628-96-6 198 0.07 H Ethylene glycol dinitrate in BAT: 0.3 µg/l end of shiftdinitrate S blood
Ethylene glycol 111-76-2 171.2 1 H Butoxyacetic acid in urine BAT: 100 mg/l after several shiftsmonobutyl ether S
Ethylene glycol 112-07-2 192 0.4 H Butoxyacetic acid in urine BAT: 100 mg/l after several shiftsmonobutylether acetate

Biological m
onitoring for exposure to volatile organic compounds
421
© 2000 IU
PAC
, Pure and A
pplied Chem
istry 72, 385–436
Table 12 Continued.
Boiling Vapor Skinpoint pressure absorp- Biological monitoring Sampling
Substance CAS # °C hPa tion analyte Biological limit value time
Ethylene glycol 110-80-5 136.2 5 H Ethoxyacetic acid in urine BAT: 50 mg/1 end of shift aftermonoethyl ether S BEI: 100 mg/g creatinine several shifts
Ethylene glycol 111-15-9 156.4 2.7 H Ethoxyacetic acid in urine BAT: 50 mg/l end of shiftmonoethyl ether S BEI: 100 mg/g creatinine after several shiftsacetate
Furfural 98-01-1 162 1 H Total furoic acid in urine BEI: 200 mg/g creatinine end of shiftS
Halothane 151-67-7 50.2 242 - Trifluoroacetic acid in blood BAT: 2.5 mg/l end of exposure(2-Bromo-2-chlo- - after several shiftsro-1,1,1-trifluoro-ethane)
n-Hexane 110-54-3 69 160 H 2,5-Hexanedione in urine BAT: 5 mg/l end of shift- (BAT: plus 4,5-dihydroxy- 2-hexanone) BEI: 5 mg/g creatinine
2-Hexanone 591-78-6 128 13.3 - Hexane-2,5-dione plus BAT: 5 mg/l end of shift(Methyl butyl S 4,5-dihydroxy- 2-hexanone in urineketone)
Hexone (Methyl 108-10-1 115.8 8 H Hexone in urine BAT: 3.5 mg/l BEI: 2 mg/l end of shiftisobutyl ketone) -
Hydrazine 302-01-2 114 1.3 H Hydrazine in plasma no BATvalues are established end of shiftS Hydrazine in urine as hydrazine is a carcinogen;
quantitative correlations for thelisted parameters are given inrelation to ambient air concentra-tions of hydrazine in the range of0.01 to 0.10 ml/m³
Table continues on next page
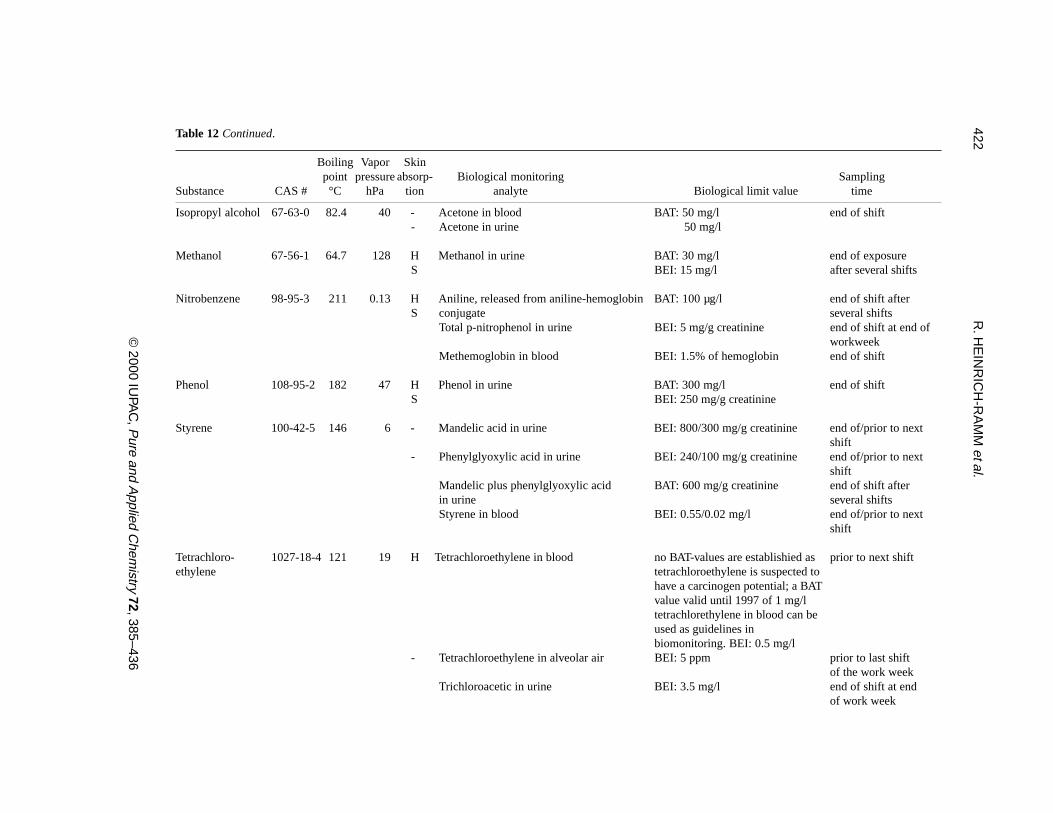
422R
. HE
INR
ICH
-RA
MM
et al.
© 2000 IU
PAC
, Pure and A
pplied Chem
istry 72, 385–436
Table 12 Continued.
Boiling Vapor Skinpoint pressure absorp- Biological monitoring Sampling
Substance CAS # °C hPa tion analyte Biological limit value time
Isopropyl alcohol 67-63-0 82.4 40 - Acetone in blood BAT: 50 mg/l end of shift- Acetone in urine 50 mg/l
Methanol 67-56-1 64.7 128 H Methanol in urine BAT: 30 mg/l end of exposureS BEI: 15 mg/l after several shifts
Nitrobenzene 98-95-3 211 0.13 H Aniline, released from aniline-hemoglobin BAT: 100 µg/l end of shift afterS conjugate several shifts
Total p-nitrophenol in urine BEI: 5 mg/g creatinine end of shift at end ofworkweek
Methemoglobin in blood BEI: 1.5% of hemoglobin end of shift
Phenol 108-95-2 182 47 H Phenol in urine BAT: 300 mg/l end of shiftS BEI: 250 mg/g creatinine
Styrene 100-42-5 146 6 - Mandelic acid in urine BEI: 800/300 mg/g creatinine end of/prior to nextshift
- Phenylglyoxylic acid in urine BEI: 240/100 mg/g creatinine end of/prior to nextshift
Mandelic plus phenylglyoxylic acid BAT: 600 mg/g creatinine end of shift afterin urine several shiftsStyrene in blood BEI: 0.55/0.02 mg/l end of/prior to next
shift
Tetrachloro- 1027-18-4 121 19 H Tetrachloroethylene in blood no BAT-values are establishied as prior to next shiftethylene tetrachloroethylene is suspected to
have a carcinogen potential; a BATvalue valid until 1997 of 1 mg/ltetrachlorethylene in blood can beused as guidelines inbiomonitoring. BEI: 0.5 mg/l
- Tetrachloroethylene in alveolar air BEI: 5 ppm prior to last shiftof the work week
Trichloroacetic in urine BEI: 3.5 mg/l end of shift at endof work week

Biological m
onitoring for exposure to volatile organic compounds
423
© 2000 IU
PAC
, Pure and A
pplied Chem
istry 72, 385–436
Table 12 Continued.
Boiling Vapor Skinpoint pressure absorp- Biological monitoring Sampling
Substance CAS # °C hPa tion analyte Biological limit value time
Tetrahydrofuran 109-99-9 66 200 - Tetrahydrofuran in urine BAT: 8 mg/l end of shift-
Toluene 108-88-3 111 29 - Toluene in blood BAT: 1.0 mg/l end of shiftBEI: (1 mg/l)4)
S Hippuric acid in urine BEI: (2.5 g/g creatinine)4) end of shifto-Cresol in urine BAT: 3.0 mg/l end of shift
1,1,1-Trichloro- 71-55-6 74 - 1,1,1-Trichloroethane in blood BAT: 550 µg/l prior to shift after ethane several shifts
- 1,1,1-Trichloroethane in alveolar air BEI: 40 ppm prior to shift afterseveral shifts
Total 2,2,2-trichloroethanol in blood BEI: 1 mg/l end of shift at endof work week
Total 2,2,2-trichloroethanol in urine BEI: 30 mg/l end of shift at endof work week
Trichloroacetic acid in urine BEI: 10 mg/l end of work week
Trichloroethylene 79-01-6 87 77 - 2,2,2-Trichloroethanol in blood no BAT values are established as end of shift aftertrichloroethylene is a carcinogen; several shifts
Trichloroacetic acid in urine BAT values valid until 1996 of end of shift after5 mg/l 2,2,2-trichloroethanol in several shiftsblood and 100 mg/l trichloroaceticacid can be used as guidelines inbiomonitoring
- 2,2,2-Trichloroethanol in blood BEI: 4 mg/l end of shift at endof work week
Trichloroacetic acid in urine BEI: 100 mg/g creatinine end of work week2,2,2-Trichloroethanol and BEI: 300 mg/g creatinine end of shift at endtrichloroacetic acid in urine of work week
Table continues on next page

424R
. HE
INR
ICH
-RA
MM
et al.
© 2000 IU
PAC
, Pure and A
pplied Chem
istry 72, 385–436
Table 12 Continued.
Boiling Vapor Skinpoint pressure absorp- Biological monitoring Sampling
Substance CAS # °C hPa tion analyte Biological limit value time
Xylenes 1330-20-7138-144 7-9 Xylenes in blood BAT: 1.5 mg/l end of shift -- Methylhippuric (toluric) acids in urine BAT: 2000 mg/l end of shift
BEI: 1500 mg/g creatinine
1) BAT: German Biological Tolerance Values for Occupational Exposure according to report no. 35 (1999) by Deutsche Forschungsgemeinschaft.2) BEI: U.S. Biological Exposure Indices according to booklet 1997 by American Conference of Governmental Industrial Hygienists.3) H, S: Substance is considered to be absorbed through the skin, i.e., systemic exposure may be increased by percutaneous absorption (H: according to classification in theGerman list of MAK and BAT values 1999; S: according to booklet 1997 by American Conference of Governmental Industrial Hygienists.)4) BEIs are under discussion to be lowered/changed: Acetone in urine: 60 mg/l; N-Methylformamide in urine: 20 mg/g creat.; toluene in blood: 0.05 mg/l (prior to next shift);hippuric acid in urine: 1.6 g/g creat.

Biological monitoring for exposure to volatile organic compounds 425
© 2000 IUPAC, Pure and Applied Chemistry 72, 385–436
Table 13 Finnish biomonitoring action levels for VOCs (all urinary concentrations have been adjusted to relativedensity of 1.024).
UpperBiomonitoring reference Sampling
Substance Parameter action level limit values time
Benzene Benzene in blood 20 nmol/l 5 nmol/l morning3)
200 nmol/l (nonsmokers) midday4)
t,t-Muconic acid in urine 40 µmol/l 0.5 µmol/l post shift2)
Carbon disulfide 2-Thioxothiazolidine-4- 2 mmol/mol post shiftcarboxylic acid in urine creat.1)
N,N-Dimethyl- N-(hydroxymethyl)-N- 650 µmol/l post shiftformamide methylformamide in urine
Ethylbenzene Mandelic acid in urine 5.2 mmol/l1) 0.2 mmol/l post shift
Fluorotrichloro- FC-11 in blood 100 nmol/l 5 nmol/l morningmethane (FC-11)
Methanol Formic acid in urine 240 mmol/mol 50 mmol/creat. mol creat. morning
2-Butanone 2-Butanone in urine 60 µmol/l 1.5 µmol/l post shift
n-Hexane 2,5-Hexanedione in urine 5 µmol/l 1 µmol/l (mildhydrolysis) post shift
Phenol Phenol in urine 3200 µmol/l1) 150 µmol/l post shift
Styrene Sum of mandelic and phenyl- 1.2 mmol/l 0.2 mmol/l morningglyoxylic acid in urine
Tetrachloroethylene Tetrachloroethylene in blood 6 µmol/l 0.1 µmol/l morning
Toluene Toluene in blood 1000 nmol/l1) 50 nmol/l morning
1,1,1-Trichloroethane 1,1,1-Trichloroethane in blood 2.0 µmol/l 0.1 µmol/l morning
Trichloroethylene Trichloroacetic acid in urine 360 µmol/l 50 µmol/l post shift
Trichlorotrifluoro- FC-113 in blood 50 nmol/l 5 nmol/l morningethane(FC-113)
Triethylamine Triethylamine in urine 0.85 mmol/l 0.02 mmol/l post shift
Xylenes Methylhippuric acids in 10 mmol/l 0.2 mmol/l post shifturine
1) indicative limit value; 2) post shift: specimen collected after the working hours; 3) morning: specimen collected before thecommencement of the work-shift (and exposure), i.d. apprx. 16 h after the last exposure and toward the end of the workingweek; 4) midday: specimen is collected after the first half of the working day, 60 +/-10 min after the exposure

426 R. HEINRICH-RAMM et al.
© 2000 IUPAC, Pure and Applied Chemistry 72, 385–436
Table 14 Biological equivalent concentrations for VOC exposure, established in Italy by [154].
Substance BM analyte LBE* Sampling time
Acetone Acetone in urine 56 mg/l end of exposure
Benzeneexposure 0.1 ppm Benzene in urine 575 ng/l (nonsmokers) end of exposure exposure 1 ppm t,t-Muconic acid in urine 850 µg/g creatinine end of exposure
exposure 1 ppm S-Phenylmercapturic acid 52 µg/g creatinine end of exposurein urine
Butan-2-one Butan-2-one in urine 2 mg/l end of exposure
Carbon disulfide Carbon disulfide in urine 12.5 µg/l end of exposure
Carbon tetrachloride Carbon tetrachloride in urine 3.1 µg/l end of exposure
Dichloromethane Dichloromethane in urine 455 µg/l end of exposure
Halothane (2-Bromo-2- Halothane in urine 6.8 µg/l end of exposurechloro-1,1,1-trifluoro-ethane)
Isopropyl alcohol Acetone in urine 17 mg/l end of exposure
n-Hexane n-Hexane in urine 6 µg/l end of exposure
4-Methylpentan-2-one 4-Methylpentan-2-one in urine 2.2 mg/l end of exposure
Styrene Styrene in urine 80 µg/l end of exposure
Tetrachloroethylene Tetrachloroethylene in urine 100 µg/l end of exposure
Toluene Toluene in urine 194 µg/l end of exposure
1,1,1-Trichloroethane 1,1,1-Trichloroethane in urine 595 µg/l end of exposure
Trichloroethylene Trichloroethylene in urine 185 µg/l end of exposure
Xylenes Xylenes in urine 110 µg/l end of exposure
*LBE Limiti Biologici Equivalenti
Table 15 Biological exposure indices for VOC exposure recommended in the United Kingdom [155,156].
Substance BM analyte Health guidance value Sampling time
Butan-2-one Butan-2-one in urine 70 µmol/l post shift2-Butoxyethanol Butoxyacetic acid in urine 240 mmol/mol creatinine post shiftN,N-Dimethylacetamide N-Methylacetamide in urine 100 mmol/mol creatinine post shift4-Methylpentan-2-one 4-Methylpentan-2-one in urine 20 µmol/l post shift

Biological monitoring for exposure to volatile organic compounds 427
© 2000 IUPAC, Pure and Applied Chemistry 72, 385–436
Table 16 Biological exposure indices for VOC exposure recommended in Poland [157].
BiomonitoringSubstance BM analyte exposure indices Sampling time
Carbon disulfide 2-Thioxothiazolidine-4- 3 mg/g creat. end of exposure at anycarboxylic acid in urine day
Ethylbenzene Mandelic acid in urine 20 mg/h excretion rate duringthe last 2 h of shift
Methanol Methanol in urine 6 mg/l end of exposure at anyday
n-Hexane 2,5-Hexanedione in urine 2.5 mg/l adjusted to urinary end of exposure at end density of 1.016 of work week
Phenol Phenol in urine 8.8 mg/h excretion rate duringthe last 2 h of shift
Styrene Mandelic acid in urine 16 mg/h excretion rate duringMandelic and phenyl- 25 mg/h the last 2 h of shiftglyoxylic acid in urine
Tetrachloroethylene Tetrachloroethylene in 800 µg/l 10-20 min after 4-6 hblood of exposure
Toluene Benzoic acid 80 mg/h excretion rate duringthe last 2 h of shift
Toluene in blood 300 µg/l 10-20 min after endof exposure
Trichloroethylene Trichloroacetic acid in urine 20 mg/l end of exposure at any day
Trimethylbenzene Sum of 2,4-/2,5-/3,4- 170 mg/h excretion rate duringdimethylbenzoic acid in the last 2 h of shifturine after 4 days of
exposure
Xylenes Methylhippuric acids in 1.4 g/l adjusted to urinary end of exposure at anyurine density of 1.024 day
8. CONCLUSIONS AND RECOMMENDATIONS
We draw the following conclusions:
• Biological monitoring of exposure to VOCs may be helpful for an assessment of the total VOCuptake and health effects they may induce. Representativeness of the results depends crucially onthe kinetics of the VOCs in the body.
• Due to the in general complex kinetics of the VOCs, the time of specimen collection has to beselected very carefully. For a comparison with existing limit values, the standardized sampling
428 R. HEINRICH-RAMM et al.
© 2000 IUPAC, Pure and Applied Chemistry 72, 385–436
recommendations have to be followed strictly.• Biological monitoring of VOC exposure is primarily based on VOCs in whole blood or metabo-
lites in urine. Especially for occupational exposure, analytical instrumentation and extensive ex-perience exist in many international scientific laboratories for its reliable routine application.
• At typical workplace and environmental concentrations the metabolic interaction between differ-ent VOC components and the level of biological indicators of exposure do not seem to be a majorsource of error. Simultaneous consumption of alcohol has been shown to affect the concentrationsmeasured.
• Different activities of VOC metabolizing enzymes (e.g., GST T1, NAT 2) due to genetic polymor-phism may be of relevance for a person’s individual susceptibility to VOC exposure (e.g., methylbromide, aromatic amines).
We recommend further studies in the following areas:
• Improvement of analytical methodology especially for VOCs in whole blood at low level environ-mental exposure and the development of a reliable and standardized procedure to prepare matrixcalibration standards for VOC quantification.
• Reference materials for VOCs in blood and for urinary VOC metabolites should be prepared inorder to help the laboratories to improve the analytical reliability as well as the comparability ofbiological monitoring data.
• Scientific work for establishment of reference values and intervals (e.g., 95 fractiles) for industri-ally unexposed persons should be continued with improved analytical methodology.
• Combining effects of simultaneous exposure to different VOCs should be studied in more detail.• The issue of biochemical (e.g., protein/DNA adducts) and biological effect markers should be
followed in future work in order to improve the interpretation of such data especially for carcino-genic compounds.
ACKNOWLEDGMENTS
The authors were fortunate in having scientific support of Dr. Antero Aitio (Geneva/Switzerland) whoprovided many fruitful comments during the preparation of this recommendation. His comments havebeen particularly welcome and greatly appreciated by the Working Party.
The authors are particularly grateful to Professor Lorenzo Alessio, Brescia/Italy; Professor JürgenAngerer, Erlangen/Germany; David L. Ashley, Ph. D., Atlanta/USA; Professor F. Brugnone/Dr. L.Perbellini, Verona/Italy; Professor Lothar Dunemann/Dr. Jutta Begerow, Düsseldorf/Germany; Dr. VeraFiserova-Bergerova (Thomas), Miami/USA; Professor Ernst Hallier, Göttingen/Germany; Dr. Paul Illing,Heswall-Wirral/England; Dr. Helmut Knöppel, Cadrezzate/Italy; Professor Larry K. Lowry, Tyler-Texas/USA; Professor Dennis Nowak/Dipl.-Chem. H. Römmelt, Munich/Germany; Dr. M. V. Park, Edinburgh/Scotland who thoroughly went through the paper and provided interesting additional scientific aspectsand fruitful suggestions for improving the clarity of presentation.

Biological monitoring for exposure to volatile organic compounds 429
© 2000 IUPAC, Pure and Applied Chemistry 72, 385–436
9. LIST OF ACRONYMS
Acronym ExplanationACGIH American Conference of Governmental and Industrial Hygienists (USA)BAT Biologischer Arbeitsstoff-Toleranz-Wert (biological tolerance value, evaluated by
Commission for the Investigation of Health Hazards of Chemical Compounds inthe Work Area, Deutsche Forschungsgemeinschaft/Germany)
BEI Biological Exposure Indices (evaluated by American Conference of Governmentaland Industrial Hygienists/USA)
BEM Biological effect monitoringBM Biological monitoringCEC Commission of the European CommunitiesDGAUM Deutsche Gesellschaft für Arbeitsmedizin und Umweltmedizin e.V. (German
Society of Occupational and Environmental Medicine)EKA Expositionsäquivalente für krebserzeugende Arbeitsstoffe (exposure equivalents for
carcinogenic substances, evaluated by Commission for the Investigation of HealthHazards of Chemical Compounds in the Work Area, DeutscheForschungsgemeinschaft/ Germany)
FG Fat groupFIOH Finnish Institute of Occupational HealthGC/ECD Gas chromatography/electron capture detectionGC/FID Gas chromatography/flame ionization detectionGC/MSD Gas chromatography/mass selective detectionGC/NPD Gas chromatography/nitrogen selective detectionIFCC International Federation of Clinical ChemistryJFOHO Japan Federation of Occupational Health OrganizationsK-EDTA Potassium salt of ethylenediaminetetraacetic acidKISCO Korea Industrial Health CorporationMAK Maximale Arbeitsplatzkonzentration (maximum workplace concentration, evalu-
ated by Commission for the Investigation of Health Hazards of Chemical Com-pounds in the Work Area, Deutsche Forschungsgemeinschaft/ Germany)
MG Skin and muscle groupNIOSH National Institute of Occupational Safety and Health (USA)OSHA Occupational Safety and Health Administration (USA)PBPK Physiologically based pharmacokinetic modelRP-HPLC/UV Reversed-phase high-performance liquid chromatography with UV detectionSPE-adsorption Solid-phase extraction - adsorption chromatographySPE-RP Solid-phase extraction - reversed phaseVOC Volatile organic compoundsVPG Vessel-poor groupVRG Vessel-rich groupWHO World Health Organization

430 R. HEINRICH-RAMM et al.
© 2000 IUPAC, Pure and Applied Chemistry 72, 385–436
10. LIST OF TRADITIONAL NAMES AND THEIR EQUIVALENT IUPAC NAMES
Names in the literature IUPAC names2-butanone butan-2-one4-chlorocatechol 4-chlorobenzene-1,2-diol4,5-dihydroxy-2-hexanone 4,5-dihydroxyhexan-2-onedimethylformamide N,N-dimethylformamideethylene glycol dinitrate ethylene dinitrateethylene glycol monobutyl ether 2-butoxyethanolethylene glycol monobutyl ether acetate 2-butoxyethyl acetateethylene glycol monoethyl ether 2-ethoxyethanolethyl methyl ketone butan-2-onefluorotrichloromethane trichlorofluoromethanen-hexane hexane2,5-hexanedione hexane-2,5-dionehippuric acid N-benzoylglycinemandelic acid a-hydroxybenzeneacetic acidmethyl tert-butyl ether tert-butyl methyl ethermethyl butyl ketone hexan-2-onemethylformamide N-methylformamide2-methylhippuric acid (o-toluric acid) N-(2-methylbenzoyl)glycine3-methylhippuric acid (m-toluric acid) N-(3-methylbenzoyl)glycine4-methylhippuric acid (p-toluric acid) N-(4-methylbenzoyl)glycinemethyl isobutyl ketone 4-methylpentan-2-onetrans, trans-muconic acid trans, trans-hexa-2,4-dienoic acidphenylglyoxylic acid a-oxobenzeneacetic acidS-phenylmercapturic acid N-acetyl-S-phenyl-L-cysteinetetrachloroethylene tetrachloroethenethiodiglycolic acid 2,2'-sulfanediyldiacetic acidtrichloroethylene trichloroethene
REFERENCES
1. Commission of the European Communities. Proposal for a Council Directive on limitation ofemissions of volatile organic compounds due to the use of organic solvents in certain industrialactivities. 96/0276 (SYN) Article 2.
2. World Health Organization. Chronic effects of organic solvents on the central nervous system anddiagnostic criteria. Report on a Joint World Health Organization/Nordic Council of MinistersWorking Groups. Copenhagen 1985.
3. K. Verschrueren. Handbook of Environmental Data on Organic Chemicals, 2nd ed. (1983).4. C. Hansch and A. Leo. Substituent constants for correlation analysis in chemistry and biology.
Pomona College, Claremont, California (1989).5. A. Leo, C. Hansch, D. Elkins. Chem Rev. 71, 525–616 (1971).6. AG Bau-BG, Hauptverband Dtsch. Maler-u.Lackierhandwerks, IG Bau-Steine-Erden, UBA, VdL
(Hrsg.), Empfehlungen zum Einsatz lösemittelreduzierter Bautenlacke. February 1995.7. Hauptverband der gewerblichen Berufsgenossenschaften (Employers’ Liability Insurance
Association) (Eds.), Fachgespräch “Lösemittel”. BGZ-Report 6, 1995.

Biological monitoring for exposure to volatile organic compounds 431
© 2000 IUPAC, Pure and Applied Chemistry 72, 385–436
8. E. Olsen, L. Seedorf, B. Laursen. Organiske oplosningsmidler. Kortlægning af deres anvendelseog forekomsten af dampe. Arbejdstilsynet, Copenhagen 1987.
9. J. H. Duffus. Pure Appl. Chem. 65, 2003–2122 (1993).10. A. Berlin, R. E. Yodaiken, D. C. Logan. Int. Arch. Occup. Environ. Health 50, 197–207 (1982).11. World Health Organization. Biological Monitoring of Chemical Exposure in the Workplace, Vols.
1 and 2, Geneva (1996).12. R. I. Zielhuis, P. Th. Henderson. Int. Arch. Occup. Environ. Health 57, 249–257 (1986).13. P. Hoet. General principles. In World Health Organization: Biological Monitoring of Chemical
Exposure in the Workplace, Vol. 1, p.3, Geneva (1996).14. Ph. Grandjean, S. S. Brown, Ph. Reavey, D. S. Young. Clin. Chem. 40, 1360–1362 (1994).15. A. Aitio. Biological monitoring. In General and Applied Toxicology, 2nd ed., Ballantyne, Marrs,
Syversen (Eds.), MacMillan, Hampshire (1998).16. V. Fiserova-Bergerova, personal communication (1999).17. V. Fiserova. Scand. J. Work Environ. Health 11, 7–21 (1985).18. J. K. Piotrowski. Exposure test for organic compounds in industrial toxicology. U.S. Department
of Health, Education and Welfare, NIOSH, Cincinnati (1977).19. M., Jakubowski, H. Wieczorek. Polish J. Occup. Med. 1, 62–71 (1988).20. H. Drexler. Int. Arch. Occup. Environ. Health 71, 503–505 (1998).21. R. J. Scheuplein. Curr. Probl. Dermatol. 7, 172–186 (1978).22. P. Grandjean. Skin Penetration: Hazardous Chemicals at Work, Taylor and Francis, London (1990).23. J. Hanke, T. Dutkiewicz, J. Piotrowski. Medycyna Pracy 12, 413–426 (1961) (in Polish).24. K. Engström, K. Husman, V. Riihimäki. Int. Arch. Occup. Environ. Health 39,181–189 (1977).25. J. Piotrowski. J. Hyg. Epid. Microbiol. Immun. 1, 1–23 (1957).26. T. Dutkiewicz, H. Tyras. Brit. J. Industr. Med. 25, 243 (1968).27. J. M. Barnes. Percutaneus toxicity. In Modern trends in Toxicology, E. Boyland and Goulding
(Eds.), Butterworths, London, pp 18–38 (1968).28. V. Riihimäki and P. Pfäffli. Scand. J. Work Environ. Health 4, 73–85 (1978).29. G. Johanson and A. Boman. Brit. J. Ind. Med. 48, 788–794 (1991).30. V. Fiserova-Bergerova, T. Pirce, P. O. Droz. Am. J. Ind. Med. 17, 617–635 (1990).31. B. N. La Du, H. G. Mandel, E. L. Way. Fundamentals of Drug Metabolism and Drug Disposition,
Williams and Wilkins, Baltimore (1972).32. S. Ghittori, M. Imbriani, G. Pezzagno, E. Capodaglio. Am. Ind. Hyg. Assoc. J. 48, 786–790 (1987).33. D. L. Ashley, M. A. Bonin, F. L. Cardinali, J. M. McCraw, J. V. Wooten. Environ. Health Perspect.
104, 871–877 (1996).34. I. Astrand. Scand. J. Work Environ. Health 1, 199–218 (1975).35. M. L. Gargas, R. J. Burgess, D. E. Voisard, G. H. Carson, M. E. Andersen. Toxicol. Appl. Pharmacol.
98, 87–99 (1989).36. L. A. Wallace and E. D. Pellizzari. Environ. Health Persp. 103, 95–98 (1995).37. P. O. Droz, M. Berode, M. M. Wu. Appl. Ind. Hyg. 6, 465–474 (1991).38. P. O. Droz and M. M. Wu. Biological sampling strategies. In Exposure Assessment for Epidemiology
and Hazard Control, S. M. Rappaport and T. J. Smith (Eds.), pp. 251–270, Lewis Publishers,Chelsea, MI (1990).
39. P. O. Droz. Int. Arch. Occup. Environ. Health 65, 553–559 (1993).40. BEI. Pharmacokinetic models used in setting BEIs. Documentation of the Biological Exposure
Indices, 6th ed. (1991).

432 R. HEINRICH-RAMM et al.
© 2000 IUPAC, Pure and Applied Chemistry 72, 385–436
41. P. Kostrzewski and J. K. Piotrowski. Pol. J. Occup. Med. Environ. Health 3, 249–259 (1991).42. L. Wallace, T. Buckley, E. Pellizari, S. Gordon. Environ. Health Persp. 104, 861–869 (1996).43. L. A. Wallace, E. D. Pellizzari, S. A. Gordon. J. Expos. Anal. Environm. Epidemiol. 3, 75–102
(1993).44. G. M. Ljungkvist and R. G. Nordlinder. Am. Ind. Hyg. Assoc. J. 56, 693–697 (1995).45. L. L. Needham, R. H. Hill, D. L. Ashley, J. L. Pirkle, E. J. Sampson. Environ. Health Persp. 103,
89–94 (1995).46. J. Baelum. Int. Arch. Occup. Environ. Health 62, 59–64 (1990).47. R. Heinrich-Ramm, K.-H. Tieu, D. Szadkowski. Tiefkühllagerung von Blutproben zur
Aromatenbestimmung - Untersuchungen zur Qualitätssicherung in der präanalytischen Phase.Proceedings of the 38th Annual Meeting Deutsche Gesellschaft für Arbeitsmedizin undUmweltmedizin, E. Hallier (Ed.), pp. 573–575, Rindt Druck, Iulda (1998).
48. F. L. Cardinali, J. M. McCraw, D. L. Ashley, M. Bonin, J. Wooten. J. Chrom. Sci. 33, 557–560(1995).
49. F. L. Cardinali, J. M. McCraw, D. L. Ashley, M. Bonin. J. Chrom. Sci. 32, 557–560 (1994).50. L. Dunemann and H. Hajimiragha. Anal. Chim. Acta 283, 199–206, (1993).51. L. Dunemann, J. Begerow, A. Bucholski. Sample preparation for trace analysis. In Ullmann’s
Encyclopedia of Industral Chemistry, Vol. 5B, 65–93, VCH Weinheim, Germany (1994).52. J. Pawliszyn. Solid Phase Microextraction, Wiley-VCH, Weinheim, Germany (1994).53. D. L. Ashley, personal communication (1999).54. D. Stamm. J. Clin. Chem. Clin. Biochem. 20, 817–824 (1982).55. J. Angerer and G. Lehnert. Anforderungen an arbeitsmedizinisch-toxikologische Analysen. Dtsch.
Ärztebl. 94, A-2331-2338 (1997).56. International Organization for Standardization (ISO). ISO/IEC Guide 25. General requirements
for the competence of calibration and testing laboratories, 3rd ed. (1990).57. International Organization for Standardization (ISO), ISO/IEC Guide 58. Calibration and testing
laboratory accreditation systems: General requirements for operation and recognition. 1st ed. Geneva(1993).
58. CEN/CENELEC. European standard EN 45001, General criteria for the operation of testinglaboratories. Brussels, Belgium: CEN/CENELEC The Joint European Standards Institution (1989).
59. J. Angerer and K. H. Schaller (Eds.), Analyses of Hazardous Substances in Biological Materials,Vols. 1 to 5, VCH, Weinheim, Germany (1985–1997).
60. R. Heinrich-Ramm, G. Lehnert, J. Angerer. Ann. Ist. Super. Sanita 32, No. 2, 247–252 (1996)(Special Issue on European external quality assessment schemes in occupational and environmentalmedicine).
61. M. Patriarca, A. Menditto, A. Taylor. Ann. Ist. Super. Sanita 32, No. 2, 193–198 (1996) (SpecialIssue on European external quality assessment schemes in occupational and environmentalmedicine).
62. J. Angerer and J. Gündel. Ann. Ist. Super. Sanita 32, No. 2, 199–207 (1996) (Special Issue onEuropean external quality assessment schemes in occupational and environmental medicine).
63. M. Sugita, A. Harada, M. Taniguchi, M. Saito, K. Imasizumi, M. Kitamura, Y. Kodama, Y. Mori,O. Wada, M. Ikeda. Int. Arch. Occup. Environ. Health 62, 569–577 (1991).
64. J. S. Yang, M. Y. Lee, I. J. Park, Y. H. Moon, S.-K. Kang. Int. Arch. Occup. Environ. Health 69,361–366 (1997).

Biological monitoring for exposure to volatile organic compounds 433
© 2000 IUPAC, Pure and Applied Chemistry 72, 385–436
65. J. Kristiansen and J. M. Christensen. Ann. Clin. Biochem. 35, 371–379 (1998).66. European Cooperation for Accreditation of Laboratories (EAL). The Expression of Uncertainty
in Quantitative Testing, draft 6, EAL/Fteut(96)01, EAL (1996).67. International Organization for Standardization (ISO). Guide to Expression to Uncertainty in
Measurement (GUM). Bureau International des Poids et Mésures (BIPM), InternationalElectrotechnical Commission (IEC), International Federation of Clinical Chemistry (IFCC),International Organization for Standardization (ISO), International Union of Pure and AppliedChemistry (IUPAC), International Union of Pure and Applied Physics (IUPAP), InternationalOrganization of Legal Metrology (OIML), Geneva: ISO (1993).
68. Eurachem. Quantifying Uncertainty in Analytical Measurements, 1st ed. Eurachem (1995).69. J. Kristiansen, J. M. Christensen, J. L. Nielsen. Mikrochem. Acta 123, 241–249 (1996).70. D. Guest, M. L. Hamilton, P. J. Deisinger, G. D. DiVicenzo. Environ. Health Persp. 57, 177–183
(1984).71. DFG, Deutsche Forschungsgemeinschaft/Commission for the Investigation of Health Hazards of
Chemical Compounds in the Work Area, List of MAK and BAT values 1999. Report No. 35,VCH, Weinheim, Germany.
72. H. Greim and G. Lehnert. Biologische Arbeitsstoff-Toleranz-Werte (BAT-Werte) undExpositionsäquivalente für krebserzeugende Arbeitsstoffe (EKA), arbeitsmedizinisch-toxikologische Begründungen. VCH, Weinheim, Germany, 1st to 8th supplement (1983–1996).
73. ACGIH, American Conference of Governmental Industrial Hygienists. Threshold Limit Valuesfor Chemical Substances and Physical Agents and Biological Exposure Indices 1997. Cincinnati,Ohio, USA (1997).
74. ACGIH, American Conference of Governmental Industrial Hygienists. Documentation of theThreshold Limit Values and Biological Exposure Indices. Cincinnati, Ohio, USA, 1st to 6th
supplement (1980–1991).75. J. G. Fernandez, P. O. Droz, B. E. Humbert, J. R. Caperos. Br. J. Ind. Med. 34, 43–55 (1977).76. R. D. Stewart, E. D. Baretta, H. C. Dodd, T. R. Torkelson. Arch. Environ. Health 20, 224–230
(1970).77. E. Guberan and J. Fernandez. Brit. J. Ind. Med. 31, 159–167 (1974).78. L. Alessio, A. Berlin, A. Dell’Orto, F. Toffoletto, I. Ghezzi. Int. Arch. Occup. Environ. Health 55,
99–106 (1985).79. M. F. Boeninger, L. K. Lowry, J. Rosenberg. Am. Ind. Hyg. Assoc. J. 54, 615–627 (1993).80. A. Demaurex, H. L. Küng, H. Wirz. Soz. Prävmed. 28, 88–94 (1983).81. M. Weihrauch, B. Schulze, K. H. Schaller, G. Lehnert. Arbeitsmed. Sozialmed. Umweltmed. 32,
351–355 (1997).82. P. W. Kok and C. N. Ong. Int. Arch. Occup. Environ. Health 66, 195–201 (1994).83. G. Pezzagno, M. Imbriani, S. Ghittori, E. Capodaglio. Am. Ind. Hyg. Assoc. J. 49, 546–552 (1988).84. M. Imbriani, S. Ghittori, G. Pezzagno, E. Capdaglio. Int. Arch. Occup. Environ. Health 55, 33–41
(1984).85. K. Mizunuma, T. Yasugi, T. Kawai. Arch. Environ. Contam. Toxicol. 25, 129–133 (1993).86. F. Gobba, C. Galassi, S. Ghittori et al. Scand. J. Work Environ. Health 19, 132–135 (1993).87. M. Ikeda. Toxicol. Lett. 5, 99–106 (1999).88. O. M. Poulsen, E. Holst, J. M. Christensen. Pure Appl. Chem. 69, 1601–1611 (1997).89. H. E. Solberg. J. Clin. Chem. Clin. Biochem. 25, 337–342 (1987).

434 R. HEINRICH-RAMM et al.
© 2000 IUPAC, Pure and Applied Chemistry 72, 385–436
90. E. M. Waters, H. B. Gerstner, J. E. Huff. J. Toxicol. Environ. Health 2, 671–707 (1977).91. J. Lewalter and W. Steffens. Erfassung und Bewertung kumulierender Stoffbelastungen beim
Umgang mit Alkylantien und Aminoaromaten. Proceedings of the 36th Annual Meeting DeutscheGesellschaft für Arbeitsmedizin und Umweltmedizin, E. Münzberger (Ed.), p. 301–309, RindtDruck, Fulda (1996).
92. P. Spencer, H. Schaumburg, R. L. Raleigh, C. H. Terhaar. Arch. Neurol. (Chic.) 32, 219–222(1975).
93. D. Billmaier, H. T. Yee, N. Craft, N. Williams, S. Epstein, R. Fontaine. J. Occup. Med. 16, 665–671 (1974).
94. M. Ogata, V. Fiserova-Bergerova, P. O. Droz. Appl. Occup. Environ. Hyg. 8, 609–617 (1993).95. P. Robertson, Jr., E. L. White, J. S. Bus. Xenobiotica 19, 721–729 (1989).96. Takeuchi Y., Hisanaga N., Ono Y., Shibata E., Saito I., Iwata M., Modification of metabolism and
nerotoxicity on hexane by co-exposure of toluene. Int. Arch. Occup. Environ. Health 65 (Suppl.1), 227–230 (1993).
97. A. Sato, K. Endoh, T. Kaneko, G. Johanson. Brit. J. Ind. Med. 48, 548–556 (1991).98. M. Ikeda M. Tox. Lett. 77, 85–91 (1995).99. A. Sato, T. Nakajima. Toxicol. Appl. Pharmacol. 48, 249–256 (1979).100. M. Wallen, S. Holm, M. B. Nordquist. Brit. J. Ind. Med. 42, 111–116 (1985).101. R. Tardiff, S. Lapare, K. Krishnan, J. Brodeur. Int. Arch. Occup. Environ. Health 65, S135–S137
(1993).102. K. Savolainen, V. Riihimäki, A. Laine, J. Ketoni. Int. Arch. Occup. Environ. Health 49, 89–98
(1981).103. K. Engström, V. Riihimäki, A. Laine. Int. Arch. Occup. Environ. Health 54, 355–363 (1984).104. J. Liira, V. Riihimäki, K. Engström, P. Pfäffli. Scand. J. Work Environ. Health 14, 322–327 (1988).105. M. Jakubowski and P. Kostrzewski. Polish J. Occup. Med. 2, 238–247 (1989).106. E. Wigaeus, A. Lof, M. B. Nordqvist. Brit. J. Ind. Med. 41, 539–516 (1984).107. M. Ogata, T. Taguchi, T. Horike. Appl. Occup. Environ. Hyg. 10, 913–920 (1995).108. D. Marhuenda, M. J. Prieto, J. F. Periago, J. Marti, L. Perbellini, A. Cardona. Int. Arch. Occup.
Environ. Health 69, 455–460 (1997).109. O. Inoue, K. Seiji, T. Watanabe, M. Kasahara, H. Nakatsuka, S. Yin. Int. Arch. Occup. Environ.
Health 60, 15–20 (1988).110. M.-Y. Huang, C. Jin, Y.-T. Liu, B.-H. Li, Q.-S. Qu, Y. Uchida. Occup. Environ. Med. 51, 42–46
(1994).111. T. Kawai, K. Mizunuma, T. Yasugi, S. Horiguchi, C.-S. Moon Z.-W. Zhang. Arch. Environ. Contam.
Toxicol. 28, 543–546 (1995).112. T. Kawai, T. Yasugi, K. Mizunuma, S. Horiguchi, I. Morioka, K. Miyashita, Y. Uchida, M. Ikeda.
Int. Arch. Occup. Environ. Health 63, 428–435 (1992).113. A. Ferioli, P. Buizza, P. Apostoli, C. Soave, L. Alessio. Interazioni metaboliche tra acetone e
stirene in vavoratori del comparto betr-resine. Esposizione a stirene, E. Capodaglio and L. Manzo(Eds.), pp 113–124, La Goliardica, Pavia, Italy (1990).
114. L. Perbellini, G. B. Bartolucci, F. Brugnone, E. De Rosa, F. Balentini. Med. Lavoro 76, 35–43(1985).
115. L. Alessio. Int. Arch. Occup. Environ. Health 69, 1–4 (1996).116. V. Fiserova-Bergerova. Appl. Occup. Environ. Hyg. 8, 757–760 (1993).

Biological monitoring for exposure to volatile organic compounds 435
© 2000 IUPAC, Pure and Applied Chemistry 72, 385–436
117. M. Wallen, P. H. Nasung, M. Byfalt Nordqvist. Toxicol. Appl. Pharmacol. 76, 414–419 (1984).118. S. Cerny, J. Mraz, J. Flek, M. Tichy. Int. Arch. Occup. Environ. Health 62, 234–247 (1990).119. T. Brüning, M. Lammert, M. Kempkes, R. Thier, K. Golka, H. M. Bolt. Arch. Toxicol. 71, 596–
599 (1997).120. W. Dekant, S. Vamvakas, K. Berthold, S. Schmidt, D. Wild, D. Henschler. Chem. Biol. Interact.
60, 31–45 (1986).121. H. Greim and E. Deml. Toxikologie, p. 110, VCH, Weinheim, Germany (1996).122. R. Garnier, M.-O. Rambourg-Schepens, A. Müller, E. Hallier. Occup. Environ. Med. 53, 211–215
(1996).123. L. Perbellini, G. B. Faccini, F. Pasini, F. Cazzoli, S. Pistoia, R. Rosellini, M. Valsecchi, F. Brugnone.
Brit. J. Ind. Med. 45, 345–352 (1988).124. Brugnone F., Perbellini L., Faccini G. B., Pasini F., Maranelli G., Romeo L., Gobbi M., Zedde A.,
Breath and blood levels of benzene, toluene, cumene and styrene in non-occupational exposure.Int. Arch. Occup. Environ. Health 61, 303–311 (1989).
125. F. Brugnone, G. Maranelli, L. Romeo, C. Giualiari, M. Gobbi, F. Malesani, G. Bassi, C.Alexopoulos. Int. Arch. Occup. Environ. Health 63, 157–160 (1991).
126. F. Brugnone, L. Perbellini, G. Maranelli, L. Romeo, G. Guglielmi, F. Lombardini. Int. Arch. Occup.Environ. Health 64, 179–184 (1992).
127. F. Brugnone, L. Perbellini, G. Z. Wang, G. Maranelli, E. Raineri, E. De Rosa, C. Saletti, C. Soave,L. Romeo. Int. Arch. Occup. Environ. Health 65, 125–130 (1993).
128. F. Brugnone, M. Gobbi, K. Ayyad, C. Giuliari, M. Cerpelloni, L. Perbellini. Int. Arch. Occup.Environ. Health 66, 421–425 (1995).
129. H. Hajimiragha, U. Ewers, A. Brockhaus, A. Boettger. Int. Arch. Occup. Environ. Health 61, 513–518 (1989).
130. J. Angerer, G. Scherer, K. H. Schaller, J. Müller. Fres. J. Anal. Chem. 339, 740–742 (1991).131. J. Angerer, B. Heinzow, D. O. Reimann, W. Knorz, G. Lehnert. Int. Arch. Occup. Environ. Health
64, 265–273 (1992).132. H. W. Chriske, A. Brockhaus, U. Ewers. Arbeitsmed. Sozialmed. Präventivmed. 26, 483–485
(1991).133. H. W. Goergens, I. Kurosinski, H. Hajimiragha, U. Ewers, A. Brockhaus. Arbeitsmed. Sozialmed.
Präventivmed. 26, 50–54 (1991).134. G. Wang, G. Maranelli, L. Perbellini, G. Guglielmi, F. Brugnone. Int. Arch. Occup. Environ.
Health 65, 201–203 (1993).135. D. L. Ashley, M. A. Bonin, F. L. Cardinali, J. M. McCraw, J. V. Wooten. Clin. Chem. 40, 1401–
1404 (1994).136. S. Fustinoni, M. Buratii, R. Giampiccolo, S. Pulvirenti, A. Colombi. Med.-Lav. 87, 63–75 (1996).137 F. Brugnone, L. Perbellini, L. Romeo, M. Bianchin, A. Tonello, G. Pianalto, D. Zambon, G.
Zanon. Int. Arch. Occup. Environ. Health 71, 554–559 (1998).138. CEC, Council Directive of 27 November 1980 on the protection of workers from the risks related
to exposure to chemical, physical and biological agents at work. 80/1107/EEC Off. J. Europ.Commun. No. L 327/8-11.
139. CEC, Council Directive of 28 July 1982 on the protection of workers from the risks related toexposure to metallic lead and its ionic compounds at work. 82/605/EEC Off. J. Europ. Commun.No. L 247/12–17.

436 R. HEINRICH-RAMM et al.
© 2000 IUPAC, Pure and Applied Chemistry 72, 385–436
140. CEC, Council Directive of 7 April 1998 Council Directive on the protection of the health andsafety of workers from the risks related to chemical agents at work. 94/C 191/04 Off. J. Europ.Commun. No L 131, 05/05/1998, 11–23.
141. G. Lehnert. Arbeitsmed. Sozialmed. Präventivmed. 15, 266–270 (1980).142. TRGS 900: Grenzwerte in der Luft am Arbeitsplatz - MAK und TRK-Werte. Bundesarbeitsbl.34,
6/1994.143. TRGS 903: Biologische Arbeitsplatztoleranz-Werte - BAT-Werte. Bundesarbeitsbl. 53, 6/1994.144. TRGS 710: Biomonitoring. Bundesarbeitsbl. 60–62, 2/2000.145. TRGS 150: Unmittelbarer Hautkontakt mit Gefahrstoffen. Bundesarbeitsbl. 47, 10/1987.146. Aitio, A. Kallio, M. Kiilunen, H. Kivistö, M. Luotamo, K. Pekari, S. Valkonen, L. Ahlström.
Biomonitoring of chemical exposure. 134 pp: Guideline for sample collection 1997 (in Finnish),Finnish Institute of Occupational Health 1997.
147. L. Ahlström (Ed.). Kemikaalialtistumisen biomonitorointi. Näytteenotto-ohjeet. Biomonitoring ofchemical exposure: Guideline for sample collection (in Finnish). 5th ed. Institute of OccupationalHealth, Helsinki (1998).
148. Valtioneuvosto. No. 920. Valtioneuvoston päätös työntekijöiden suojelemisesta kemiallisilletekijöille altistumiseen liittyviltä vaaroilta. Annettu Helsingissä 8. päivänä lokakuuta 1992. SuomenSäädöskokoelma 1992:2399–2404. Council of Ministers’ Decree No. 920 on the protection ofworkers against hazards realted to exposure to chemical agents, given on 8 October 1992 (inFinnish).
149. M. Kiilunen. Int. Arch. Occup. Environ. Health 72, 261–267 (1999).150. Ministry of Social Affairs and Health Sosiaali- ja terveysministeriö, Kemian
työsuojeluneuvottelukunta. (1998) Occupational exposure limits in Finland. HTP-arvot 1998 ( inFinnish). Turvallisuustiedote 25. Ministry of Social Affairs and Health, Tampere.
151. The Japan Society for Occupational Health (JSOH), Recommendation of occupational exposurelimits (1996–1997). J. Occup. Health 38, 134–147 (1996).
152. K. Omae, T. Takebayashi, H. Sakurai H. Int. Arch. Occup. Environ. Health 72, 271–273 (1999).153. Institut National de Recherche et de Sécurité (INRS), Indicateurs biologiques d’exposition.
Principles de base et valeurs-guides utilisables en France, Cah. Not. Docum. 1908, 1–8 (1993).154. Fondazione Clinica del Lavoro, Centro Ricerche Fisiopatologia e Sicurezza del Lavoro, S. Ghittori,
Indicatori biologici d’espositione, Pavia 1994 (cited according to personal communication by L.Lowry, University of Texas/USA).
155. H. K. Wilson. Int. Arch. Occup. Environ. Health 72, 274–278 (1999).156. Health and Safety Executive, Biological monitoring in the workplace, HSG 167, HSE Books,
London (1997).157. M. Jakubowski (Ed.). Monitoring biologiczny narazenia naczynniki chemiczne w srodowisku
pracy (biological monitoring of chemical exposure at the workplace). Oficyna WydawniczaInstytutu Medycyny Pracy Lodz (1997).