Comparison of the volatile organic compound recovery rates ...
10
Comparison of the volatile organic compound recovery rates of commercial active samplers for evaluation of indoor air quality in work environments Yuichi Miyake 1 & Masahiro Tokumura 1 & Qi Wang 1 & Zhiwei Wang 1 & Takashi Amagai 1 Received: 20 December 2016 /Accepted: 7 February 2017 # The Author(s) 2017. This article is published with open access at Springerlink.com Abstract The Industrial Safety and Health Law in Japan established administrative levels for volatile organic com- pounds (VOCs) in indoor air. In the present study, these 49 VOCs were extracted from the absorbents of commercial ac- tive samplers from Sibata Scientific Technology (carbon-bead active sampler), SKC Inc. (Anasorb CSC sorbent tube), and Gastec (bead-shaped activated carbon tube) using carbon di- sulfide, and the recovery rates were compared. The VOCs were added to the adsorbents at three concentration levels relative to the administrative levels (×0.5, ×1, and ×2). The following mean recovery rates of the 49 VOCs were obtained at the ×0.5, ×1, and ×2 levels: 86, 93, and 92% for the Sibata sampler; 78, 82, and 84% for the SKC sampler; and 94, 93, and 90% for the Gastec sampler. With the Sibata sampler, the recovery rates of 78% (×0.5), 84% (×1), and 90% (×2) of the VOCs measured in this study were adequate (80–120%); the corresponding percentages for the SKC sampler were 67% (×0.5), 69% (×1), and 69% (×2), and those for the Gastec sampler were 92% (×0.5), 86% (×1), and 86% (×2). The ef- fects of the octanol–water partition coefficients and vapor pressures of the VOCs on the recovery rates were investigated. The recovery rates increased with increases in the octanol– water partition coefficient and the vapor pressure and then leveled off. The recovery rates for the o-, m-, and p-cresol isomers were much lower than those obtained for other VOCs at all three concentration levels and with all samplers. Keywords Activated carbon . Active sampler . Indoor air . Recovery rate . Work environment Introduction To evaluate indoor air quality, active sampling of indoor air pollutants with an adsorbent tube is used for environmental and occupational applications (Ohura et al. 2009; Gallego et al. 2010 ; Ramírez et al. 2010 ; Chin et al. 2013 ; Jumpponen et al. 2013; Tunsaringkarn et al. 2015; Song et al. 2016). Shinohara et al. (2013) used an active sampler to collect samples to measure 11 volatile organic compounds (VOCs), including toluene, p-dichlorobenzene, α-pinene, and aldehydes (formaldehyde and acetaldehyde) in 19 temporary houses in Minami-soma City, Japan, following the Great East Japan earthquake. In another study, nitrogen dioxide concen- trations were also measured using an active sampler (Shinohara et al. 2014). In an occupational application, Chen et al. (2014) used an active sampler to collect samples to measure the concentrations of 8 VOCs (e.g., benzene, toluene, and xylenes) in the passenger cabins of 38 taxis in Changsha, China. Their results indicated that VOC concentrations in tax- is could be a health risk to passengers and drivers. Generally, exposure to some VOCs is likely to be higher in occupational settings than in residential indoor and outdoor settings (Jo and Song 2001; Jia et al. 2008; Majumdar et al. 2008; Freberg et al. 2014; Tokumura et al. 2016). Exposure to VOCs from solvent use tends to be high (Leung et al. 2005; Electronic supplementary material The online version of this article (doi:10.1007/s11869-017-0465-0) contains supplementary material, which is available to authorized users. * Masahiro Tokumura [email protected] * Takashi Amagai [email protected] 1 Graduate School of Nutritional and Environmental Science, University of Shizuoka, 52-1 Yada, Suruga-ku, Shizuoka 422-8526, Japan Air Qual Atmos Health DOI 10.1007/s11869-017-0465-0
-
Upload
khangminh22 -
Category
Documents
-
view
1 -
download
0
Transcript of Comparison of the volatile organic compound recovery rates ...

Comparison of the volatile organic compound recovery ratesof commercial active samplers for evaluation of indoor air qualityin work environments
Yuichi Miyake1 & Masahiro Tokumura1 & Qi Wang1 & Zhiwei Wang1 &
Takashi Amagai1
Received: 20 December 2016 /Accepted: 7 February 2017# The Author(s) 2017. This article is published with open access at Springerlink.com
Abstract The Industrial Safety and Health Law in Japanestablished administrative levels for volatile organic com-pounds (VOCs) in indoor air. In the present study, these 49VOCs were extracted from the absorbents of commercial ac-tive samplers from Sibata Scientific Technology (carbon-beadactive sampler), SKC Inc. (Anasorb CSC sorbent tube), andGastec (bead-shaped activated carbon tube) using carbon di-sulfide, and the recovery rates were compared. The VOCswere added to the adsorbents at three concentration levelsrelative to the administrative levels (×0.5, ×1, and ×2). Thefollowing mean recovery rates of the 49 VOCs were obtainedat the ×0.5, ×1, and ×2 levels: 86, 93, and 92% for the Sibatasampler; 78, 82, and 84% for the SKC sampler; and 94, 93,and 90% for the Gastec sampler. With the Sibata sampler, therecovery rates of 78% (×0.5), 84% (×1), and 90% (×2) of theVOCs measured in this study were adequate (80–120%); thecorresponding percentages for the SKC sampler were 67%(×0.5), 69% (×1), and 69% (×2), and those for the Gastecsampler were 92% (×0.5), 86% (×1), and 86% (×2). The ef-fects of the octanol–water partition coefficients and vaporpressures of the VOCs on the recovery rates were investigated.
The recovery rates increased with increases in the octanol–water partition coefficient and the vapor pressure and thenleveled off. The recovery rates for the o-, m-, and p-cresolisomers were much lower than those obtained for otherVOCs at all three concentration levels and with all samplers.
Keywords Activated carbon . Active sampler . Indoor air .
Recovery rate .Work environment
Introduction
To evaluate indoor air quality, active sampling of indoor airpollutants with an adsorbent tube is used for environmentaland occupational applications (Ohura et al. 2009; Gallegoet al. 2010; Ramírez et al. 2010; Chin et al. 2013;Jumpponen et al. 2013; Tunsaringkarn et al. 2015; Songet al. 2016). Shinohara et al. (2013) used an active samplerto collect samples to measure 11 volatile organic compounds(VOCs), including toluene, p-dichlorobenzene, α-pinene, andaldehydes (formaldehyde and acetaldehyde) in 19 temporaryhouses in Minami-soma City, Japan, following the Great EastJapan earthquake. In another study, nitrogen dioxide concen-trations were also measured using an active sampler(Shinohara et al. 2014). In an occupational application, Chenet al. (2014) used an active sampler to collect samples tomeasure the concentrations of 8 VOCs (e.g., benzene, toluene,and xylenes) in the passenger cabins of 38 taxis in Changsha,China. Their results indicated that VOC concentrations in tax-is could be a health risk to passengers and drivers.
Generally, exposure to some VOCs is likely to be higher inoccupational settings than in residential indoor and outdoorsettings (Jo and Song 2001; Jia et al. 2008; Majumdar et al.2008; Freberg et al. 2014; Tokumura et al. 2016). Exposure toVOCs from solvent use tends to be high (Leung et al. 2005;
Electronic supplementary material The online version of this article(doi:10.1007/s11869-017-0465-0) contains supplementary material,which is available to authorized users.
* Masahiro [email protected]
* Takashi [email protected]
1 Graduate School of Nutritional and Environmental Science,University of Shizuoka, 52-1 Yada, Suruga-ku, Shizuoka 422-8526,Japan
Air Qual Atmos HealthDOI 10.1007/s11869-017-0465-0
Uang et al. 2006; Vitali et al. 2006). Attarchi et al. (2013)reported that workers in a car-manufacturing plant, who wereoccupationally exposed to VOCs originating from mixed or-ganic solvents (e.g., benzene, toluene, and xylenes), had ahigh risk of hypertension. In Japan, to protect workers, theIndustrial Safety and Health Law established administrativelevels for the concentrations of 49 VOCs in indoor work en-vironments, where VOCs are used as solvents (The JapanAssociation for Working Environment Measurement 2012).The use of active samplers is certified by the IndustrialSafety and Health Law in Japan for collection of air samplesfor VOC analysis.
Nowadays, there are many types of active samplers com-mercially available (Król et al. 2010; Gallego et al. 2011).Samplers differ in type of adsorbent (e.g., activated carbon,silica gel, and polyurethane foam) and construction (e.g., sin-gle layer and double layer), and samplers can be targeted to thephysicochemical properties of the VOCs of interest to opti-mize extraction. Activated carbon is frequently used as anadsorbent for VOCs because it is inexpensive, has a largeadsorption capacity, and is adaptable to many types ofchemicals. Activated carbons in commercial active samplerscan be produced from different precursor materials and differin their specific surface areas and particle sizes. Thesecharacteristics influence adsorption of VOCs and eventuallyaffect the accuracy of the measurement. However, to date, fewstudies have investigated the effects of these characteristics onaccuracy. Borrás et al. (2012) investigated optimization of anactive sampler/extraction solvent combination using ORBO-32 activated coconut charcoal (Sigma-Aldrich, St. Louis,MO)and Anasorb CSC coconut charcoal (SKC Ltd., Eighty Four,PA) as the active samplers and hexane and toluene as theextraction solvents. Carbon disulfide in the gas phase wasmeasured to determine the recovery rate, repeatability,reproducibility, and detection limit. According to theirresults, the Anasorb CSC coconut charcoal sampler incombination with hexane provided adequate sensitivity,good linearity, and a fast and easy protocol for monitoringtrace carbon disulfide in air. Abiko (2015) compared the re-covery rates of six VOCs (toluene, 1-butanol, acetone,cyclohexanone, ethylene glycol monoethyl ether, and butylacetate) using eight commercial active samplers to investigatewhat parameters could directly influence the accuracy of de-termination. The investigator used activated carbons preparedfrom coconut shell and petroleum and found that the averageparticle diameter and the precursor material used to preparethe adsorbent affected the recovery rate. However, notenough samples were analyzed to be able to observetrends in the data, and the recovery rates fluctuated withthe type of sampler and VOC. Moreover, the number ofVOCs analyzed was limited. Therefore, a more compre-hensive study with many kinds of VOCs is required toobtain consistent results.
The aim of this study was to compare the recovery ratesobtained with different commercial active samplers for 49VOCs (Table 1), including isomers, that are included in theIndustrial Safety and Health Law in Japan. The commercialactive samplers selected were from Sibata, SKC, and Gastec,and the VOCs were added to the absorbents at three concen-tration levels (0.5, 1, and 2 times the administrative levels) andwere extracted using carbon disulfide. The effects of physico-chemical properties (octanol–water partition coefficient [logKOW] and vapor pressure) of the VOCs on the recovery rateswere also investigated.
Methods
Chemicals and materials
Standards of 1,1,1-trichloroethane and methyl n-butyl ketonewere purchased from Tokyo Chemical Industry Co., Ltd.(Tokyo, Japan). Isopropyl alcohol and 1,2-dichloroethanewere obtained from Kanto Chemical Co. (Tokyo, Japan) andDojindo Molecular Technologies, Inc. (Rockville, MD), re-spectively. All other chemicals were purchased from WakoPure Chemical Industries, Ltd. (Osaka, Japan). Deuteratedtoluene (toluene-d8) was obtained from Cambridge IsotopeLaboratories (Tewksbury, MA). Carbon disulfide (WakoPure Chemical Industries, Ltd.) was used as an extractionsolvent. Helium gas (99.999%) was supplied by TaiyoNippon Sanso Corporation (Tokyo, Japan).
The active samplers purchased for this study were acarbon-bead active sampler (080150–090, Sibata ScientificTechnology, Ltd., Saitama, Japan), an Anasorb CSC sorbenttube (SKC 226–01, SKC Inc., Eighty Four, PA, USA), and abead-shaped activated carbon tube (No. 258, Gastec Co.,Ayase, Kanagawa, Japan). The parameters for these commer-cial active samplers are given in Table 2, and the pictures ofthem are shown in Fig. S1.
Determination of recovery rates for VOCsfrom the adsorbents in the commercial active samplers
Taking into account the air sampling volume (1 L) determinedby the analytical method established by the Industrial Safetyand Health Act in Japan (The Japan Association for WorkingEnvironment Measurement 2012), the amounts of addition ofVOCs to the sampler adsorbents for each concentration levelwere determined. To simplify the addition of VOCs in solvent(carbon disulfide) to the sampler adsorbents, a separate VOCmixed standard solution was prepared for each concentrationlevel so that the volume of this mixed standard solution addedto the adsorbent was 4 μL. This resulted in two mixed stan-dards for the ×0.5 level, four mixed standards for the ×1 level,and eight mixed standards for the ×2 level. The VOCs in each
Air Qual Atmos Health
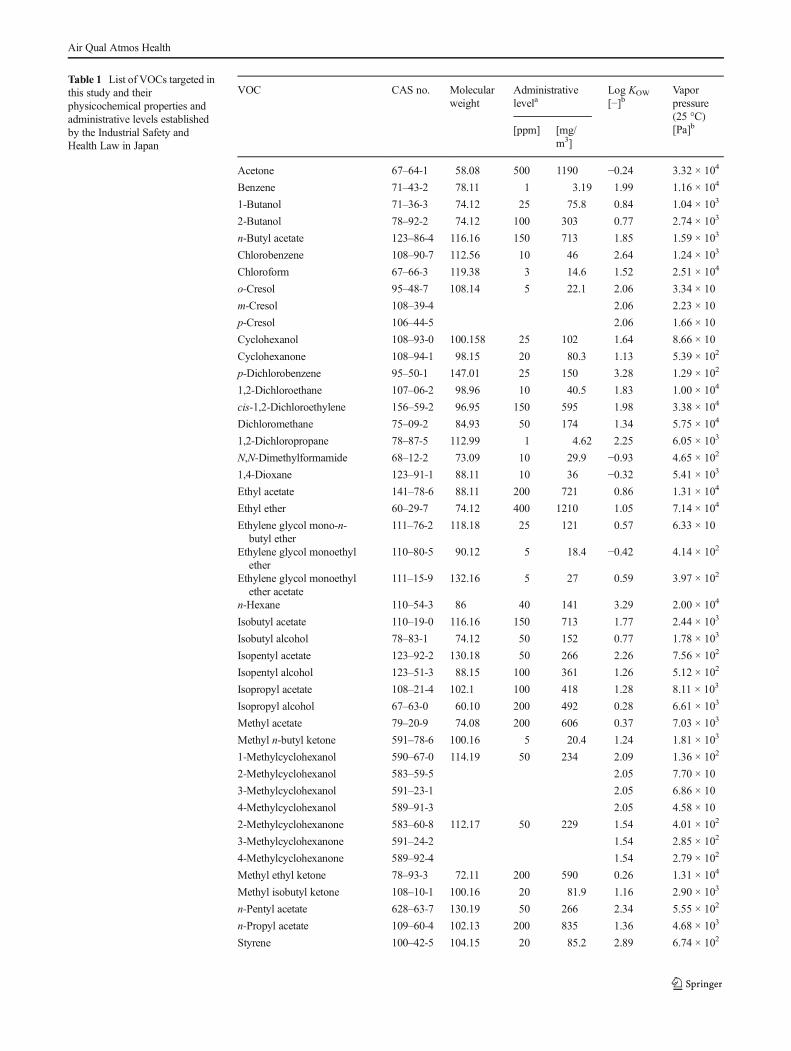
Table 1 List of VOCs targeted inthis study and theirphysicochemical properties andadministrative levels establishedby the Industrial Safety andHealth Law in Japan
VOC CAS no. Molecularweight
Administrativelevela
Log KOW
[−]bVaporpressure(25 °C)[Pa]b[ppm] [mg/
m3]
Acetone 67–64-1 58.08 500 1190 −0.24 3.32 × 10⁴
Benzene 71–43-2 78.11 1 3.19 1.99 1.16 × 10⁴
1-Butanol 71–36-3 74.12 25 75.8 0.84 1.04 × 10³
2-Butanol 78–92-2 74.12 100 303 0.77 2.74 × 10³
n-Butyl acetate 123–86-4 116.16 150 713 1.85 1.59 × 10³
Chlorobenzene 108–90-7 112.56 10 46 2.64 1.24 × 10³
Chloroform 67–66-3 119.38 3 14.6 1.52 2.51 × 10⁴
o-Cresol 95–48-7 108.14 5 22.1 2.06 3.34 × 10
m-Cresol 108–39-4 2.06 2.23 × 10
p-Cresol 106–44-5 2.06 1.66 × 10
Cyclohexanol 108–93-0 100.158 25 102 1.64 8.66 × 10
Cyclohexanone 108–94-1 98.15 20 80.3 1.13 5.39 × 10²
p-Dichlorobenzene 95–50-1 147.01 25 150 3.28 1.29 × 10²
1,2-Dichloroethane 107–06-2 98.96 10 40.5 1.83 1.00 × 10⁴
cis-1,2-Dichloroethylene 156–59-2 96.95 150 595 1.98 3.38 × 10⁴
Dichloromethane 75–09-2 84.93 50 174 1.34 5.75 × 10⁴
1,2-Dichloropropane 78–87-5 112.99 1 4.62 2.25 6.05 × 10³
N,N-Dimethylformamide 68–12-2 73.09 10 29.9 −0.93 4.65 × 10²
1,4-Dioxane 123–91-1 88.11 10 36 −0.32 5.41 × 10³
Ethyl acetate 141–78-6 88.11 200 721 0.86 1.31 × 10⁴
Ethyl ether 60–29-7 74.12 400 1210 1.05 7.14 × 10⁴
Ethylene glycol mono-n-butyl ether
111–76-2 118.18 25 121 0.57 6.33 × 10
Ethylene glycol monoethylether
110–80-5 90.12 5 18.4 −0.42 4.14 × 10²
Ethylene glycol monoethylether acetate
111–15-9 132.16 5 27 0.59 3.97 × 10²
n-Hexane 110–54-3 86 40 141 3.29 2.00 × 10⁴
Isobutyl acetate 110–19-0 116.16 150 713 1.77 2.44 × 10³
Isobutyl alcohol 78–83-1 74.12 50 152 0.77 1.78 × 10³
Isopentyl acetate 123–92-2 130.18 50 266 2.26 7.56 × 10²
Isopentyl alcohol 123–51-3 88.15 100 361 1.26 5.12 × 10²
Isopropyl acetate 108–21-4 102.1 100 418 1.28 8.11 × 10³
Isopropyl alcohol 67–63-0 60.10 200 492 0.28 6.61 × 10³
Methyl acetate 79–20-9 74.08 200 606 0.37 7.03 × 10³
Methyl n-butyl ketone 591–78-6 100.16 5 20.4 1.24 1.81 × 10³
1-Methylcyclohexanol 590–67-0 114.19 50 234 2.09 1.36 × 10²
2-Methylcyclohexanol 583–59-5 2.05 7.70 × 10
3-Methylcyclohexanol 591–23-1 2.05 6.86 × 10
4-Methylcyclohexanol 589–91-3 2.05 4.58 × 10
2-Methylcyclohexanone 583–60-8 112.17 50 229 1.54 4.01 × 10²
3-Methylcyclohexanone 591–24-2 1.54 2.85 × 10²
4-Methylcyclohexanone 589–92-4 1.54 2.79 × 10²
Methyl ethyl ketone 78–93-3 72.11 200 590 0.26 1.31 × 10⁴
Methyl isobutyl ketone 108–10-1 100.16 20 81.9 1.16 2.90 × 10³
n-Pentyl acetate 628–63-7 130.19 50 266 2.34 5.55 × 10²
n-Propyl acetate 109–60-4 102.13 200 835 1.36 4.68 × 10³
Styrene 100–42-5 104.15 20 85.2 2.89 6.74 × 10²
Air Qual Atmos Health

of the mixed standards are detailed in Tables S1 to S3. Foreach mixed standard solution, a 4-μL aliquot was added to theadsorbent in a commercial active sampler. Then, the samplerwas stored in a refrigerator overnight. The adsorbent wastransferred to a 4-mL vial, and 0.5 mL of toluene-d8 wasadded as a syringe spike to correct ionization efficiencies ofVOCs during their analysis using gas chromatography–massspectrometry. The concentration of toluene-d8 in all sampleswas 100μg/mL, except for in the Gastec ×0.5 and ×1 samples,which all had a toluene-d8 concentration of 56 μg/mL. Theadsorbed VOCs were extracted by shaking with 1 mL of car-bon disulfide for 60 min. The VOCs in the extract were ana-lyzed by gas chromatography–mass spectrometry using theanalytical parameters summarized in Table 3. The recoveryrate was calculated by dividing the peak area of the VOC inthe extract by the average peak area for a blank solution of thesame VOC without an adsorbent, and the resulting value wascorrected using the toluene-d8 peak. The number of each typeof sampler used was either five or six.
Results and discussion
Recovery rates for the VOCs from adsorbentsin the commercial active samplers
The recovery rates of 49 VOCs added to the adsorbents of the 3commercial active samplers were evaluated after extraction withcarbon disulfide, and themeans, standard deviations, and relativestandard deviations (RSDs) were calculated (Table 4). The rawdata (peak areas of the VOCs in the extracts) are given inTables S1 to S3. The results are also presented in Fig. S2.
For the Sibata sampler, the recovery rates ranged from5.4% for p-cresol to 113% for cis-1,2-dichloroethylene at the×0.5 level, 22% for p-cresol to 114% for ethylene glycolmonoethyl ether at the ×1 level, and 20% for p-cresol to113% for 1,2-dichloroethane at the ×2 level. The mean recov-ery rates for the ×0.5, ×1, and ×2 levels were 86, 93, and 92%,respectively. Satisfaction ratios were calculated as the propor-tion of VOCs with adequate recovery rates (80–120%). The
Table 1 (continued)VOC CAS no. Molecular
weightAdministrativelevela
Log KOW
[−]bVaporpressure(25 °C)[Pa]b[ppm] [mg/
m3]
Tetrachloroethylene 127–18-4 165.83 50 339 2.97 2.37 × 10³
Tetrachloromethane 56–23-5 153.82 5 31.5 2.44 1.33 × 10⁴
Tetrahydrofuran 109–99-9 72.11 50 147 0.94 2.31 × 10⁴
Toluene 108–88-3 92.14 20 75.4 2.54 3.16 × 10³
1,1,1-Trichloroethane 71–55-6 133.4 200 1090 2.68 1.49 × 10⁴
Trichloroethylene 79–01-6 131.39 10 53.7 2.47 9.66 × 10³
o-Xylene 95–47-6 106.17 50 217 3.09 9.08 × 10²
m-Xylene 108–38-3 3.09 8.83 × 10²
p-Xylene 106–42-3 3.09 9.16 × 10²
a Established by the Industrial Safety and Health Act in Japan (The Japan Association for Working EnvironmentMeasurement 2012)b Obtained from EPI Suite (US EPA 2012)
Table 2 Parameters for the threecommercial active samplersevaluated in this study
Sampler ID Sibata SKC Gastec
Size of sampler ø 6 mm, length 70 mm ø 6 mm, length 70 mm ø 10 mm, length 56 mm
Type of sampler Double layered Double layered Double layered
Separators FFW FFW FFW
Type of adsorbent Petroleum based Coconut shell based Petroleum based
Mass of adsorbent 50/100 mg 50/100 mg 50/100 mg
Size of adsorbent 20/40 mesh 20/40 mesh 20/40 mesh
F foam, W glass wool
Air Qual Atmos Health

satisfaction ratios were 78, 84, and 90% for the ×0.5, ×1, and×2 levels, respectively. Inadequate recovery rates were obtain-ed at some of the concentration levels for 1-butanol (×0.5); o-,m-, and p-cresol (all levels); dichloromethane (×0.5); N,N-dimethylformamide (all levels); ethylene glycol mono-n-butyl ether (×0.5 and ×1); ethylene glycol monoethyl ether(×0.5 and ×2); ethylene glycol monoethyl ether acetate (×1);isobutyl alcohol (×0.5 and ×1); isopropyl alcohol (×1); methylacetate (×0.5); and methyl ethyl ketone (×0.5). The recoveryrates for the cresol isomers were much lower than the recoveryrates for any of the other VOCs.
The recovery rates for the SKC sampler ranged from 1.0%for o-cresol to 109% for cis-1,2-dichloroethylene at the ×0.5level, 3.1% for p-cresol to 104% for trichloroethylene at the×1 level, and 4.8% for p-cresol to 116% for cis-1,2-dichloroethylene at the ×2 level. The mean recovery rates forthe three levels were 78, 82, and 84%, and the satisfaction ratioswere 67, 69, and 69%. Inadequate recovery rates were obtainedat some of the concentration levels for acetone (×2); 1-butanol(all levels); o-, m-, and p-cresol (all levels); cyclohexanol (alllevels); cyclohexanone (all levels); N,N-dimethylformamide(all levels); ethyl ether (×2); ethylene glycol mono-n-butyl ether(all levels); ethylene glycol monoethyl ether (all levels); ethyl-ene glycol monoethyl ether acetate (×0.5 and ×1); isopentylalcohol (all levels); isopropyl alcohol (×1); methyl acetate(×0.5); methyl ethyl ketone (×0.5); 4-methylcyclohexanol(×0.5 and ×1); and styrene (×0.5 and ×1). The recovery ratesfor the cresol isomers, N,N-dimethylformamide, ethylene gly-col mono-n-butyl ether, and ethylene glycol monoethyl etherwere much lower than the recovery rates for the other VOCs atall the concentration levels.
The recovery rates for the Gastec sampler ranged from 11%for p-cresol to 109% for benzene at the ×0.5 level, 13% for p-cresol to 116% for n-hexane at the ×1 level, and 13% for p-cresol to 113% for 1,2-dichloroethane at the ×2 level. The
mean recovery rates for the three levels were 94, 93, and90%, and the satisfaction ratios were 92, 86, and 86%.Inadequate recovery rates were obtained at some of the con-centration levels for acetone (×2); o-, m-, and p-cresol (alllevels); N,N-dimethylformamide (all levels); ethylene glycolmonoethyl ether (×1 and ×2); and p-xylene (×1). The cresolsand N,N-dimethylformamide had much lower recovery ratesthan the other VOCs at all the concentration levels.
A comparison of the recovery rates among the commercialactive samplers showed that the Sibata and Gastec samplersshowed good recovery rates. The adsorbents in these samplersare petroleum based. According to an earlier study (Abiko2015), petroleum-based activated carbons tend to show betterrecovery rates than coconut shell-based activated carbons.This tendency is in good agreement with our results. Amongthe VOCs, the cresol isomers (o-,m-, and p-cresol) showed thelowest recovery rates at all concentration levels and with allsamplers. The recovery rate of N,N-dimethylformamide wasalso much lower than the recovery rates of other VOCs withall samplers except that from Sibata.
The satisfaction ratios for the RSDs (10 or 15%) were 80%(RSD < 10%) and 94% (RSD < 15%) for the Sibata sampler(the petroleum-based adsorbents), 50% (RSD < 10%) and76% (RSD < 15%) for the SKC sampler (the coconut shell-based adsorbent), and 81% (RSD < 10%) and 92%(RSD < 15%) for the Gastec sampler (the petroleum-basedadsorbents). The cresol isomers, dichloromethane, isopropylalcohol, and methyl acetate likely had higher RSDs at mostconcentration levels and with most of the samplers. As was thecase for the recovery rates, better RSDs were obtained withthe petroleum-based adsorbents (Sibata and Gastec) than withthe coconut shell-based adsorbent (SKC).
In summary, the satisfaction ratio of adequate recovery ratewith adequately low RSD (10 or 15%) were 69%(RSD < 10%) and 78% (RSD < 15%) for the Sibata sampler,
Table 3 Gas chromatography–mass spectrometry conditions forVOC analysis
GC
Instrument 7890 (Agilent Technologies, Santa Clara, CA)
Column SUPELCOWAX 10, 60 m × 0.32 mm, 0.5 μm (Sigma-Aldrich)
Injection method Split (1:450)
Injection volume 1.0 μL
Carrier gas Helium
Flow rate 1.0 mL/min
Injector temperature 280 °C
Oven temperature program 60 °C (held 5 min) → 230 °C at 6 °C/min (held 2.67 min)
Transfer line temperature 230 °C
MS
Instrument Quattro micro (Waters, Milford, MA)
Mode Selected ion monitoring
Ion source temperature 230 °C
Ionization mode Electron ionization
Air Qual Atmos Health

Table 4 Summary of the data for the recovery rates of 49 VOCs added to the adsorbents in 3 commercial active samplers at 3 concentration levels andextracted with carbon disulfide
VOC Multipliera Sibata SKC Gastec
Mean (%) SD (%) RSD (%) Mean (%) SD (%) RSD (%) Mean (%) SD (%) RSD (%)
Acetone 0.5 101 8.4 8.4 95 17 18 92 13 141 88 5.7 6.5 84 10 12 84 14 162 93 3.9 4.2 74 13 18 75 4.9 6.5
Benzene 0.5 88 5.9 6.7 88 11 12 109 6.9 6.31 97 6.2 6.4 100 10 10 104 5.8 5.52 100 3.5 3.5 106 15 14 102 2.4 2.3
1-Butanol 0.5 69 1.9 2.7 62 11 18 98 7.4 7.61 97 8.1 8.4 71 6.7 9.4 95 8.1 8.52 106 7.1 6.6 78 10 13 92 5.5 6.0
2-Butanol 0.5 93 7.3 7.8 80 10 13 101 8.2 8.21 97 5.0 5.2 85 6.8 8.0 84 9.3 112 87 7.7 8.8 90 13 14 101 7.1 7.0
n-Butyl acetate 0.5 112 5.6 5.0 83 7.4 8.9 109 2.1 1.91 105 0.9 0.8 102 2.3 2.3 109 2.1 1.92 102 4.3 4.2 101 2.4 2.3 104 2.5 2.4
Chlorobenzene 0.5 97 3.7 3.8 95 13 14 96 4.2 4.41 103 2.9 2.8 97 2.4 2.4 98 4.0 4.12 96 2.5 2.6 100 3.1 3.1 93 2.4 2.6
Chloroform 0.5 84 7.7 9.2 87 14 16 108 7.3 6.81 100 9.2 9.1 102 11 10 108 10 9.32 99 4.8 4.8 106 10 10 99 6.2 6.3
o-Cresol 0.5 6.3 0.4 7.1 1.0 0.5 53 21 3.4 161 31 2.8 9.1 3.6 0.6 16 28 4.1 152 29 3.5 12 8.1 1.0 13 29 3.2 11
m-Cresol 0.5 5.9 0.6 10 1.4 0.5 36 12 1.9 161 29 1.3 4.4 3.6 0.8 21 17 3.0 182 24 2.9 12 7.5 0.6 8.4 18 1.7 9.3
p-Cresol 0.5 5.4 0.6 12 5.2 3.4 65 11 1.9 181 22 0.9 4.1 3.1 1.4 45 13 1.6 122 20 2.3 12 4.8 0.5 10 13 1.4 10
Cyclohexanol 0.5 81 7.2 8.9 75 13 18 94 2.6 2.71 86 20 23 65 7.4 11 94 4.3 4.62 92 3.8 4.2 77 5.7 7.5 100 9.2 9.2
Cyclohexanone 0.5 105 11 11 76 10 13 91 5.6 6.11 88 5.0 5.7 76 2.8 3.7 94 3.6 3.82 92 7.5 8.1 70 16 23 87 2.5 2.9
p-Dichlorobenzene 0.5 83 6.6 7.9 87 19 22 92 7.5 8.21 98 5.4 5.5 86 8.6 10 87 7.3 8.42 91 10.3 11.4 92 6.7 7.3 84 4.5 5.4
1,2-Dichloroethane 0.5 87 7.6 8.8 87 14 16 105 7.3 6.91 103 9.5 9.2 101 10 10 103 7.2 7.12 113 8.7 7.6 100 12 12 99 5.4 5.4
cis-1,2-Dichloroethylene 0.5 113 11 10 109 13 12 106 9.4 8.91 108 1.6 1.5 103 8.4 8.2 111 8.8 8.02 108 5.8 5.4 116 9.8 8.5 91 2.6 2.8
Dichloromethane 0.5 72 10 14 84 21 24 108 16 151 92 13 14 102 17 16 104 13 122 97 11 12 102 24 23 96 15 16
1,2-Dichloropropane 0.5 88 3.9 4.4 94 8.7 9.3 105 1.9 1.81 108 7.2 6.7 100 1.9 1.9 105 3.7 3.52 110 3.2 2.9 103 1.4 1.4 100 1.3 1.3
N,N-Dimethylformamide 0.5 36 2.5 6.9 24 6.0 25 22 6.1 281 73 5.7 7.9 19 3.7 20 30 2.1 7.02 66 3.3 4.9 28 3.2 11 43 2.6 6.2
1,4-Dioxane 0.5 103 10 10 94 6.1 6.5 103 2.5 2.41 112 3.4 3.0 97 3.0 3.1 93 3.7 4.02 109 4.6 4.2 109 4.2 3.9 88 2.2 2.5
Ethyl acetate 0.5 104 5.5 5.3 94 11 12 106 8.4 7.91 98 7.7 7.9 91 7.2 7.9 110 12 102 94 9.3 10 98 10 11 104 11 10
Ethyl ether 0.5 98 8.4 8.6 106 16 15 105 13 121 93 9.2 10 92 12 13 116 19 16
Air Qual Atmos Health

Table 4 (continued)
VOC Multipliera Sibata SKC Gastec
Mean (%) SD (%) RSD (%) Mean (%) SD (%) RSD (%) Mean (%) SD (%) RSD (%)
2 94 16 17 72 22 31 88 8.1 9.2Ethylene glycol mono-n-butyl ether 0.5 70 8.5 12 25 8.6 35 90 5.8 6.5
1 78 6.2 7.9 25 4.7 18 86 5.9 6.92 87 6.8 7.8 36 1.7 4.6 91 15 16
Ethylene glycol monoethyl ether 0.5 74 2.8 3.7 20 6.6 33 84 5.7 6.81 114 8.6 7.5 75 13 17 59 5.2 8.72 78 8.0 10 11 3.2 30 63 2.1 3.4
Ethylene glycol monoethyl ether acetate 0.5 107 12 11 72 16 23 104 3.0 2.91 70 3.5 5.0 21 2.9 14 84 8.5 102 95 3.1 3.3 91 8.3 9.2 101 4.4 4.3
n-Hexane 0.5 95 4.2 4.4 105 9.0 8.6 109 7.3 6.61 109 11 10 97 4.8 5.0 116 11 102 100 8.9 8.9 88 22 25 95 3.6 3.8
Isobutyl acetate 0.5 107 0.7 0.7 88 5.2 5.9 109 2.1 1.91 106 2.1 2.0 98 5.1 5.3 94 4.0 4.32 103 2.0 1.9 100 2.0 2.0 109 3.9 3.6
Isobutyl alcohol 0.5 67 4.2 6.3 83 7.9 9.4 93 5.8 6.31 78 7.3 9.3 83 7.3 8.7 88 9.4 112 95 11 12 92 13 14 96 5.2 5.4
Isopentyl acetate 0.5 101 5.4 5.4 99 12 12 105 4.0 3.81 113 6.6 5.8 101 3.8 3.7 105 3.8 3.72 104 3.8 3.6 98 6.1 6.3 102 4.0 4.0
Isopentyl alcohol 0.5 81 3.6 4.4 70 10 15 97 4.4 4.51 99 7.6 7.7 78 3.0 3.9 97 5.1 5.32 96 7.9 8.2 73 4.7 6.5 88 4.6 5.3
Isopropyl acetate 0.5 112 7.3 6.5 83 12 15 104 5.7 5.41 100 35 35 100 8.6 8.6 115 10 9.02 96 7.3 7.6 91 4.7 5.1 104 5.7 5.5
Isopropyl alcohol 0.5 81 11 14 84 15 18 87 11 131 79 14 18 73 10 14 88 14 162 92 13 15 85 20 24 90 10 11
Methyl acetate 0.5 70 8.0 11 78 18 22 106 17 161 90 34 38 99 13 13 101 13 132 87 9.2 11 81 7.6 9.3 100 11 11
Methyl n-butyl ketone 0.5 100 8.1 8.1 90 6.7 7.5 101 5.4 5.31 98 2.9 3.0 99 4.3 4.4 100 4.8 4.82 97 2.4 2.5 98 7.8 8.0 96 2.3 2.4
4-Methylcyclohexanol 0.5 95 10 10 67 21 31 97 5.4 5.61 85 6.8 8.0 61 8.9 15 95 5.7 6.02 87 9.0 10 80 3.8 4.7 91 7.6 8.3
4-Methylcyclohexanone 0.5 98 7.0 7.2 86 17 20 98 6.3 6.51 99 5.6 5.7 83 5.9 7.2 96 6.6 6.92 92 7.0 7.6 88 5.6 6.4 90 2.4 2.7
Methyl ethyl ketone 0.5 66 6.2 9.4 79 15 19 104 10 9.41 94 30 32 92 9.0 10 106 10 102 97 8.6 8.9 87 6.4 7.4 95 6.7 7.0
Methyl isobutyl ketone 0.5 94 2.8 3.0 89 9.3 10 106 2.8 2.71 104 36 34 94 6.8 7.2 115 4.4 3.82 99 2.8 2.9 97 4.8 5.0 109 3.9 3.6
n-Pentyl acetate 0.5 100 6.9 6.9 98 13 14 105 5.5 5.21 112 7.2 6.4 98 5.4 5.5 103 4.5 4.32 98 6.9 7.0 96 8.9 9.3 100 6.8 6.8
n-Propyl acetate 0.5 99 1.8 1.8 89 9.3 10 105 4.7 4.51 90 17 19 99 7.2 7.3 115 5.9 5.12 97 2.0 2.1 100 5.0 5.0 113 3.1 2.7
Styrene 0.5 81 4.2 5.1 71 12 16 91 5.7 6.21 97 4.6 4.8 74 5.4 7.3 93 4.4 4.72 89 4.6 5.1 87 3.3 3.8 89 2.4 2.7
Tetrachloroethylene 0.5 98 2.8 2.9 95 11 11 100 2.5 2.51 107 4.8 4.4 101 2.1 2.0 101 2.7 2.72 102 0.6 0.6 103 3.2 3.1 96 1.2 1.3
Tetrachloromethane 0.5 97 3.9 4.0 90 12 14 108 5.8 5.41 99 6.5 6.5 103 4.9 4.7 107 6.0 5.6
Air Qual Atmos Health

44% (RSD < 10%) and 63% (RSD < 15%) for the SKC sam-pler, and 76% (RSD < 10%) and 84% (RSD < 15%) for theGastec sampler.
Effects of the physicochemical properties of the VOCson recovery rates
Generally, the recovery rate of a VOC can be affected by itsphysicochemical properties, and the optimum adsorbent orsampler for a target VOC can be selected on the basis of theseproperties. In this study, the effects of two physicochemicalproperties, log KOW and vapor pressure, on the recovery ratesof the 49 VOCs added at 3 concentration levels to the
adsorbents in the 3 commercial active samplers were evaluat-ed after extraction with carbon disulfide.
For log KOW (Fig. 1a), the general trend observed wasthat the recovery rates increased with increases in logKOW and then leveled off at around log KOW = 0. Thesolvent used in this study was carbon disulfide, which isnon-polar. Therefore, eluting polar VOCs (which gener-ally have relatively low log KOW values) from the adsor-bents with this solvent was difficult. However, therewere some outliers, which were the cresol isomers.Although the cresol isomers all have a log KOW of2.06, their recovery rates ranged from 1 to 31%. Withthe SKC sampler, ethylene glycol mono-n-butyl ether,ethylene glycol monoethyl ether, and ethylene glycol
Table 4 (continued)
VOC Multipliera Sibata SKC Gastec
Mean (%) SD (%) RSD (%) Mean (%) SD (%) RSD (%) Mean (%) SD (%) RSD (%)
2 99 3.4 3.4 104 10 9.4 101 3.2 3.1Tetrahydrofuran 0.5 82 5.4 6.6 83 13 15 107 6.6 6.1
1 93 7.3 7.8 96 8.7 9.1 105 7.3 7.02 93 9.1 9.8 86 10 12 89 7.1 8.0
Toluene 0.5 94 2.3 2.4 91 8.8 10 104 3.2 3.11 103 2.6 2.6 101 1.8 1.8 103 2.7 2.72 100 0.5 0.5 103 1.9 1.8 100 1.1 1.1
1,1,1-Trichloroethane 0.5 92 4.0 4.3 90 12 14 107 5.8 5.41 101 29 29 104 8.6 8.3 113 7.3 6.42 99 6.8 6.9 107 11 10 110 4.7 4.3
Trichloroethylene 0.5 99 3.5 3.6 93 10 11 108 4.1 3.81 101 5.6 5.6 104 3.8 3.6 106 4.0 3.82 106 3.3 3.1 109 4.6 4.2 102 1.9 1.8
o-Xylene 0.5 100 4.5 4.5 97 14 15 100 3.0 3.01 104 4.7 4.5 97 4.8 5.0 99 5.3 5.32 94 4.2 4.4 101 3.2 3.2 96 3.1 3.2
m-Xylene 0.5 110 4.3 3.9 100 14 14 103 4.6 4.51 104 4.4 4.2 100 4.5 4.5 91 4.4 4.92 97 3.5 3.6 103 3.4 3.3 98 3.0 3.1
p-Xylene 0.5 103 4.1 4.0 99 14 14 101 4.4 4.31 105 4.5 4.3 99 4.3 4.3 71 3.3 4.62 96 3.8 3.9 103 4.0 3.9 98 2.9 2.9
a Factors by which the Industrial Safety and Health Law administrative levels were multiplied
0
20
40
60
80
100
120
140
-2.00 -1.00 0.00 1.00 2.00 3.00 4.00
yrev
oceR
]%[
etar
Log KOW [-]
SibataSKCGastec
a)
0
20
40
60
80
100
120
140
1 10 100 1000 10000 100000
]%[
etaryre
voce
R
Vapor pressure [Pa]
SibataSKCGastec
b)Fig. 1 Effects of a logKOWand bvapor pressure on the recoveryrates of 49 VOCs added to theadsorbents in 3 commercial activesamplers at 3 concentration levelsand extracted with carbondisulfide
Air Qual Atmos Health

monoethyl ether acetate did not fit the general trend,which suggested that this sampler was incompatible withthese specific VOCs.
For the vapor pressure (Fig. 1b), increases in vapor pres-sure up to 500 Pa led to higher recovery rates. After this point,the recovery rates leveled off. This trend was similar to thatobserved for log KOW. Generally, VOCs with lower vaporpressures are more likely to adsorb onto an adsorbent, whichcould make these VOCs more difficult to desorb than VOCswith higher vapor pressures. Outliers were also found in thevapor pressure data. N,N-Dimethylformamide, ethylene gly-col monoethyl ether, and ethylene glycol monoethyl ether ac-etate did not follow the general trend. The log KOW values ofN,N-dimethylformamide, ethylene glycol monoethyl ether,and ethylene glycol monoethyl ether acetate are −0.93,−0.42, and 0.59, respectively, which are the lowest valuesamong the VOCs measured in this study, except for acetone(−0.24). These results indicate that the recovery rates of theseVOCs must be affected more by their log KOW values than bytheir vapor pressures.
On the other hand, polarity of solvent could be a propertywhich could affect the recovery rates of these VOCs. Forexample, VOCs, which showed low recovery rates (e.g., cre-sol isomers and N,N-dimethylformamide), could be expectedto be more successfully extracted using polar solvent (e.g.,acetone). However, polar solvent would not be adequate forextraction of non-polar VOCs.
Conclusions
Forty-nine VOCs, for which administrative levels for workenvironments were established by the Industrial Safety andHealth Law in Japan, were added to the adsorbents in threecommercial active samplers (Sibata, SKC, and Gastec) atthree concentration levels compared to the administrativelevels (×0.5, ×1, and ×2) and were extracted using carbondisulfide. The Sibata and Gastec samplers, which are petro-leum based, showed good recovery rates and RSDs for the 49VOCs. Among the VOCs, cresol isomers (o-, m-, and p-cre-sol) showed the lowest recovery rates at all the concentrationlevels and with all samplers. With all samplers except for theSibata sampler, the recovery rate of N,N-dimethylformamidewas much lower than the recovery rates for other VOCs.
An investigation of the effects of two physicochemicalproperties, log KOW and vapor pressure, of the VOCs on therecovery rates showed that the recovery rates increased withincreases in log KOW and vapor pressure up to a certain point.VOCs with log KOW greater than 0 and vapor pressure greaterthan 500 Pa tended to show good recovery rates.
The comprehensive data of VOC recovery rates could helpto select the optimum sampler for evaluation of indoor airquality in work environments.
Acknowledgement This study was supported by a Health LaborSciences Research Grant of the Ministry of Health, Labor, and Welfare,Japan.
Open Access This article is distributed under the terms of the CreativeCommons At t r ibut ion 4 .0 In te rna t ional License (h t tp : / /creativecommons.org/licenses/by/4.0/), which permits unrestricted use,distribution, and reproduction in any medium, provided you giveappropriate credit to the original author(s) and the source, provide a linkto the Creative Commons license, and indicate if changes were made.
References
Abiko H (2015) The organic solvent extraction efficiency of activatedcarbon used in sampling tube products. TANSO 2015:201–208
Attarchi M, Golabadi M, Labbafinejad Y, Mohammadi S (2013)Combined effects of exposure to occupational noise and mixed or-ganic solvents on blood pressure in car manufacturing companyworkers. Am J Ind Med 56:243–251
Borrás E, Ródenas M, Dieguez JJ, Pérez-García ML, Lomba R, Lavín J,Tortajada-Genaro LA (2012) Development of a gas chromatogra-phy–mass spectrometry method for the determination of carbon di-sulfide in the atmosphere. Microchem J 101:37–42
Chen X, Feng L, Luo H, Cheng H (2014) Analyses on influencing factorsof airborne VOCS pollution in taxi cabins. Environ Sci Pollut Res21:12,868–12,882
Chin JY, Godwin C, Jia C, Robins T, Lewis T, Parker E, Max P,Batterman S (2013) Concentrations and risks of p-dichlorobenzenein indoor and outdoor air. Indoor Air 23:40–49
Freberg BI, Olsen R, Daae HL, Hersson M, Thorud S, Ellingsen DG,Molander P (2014) Occupational exposure assessment of airbornechemical contaminants among professional ski waxers. Ann OccupHyg 58:601–611
Gallego E, Roca FJ, Perales JF, Guardino X (2010) Comparative study ofthe adsorption performance of a multi-sorbent bed (Carbotrap,Carbopack X, carboxen 569) and a Tenax TA adsorbent tube forthe analysis of volatile organic compounds (VOCs). Talanta 81:916–924
Gallego E, Roca FJ, Perales JF, Guardino X (2011) Comparative study ofthe adsorption performance of an active multi-sorbent bed tube(Carbotrap, Carbopack X, carboxen 569) and a Radiello® diffusivesampler for the analysis of VOCs. Talanta 85:662–672
Jia C, D'Souza J, Batterman S (2008) Distributions of personal VOCexposures: a population-based analysis. Environ Int 34:922–931
Jo W-K, Song K-B (2001) Exposure to volatile organic compounds forindividuals with occupations associated with potential exposure tomotor vehicle exhaust and/or gasoline vapor emissions. Sci TotalEnviron 269:25–37
Jumpponen M, Rönkkömäki H, Pasanen P, Laitinen J (2013)Occupational exposure to gases, polycyclic aromatic hydrocarbonsand volatile organic compounds in biomass-fired power plants.Chemosphere 90:1289–1293
Król S, Zabiegała B, Namieśnik J (2010) Monitoring VOCs in atmo-spheric air II. Sample collection and preparation. TrAC TrendsAnal Chem 29:1101–1112
Leung MKH, Liu C-H, Chan AHS (2005) Occupational exposure tovolatile organic compounds and mitigation by push-pull local ex-haust ventilation in printing plants. J Occup Health 47:540–547
Majumdar D, Dutta C, Mukherjee AK, Sen S (2008) Source apportion-ment of VOCs at the petrol pumps in Kolkata, India; exposure of
Air Qual Atmos Health

workers and assessment of associated health risk. Transp Res Part D:Transp Environ 13:524–530
Ohura T, Amagai T, Shen X, Li S, Zhang P, Zhu L (2009) Comparativestudy on indoor air quality in Japan and China: characteristics ofresidential indoor and outdoor VOCs. Atmos Environ 43:6352–6359
Ramírez N, Cuadras A, Rovira E, Borrull F, Marcé RM (2010)Comparative study of solvent extraction and thermal desorptionmethods for determining a wide range of volatile organic com-pounds in ambient air. Talanta 82:719–727
Shinohara N, Tokumura M, Kazama M, Yonemoto Y, Yoshioka M, KagiN, Hasegawa K, Yoshino H, Yanagi U (2014) Indoor air quality andthermal comfort in temporary houses occupied after the Great EastJapan earthquake. Indoor Air 24:425–437
Shinohara N, Tokumura M, Kazama M, Yoshino H, Ochiai S, MizukoshiA (2013) Indoor air quality, air exchange rates, and radioactivity innew built temporary houses following the Great East Japan earth-quake in Minamisoma, Fukushima. Indoor Air 23:332–341
Song G, Yu A, Sakai K, Khalequzzaman M, Nakajima T, Kitamura F,Guo P, Yokoyama K, Piao F (2016) Levels of volatile organic com-pounds in homes in Dalian, China. Air Quality, Atmosphere &Health . doi:10.1007/s11869-016-0422-3In press
The Japan Association for Working Environment Measurement (2012)Working environment measurement guidebook Vol. 5 Organic sol-vents (4th edition). The Japan Association for WorkingEnvironment Measurement
TokumuraM, Hatayama R, TatsuK, Naito T, Takeda T, RaknuzzamanM,Habibullah-Al-Mamun M, Masunaga S (2016) Car indoor air pol-lution by volatile organic compounds and aldehydes in Japan. AIMSEnvironmental Science 3:362–381
Tunsaringkarn T, Prueksasit T, Morknoy D, Sawatsing R,Chinveschakitvanich V, Rungsiyothin A, Zapaung K (2015)Indoor air assessment, health risks, and their relationship amongelderly residents in urban warrens of Bangkok, Thailand. AirQuality, Atmosphere & Health 8:603–615
Uang S-N, Shih T-S, Chang C-H, Chang S-M, Tsai C-J, Deshpande CG(2006) Exposure assessment of organic solvents for aircraft paintstripping and spraying workers. Sci Total Environ 356:38–44
US EPA (2012) Estimation programs interface suite™ for microsoft®windows, v 4.11. United States Environmental Protection Agency,Washington, DC, USA
Vitali M, Ensabella F, Stella D, Guidotti M (2006) Exposure to organicsolvents among handicraft car painters: a pilot study in Italy. IndHealth 44:310–317
Air Qual Atmos Health