
Volatile biomarkers of pulmonary tuberculosis in the breath
9
Tuberculosis (2007) 87, 44–52 Tuberculosis Volatile biomarkers of pulmonary tuberculosis in the breath Michael Phillips a,b, , Renee N. Cataneo a , Rany Condos c , Gerald A. Ring Erickson d , Joel Greenberg a,{ , Vincent La Bombardi e , Muhammad I. Munawar a , Olaf Tietje f a Menssana Research Inc., Fort Lee, NJ 07024, USA b Department of Medicine, New York Medical College, Valhalla, NY, USA c Division of Pulmonary and Critical Care Medicine, Bellevue Chest Service, NYU School of Medicine, New York, NY, USA d Infometrix, Inc, Woodinville, WA, USA e Saint Vincent’s Medical Center, New York, NY, USA f SystAim GmbH, Pfingstweidstr. 31a, CH 8005 Zu ¨rich, Switzerland Received 14 December 2005; received in revised form 8 March 2006; accepted 10 March 2006 KEYWORDS Volatile organic compounds; Breath; Pulmonary tubercu- losis; Diagnosis Summary Pulmonary tuberculosis may alter volatile organic compounds (VOCs) in breath because Mycobacteria and oxidative stress resulting from Mycobacterial infection both generate distinctive VOCs. The objective of this study was to determine if breath VOCs contain biomarkers of active pulmonary tuberculosis. Head space VOCs from cultured Mycobacterium tuberculosis were captured on sorbent traps and assayed by gas chromatography/mass spectroscopy (GC/MS). One hundred and thirty different VOCs were consistently detected. The most abundant were naphthalene, 1-methyl-, 3-heptanone, methylcyclododecane, heptane, 2,2,4,6,6-pentamethyl-, benzene, 1-methyl-4-(1-methylethyl)-, and cyclohexane, 1,4-dimethyl-. Breath VOCs were assayed by GC/MS in 42 patients hospitalized for suspicion of pulmonary tuberculosis and in 59 healthy controls. Sputum cultures were positive for Mycobacteria in 23/42 and negative in19/42 patients. Breath markers of oxidative stress were increased in all hospitalized patients ðpo0:04Þ. Pattern recognition analysis and fuzzy logic analysis of breath VOCs independently distinguished healthy controls from hospitalized patients with 100% sensitivity and 100% specificity. Fuzzy logic analysis identified patients with positive sputum cultures with 100% sensitivity and 100% specificity (95.7% sensitivity and 78.9% specificity on leave-one-out cross- validation); breath VOC markers were similar to those observed in vitro, including ARTICLE IN PRESS http://intl.elsevierhealth.com/journals/tube 1472-9792/$ - see front matter & 2006 Elsevier Ltd. All rights reserved. doi:10.1016/j.tube.2006.03.004 Corresponding author. Menssana Research, Inc., 1 Horizon Road, Suite 1415, Fort Lee, NJ 07024, USA. Tel./fax: 2018867004. E-mail address: [email protected] (M. Phillips). { Deceased.
-
Upload
independent -
Category
Documents
-
view
4 -
download
0
Transcript of Volatile biomarkers of pulmonary tuberculosis in the breath
ARTICLE IN PRESS
Tuberculosis (2007) 87, 44–52
Tuberculosis
1472-9792/$ - sdoi:10.1016/j.t
�CorrespondE-mail addr
{Deceased.
http://intl.elsevierhealth.com/journals/tube
Volatile biomarkers of pulmonary tuberculosis inthe breath
Michael Phillipsa,b,�, Renee N. Cataneoa, Rany Condosc,Gerald A. Ring Ericksond, Joel Greenberga,{, Vincent La Bombardie,Muhammad I. Munawara, Olaf Tietjef
aMenssana Research Inc., Fort Lee, NJ 07024, USAbDepartment of Medicine, New York Medical College, Valhalla, NY, USAcDivision of Pulmonary and Critical Care Medicine, Bellevue Chest Service, NYU School of Medicine,New York, NY, USAdInfometrix, Inc, Woodinville, WA, USAeSaint Vincent’s Medical Center, New York, NY, USAfSystAim GmbH, Pfingstweidstr. 31a, CH 8005 Zurich, Switzerland
Received 14 December 2005; received in revised form 8 March 2006; accepted 10 March 2006
KEYWORDSVolatile organiccompounds;Breath;Pulmonary tubercu-losis;Diagnosis
ee front matter & 2006ube.2006.03.004
ing author. Menssana Reess: mphillips@menssan
Summary Pulmonary tuberculosis may alter volatile organic compounds (VOCs) inbreath because Mycobacteria and oxidative stress resulting from Mycobacterialinfection both generate distinctive VOCs. The objective of this study was todetermine if breath VOCs contain biomarkers of active pulmonary tuberculosis. Headspace VOCs from cultured Mycobacterium tuberculosis were captured on sorbenttraps and assayed by gas chromatography/mass spectroscopy (GC/MS). One hundredand thirty different VOCs were consistently detected. The most abundantwere naphthalene, 1-methyl-, 3-heptanone, methylcyclododecane, heptane,2,2,4,6,6-pentamethyl-, benzene, 1-methyl-4-(1-methylethyl)-, and cyclohexane,1,4-dimethyl-.
Breath VOCs were assayed by GC/MS in 42 patients hospitalized for suspicion ofpulmonary tuberculosis and in 59 healthy controls. Sputum cultures were positive forMycobacteria in 23/42 and negative in19/42 patients. Breath markers of oxidativestress were increased in all hospitalized patients ðpo0:04Þ. Pattern recognitionanalysis and fuzzy logic analysis of breath VOCs independently distinguished healthycontrols from hospitalized patients with 100% sensitivity and 100% specificity. Fuzzylogic analysis identified patients with positive sputum cultures with 100% sensitivityand 100% specificity (95.7% sensitivity and 78.9% specificity on leave-one-out cross-validation); breath VOC markers were similar to those observed in vitro, including
Elsevier Ltd. All rights reserved.
search, Inc., 1 Horizon Road, Suite 1415, Fort Lee, NJ 07024, USA. Tel./fax: 201 886 7004.aresearch.com (M. Phillips).
ARTICLE IN PRESS
Breath biomarkers of tuberculosis 45
naphthalene, 1-methyl- and cyclohexane, 1,4-dimethyl-. Pattern recognitionanalysis identified patients with positive sputum cultures with 82.6% sensitivity(19/23) and 100% specificity (18/18), employing 12 principal components from 134breath VOCs.
We conclude that volatile biomarkers in breath were sensitive and specific forpulmonary tuberculosis: the breath test distinguished between ‘‘sick versus well’’i.e. between normal controls and patients hospitalized for suspicion of pulmonarytuberculosis, and between infected versus non-infected patients i.e. between thosewhose sputum cultures were positive or negative for Mycobacteria.& 2006 Elsevier Ltd. All rights reserved.
Introduction
The current global epidemic of pulmonary tuber-culosis has highlighted the need for new screeningtests that are rapid and accurate. The social burdenof pulmonary tuberculosis has increased becausemany patients are also infected with humanimmunodeficiency virus (HIV), and the rates ofmultidrug-resistant tuberculosis are increasing.1
However, screening technology has not changedgreatly during the past several decades. Many high-burden countries depend upon sputum smears andchest radiographs, supplemented by cultures whenresources permit. This approach is highly specificfor active pulmonary tuberculosis, but its value inprimary screening is limited by low sensitivity andhigh cost.
We tested the hypothesis that volatile organiccompounds (VOCs) in the breath might provide newbiomarkers of active pulmonary tuberculosis. Therationale of this hypothesis is based on twoobservations: first, Mycobacteria produce distinc-tive patterns of VOCs in vitro, and second, patientswith active pulmonary tuberculosis suffer fromincreased oxidative stress which also generatesdistinctive patterns of VOCs. Several species ofMycobacteria produce VOC metabolites that act aschemical ‘‘fingerprints’’: M. avium, M tuberculosis,M. gordonae, M. gastri, M. kansasii, M. szulgai, andM. flavescens can be identified by their distinctivepatterns of volatile metabolites, including C14–C26fatty acids and their methylated and hydroxylatedderivatives.2–4 Also, patients with active pulmonarytuberculosis suffer from increased oxidative stress:serum markers of oxidative stress, including lipidperoxidation products, conjugated dienes, malon-dialdehyde, and allantoin are generally increasedin patients with active pulmonary tuberculosis, anddecrease following a course of antituberculoustherapy.5–7 Oxidative stress also liberates distinc-tive VOCs into the breath, particularly C4–C20alkanes and methylated alkanes comprising thebreath methylated alkane contour (BMAC).8 We
have previously reported altered patterns of breathmarkers of oxidative stress in different diseases,including heart transplant rejection,9,10 lung can-cer,11,12 breast cancer,13 ischemic heart disease,14
preeclampsia of pregnancy,15 and diabetes melli-tus.16
We analyzed VOCs derived from Mycobacteriacultures, as well as VOC markers of oxidative stressin the breath of patients undergoing evaluation forMycobacterial infection. Two different mathemati-cal techniques, pattern recognition analysis andfuzzy logic, were employed to address two ques-tions: First, could breath VOCs distinguish betweenhealthy controls and all hospitalized patientsundergoing evaluation for Mycobacterial infection(culture positive as well as culture negative)?Second, could breath VOCs distinguish betweenhospitalized patients whose sputum cultures forMycobacteria were positive or negative?
Methods
Breath collection and assay
The method has been described.17 Subjectsbreathed in and out through the disposable mouth-piece of a portable breath collection apparatus for2.0min, and the VOCs in 1.0 l alveolar breath and1.0 l room air were captured onto separate sorbenttraps. VOCs captured on the sorbent traps wereanalyzed in the laboratory by automated thermaldesorption, gas chromatography and mass spectro-scopy (ATD/GC/MS).
Identification of VOCs produced by M.tuberculosis in vitro
Reference samples of M. tuberculosis were cul-tured in vitro (by VLB) utilizing VersaTREK Mycobottles (Trek Diagnostic Systems, Cleveland, OH) atSaint Vincent’s Medical Center, New York, NY. The
ARTICLE IN PRESS
M. Phillips et al.46
Myco bottles containing 1.0ml of Growth Supple-ment were inoculated with 0.5ml of a 1.0 McFar-land suspension in sterile saline prepared fromisolates grown on Lowenstein Jensen medium. Mycobottles containing growth supplement and inocu-lated with 0.5ml of sterile saline served as thecontrol. VOCs in 1.0ml aspirated head space werecaptured by injection onto a sorbent trap similar tothose employed for breath collections. Samplesincubated an additional 2 days after the Mycobottle yielded a positive signal, were found to yieldoptimal results. Head space samples were collectedfrom different isolates: Fresh clinical isolates of M.tuberculosis ðn ¼ 12Þ and M. tuberculosis H37RV,the pan-sensitive control strain of used for suscept-ibility tests ðn ¼ 8Þ were assayed. Matching controlsamples were drawn from uninoculated Mycobottles incubated under the same conditions asthe test bottles. VOCs in the sorbent traps wereanalyzed by ATD/GC/MS employing the samemethod described for analysis of breath samples.18
The abundance of a VOC was determined asabundance in the test sample minus abundance inthe uninoculated sterile control. VOCs were rankedby multiple t-tests comparing mean abundance inall samples to sterile incubation containers.
Human subjects: pulmonary tuberculosis
Technically usable breath VOC samples were ob-tained from 42 patients admitted to an isolation wardon the in-patient Chest Service of Bellevue Hospitalto rule out suspected pulmonary tuberculosis. Criter-ia for admission were chronic constitutional symp-toms (cough, night sweats, fever, and weight loss formore than 1 week) and/or an abnormal chest X-ray(infiltrates, nodules, cavities, or pleural effusions). APPD test was performed in eligible patients onadmission and read at 48h. Sputum was induceddaily for 3 days and sent for staining for acid fastbacilli and culture for Mycobacteria.
Human subjects: healthy controls
Breath samples were obtained in a similar fashionfrom members of the general population in StatenIsland, NY with no history of tuberculosis or otherchronic disease.8 An age-matched subgroup ðn ¼59Þ was selected to serve as a control group for thepatients admitted for screening for pulmonarytuberculosis. The institutional review boards of allparticipating institutions approved the research.
Masking procedures
Clinicians and pathologists at Bellevue Hospitalcollected and cultured sputum samples with no
knowledge of the breath test results. Breathsamples were collected (by MIM) and analyzed inthe laboratory (by RNC and JG) without knowledgeof the sputum smears or culture results.
Identification of breath VOC markers ofoxidative stress
The BMAC was constructed for each subject usingalveolar gradients of C4-C20 n-alkanes and mono-methylated alkanes.8 The oxidative age, an age-corrected value for the abundance of these VOCs16
was compared in hospitalized patients and age-matched healthy controls with a t-test.
Analysis of data
Two forms of multivariate analysis—fuzzy logic andpattern recognition analysis—were employed inorder to correlate the patients’ breath VOCs withtheir clinical status.
Fuzzy logic (Interrelation Miner, SystAim, Zurich,Switzerland) creates a membership score Tpos formembership in the group with disease present anda second score Tneg for membership in the groupwith disease not present. Fuzzy logic was employedto address two questions: (1) Can breath VOCsdistinguish between patients with a high suspicionof pulmonary tuberculosis (and hence hospitalized)from healthy controls? (2) Can breath VOCsdistinguish between hospitalized patients with apositive sputum culture for Mycobacteria fromhospitalized patients with a negative sputumculture? Values for Tneg and for Tpos were obtainedin two sets of data:
Tneg
TposCan breathVOCs be usedto distinguishhospitalizedpatients fromhealthycontrols?
Typicality of ahealthycontrol
Typicality of apatient withhigh suspicionof pulmonaryTB (and hencehospitalized)
Can breathVOCs be usedto distinguishhospitalizedsputum culturepositivepatients fromhospitalizedsputum culturenegativepatients?
Typicality of ahospitalizedpatient who issputum culturenegative
Typicality of ahospitalizedpatient who issputum culturepositive
ARTICLE IN PRESS
Breath biomarkers of tuberculosis 47
In both cases, a similar analysis procedure was
applied: In the training set, fuzzy functions wereconstructed for the candidate breath VOCs in orderto create a typicality matrix for the two groupsbeing compared in the table. In the prediction set,these typicality matrices were employed to predictthe outcome by generating two numerical valuesfrom the breath VOCs: Tneg, the typicality fordisease not present and Tpos, the typicality fordisease present. Employing a leave-one-out meth-od, this procedure was iterated n times, employingn�1 subjects in the training set and one subject inthe prediction set. The resulting values of Tpos–Tnegwere employed as predictors of the diagnosisdisease present or disease not present, and theaccuracy of prediction was displayed in a receiveroperating characteristic (ROC) curve.Pattern recognition analysis of breath VOCs(Pirouette, Version 3.11, Infometrix, Inc. Bothell,WA 98011) was employed for multivariate explora-tory data analysis, category classification, andcontinuous dependent variable modeling. Explora-tory data analysis methods include hierarchicalcluster analysis (HCA) and principal component(PC) analysis, category classification methods in-clude K-nearest neighbor (KNN) and soft indepen-dent modeling of class analogy (SIMCA), andcontinuous dependent variable methods include PCregression and partial least squares path modeling.Subjects were assigned to three diagnostic groups:class 1 (age-matched healthy controls), class 2(sputum culture negative for M. tuberculosis), andclass 3 (sputum culture positive for M. tuberculo-sis). Exploratory evaluations using PC factor analysis(PCA) and HCA were performed to investigate datastructure and similarities between subjects andbetween variables. Data were autoscaled for allprocedures in order to put each variable on thecommon footing of zero mean and unit varianceover the sample set. Following exploratory analysisand creation of subsets excluding potential outliers,classification modeling procedures KNN and PCproximity modeling (SIMCA) were tested to assessclassification accuracy into diagnostic models.
The goals of exploratory analysis include asses-sing the relationships amongst the variables and thedimensionality of the problem. Exploratory analysisalso helps assess the relationships amongst the testsubjects to see if mathematically derived clustersreflect the diagnostic class assignments. Explora-tory data analysis can reveal potential outliersubjects so that they may be reviewed to deter-mine which measured values are unusual. Outliersmay also be excluded from derivation of models topredict class assignments. Exploratory PC analysisand factor analysis methods help assess the under-
lying dimensionality of the alveolar gradient datausing orthogonal (mathematically independent)components that contain significant portions ofthe data variance. The calculated PCs are orderedby largest to least variance, allowing retention of afew PCs containing the majority of data varianceand discarding the bulk of remaining componentsthat contain small amounts of variance that may bemeasurement noise. Dimensionality assessment isalso a guide for sufficiency of sample size for eachcategory of subjects. Since breath alveolar gradi-ents for over 130 VOCs were measured for each testsubject, the number of variables far exceeded thenumber of cases in each diagnostic category. Ageneral rule is to require at least three times asmany class members as variables or dimensions.The number of subjects in the diagnostic groupssuggested limiting models to fewer than 12 PCs.
Results
In vitro studies
One hundred and thirty different VOCs wereconsistently detected in M. tuberculosis culturesin vitro, predominantly derivatives of benzene,naphthalene, and alkanes. The 10 most abundantVOCs are shown in Table 1.
Human studies
Patient characteristics are shown in Table 2.
Clinical course of hospitalized patients
All patients had three induced sputum for AFB. Atotal of 23/42 patients had sputum that was culturepositive for M. tuberculosis. These patients werereferred to the Bellevue Chest clinic/DOT clinic andfollowed. Of these patients, 16 had sputum that wassmear positive with appropriate clinical setting. Fourpatients had bronchoscopy to confirm the diagnosis.All four had post-bronchoscopy sputum smears thatwere positive. Three patients had empiric therapyinitiated and later confirmed by positive culture.
In the culture negative group, the most commondiagnosis was bronchiectasis, followed by bronchi-tis. Three patients had sputum cultures positive forM avium intracellulare and were co-infected withHIV. Two patients were begun on TB treatmentwhile awaiting culture results. In both cases, TBtherapy was discontinued when cultures werenegative at 2 months and an alternative diagnosisof bronchiectasis was assigned to these patients. Ofthe culture negative groups, 10 patients have had
ARTICLE IN PRESS
Table 1 VOC markers of M. tuberculosis observed in culture and in breath.
Culture (in vitro) Breath (fuzzy logic) Breath (pattern recognition)
Naphthalene, 1-methyl- Cyclohexane, 1,3-dimethyl-,trans-
Factor 1
3-Heptanone Benzene, 1,4-dichloro- Benzene, ethyl-Methylcyclododecane Cyclohexane, 1,4-dimethyl- Benzene, methyl-Heptane, 2,2,4,6,6-pentamethyl- 1-Octanol, 2-butyl- Benzene, propyl-Benzene, 1-methyl-4-(1-methylethyl)-
2-Butanone Heptane, 3-methyl-
Cyclohexane, 1,4-dimethyl- Naphthalene, 1-methyl- Propane, 2-methoxy-2-me3,5-dimethylamphetamine Camphene Factor 2Butanal, 3-methyl- Decane, 4-methyl- 1-Octene2-Hexene Heptane, 3-ethyl-2-methyl- CyclohexaneTrans-anti-1-methyl-decahydronaphthalene
Octane, 2,6-dimethyl- Heptanal
Benzene, 1,2,3,4-tetramethyl- Heptane, 2,4-dimethyl-Bicyclo_3_1_1_hept-2-ene, 3,6,6-trimethyl-
Heptane, 4-methyl-
Cyclohexane, 1-ethyl-4-methyl-,trans-
Nonanal
l-_beta_-Pinene Pentane, 2-methyl-StyreneTridecane
The ‘‘culture’’ column lists the 10 most abundant VOCs observed in cultures of Mycobacteria in vitro, ranked by their increasedabundance compared to sterile control vials. The ‘‘breath’’ columns lists the VOCs in breath identified by fuzzy logic analysisand by pattern recognition analysis as the best discriminators between patients whose sputum cultures were positive ornegative for Mycobacteria. Breath VOCs identified by fuzzy logic are ranked by lambda value, and comprise the VOCs employedas markers of Mycobacterial infection in Fig. 4. Breath VOCs identified by pattern recognition analysis are listed as componentsof Factor 1 or Factor 2, and comprise the VOCs employed as markers of Mycobacterial infection in Fig. 3. Naphthalene, 1-methyl- and cyclohexane, 1,4-dimethyl- were observed both in Mycobacterial culture and in the fuzzy logic breathdiscriminators of infection. There were structural similarities among VOCs in all three groups, particularly derivatives ofheptane and benzene.
Table 2 Patient characteristics.
No. in group PPD status Mean age
Pos Neg ND Year (SD)
Hospitalized patientsSputum culturePositive for Mycobacteria 23 10 2 11 39.5 (14.2)Negative for Mycobacteria 19 8 4 7 47.2 (8.9)Healthy controls 59 59 41.1 (16.1)
PPD status is indicated as positive (pos), negative (neg) or not done (ND). There were no significant differences between ages ofsubjects in the three groups (one-way ANOVA, NS).
M. Phillips et al.48
long-term follow-up through the Bellevue HealthCare system without evidence of tuberculosis, andnine were lost to follow up.
Breath VOC markers of oxidative stress
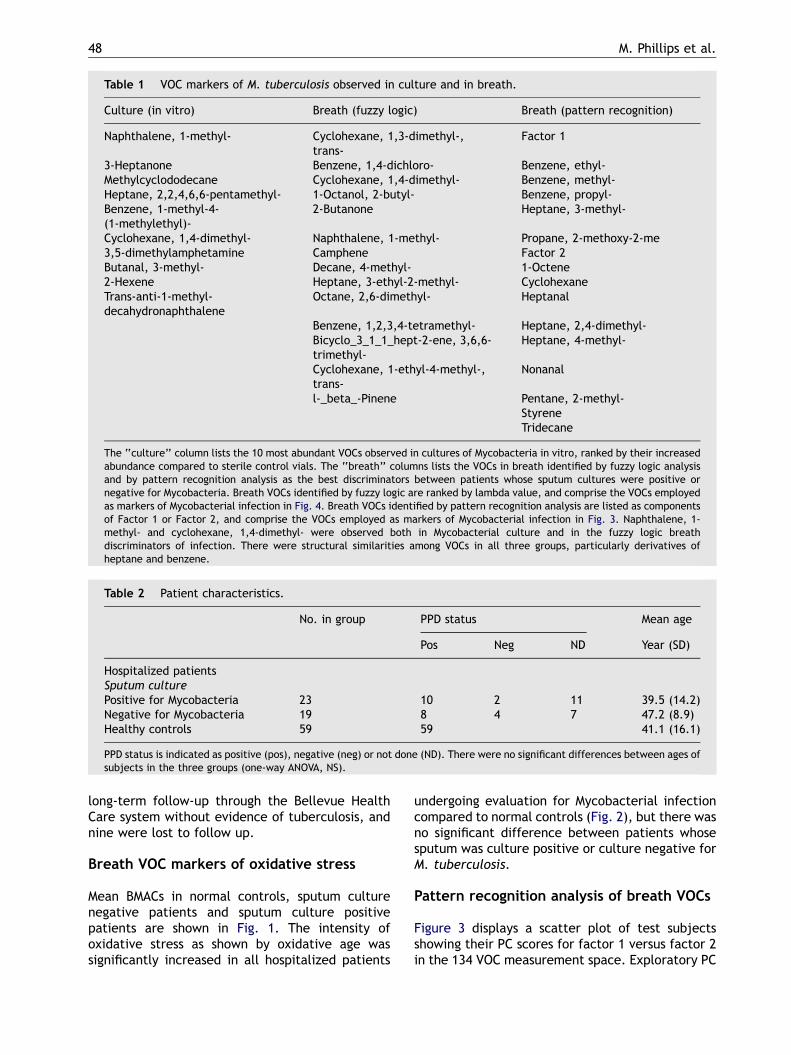
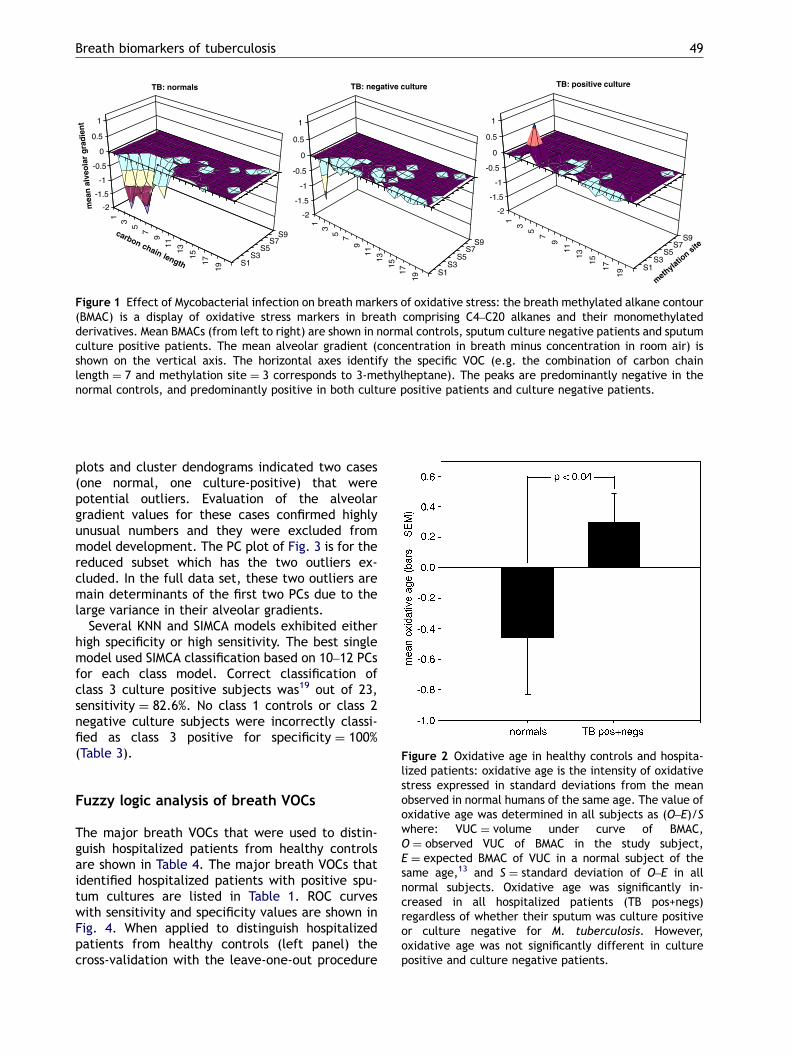
Mean BMACs in normal controls, sputum culturenegative patients and sputum culture positivepatients are shown in Fig. 1. The intensity ofoxidative stress as shown by oxidative age wassignificantly increased in all hospitalized patients
undergoing evaluation for Mycobacterial infectioncompared to normal controls (Fig. 2), but there wasno significant difference between patients whosesputum was culture positive or culture negative forM. tuberculosis.
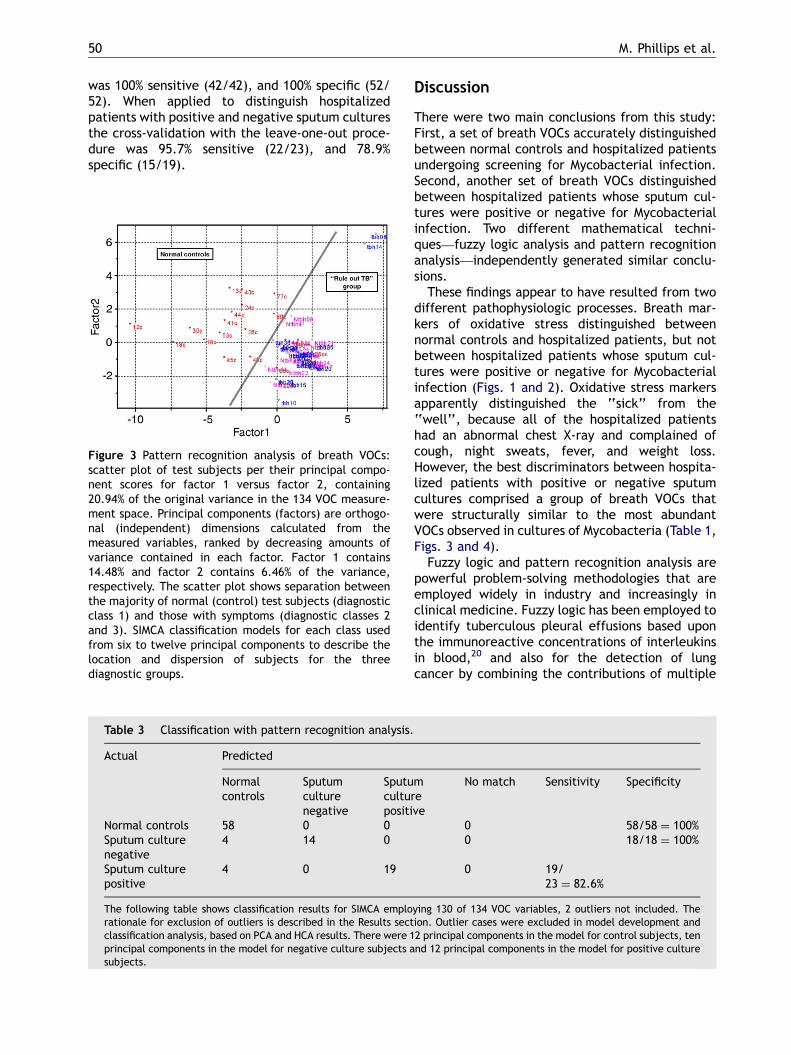
Pattern recognition analysis of breath VOCs
Figure 3 displays a scatter plot of test subjectsshowing their PC scores for factor 1 versus factor 2in the 134 VOC measurement space. Exploratory PC
ARTICLE IN PRESS
13
57
911
13
15
17
19
S1S3
S5S7
S9
-2
-1.5
-1
-0.5
0
0.5
1
mea
n a
lveo
lar
gra
die
nt
carbon chain length
TB: normals
13
5 79
11
13
1517
19
S1S3
S5S7
S9
-2
-1.5
-1
-0.5
0
0.5
1
TB: negative culture
13
57
9
11
13
15
17
19
S1S3
S5S7
S9
-2
-1.5
-1
-0.5
0
0.5
1
methylatio
n site
TB: positive culture
Figure 1 Effect of Mycobacterial infection on breath markers of oxidative stress: the breath methylated alkane contour(BMAC) is a display of oxidative stress markers in breath comprising C4–C20 alkanes and their monomethylatedderivatives. Mean BMACs (from left to right) are shown in normal controls, sputum culture negative patients and sputumculture positive patients. The mean alveolar gradient (concentration in breath minus concentration in room air) isshown on the vertical axis. The horizontal axes identify the specific VOC (e.g. the combination of carbon chainlength ¼ 7 and methylation site ¼ 3 corresponds to 3-methylheptane). The peaks are predominantly negative in thenormal controls, and predominantly positive in both culture positive patients and culture negative patients.
Figure 2 Oxidative age in healthy controls and hospita-
Breath biomarkers of tuberculosis 49
plots and cluster dendograms indicated two cases(one normal, one culture-positive) that werepotential outliers. Evaluation of the alveolargradient values for these cases confirmed highlyunusual numbers and they were excluded frommodel development. The PC plot of Fig. 3 is for thereduced subset which has the two outliers ex-cluded. In the full data set, these two outliers aremain determinants of the first two PCs due to thelarge variance in their alveolar gradients.
Several KNN and SIMCA models exhibited eitherhigh specificity or high sensitivity. The best singlemodel used SIMCA classification based on 10–12 PCsfor each class model. Correct classification ofclass 3 culture positive subjects was19 out of 23,sensitivity ¼ 82.6%. No class 1 controls or class 2negative culture subjects were incorrectly classi-fied as class 3 positive for specificity ¼ 100%(Table 3).
lized patients: oxidative age is the intensity of oxidativestress expressed in standard deviations from the meanobserved in normal humans of the same age. The value ofoxidative age was determined in all subjects as (O–E)/Swhere: VUC ¼ volume under curve of BMAC,O ¼ observed VUC of BMAC in the study subject,E ¼ expected BMAC of VUC in a normal subject of thesame age,13 and S ¼ standard deviation of O–E in allnormal subjects. Oxidative age was significantly in-creased in all hospitalized patients (TB pos+negs)regardless of whether their sputum was culture positiveor culture negative for M. tuberculosis. However,oxidative age was not significantly different in culturepositive and culture negative patients.
Fuzzy logic analysis of breath VOCs
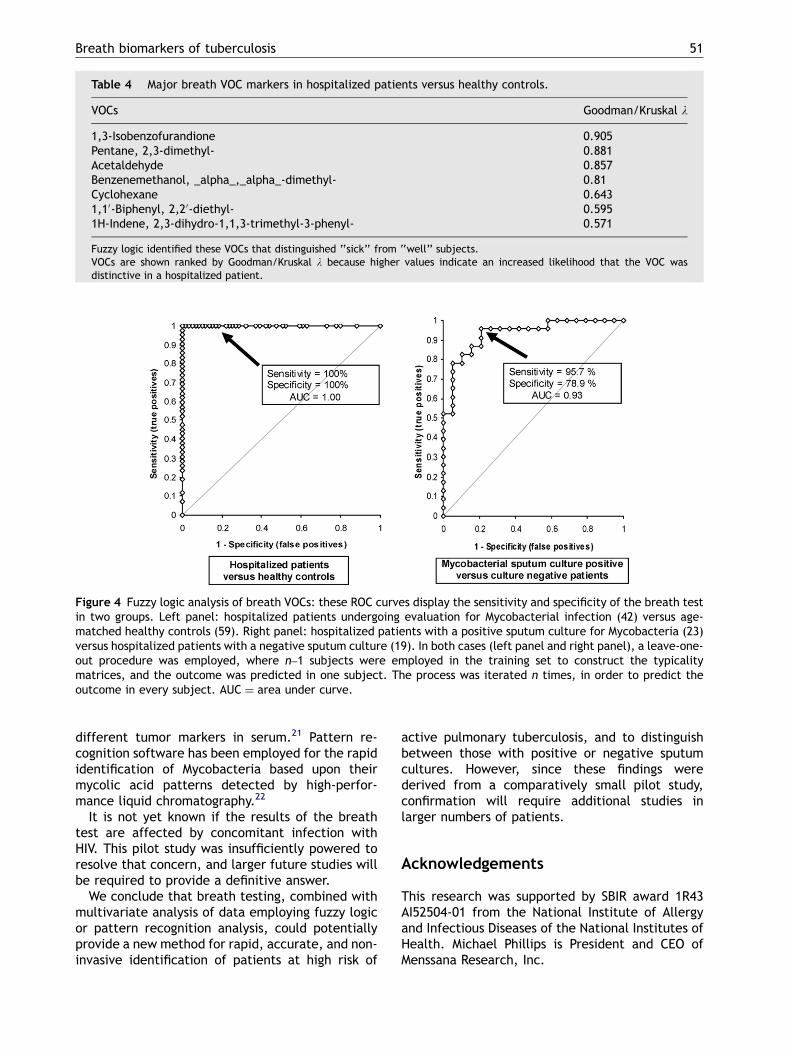
The major breath VOCs that were used to distin-guish hospitalized patients from healthy controlsare shown in Table 4. The major breath VOCs thatidentified hospitalized patients with positive spu-tum cultures are listed in Table 1. ROC curveswith sensitivity and specificity values are shown inFig. 4. When applied to distinguish hospitalizedpatients from healthy controls (left panel) thecross-validation with the leave-one-out procedure
ARTICLE IN PRESS
M. Phillips et al.50
was 100% sensitive (42/42), and 100% specific (52/52). When applied to distinguish hospitalizedpatients with positive and negative sputum culturesthe cross-validation with the leave-one-out proce-dure was 95.7% sensitive (22/23), and 78.9%specific (15/19).
Table 3 Classification with pattern recognition analysis.
Actual Predicted
Normalcontrols
Sputumculturenegative
Sputuculturpositi
Normal controls 58 0 0Sputum culturenegative
4 14 0
Sputum culturepositive
4 0 19
The following table shows classification results for SIMCA emplorationale for exclusion of outliers is described in the Results sectclassification analysis, based on PCA and HCA results. There were 1principal components in the model for negative culture subjects asubjects.
Figure 3 Pattern recognition analysis of breath VOCs:scatter plot of test subjects per their principal compo-nent scores for factor 1 versus factor 2, containing20.94% of the original variance in the 134 VOC measure-ment space. Principal components (factors) are orthogo-nal (independent) dimensions calculated from themeasured variables, ranked by decreasing amounts ofvariance contained in each factor. Factor 1 contains14.48% and factor 2 contains 6.46% of the variance,respectively. The scatter plot shows separation betweenthe majority of normal (control) test subjects (diagnosticclass 1) and those with symptoms (diagnostic classes 2and 3). SIMCA classification models for each class usedfrom six to twelve principal components to describe thelocation and dispersion of subjects for the threediagnostic groups.
Discussion
There were two main conclusions from this study:First, a set of breath VOCs accurately distinguishedbetween normal controls and hospitalized patientsundergoing screening for Mycobacterial infection.Second, another set of breath VOCs distinguishedbetween hospitalized patients whose sputum cul-tures were positive or negative for Mycobacterialinfection. Two different mathematical techni-ques—fuzzy logic analysis and pattern recognitionanalysis—independently generated similar conclu-sions.
These findings appear to have resulted from twodifferent pathophysiologic processes. Breath mar-kers of oxidative stress distinguished betweennormal controls and hospitalized patients, but notbetween hospitalized patients whose sputum cul-tures were positive or negative for Mycobacterialinfection (Figs. 1 and 2). Oxidative stress markersapparently distinguished the ‘‘sick’’ from the‘‘well’’, because all of the hospitalized patientshad an abnormal chest X-ray and complained ofcough, night sweats, fever, and weight loss.However, the best discriminators between hospita-lized patients with positive or negative sputumcultures comprised a group of breath VOCs thatwere structurally similar to the most abundantVOCs observed in cultures of Mycobacteria (Table 1,Figs. 3 and 4).
Fuzzy logic and pattern recognition analysis arepowerful problem-solving methodologies that areemployed widely in industry and increasingly inclinical medicine. Fuzzy logic has been employed toidentify tuberculous pleural effusions based uponthe immunoreactive concentrations of interleukinsin blood,20 and also for the detection of lungcancer by combining the contributions of multiple
meve
No match Sensitivity Specificity
0 58/58 ¼ 100%0 18/18 ¼ 100%
0 19/23 ¼ 82.6%
ying 130 of 134 VOC variables, 2 outliers not included. Theion. Outlier cases were excluded in model development and2 principal components in the model for control subjects, tennd 12 principal components in the model for positive culture
ARTICLE IN PRESS
Figure 4 Fuzzy logic analysis of breath VOCs: these ROC curves display the sensitivity and specificity of the breath testin two groups. Left panel: hospitalized patients undergoing evaluation for Mycobacterial infection (42) versus age-matched healthy controls (59). Right panel: hospitalized patients with a positive sputum culture for Mycobacteria (23)versus hospitalized patients with a negative sputum culture (19). In both cases (left panel and right panel), a leave-one-out procedure was employed, where n–1 subjects were employed in the training set to construct the typicalitymatrices, and the outcome was predicted in one subject. The process was iterated n times, in order to predict theoutcome in every subject. AUC ¼ area under curve.
Table 4 Major breath VOC markers in hospitalized patients versus healthy controls.
VOCs Goodman/Kruskal l
1,3-Isobenzofurandione 0.905Pentane, 2,3-dimethyl- 0.881Acetaldehyde 0.857Benzenemethanol, _alpha_,_alpha_-dimethyl- 0.81Cyclohexane 0.6431,10-Biphenyl, 2,20-diethyl- 0.5951H-Indene, 2,3-dihydro-1,1,3-trimethyl-3-phenyl- 0.571
Fuzzy logic identified these VOCs that distinguished ‘‘sick’’ from ‘‘well’’ subjects.VOCs are shown ranked by Goodman/Kruskal l because higher values indicate an increased likelihood that the VOC wasdistinctive in a hospitalized patient.
Breath biomarkers of tuberculosis 51
different tumor markers in serum.21 Pattern re-cognition software has been employed for the rapididentification of Mycobacteria based upon theirmycolic acid patterns detected by high-perfor-mance liquid chromatography.22
It is not yet known if the results of the breathtest are affected by concomitant infection withHIV. This pilot study was insufficiently powered toresolve that concern, and larger future studies willbe required to provide a definitive answer.
We conclude that breath testing, combined withmultivariate analysis of data employing fuzzy logicor pattern recognition analysis, could potentiallyprovide a new method for rapid, accurate, and non-invasive identification of patients at high risk of
active pulmonary tuberculosis, and to distinguishbetween those with positive or negative sputumcultures. However, since these findings werederived from a comparatively small pilot study,confirmation will require additional studies inlarger numbers of patients.
Acknowledgements
This research was supported by SBIR award 1R43AI52504-01 from the National Institute of Allergyand Infectious Diseases of the National Institutes ofHealth. Michael Phillips is President and CEO ofMenssana Research, Inc.
ARTICLE IN PRESS
M. Phillips et al.52
References
1. Schluger NW. The diagnosis of tuberculosis: what’s old,what’s new. Semin Respir Infect 2003;18:241–8.
2. Tisdall PA, Roberts GD, Anhalt JP. Identification of clinicalisolates of Mycobacteria with gas-liquid chromatographyalone. J Clin Microbiol 1979;10:506–14.
3. Zhang Y, Zhuang Y, Liu Z, Ruan J. Identification of twenty-eight species Mycobacteria with their cellular fatty acidsby capillary gas chromatography. Wei Sheng Wu Xue Bao1991;31:187–97.
4. Parez JJ, Fauville-Dufaux M, Dossogne JL, de Hoffmann E,Pouthier F. Faster identification of Mycobacteria using gasliquid and thin layer chromatography. Eur J Clin MicrobiolInfect Dis 1994;13:717–25.
5. Kwiatkowska S, Piasecka G, Zieba M, Piotrowski W, Nowak D.Increased serum concentrations of conjugated diens andmalondialdehyde in patients with pulmonary tuberculosis.Respir Med 1999;93:272–6.
6. Walubo A, Smith PJ, Folb PI. Oxidative stress during anti-tuberculous therapy in young and elderly patients. BiomedEnviron Sci 1995;8:106–13.
7. Plit ML, Theron AJ, Fickl H, van Rensburg CE, Pendel S,Anderson R. Influence of antimicrobial chemotherapy andsmoking status on the plasma concentrations of vitamin C,vitamin E, beta-carotene, acute phase reactants, iron andlipid peroxides in patients with pulmonary tuberculosis. Int JTuberc Lung Dis 1998;2:590–6.
8. Phillips M, Cataneo RN, Greenberg J, Gunawardena R, NaiduA, Rahbari-Oskoui F. Effect of age on the breath methylatedalkane contour, a display of apparent new markers ofoxidative stress. J Lab Clin Med 2000;136:243–9.
9. Phillips M, Boehmer J, Cataneo R, et al. Heart AllograftRejection: Detection with Breath Alkanes in Low Levels (theHARDBALL study). J Am Col Cardiol 2002;1:12–3.
10. Phillips M, Boehmer J, Cataneo R, et al. Heart allograftrejection: detection with breath Alkanes in low levels (theHARDBALL study). J Heart Lung Transplant 2004;23:701–8.
11. Phillips M, Gleeson K, Hughes JM, et al. Volatile organiccompounds in breath as markers of lung cancer: a cross-sectional study. Lancet 1999;353:1930–3.
12. Phillips M, Cataneo R, Cummin A, et al. Detection of lungcancer with volatile markers in the breath. Chest2003;123:2115–23.
13. Phillips M, Cataneo R, Ditkoff B, et al. Volatilemarkers of breast cancer in the breath. Breast J 2003;9:184–91.
14. Phillips M, Cataneo R, Greenberg J, Grodman R, Salazar M.Breath markers of oxidative stress in patients with unstableangina. Heart Dis 2003;5:95–9.
15. Moretti M, Phillips M, Abouzeid A, Cataneo R, Greenberg J.Increased breath markers of oxidative stress in normalpregnancy and in preeclampsia. Am J Obstet Gynecol2004;190:1184–90.
16. Phillips M, Cataneo R, Cheema T, Greenberg J. Increasedbreath biomarkers of oxidative stress in diabetes mellitus.Clin Chim Acta 2004;344:189–94.
17. Phillips M. Method for the collection and assay of volatileorganic compounds in breath. Anal Biochem 1997;247:272–8.
18. Phillips M, Herrera J, Krishnan S, Zain M, Greenberg J,Cataneo RN. Variation in volatile organic compounds in thebreath of normal humans. J Chromatogr B Biomed Sci Appl1999;729:75–88.
19. Kneepkens CM, Ferreira C, Lepage G, Roy CC. The hydro-carbon breath test in the study of lipid peroxida-tion: principles and practice. Clin Invest Med 1992;15:163–86.
20. Chomej PBK, Bitterlich N, Hui DS, Chan KS, Gosse H, SchauerJ, et al. Differential diagnosis of pleural effusions by fuzzy-logic-based analysis of cytokines. Respir Med 2004;98:308–17.
21. Schneider JPG, Bitterlich N, Neu K, Velcovsky HG, Morr H,Katz NEE. Fuzzy logic-based tumor marker profiles includinga new marker tumor M2-PK improved sensitivity to thedetection of progression in lung cancer patients. AnticancerRes 2003;23:899–906.
22. Glickman S, Kilburn J, Butler W, Ramos L. Rapid identifica-tion of mycolic acid patterns of Mycobacteria by high-performance liquid chromatography using pattern recogni-tion software and a Mycobacterium library. J Clin Microbiol1994;32:740–5.