Monotone Signal Segments Analysis as a novel method of breath detection and breath-to-breath...
8
Respiratory Physiology & Neurobiology 161 (2008) 273–280 Contents lists available at ScienceDirect Respiratory Physiology & Neurobiology journal homepage: www.elsevier.com/locate/resphysiol Monotone Signal Segments Analysis as a novel method of breath detection and breath-to-breath interval analysis in rat Tijana Bojic c , Jasna Saponjic a,∗ , Miodrag Radulovacki d , David W. Carley e , Aleksandar Kalauzi b,∗∗ a Department of Neurobiology, Institute for Biological Research Sinisa Stankovic, University of Belgrade, Despot Stefan Boulevard 142, 11060 Belgrade, Serbia b Department of Biophysics, Neuroscience and Biomedical Engineering, Institute for Multidisciplinary Research, Kneza Viseslava 1a, 11000 Belgrade, Serbia c School of Medicine, University of Belgrade, 11000 Belgrade, Serbia d Department of Pharmacology, University of Illinois, Chicago, IL 60612, USA e Center for Narcolepsy, Sleep and Health Research, University of Illinois, Chicago, IL 60612, USA article info Article history: Accepted 5 March 2008 Keywords: Monotone Signal Segments Analysis Breath detection Breath-to-breath interval Rat Respiratory pattern modulation Monoaminergic lesion abstract We applied a novel approach to respiratory waveform analysis—Monotone Signal Segments Analysis (MSSA) on 6-h recordings of respiratory signals in rats. To validate MSSA as a respiratory signal anal- ysis tool we tested it by detecting: breaths and breath-to-breath intervals; respiratory timing and volume modes; and changes in respiratory pattern caused by lesions of monoaminergic systems in rats. MSSA differentiated three respiratory timing (tachypneic, eupneic, bradypneic–apneic), and three volume (artifacts, normovolemic, hypervolemic-sighs) modes. Lesion-induced respiratory pattern mod- ulation was visible as shifts in the distributions of monotone signal segment amplitudes, and of breath-to-breath intervals. Specifically, noradrenergic lesion induced an increase in mean volume (p ≤ 0.03), with no change of the mean breath-to-breath interval duration (p ≥ 0.06). MSSA of timing modes detected noradrenergic lesion-induced interdependent changes in the balance of eupneic (decrease; p ≤ 0.02), and tachypneic (an increase; p ≤ 0.02) breath intervals with respect to control. In terms of breath durations within each timing mode, there was a tendency toward prolongation of the eupneic (p ≤ 0.08) and bradypneic–apneic (p ≤ 0.06) intervals. These results demonstrate that MSSA is sensitive to subtle shifts in respiratory rhythmogenesis not detectable by simple respiratory pattern descriptive statistics. MSSA represents a potentially valuable new tool for investigations of respiratory pattern control. © 2008 Elsevier B.V. All rights reserved. 1. Introduction In order to assess basic properties of respiratory generators and accompanying modulatory systems, respiratory signals have been analyzed by a variety of analytical methods (Longobardo et al., 1982; Carley, 1989; Carley et al., 1989; Khoo, 1999; Saponjic et al., 2003). Two approaches appear as the most frequent: linear (such as Fourier, wavelet and correlation analysis techniques), and nonlinear. While linear methods can depict periodicity of respi- ratory patterns (Siegelova and Kopecny, 1985; Benchetrit, 2000), nonlinear methods (Hughson et al., 1995) enable analysis of dif- ferent time-scaling characteristics. However, breath volumes and breath-to-breath (BB) intervals were not widely studied as ran- dom variables, though their corresponding probability distribution ∗ Corresponding author. Tel.: +381 11 2078426; fax: +381 11 2761433. ∗∗ Corresponding author. Tel.: +381 11 2078465; fax: +381 11 2761433. E-mail addresses: [email protected], [email protected] (J. Saponjic), [email protected] (A. Kalauzi). profiles could offer an additional and independent insight into the operation of relevant physiological systems. One of the possible approaches to achieve this is the extraction of monotone segments from the respiratory signal and thereby characterizations of the respiratory signal basic properties as relevant random variables. Monotone Signal Segments Analysis (MSSA) has previously been employed as a tool to measure changes in neuronal unit (Jankovic et al., 2000; Todorovic et al., 2007) or neuronal population activ- ity (Todorovic et al., 2007). A similar methodological approach was used for the analysis of linear decreases and increases of arterial blood pressure and pulse interval (Bertinieri et al., 1988; Zoccoli et al., 2001; Parati et al., 2006). The basic concept behind this approach is to observe any one-dimensional signal as the series of monotone segments between two local extremums. In fact, in any such sig- nal, continuous or discrete, one can locate an alternating series of maximums and minimums. In this study we applied MSSA on 6-h recordings of respira- tory signals in rats. We validated MSSA by detecting the breaths and BB intervals, by differentiating the distinct timing modes of the BB intervals in control recordings and their changes following 1569-9048/$ – see front matter © 2008 Elsevier B.V. All rights reserved. doi:10.1016/j.resp.2008.03.001
-
Upload
independent -
Category
Documents
-
view
1 -
download
0
Transcript of Monotone Signal Segments Analysis as a novel method of breath detection and breath-to-breath...
Respiratory Physiology & Neurobiology 161 (2008) 273–280
Contents lists available at ScienceDirect
Respiratory Physiology & Neurobiology
journa l homepage: www.e lsev ier .com/ locate / resphys io l
Monotone Signal Segments Analysis as a novel method of breath detectionand breath-to-breath interval analysis in rat
Tijana Bojic c, Jasna Saponjica,∗, Miodrag Radulovackid, David W. Carleye, Aleksandar Kalauzib,∗∗
a Department of Neurobiology, Institute for Biological Research Sinisa Stankovic, University of Belgrade, Despot Stefan Boulevard 142, 11060 Belgrade, Serbiab Department of Biophysics, Neuroscience and Biomedical Engineering, Institute for Multidisciplinary Research, Kneza Viseslava 1a, 11000 Belgrade, Serbiac School of Medicine, University of Belgrade, 11000 Belgrade, Serbiad Department of Pharmacology, University of Illinois, Chicago, IL 60612, USAe Center for Narcolepsy, Sleep and Health Research, University of Illinois, Chicago, IL 60612, USA
oachs of rtectinspiratree rolem
hiftss. Spof thesion
an ining m≤ 0.0
a r t i c l e i n f o
Article history:Accepted 5 March 2008
Keywords:Monotone Signal Segments AnalysisBreath detectionBreath-to-breath intervalRatRespiratory pattern modulationMonoaminergic lesion
a b s t r a c t
We applied a novel appr(MSSA) on 6-h recordingysis tool we tested it by demodes; and changes in re
MSSA differentiated thvolume (artifacts, normovulation was visible as sbreath-to-breath interval(p ≤ 0.03), with no changedetected noradrenergic lep ≤ 0.02), and tachypneic (durations within each timand bradypneic–apneic (p
shifts in respiratory rhythmogeMSSA represents a potentially v1. Introduction
In order to assess basic properties of respiratory generatorsand accompanying modulatory systems, respiratory signals havebeen analyzed by a variety of analytical methods (Longobardo etal., 1982; Carley, 1989; Carley et al., 1989; Khoo, 1999; Saponjicet al., 2003). Two approaches appear as the most frequent: linear(such as Fourier, wavelet and correlation analysis techniques), andnonlinear. While linear methods can depict periodicity of respi-ratory patterns (Siegelova and Kopecny, 1985; Benchetrit, 2000),nonlinear methods (Hughson et al., 1995) enable analysis of dif-ferent time-scaling characteristics. However, breath volumes andbreath-to-breath (BB) intervals were not widely studied as ran-dom variables, though their corresponding probability distribution
∗ Corresponding author. Tel.: +381 11 2078426; fax: +381 11 2761433.∗∗ Corresponding author. Tel.: +381 11 2078465; fax: +381 11 2761433.
E-mail addresses: [email protected], [email protected](J. Saponjic), [email protected] (A. Kalauzi).
1569-9048/$ – see front matter © 2008 Elsevier B.V. All rights reserved.doi:10.1016/j.resp.2008.03.001
to respiratory waveform analysis—Monotone Signal Segments Analysisespiratory signals in rats. To validate MSSA as a respiratory signal anal-g: breaths and breath-to-breath intervals; respiratory timing and volumeory pattern caused by lesions of monoaminergic systems in rats.espiratory timing (tachypneic, eupneic, bradypneic–apneic), and threeic, hypervolemic-sighs) modes. Lesion-induced respiratory pattern mod-in the distributions of monotone signal segment amplitudes, and ofecifically, noradrenergic lesion induced an increase in mean volumemean breath-to-breath interval duration (p ≥ 0.06). MSSA of timing modes
-induced interdependent changes in the balance of eupneic (decrease;crease; p ≤ 0.02) breath intervals with respect to control. In terms of breath
ode, there was a tendency toward prolongation of the eupneic (p ≤ 0.08)6) intervals. These results demonstrate that MSSA is sensitive to subtlenesis not detectable by simple respiratory pattern descriptive statistics.aluable new tool for investigations of respiratory pattern control.
© 2008 Elsevier B.V. All rights reserved.
profiles could offer an additional and independent insight into theoperation of relevant physiological systems. One of the possibleapproaches to achieve this is the extraction of monotone segmentsfrom the respiratory signal and thereby characterizations of therespiratory signal basic properties as relevant random variables.
Monotone Signal Segments Analysis (MSSA) has previously beenemployed as a tool to measure changes in neuronal unit (Jankovicet al., 2000; Todorovic et al., 2007) or neuronal population activ-ity (Todorovic et al., 2007). A similar methodological approach wasused for the analysis of linear decreases and increases of arterialblood pressure and pulse interval (Bertinieri et al., 1988; Zoccoli etal., 2001; Parati et al., 2006). The basic concept behind this approachis to observe any one-dimensional signal as the series of monotonesegments between two local extremums. In fact, in any such sig-nal, continuous or discrete, one can locate an alternating series ofmaximums and minimums.
In this study we applied MSSA on 6-h recordings of respira-tory signals in rats. We validated MSSA by detecting the breathsand BB intervals, by differentiating the distinct timing modes ofthe BB intervals in control recordings and their changes following

gy & Neurobiology 161 (2008) 273–280
274 T. Bojic et al. / Respiratory Physiolomonoaminergic system lesion-induced respiratory pattern modu-lation.
2. Materials and methods
2.1. Operative procedure and recording
Experiments were performed in nine chronically instrumentedmale adult Sprague–Dawley rats. We recorded sleep and breath-ing during baseline conditions, following sham injection (saline i.p.1 ml/kg), and every week for 5 weeks following injection of a sys-temic neurotoxin (1 ml/kg, i.p., see details below). Prior to surgeryand consistently throughout the experimental protocol, animalswere maintained on a 12-h light–dark cycle, and were housed at25 ◦C with free access to food and water. Principles for the care anduse of laboratory animals in research were strictly followed, as out-lined by the Guide for Care and Use of Laboratory animals (NationalAcademy of Sciences Press, Washington; 1996).
All details of the surgical procedures employed for elec-trode implantation and systemically (i.p.) induced monoaminergiclesions have been previously described (Saponjic et al., 2007). Aftera post-operative recovery period of 2 weeks, the experimentalrecording sessions began.
For respiratory measurements we employed bias-flow-ventilated whole-body plethysmographs (PLYUNIR/U, BuxcoElectronics, Inc., Sharon, CT, USA). The bias flow of room air(2 l/min) was more than one order of magnitude greater thanthe alveolar ventilation of the rat, ensuring that no re-breathingoccurred. The dimensions of the chamber were 15 cm wide × 25 cmlong × 15 cm high, allowing the animal free movement within thespace. A cable plugged onto the animal’s connector and passedthrough a sealed port carried the bioelectric activity from the head.Access to water was provided by bottle passed through a pressuretight seal. Thermal fluctuations associated with tidal respirationinduce changes in pressure within the plethysmograph, which,under appropriate conditions, are proportional to tidal volume(Epstein et al., 1980; Christon et al., 1996; Carley and Radulovacki,1999; Horner et al., 2003). To minimize the influence of the thermaland convective transients in room pressure, the box pressure wasreferenced to a low-pass filtered (time constant of 5 s) version ofitself. In this way, low-frequency trends or drift in box pressurerepresented common-mode signals and were rejected by thedifferential pressure transducer (Model DP45-14; Validyne Engi-
neering, Nothridge, CA). To minimize any possible artifact relatedto asymmetry or nonuniformity of pressure within the rectangularchamber, the transducer was mounted to and centered on the lidof the plethysmograph. Before any recording session the rats wereindividually adapted overnight in the small chamber space of theplethysmograph in which they were recorded. It was previouslyobserved that this is a sufficient adaptation to the recordingapparatus for adult rats, and that all of the measures relevant tothe present study remain stable after this adaptation (Carley etal., 1997). All experimental recordings began at 9:00 and lasted6 h. Each rat was always recorded in the same plethysmographduring all eight occasions: baseline recording, after saline injection(sham control), and six times after injection of the toxin: firstafter 24 h, and then after 7, 14, 21, 28 and 35 days (Saponjic et al.,2007).In this study for testing of Monotone Signal Segments Analy-sis in detection of the monoaminergic lesions induced respiratorypattern disturbance we used only sham control recordings andrecordings made 28 days after the neurotoxins injections. To followthe changes in respiratory pattern between control and post-lesionconditions, each rat served as its own control.
Fig. 1. Respiratory signal, obtained as output from the plethysmograph, recordedfrom a rat following saline injection (control). The presence of low-frequency oscil-lations can be visually appreciated. a.u.: arbitrary units.
2.2. Fundamentals of Monotone Signal Segments Analysis
While applying the MSSA analysis, we assume that the signalproperties within any monotone segment hold less informationthan do the positions and values of the local extremums. There-fore, by extracting the positions and values of successive minimumsand maximums, we substitute the signal samples with these newdata, reducing memory requirements and accelerating the sub-sequent off-line analyses (particularly convenient for long-termrecordings). Furthermore, when low-frequency oscillations exist(Fig. 1), or any other trend-like baseline instability, threshold meth-ods for detecting high amplitude phenomena (such as spikes inneural recordings) have been proven as inferior to mss (monotonesignal segments) analysis (Jankovic et al., 2000). By analogy, thesebenefits should also convey to the detection of regular breaths andsighs in long-term respiratory recordings.
In mathematical terms, one can distinguish positive and nega-tive monotone segments (mss+ and mss−, respectively), dependingon whether they are located between a local minimum and max-imum, or vice versa. Consequently, any signal could be describedas a union:
⋃ ⋃
s(t) =i
(mss+i
∪ mss−i
) or s(t) =i
(mss−i
∪ mss+i
),
depending on whether the signal starts with a positive or negativemss. Conventionally, we discard part of the signal situated betweenthe first recorded sample and first detected local extremum, as wedo not know its full segment properties. Further, if we denote with(tmax
i, smax
i) or (tmin
i, smin
i) time occurrences, and signal values in
its ith detected local maximum or minimum (respectively), threebasic mss properties could be defined:
(a) for mss+
duration as d(mss+i
) = tmaxj − tmin
i
height as h(mss+i
) = smaxj − smin
i
and slope as s(mss+i
) = arctgsmax
j− smin
i
tmaxj
− tmini
gy & Neurobiology 161 (2008) 273–280 275
T. Bojic et al. / Respiratory Physiolowhere j = i if the signal starts with mss+1 or j = i + 1 if it starts with
mss−1 .
(b) for mss−
duration as d(mss−i
) = tminj − tmax
i
height as h(mss−i
) = sminj − smax
i
and slope as s(mss−i
) = arctgsmin
j− smax
i
tminj
− tmaxi
where j = i if the signal starts with mss−1 or j = i + 1 if it starts
with mss+1 . A typical part of a rat respiratory signal, with some
characteristic mss points, is presented in Fig. 2. In this work westudied distributions only of mss heights (breath volumes), as well
as distributions of the derived BB intervals.3. Results
3.1. MSSA detection of the breaths and breath-to-breath intervals
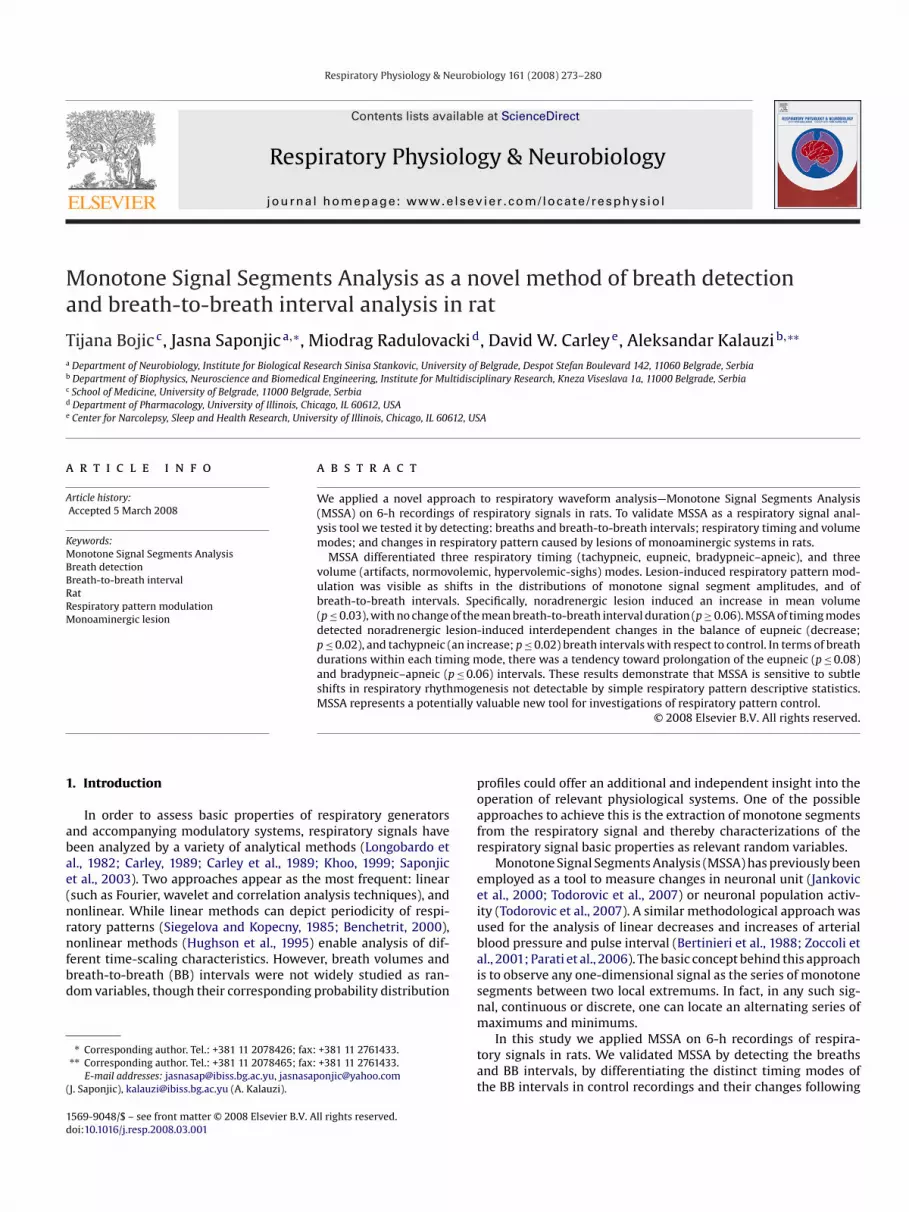
In order to study basic statistical properties of monotonesegment heights, in our previous work we constructed theirrespective occurrence histograms before and after an experi-mental intervention (Todorovic et al., 2007). Such a histogramis in fact the distribution of the number of detected mss,N(h(mss+/−)), which have heights that fall between h(mss+/−) andh(mss+/−) + ıh(mss+/−), where ıh(mss+/−) denotes the incrementalhistogram abscissa interval. In the case of the respiratory signals,examination of the modality of distribution of all mss+ heights(Fig. 3A) enabled us to differentiate functional breathing inspiri-ums (breathing volumes) from artifacts (usually visible as smallheight mss+ within the respiratory signal recorded by plethysmog-raphy). In Fig. 2, such a small height mss+ could be seen betweenthe second and third, but not between the first two inspiriums. Thepresence of these artifacts makes the calculation of a BB interval, as
Fig. 2. An expanded segment of the respiratory signal illustrated in Fig. 1, depict-ing the characteristic mss+/− (monotone signal segments) quantitative properties:h(mss+
1 ), h(mss−2 ): heights of the first positive and second negative mss, respectively;
d(mss+1 ), d(mss−
2 ): durations of the respective mss; (Tb)1, (Tb)2: breath-to-breath (BB)intervals; a.u.: arbitrary units.
Fig. 3. (A) A typical distribution histogram presenting the number of monotonerespiratory signal segments N(h(mss+/−)), distributed by their heights, during a 6 hof recording in rat under control conditions. Positive and negative breathing peaks,Nb and Nb− , and one formed by non-respiratory, artifactual small height mss, Na,are marked separately. Limit between Na and Nb is pointed by a down arrow. Insert:magnified part of the right side of Nb, visualising the presence of sighs. (B) Histogram
of the number of BB intervals, N(Tb), by their duration, Tb. Three modes within therespiratory pattern (N(Tb)) distribution are marked as Ne (eupneic), Nt (tachypneic)and Nba (bradypneic–apneic). Insert: magnified part of Nba, visualising the presenceof bradypneic–apneic intervals.a sum of durations of the negative and its following positive signalsegment, impossible. In fact, irregularity of the artifacts appearancemakes the construction of the distribution histograms of all mss+
heights necessary. In addition, presence of sighs, as larger ampli-tude mss+, could also be detected and quantified using the mss+
heights distribution histograms.
3.2. MSSA detection of respiratory volume modes
To operationalize this approach, it is necessary first to iden-tify the most prominent, approximately normally distributed modewithin a histogram, denoted as Nb(h(mss+)) in Fig. 3A. In addition,small height mss+ form a relatively narrow, sharp peak situatedaround h(mss+) ≈ 0 (Na). The limit between Nb and Na could easilybe found as the minimum in the histogram profile (down arrowin Fig. 3A). On the other hand, the sighs, although present in the
276 T. Bojic et al. / Respiratory Physiology & Neurobiology 161 (2008) 273–280
intervals, it was necessary to determine the limits between respec-
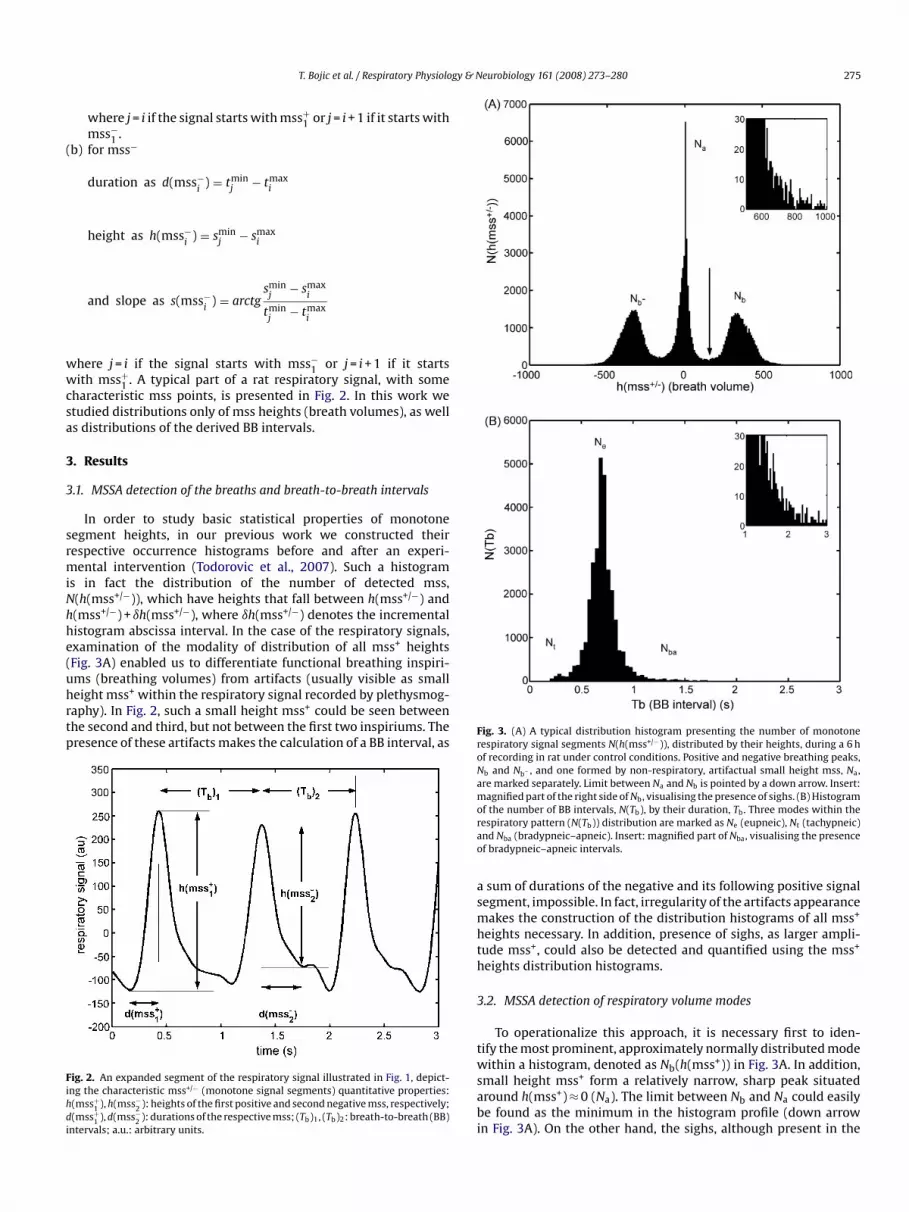
Fig. 4. (A) Distribution of the square root of logarithms of monotone signal seg-ments numbers, sqrt(log(N(h(mss+)))), by their respective heights, h(mss+). Threevolume modes within this respiratory pattern distribution are marked as Na (arti-facts), Nn (normovolemic) and Nhs (hypervolemic breaths and sighs). In the Nhs
region, points leave the linear trend of Nn, indicated by a dashed line, positioned atthe hypervolemic side of Nn (data from Fig. 3A). (B) Distribution of the square root
of logarithms of BB intervals numbers, sqrt(log(N(Tb))), by their respective intervaldurations, Tb (data from Fig. 3B). Three timing modes are marked as Nt (tachyp-neic), Ne (eupneic) and Nba (bradypneic–apneic). In the Nba region, points leave thelinear trend of Ne, indicated by a dashed line, positioned at the bradypneic side ofNe.signal, did not form a peak that would, with its shape, resembleNb, but were rather sparsely distributed along the abscissa to theright side of Nb. Owing to the relatively greater number of nor-movolemic inspiriums with respect to the number of sighs, theybecame visible in the “tail” of histogram only after changing thescale of N(h(mss+)) (insert of Fig. 3A). However, by calculating thelogarithm and square root of histogram values, an approximatelynormally distributed component (Nb) becomes linear, while mssheights belonging to hypervolemic breaths and sighs, since not nor-mally distributed, leave the trend set by the right side of Nb. Theresult, shown in Fig. 4A, permits distinction of three, rather thantwo, respiratory volume components: Na (low volume deflectionswhich may be physiologic or artifactual), Nn (normovolemic), andNhs (hypervolemic breaths and sighs).
Fig. 5. Examples of the verification results that histogram components Nt , Ne andNba from Fig. 4 consist of tachypneic (A), eupneic (B) and bradypneic–apneic (C) BBintervals, respectively. Identified intervals are marked by horizontal dashed lines.a.u.: arbitrary units.
3.3. MSSA detection of respiratory timing modes
A similar approach can be applied to the detection and charac-terization of respiratory timing modes. In mathematical terms, weintroduce a new random variable, (Tb)i = (tb)max
i+1 − (tb)maxi , denot-
ing temporal intervals between neighboring tidal inspiriums, or BBintervals (Fig. 2.), occurring at (tb)max
i and (tb)maxi+1 . The impact of
different experimental conditions on respiratory pattern modula-tion could then be studied on respective distributions of N(Tb), ornumber of BB intervals.
Observing N(Tb) histograms obtained from the 6-h respiratoryrecordings, three main components of respiratory timing wereobserved in all nine experimental animals: a dominant centralpeak, consisting of regular eupneic inter-inspirium BB intervalsNe(Tb); a smaller left tachypneic peak Nt(Tb); and a number ofbradypneic–apneic intervals, sparsely distributed, Nba(Tb) (Fig. 3B).Again, more detailed presence of Nba intervals is depicted in theinsert of Fig. 3B.
In order to verify that the histogram components Nt, Ne andNba really consist of tachypneic, eupneic and bradypneic–apneic BB
tive N(Tb) components. Such a limit was easily noticed between Nt
and Ne. However, between Ne and Nba there was often no clear min-imum in the histogram profile upon which to establish the limit. Bycalculating the logarithm and square root of histogram values, anapproximately normally distributed component (Ne) becomes lin-ear (Fig. 4B), while Nba exhibits a nonlinear dependence, permittinga more exact determination of the component limits. Such a trans-formed histogram, of the same data previously shown in Fig. 3B, ispresented in Fig. 4B.
In order to locate particular BB intervals belonging to individualcomponents Nt, Ne and Nba, a MATLAB program was developed bywhich we were able to identify and mark the respective BB intervalsin the original time domain of respiratory signal. An example ofsuch identification of the three types of intervals is presented inFig. 5.
3.4. MSSA detection of the respiratory pattern modulation
To test our novel methodological approach in respiratory patternmodulation detection, we applied MSSA on 6-h recordings of res-
T. Bojic et al. / Respiratory Physiology & Neurobiology 161 (2008) 273–280 277
in twrved t
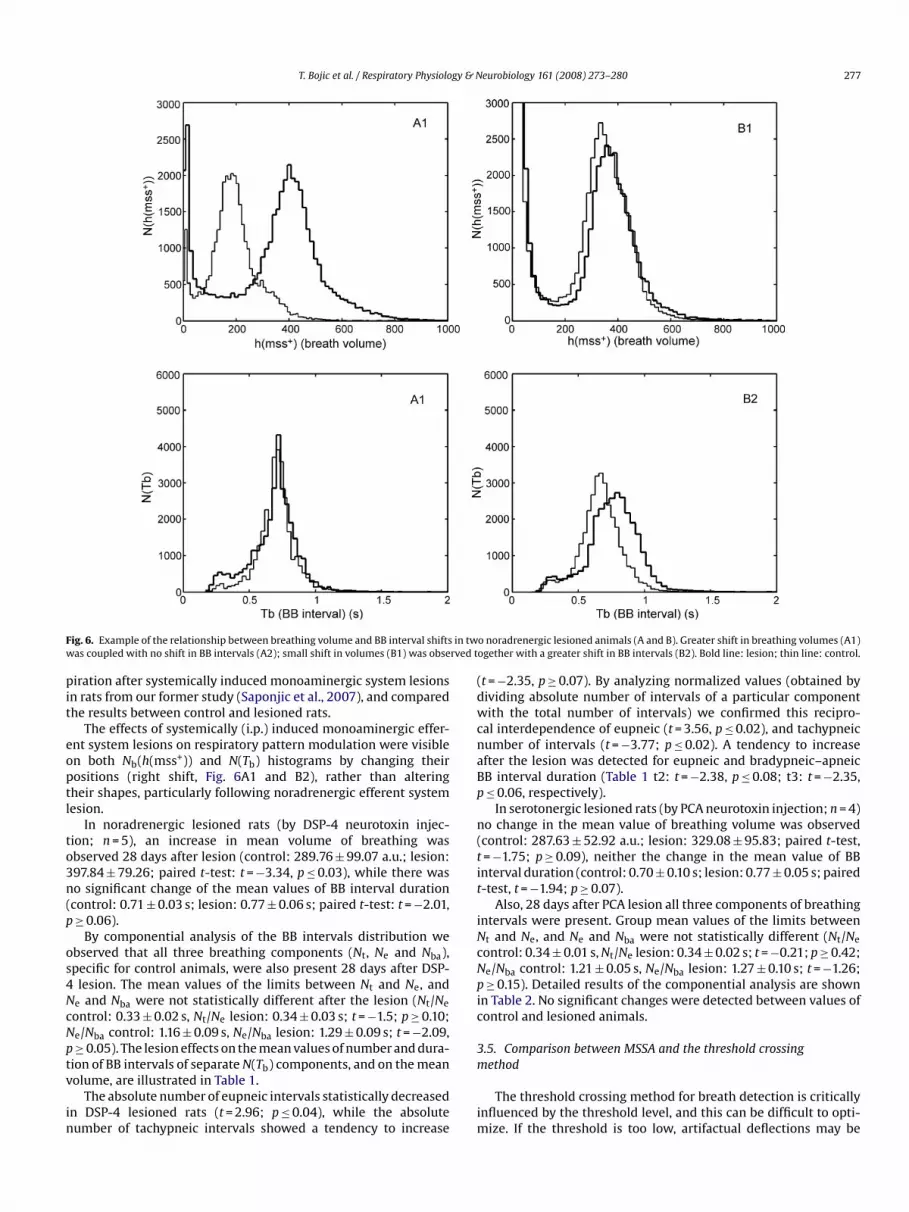
Fig. 6. Example of the relationship between breathing volume and BB interval shiftswas coupled with no shift in BB intervals (A2); small shift in volumes (B1) was obse
piration after systemically induced monoaminergic system lesionsin rats from our former study (Saponjic et al., 2007), and comparedthe results between control and lesioned rats.
The effects of systemically (i.p.) induced monoaminergic effer-ent system lesions on respiratory pattern modulation were visibleon both Nb(h(mss+)) and N(Tb) histograms by changing theirpositions (right shift, Fig. 6A1 and B2), rather than alteringtheir shapes, particularly following noradrenergic efferent system
lesion.In noradrenergic lesioned rats (by DSP-4 neurotoxin injec-tion; n = 5), an increase in mean volume of breathing wasobserved 28 days after lesion (control: 289.76 ± 99.07 a.u.; lesion:397.84 ± 79.26; paired t-test: t = −3.34, p ≤ 0.03), while there wasno significant change of the mean values of BB interval duration(control: 0.71 ± 0.03 s; lesion: 0.77 ± 0.06 s; paired t-test: t = −2.01,p ≥ 0.06).
By componential analysis of the BB intervals distribution weobserved that all three breathing components (Nt, Ne and Nba),specific for control animals, were also present 28 days after DSP-4 lesion. The mean values of the limits between Nt and Ne, andNe and Nba were not statistically different after the lesion (Nt/Ne
control: 0.33 ± 0.02 s, Nt/Ne lesion: 0.34 ± 0.03 s; t = −1.5; p ≥ 0.10;Ne/Nba control: 1.16 ± 0.09 s, Ne/Nba lesion: 1.29 ± 0.09 s; t = −2.09,p ≥ 0.05). The lesion effects on the mean values of number and dura-tion of BB intervals of separate N(Tb) components, and on the meanvolume, are illustrated in Table 1.
The absolute number of eupneic intervals statistically decreasedin DSP-4 lesioned rats (t = 2.96; p ≤ 0.04), while the absolutenumber of tachypneic intervals showed a tendency to increase
o noradrenergic lesioned animals (A and B). Greater shift in breathing volumes (A1)ogether with a greater shift in BB intervals (B2). Bold line: lesion; thin line: control.
(t = −2.35, p ≥ 0.07). By analyzing normalized values (obtained bydividing absolute number of intervals of a particular componentwith the total number of intervals) we confirmed this recipro-cal interdependence of eupneic (t = 3.56, p ≤ 0.02), and tachypneicnumber of intervals (t = −3.77; p ≤ 0.02). A tendency to increaseafter the lesion was detected for eupneic and bradypneic–apneicBB interval duration (Table 1 t2: t = −2.38, p ≤ 0.08; t3: t = −2.35,p ≤ 0.06, respectively).
In serotonergic lesioned rats (by PCA neurotoxin injection; n = 4)no change in the mean value of breathing volume was observed(control: 287.63 ± 52.92 a.u.; lesion: 329.08 ± 95.83; paired t-test,t = −1.75; p ≥ 0.09), neither the change in the mean value of BBinterval duration (control: 0.70 ± 0.10 s; lesion: 0.77 ± 0.05 s; pairedt-test, t = −1.94; p ≥ 0.07).
Also, 28 days after PCA lesion all three components of breathingintervals were present. Group mean values of the limits betweenNt and Ne, and Ne and Nba were not statistically different (Nt/Ne
control: 0.34 ± 0.01 s, Nt/Ne lesion: 0.34 ± 0.02 s; t = −0.21; p ≥ 0.42;Ne/Nba control: 1.21 ± 0.05 s, Ne/Nba lesion: 1.27 ± 0.10 s; t = −1.26;p ≥ 0.15). Detailed results of the componential analysis are shownin Table 2. No significant changes were detected between values ofcontrol and lesioned animals.
3.5. Comparison between MSSA and the threshold crossingmethod
The threshold crossing method for breath detection is criticallyinfluenced by the threshold level, and this can be difficult to opti-mize. If the threshold is too low, artifactual deflections may be
278 T. Bojic et al. / Respiratory Physiology & Neurobiology 161 (2008) 273–280
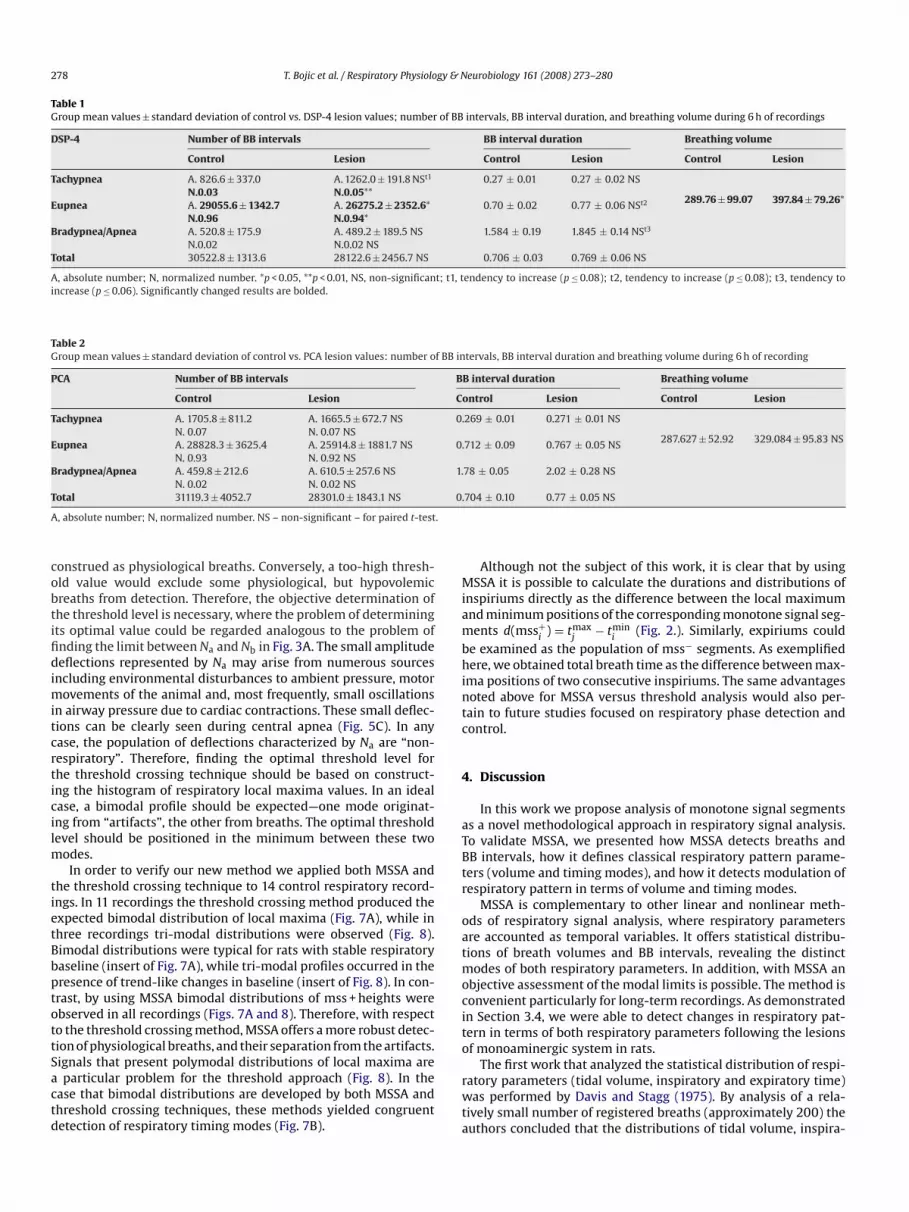
Table 1Group mean values ± standard deviation of control vs. DSP-4 lesion values; number of BB intervals, BB interval duration, and breathing volume during 6 h of recordings
DSP-4 Number of BB intervals BB interval duration Breathing volume
Control Lesion Control Lesion Control Lesion
Tachypnea A. 826.6 ± 337.0N.0.03
A. 1262.0 ± 191.8 NSt1
N.0.05**0.27 ± 0.01 0.27 ± 0.02 NS
289.76 ± 99.07 397.84 ± 79.26*Eupnea A. 29055.6 ± 1342.7N.0.96
A. 26275.2 ± 2352.6*N.0.94*
0.70 ± 0.02 0.77 ± 0.06 NSt2
t; t1, t
f BB in
B
C
0
0
1.
0
.
Bradypnea/Apnea A. 520.8 ± 175.9N.0.02
A. 489.2 ± 189.5 NSN.0.02 NS
Total 30522.8 ± 1313.6 28122.6 ± 2456.7 NS
A, absolute number; N, normalized number. *p < 0.05, **p < 0.01, NS, non-significanincrease (p ≤ 0.06). Significantly changed results are bolded.
Table 2Group mean values ± standard deviation of control vs. PCA lesion values: number o
PCA Number of BB intervals
Control Lesion
Tachypnea A. 1705.8 ± 811.2N. 0.07
A. 1665.5 ± 672.7 NSN. 0.07 NS
Eupnea A. 28828.3 ± 3625.4N. 0.93
A. 25914.8 ± 1881.7 NSN. 0.92 NS
Bradypnea/Apnea A. 459.8 ± 212.6N. 0.02
A. 610.5 ± 257.6 NSN. 0.02 NS
Total 31119.3 ± 4052.7 28301.0 ± 1843.1 NS
A, absolute number; N, normalized number. NS – non-significant – for paired t-test
construed as physiological breaths. Conversely, a too-high thresh-old value would exclude some physiological, but hypovolemicbreaths from detection. Therefore, the objective determination ofthe threshold level is necessary, where the problem of determiningits optimal value could be regarded analogous to the problem offinding the limit between Na and Nb in Fig. 3A. The small amplitudedeflections represented by Na may arise from numerous sourcesincluding environmental disturbances to ambient pressure, motormovements of the animal and, most frequently, small oscillationsin airway pressure due to cardiac contractions. These small deflec-tions can be clearly seen during central apnea (Fig. 5C). In anycase, the population of deflections characterized by Na are “non-respiratory”. Therefore, finding the optimal threshold level forthe threshold crossing technique should be based on construct-ing the histogram of respiratory local maxima values. In an ideal
case, a bimodal profile should be expected—one mode originat-ing from “artifacts”, the other from breaths. The optimal thresholdlevel should be positioned in the minimum between these twomodes.In order to verify our new method we applied both MSSA andthe threshold crossing technique to 14 control respiratory record-ings. In 11 recordings the threshold crossing method produced theexpected bimodal distribution of local maxima (Fig. 7A), while inthree recordings tri-modal distributions were observed (Fig. 8).Bimodal distributions were typical for rats with stable respiratorybaseline (insert of Fig. 7A), while tri-modal profiles occurred in thepresence of trend-like changes in baseline (insert of Fig. 8). In con-trast, by using MSSA bimodal distributions of mss + heights wereobserved in all recordings (Figs. 7A and 8). Therefore, with respectto the threshold crossing method, MSSA offers a more robust detec-tion of physiological breaths, and their separation from the artifacts.Signals that present polymodal distributions of local maxima area particular problem for the threshold approach (Fig. 8). In thecase that bimodal distributions are developed by both MSSA andthreshold crossing techniques, these methods yielded congruentdetection of respiratory timing modes (Fig. 7B).
1.584 ± 0.19 1.845 ± 0.14 NSt3
0.706 ± 0.03 0.769 ± 0.06 NS
endency to increase (p ≤ 0.08); t2, tendency to increase (p ≤ 0.08); t3, tendency to
tervals, BB interval duration and breathing volume during 6 h of recording
B interval duration Breathing volume
ontrol Lesion Control Lesion
.269 ± 0.01 0.271 ± 0.01 NS
287.627 ± 52.92 329.084 ± 95.83 NS.712 ± 0.09 0.767 ± 0.05 NS
78 ± 0.05 2.02 ± 0.28 NS
.704 ± 0.10 0.77 ± 0.05 NS
Although not the subject of this work, it is clear that by usingMSSA it is possible to calculate the durations and distributions ofinspiriums directly as the difference between the local maximumand minimum positions of the corresponding monotone signal seg-ments d(mss+
i) = tmax
j− tmin
i(Fig. 2.). Similarly, expiriums could
be examined as the population of mss− segments. As exemplifiedhere, we obtained total breath time as the difference between max-ima positions of two consecutive inspiriums. The same advantagesnoted above for MSSA versus threshold analysis would also per-tain to future studies focused on respiratory phase detection andcontrol.
4. Discussion
In this work we propose analysis of monotone signal segmentsas a novel methodological approach in respiratory signal analysis.To validate MSSA, we presented how MSSA detects breaths andBB intervals, how it defines classical respiratory pattern parame-ters (volume and timing modes), and how it detects modulation ofrespiratory pattern in terms of volume and timing modes.
MSSA is complementary to other linear and nonlinear meth-ods of respiratory signal analysis, where respiratory parametersare accounted as temporal variables. It offers statistical distribu-tions of breath volumes and BB intervals, revealing the distinctmodes of both respiratory parameters. In addition, with MSSA anobjective assessment of the modal limits is possible. The method isconvenient particularly for long-term recordings. As demonstratedin Section 3.4, we were able to detect changes in respiratory pat-tern in terms of both respiratory parameters following the lesionsof monoaminergic system in rats.
The first work that analyzed the statistical distribution of respi-ratory parameters (tidal volume, inspiratory and expiratory time)was performed by Davis and Stagg (1975). By analysis of a rela-tively small number of registered breaths (approximately 200) theauthors concluded that the distributions of tidal volume, inspira-

T. Bojic et al. / Respiratory Physiology & N
Fig. 7. (A) Typical bimodal histograms of monotone respiratory signal segmentsN(h(mss+)) heights (thick line); and local maximums by their values (thin line), in acase or stable respiratory baseline throughout a 6-h recording (insert). (B) Distribu-tions of the number of BB intervals (N(Tb)) by their durations (Tb) obtained by MSSA(thick line) and by the threshold crossing method (thin line).
Fig. 8. The bimodal histogram of monotone respiratory signal segments N(h(mss+))by their heights (thick line); and the tri-modal histogram of local maximums by theirvalues (thin line), in a case of unstable respiratory baseline during a 6-h recording(insert).
eurobiology 161 (2008) 273–280 279
tory and expiratory time were, in general, unimodal. The presentstudy over a long-time scale refines this interpretation by pre-senting a systematic analysis of over 30,000 breaths per each rat(Tables 1 and 2).
In biological systems multimodal distributions are commonlyexpressed by homeostatic control systems. Often, this phenomenonreflects the existence of multiple generating mechanisms (multi-ple sites of generation), or the multiple regimes of one generatingmechanism (one site of generation). Decomposition of a multi-modal distribution into its individual normal components providesinsight into the underlying neural generating mechanisms. Themultimodal distribution of BB intervals and its logarithmic trans-formation clearly evidenced three components; Nt, Ne and Nba. Inorder to verify the type of respiratory pattern associated with eachcomponent, a MATLAB program was developed to mark the respec-tive BB intervals in the original time domain of the respiratory signal(Fig. 5). By determining the limits between individual componentswe were able to detect and quantify changes in each compo-nent induced by monoaminergic lesions. Analysis of these changescould further be an objective of other various basic and clinicalstudies.
Following noradrenergic lesion, a shift toward larger eupneictidal volumes was observed, a finding that confirmed results of ourprevious study (Saponjic et al., 2007). Using modal analysis of theBB interval distribution we determined that all three respiratorytiming components (Nt, Ne and Nba) identified under control condi-tions remained present 28 days after DSP-4 injection, implying thatthe basic components of breathing rhythm were still present afternoradrenergic lesion. The finding that the mean values of the limitsbetween Nt and Ne and Ne and Nba were not statistically differentafter DSP-4 lesion with respect to control condition, may indicatethat the neural mechanisms generating the tachypneic, eupneic andbradypneic–apneic components of respiratory pattern continue tooperate under the same regime despite the deficit in noradrenergiccontrol of the ponto-medullary respiratory pattern generator.
While classical respiratory parameters analysis (Saponjic et al.,2007) did not find any change in the mean respiratory rate dur-ing any sleep/wake state in rats with noradrenergic system lesion,the MSSA uncovered the fine redistribution of respiratory patterncomponents, as a consequence of impaired noradrenergic neuro-transmission. Specifically, the impact of this lesion was observed asa decreased number of eupneic and an increased number of tachyp-neic intervals. This result might suggest the predominant impactof tachypnea generating subregions of ventral respiratory group
(Monnier et al., 2003) in respiratory pattern modulation. Alter-natively, increased activity within the lateral parabrachial regionor rostral Kolliker–Fuse nucleus may contribute to an increasedpropensity toward tachypneic patterns after noradrenergic lesion(Chamberlin and Saper, 1994). Simultaneously, in terms of the dura-tion of certain BB intervals, there was a tendency for prolongationof eupneic and bradypneic/apneic intervals (Table 1).In contrast, serotonergic lesion produced no changes in eitherthe mean volume of breathing, or the mean BB interval duration,confirming the results from our previous study (Saponjic et al.,2007). As for noradrenergic lesions, all three components of the BBinterval distribution remained intact and functioning within thesame margins of the respiratory regime. Detailed analysis of theNt, Ne and Nba components in serotonergic lesion (Table 2) did notreveal any significant changes between control and post-lesion con-ditions. These data indicate that the serotonergic lesion might havemilder effects on BB interval components with respect to the nora-drenergic lesion. Although we previously demonstrated that theserotonergic lesion induced an increase in post-sigh sleep-apneafrequency and duration (Saponjic et al., 2007), here we did notspecifically analyze sleep-related respiratory phenomena. For that

gy & N
Jankovic, B., Kalauzi, A., Culic, M., Saponjic, J., 2000. Recognition and separation ofsimple and complex action potentials of Purkinje cells using personal computer.In: Proceedings of the XLIV ETRAN Conference III, pp. 223–226.
280 T. Bojic et al. / Respiratory Physiolo
purpose, future adaptations of the MSSA approach for distinctionof post-sigh and spontaneous central apneas within Nba compo-nent may yield new insights into the mechanisms of sleep relatedrespiratory disturbances.
Although we presented here multimodal histograms of therespiratory mss+ heights that differentiated functional breathinginspiriums from artifacts and physiologically augmented breaths(hypervolemic breaths and sighs) as shown in Figs. 3A and 4A,additional sophistication of the methodological approach is neededfor volume-related automatic sigh detection and differentiation ofspontaneous and sigh-related apneas. Analysis of monotone signalsegments also offers a possibility to cross analyze different res-piratory timing modes with particular respiratory volume modesto throw light on new aspects of the mechanisms of respiratorypattern modulation.
Acknowledgements
This work was supported by Serbian Ministry of Science andEnvironmental Protection Grants 143005, 143027, 145062, and NIHGrant AG016303.
References
Benchetrit, G., 2000. Breathing pattern in humans: diversity and individuality.Respir. Physiol. 122, 123–129.
Bertinieri, G., di Rienzo, M., Cavalazzi, A., Ferrari, A.U., Pedotti, A., Mancia, G., 1988.Evaluation of baroreceptor reflex by blood pressure monitoring in unanes-thetized cats. Am. J. Physiol. 254, H377–H383.
Carley, D.W., 1989. Minimal modeling of hyman respiratory stability. In: Khoo, M.(Ed.), Modeling and Parameter Estimation in Respiratory Control. Plenum Press,NY, pp. 171–180.
Carley, D.W., Maayan, C., Grimes, J., Shannon, D.C., 1989. Breath-by-breath respira-tory timing and volume control during periodic breathing. Am. J. Physiol. 257,R653–R660.
Carley, D.W., Radulovacki, M., 1999. Mirtazapine, a mixed-profile serotonin ago-nist/antagonist, suppresses sleep apnea in the rat. Am. J. Respir. Crit. Care Med.160, 1824–1829.
Carley, D.W., Trbovic, S.M., Bozanich, A., Radulovacki, M., 1997. Cardiopulmonarycontrol in sleeping Sprague–Dawley rats treated with hydralazine. J. Appl. Phys-iol. 83, 1954–1961.
eurobiology 161 (2008) 273–280
Chamberlin, N.L., Saper, C.B., 1994. Topographic organization of respiratoryresponses to glutamate microstimulation of the parabrachial nucleus in the rat.J. Neurosci. 14, 6500–6510.
Christon, J., Carley, D.W., Monti, D., Radulovacki, M., 1996. Effects of inspired gas onsleep-related apnea in the rat. J. Appl. Physiol. 80, 2102–2107.
Davis, J.N., Stagg, D., 1975. Interrelationships of the volume and time components ofindividual breaths in resting man. J. Physiol. 245, 481–498.
Epstein, R.A., Epstein, M.A., Haddad, G.G., Mellins, R.B., 1980. Practical implementa-tion of the barometric method for measurement of tidal volume. J. Appl. Physiol.49, 1107–1115.
Horner, R.L., Stephenson, R., O’Donnell, C.P., 2003. Instrumentation and meth-ods for chronic studies of sleep and breathing in rodents. In: Carley,D.W., Radulovacki, M. (Eds.), Sleep-related Breathing Disorders. Experimen-tal Models and Therapeutic Potentials. Marcel Dekker, Inc., New York, Basel,pp. 19–55.
Hughson, R.L., Yamamoto, Y., Fortrat, J.O., 1995. Is the pattern of breathing atrest chaotic? A test of the Lyapunov exponent. Adv. Exp. Med. Biol. 393,15–19.
Khoo, M., 1999. Periodic breathing and central apnea. In: Altose, M.D., Kawakami, Y.(Eds.), Control of Breathing in Health and Disease, vol. 135. Marcel Dekker Inc.,New York, Basel, pp. 203–250.
Longobardo, G.S., Gothe, B., Goldman, M.D., Cherniack, N.S., 1982. Sleep apnea con-sidered as a control system instability. Respir. Physiol. 50, 311–333.
Monnier, A., Alheid, G.F., McCrimmon, D.R., 2003. Defining ventral medullary res-piratory compartments with a glutamate receptor agonist in the rat. J. Physiol.548, 859–874.
Parati, G., Faini, A., Valentini, M., 2006. Blood pressure variability: its measurementand significance in hypertension. Curr. Hypertens. Rep. 8, 199–204.
Saponjic, J., Radulovacki, M., Carley, D.W., 2003. Respiratory pattern modulationby the pedunculopontine tegmental nucleus. Respir. Physiol. Neurobiol. 138,223–237.
Saponjic, J., Radulovacki, M., Carley, D.W., 2007. Monoaminergic system lesionsincrease post-sigh respiratory pattern disturbance during sleep in rats. Physiol.Behav. 90, 1–10.
Siegelova, J., Kopecny, J., 1985. Spectral analysis of breathing pattern in man. Physiol.Bohemoslov. 34, 321–331.
Todorovic, D., Kalauzi, A., Prolic, Z., Jovic, M., Mutavdzic, D., 2007. A method fordetecting the effect of magnetic field on activity changes of neuronal popula-tions of Morimus funereus (Coleoptera, Cerambycidae). Bioelectromagnetics 28,238–241.
Zoccoli, G., Andreoli, E., Bojic, T., Cianci, T., Franzini, C., Predieri, S., Lenzi, P., 2001.Central and baroreflex control of heart rate during the wake–sleep cycle in rat.Sleep 24, 753–758.