
Interim Reports - Eindhoven University of Technology research portal
Upload
khangminh22Category
view
2download
0
Eindhoven University of Technology
MASTER
Breath detection by diaphragm electromyography in neonates
Elenbaas, T.
Award date:2000
Link to publication
DisclaimerThis document contains a student thesis (bachelor's or master's), as authored by a student at Eindhoven University of Technology. Studenttheses are made available in the TU/e repository upon obtaining the required degree. The grade received is not published on the documentas presented in the repository. The required complexity or quality of research of student theses may vary by program, and the requiredminimum study period may vary in duration.
General rightsCopyright and moral rights for the publications made accessible in the public portal are retained by the authors and/or other copyright ownersand it is a condition of accessing publications that users recognise and abide by the legal requirements associated with these rights.
• Users may download and print one copy of any publication from the public portal for the purpose of private study or research. • You may not further distribute the material or use it for any profit-making activity or commercial gain
e Eindhoven University of Technology Faculty FIK
Supervisors: Ir. R.C.M. Berendsen Prof. Dr. Ir. P. F.F. Wijn
Breath detection by diaphragm electromyography in neonates
Thijs Elenbaas
August 2000 NF/KFM 2000-03

Abstract
In a neonatal intensive care monitoring of the premature and ill newborn is of vital importance. lf birth is premature, the respiratory drive is likely not to be fully developed and should therefore be monitored. Commonly used methods of breath monitoring are flow, abdominal stretch and electrical muscle activity-measurement. The latter is the subject of this study.
Diaphragm electromyography (EMGdi) has been stuclied because of the possible theoretica! advantages it has over other measuring methods: faster monitoring of breaths and extra information about ventilatory properties of the subject.
The signal is very sensitive to artifacts, in the form of structural distortions caused by cardiac electrical activity and incidental distortions, mostly caused by electrical activities generated by larger musdes during movement. This has led to the testing of different filtering techniques.
Low-frequency high-pass filtering reduces but not entirely removes the ECG cardiac artifacts and suppresses movement artifacts. The tested subtradion method has proven not to be effective in its current form; ECG peaks have been replaced by new peaks with 60-75% amplitude of the originals. The zero padding method is preferred if frequency components are of interest and remaval of approximately 20% of the signalis no objection, but should not be used if the signal is intended as a monitor signal. The gating and averaging method fills the area contaminated by cardiac activity with partsof the previously averaged signal. The gating and averaging method results in a smooth breathing signal and offers a usabie signal for visual inspection.
A method of breath detection in the EMGdi has been tested but showed not to he accurate: the number of undetected breaths is high ( 30% to 55%) and error in detected position is high (up to 100 ms). It is concluded that gating and averaging provides a signal that is sufficient as an additional monitor signal for respiration but, at this point, not to find exact starts of breaths.

Contents
1 Introduetion
2 Physiology 2.1 Introduetion . . . . . . . . . . . . 2.2 Components of thorax breathing .
2.2.1 thorax . . . . . . . 2.2.2 Intercostal musdes 2.2.3 Diaphragm
2.3 Muscle structure . . . . . 2.3.1 Muscle types . . . 2.3.2 Cross-striated muscle fibres
3 Experimental setup 3.1 Electrodes . . . . 3.2 Amplifier ..... 3.3 Data-acquisition .
4 Signal processing 4.1 Introduetion . . 4.2 Frequency filtering 4.3 R-peak detection 4.4 Subtraction . . . . 4.5 Gating ...... . 4.6 Gating and averaging . 4. 7 Breath start detection
5 Software implementation 5.1 Considerations . . . . . 5.2 Program layout . . . . .
5.2.1 Module Waveview. 5.2.2 Module DataiO . . 5.2.3 Module ModData .
5.3 Screenshot . . . . . . . . .
1
3
6 6 7 7 7 8 9 9
10
13 13 15 16
19 19 21 23 25 28 31 33
36 36 37 37 37 37 38

6 Measurements 40 6.1 Comparison with conventional methods . 40 6.2 Signal quality ••• 0 •••• 0 • 0 0 43
7 Conclusions and recommendations 46
8 Technology assessment 49
A Setup specifications 52 A.l Amplifier characteristics 52 A.2 Electrades specifications 53
B Savitzky-Golay filter 54
c Wavedata viewer screenshots 56
2

Chapter 1
Introduetion
In a neonatal intensive care unit care is given to very ill newborns of which more than 75% are hospitalized because they are born prematurely. Prematmes often suffer from organ failure sirree several functions are not yet completely developed. This is especially prominent in ventilation. More than half of the children born after a gestation age of less than 30 weeks need artificial ventilation during the first days of their lives.
Sporadic respiratory movements start to develop from approximately the 20th week and increase in frequency as gestation progresses. Only after birth a steady and continuing ventilation will occur. However if the birth is premature, the respiratory drive is likely not to be fully developed. This presents itself in periods up to 30 s in which breathing is absent. Aside from the inspiratory drive, the premature lungs are not completely equipped to allow effi.cient breathing, as alveoles are in many cases not yet developed to such an extent that efficient gas diffusion is possible. Also, because the costal ribs are still relatively flexible and the thorax-wall has a high compliance, when costal musdes are not actively employed to maintain the chest shape, the chest is sucked in during inspiration and respiratory efficiency is significantly decreased.
As the above emphasizes, respiration monit<?ring and assistance is a vital element in neonatal and especially premature care. It is therefore not surprising, that in the course of time, different methods of monitoring have been developed and refined, and still are subject of interest. Commonly used forms of breath monitoring are flow, abdominal stretch, lung impedance and muscle-activity measurement. The latter is the subject of study in this report as it has some charaderistic properties that are different from other methods.
The methods of respiration monitoring can be divided into two categories, invasive and non-invasive. Often used invasive measurements are airflow and pressure measurements. Generally both are dorre using a tube and an external transducer. Non-invasive methods to monitor respiration use either abdominal movement or chest expansion as a measure of respiration. In many occasions, abdominal movement is measured with a Graseby capsule, a device that measures abdominal stretching. This system yields pneumatic signals gen-
3

erated by the deformation of a foam-filled capsule taped to the abdomen of the neonate. The pneumatic signal is then registered and converted to a electrical signal by a pressure transducer. The most common technique measuring chest expansion relies on the change of the electrical chest impedance with the chest volume.
Although the mentioned methods are commonly used, they suffer from a drawback: all are derivatives of the actual muscular respiration activity. During inspiration, neuromator activity is translated into muscle fibre (mainly diaphragmatic and intercostal) activity which results in chest expansion, pressure decrease, and finally airflow. Each of these biologica! indicators of breath is delayed relative to the previous. This response time is of particular interest when consiclering assisted ventilation. It is interesting to consider the muscle activity signal as verification of successful assisted ventilation, or even to regulate ventilation with it. The activity of the muscle can be measured through their electrical properties as each contraction is initiated by electrical stimuli. The method of measuring electrical muscle potentials is named electromyography (EMG). The most common place to measure activity of the respiratory system is at the position of the diaphragm (EMGdi)· The mechanics and physiology governing the breathing process are further explored in chapter 2.
EMG measurements do not suffer from some artifacts troubling classica! methods of detection. For example, (in invasive measuring) the compliance of the tubes used can have a significant influence on the response function (amplitude, delay and duration) of the pressure and flow. The compliance of the tubes as well as the lungs, the influence of a ventilator, an obstruction of the airways will have influence on the breathing activity found. This does not mean that EMG signalis artifact-free. Instead, the EMG respiratory signal is subject to several strong forms of distortion.
• Electrode artifacts:
Thermal excitation causes ions to leave the metal lattice into the electrolyte until a balance between thermal expulsion and electrical attraction is reached. The generated potential called the 'electrode bias', is constant when the electrode is motionless. If the electrode shifts, a bias variation is picked up by the amplifier.
• Muscle artifacts:
Movement of the neonate results in a large set of muscle contractions that distort or mask the EMG signal. It is observed that, in adults, the use of musdes necessary to maintain an upright position is enough to exceed and mask the respiratory EMG signal. The patient has to be in rest in order to be able to have a measurable EMGdi·
• Electrical rnains artifacts:
As with most !ow-voltage measurement devices, the system is highly susceptible to noise and hum resulting from the rnains through inductive and capacitive coupling. This is partly solved by using shielded and twisted wires and an additional reference
4

electrode. The implementation of these measures is discussed in the experimental setup in chapter 3.
• Cardiac signal artifacts:
In most cases the st rongest artifact signal is the cardiac potential, the ECG. It is reported [HER-91] to exceed the EMG signal by a factor of 50 while in this project ECG-EMG an approximate ratio of 10 was found. A typical EMGdi signal contaminated with ECG signal is shown in Fig. 1.1. The reason that the peaks do not resembie "traditional" QRS complexesis because of bandpass filtering (100-200 Hz) of the raw signal. In chapter 4 several methods to remove or reject this artifact will be discussed.
0.3 -
0 .2 -
0 .1 -> .s Ql 0.0 " :ê
I ..a. l..J .d .J .J.I 11111 ·-" u - 1 ... ..J . .L.I.d. I..JI
"'' 1''11 I"'' .,.."' ... 1'1 lf1"f I"' I··~ T"l 1111
c. E -0., <( -
-0 .2 -
-0 .3 . 0 2 4 6 8 , 0 1 2 , 4
T im e [s]
Figure 1.1: Typical combination of mixed heart and diaphragm activity.
5

Chapter 2
Physiology
2.1 Introduetion
The function of the respiratory system is to facilitate the gas exchange between the cells of the organism, the neonate, and the surrounding air. In the lungs 0 2 is supplied and C02
removed through gas exchange with the blood circulation. Due to the small diameter of the tubes of which the respiratory system consists, the ditfusion process alone is not efficient enough to refresh the gas in the lungs. An active system is needed to induce inflow and outflow of the gas. This system is the respiratory system, a combination of bones and musdes capable of increasing and decreasing the lung volume. The respiratory system can be viewed as a pump that generates gas flow into the lung via intrathoracic-abdominal volume changes. Centrally derived neuromator commands result in forces developed by the respiratory musdes of the thorax. It should be dear that the lungs themselves have no musdes capable of breathing. The little amount of musde they possess controls the diameter of the airways. In fact, the lungs are elastic and would collapse if not countered by the outward force due to the elasticity and musde activity of the chest wall. This results in an negative pressure in the intrapleural space, where the pleura visceralis and pleura parietalis are separated by an few millimeters liquid.
Actual respiration results from the combination of the thoratic skeleton and the respiratory musdes. Two prominent musde groups are active in respiratory movement; the costal musdes which elevate the chest and the diaphragm musde which functions as a piston. Both musde groups increase the lung volume during the inspiratory phase. Expiration is a passive process, resulting from the elastic properties of the chest.
Figure 2.1 shows a simplified scheme of the respiratory control system, which determines the breathing pattern. The pattem of breathing chosen relates to the amount of work required to produce a particular ventilation. This workis directly related to the force exerted by the respiratory musdes. It is observed [HER-91] that the optimal pattern of breathing is chosen to minimize the total amount of work done. This pattern of breathing is controlled by a rhythm generator in the brainstem modulated by different inputs as
6

Figure 2.1: Diagram of the respiratory control system.
chemoreceptors and mechanoreceptors. Neural activity leaves the central nervous system via the phrenic and intercostal nerves, among others, to bring about breathing by contractions of the respiratory musdes, mainly the diaphragm and intercostals. Besides this metabolic form of breathing, respiratory musdes can also be involuntary affected by higher brain center instigated by, for example, hyperthermia and emotions or even be voluntary controlled. This subject of nervous control of breathing is beyond the scope of this report and for further details about the subject [WID-91] is recommended.
2.2 Components of thorax breathing
2.2.1 thorax
The human thorax has the shape of an elliptic cone, narrow at the top and broad at the bottom. During the newborn period, a number of important ditierences from the adult have a significant influence on the respiration. For example, the bony elements are relatively soft and fiexible in the newborn, making the chest wall subject to collapse during negative pressure generation. There also is a considerable difference between the circumferential characteristics of the newborn and adult human bony thorax. As matmation and growth occur, the thorax changes from a round to a more dorsoventrally fiatted configuration.
Studies of newborns and infants demonstra te that the compliance of the respiratory system increases during the first year of life, primarily because of increases in alveolar number and an increasing lung compliance [MUR-81]. Until this time an increased tendency for chest wall collapse has been observed.
2.2.2 Intercostal musdes
A second element of the chest wall is the group of intercostal musdes. The intercostal musdes stretch between adjoining ribs. The external musdes cause two types of different motion. The first is 'pumphandle' (see Fig. 2.2, left) movement, in which the anterior end of each rib is elevated like the action of an farm pump. Because the ribs are sloping down
7

in rest, this increases the chest volume. The second form action is the 'bucket handle' movement (see Fig. 2.2, right) in which the diameter of the chest increases, each rib on either side acting like the raising of a handle of a bucket laid on its side. In addition to their effect on the gas flow, another important function of the intercostal musdes is to provide for a stabie chest wall during the inspiratory phase and limit the degree of volume reduction ('sucking in') of the thorax. The latter function is especially important with premature newborns because of its soft and flexible thoracic skeleton.
'-)Pumphandle action
line of the diaphragm at rest
Lateral view Frontview
buckethandle action
Figure 2.2: Views of the rib cage, with possible rib movements.
During REM sleep, often almost complete loss of intercostal musde activity in newborns is found. This results in a reduction in end-expiratory lung volume. Much of the sleep activity of the newborn is of the REM form and thus a significant time only the diaphragmatic activity is measured.
2.2.3 Diaphragm
This third component involved in the composition of the chest wall is the major musde in operation, and most important in the scope of this report. The adult thoracic cavity is dosed in a way that the shape resembles elliptical cylindroid capped by a 'dome' as can be seen in Fig. 2.3. If the chest is likened to a syringe with the rib-cage as its walls, the diaphragm could be considered as the plunger. The dome is formed by a musde plate consisting of cross-striated musde fibres. A part of the diaphragmatic musdes are directed parallel to the body axis and lie in direct contact with the lower rib cage forming the so-called zone of apposition. During inspiration the musde fibers shorten resulting in a eaudal flatterring of the dome and a reduction of the zone of apposition. These movements result in a increase in chest and subsequently lung volume, and thereby inspiration.
8

Figure 2.3: Diaphragm during respiration. Before inspiration ( left) and aft er inspiration (right).
An equal morphology is found in newborns, but the dome is of a fiatter configuration and has a smaller zone of apposition. This means that the diaphragm can not contract as far as a full-grown one and thus results in a diaphragm that is less effective.
2.3 Muscle structure
2.3.1 Muscle types
In order to interpret EMG signals some working knowledge about the layout of musdes is needed. A description of the morphology and physiology is therefore necessary. A muscle consists of long and small myofibrils, organized and innervated in certain manners. When a muscle fibre is innervated it will shorten and if possible, cause a displacement. Three types of muscle fibres can be differentiated:
• cross-striated muscle· fibres
• smooth muscle fibers
• cardiac muscle fibers
Skeletal muscles, like the diaphragm and costal muscles, are composed of cross-striated fibres. In the next section this type of muscle will be considered in more detail, sirree it important in understanding respiratory mechanics.
9

2.3.2 Cross-striated muscle fibres
The cross-striated muscle fibres are formed by sacroplasm in which thin contractible elements are positioned, the so-called myofibrils. The muscle fibers themselves are surrounded by a membrane. Tissue outside the muscle fibre and its membrane is called the extracellular tissue, consisting of other fibres, nerves, fat, blood and skin. The muscle fibers (the intracellular tissue with the membranes) are attached to bones by tendons.
The myofibrils in the muscle fibre, with a cross-section of approximately 1 J-Lm each, consist of 1000 to 2000 myofilaments. These myofilaments exist of thick myosin elements and thin actin elements. A contraction of a muscle is established when the myosin elements and the actin elements actively slide along each other. (Fig. 2.4 bottam). The banding occurs due to the alignment of these dark thick myofilaments in the muscle fibre.
Myofibril
I
" M-line
Musce fibre ---~\------------ - \-----------\
\ \ \ I I I . I
Nucleus
Myofibril
I
" Z-line
Thick myosin filament Thin actin filament
' _/mr::: 11! 3:::i: r::~ ~~ Figure 2.4: Schematic illustration of a muscle fibre an its components.
Bundies of muscle fibers are surrounded by connective tissue containing blood vessels and nerve fibres. The muscle as a whole is surrounded with the muscle facia, which allows easy movement of the muscle relative to other musdes and other tissue. There also is a subcutaneous layer of fat present between the muscle and the skin.
10

The activation of a muscle and its muscle cells originate in the central nervous system. The nervous system incorporates motor neurons, which each innervate a group of muscle cells. The muscle group connected to one motor neuron is called a motor unit (MU). The number of motor units innervated by a motor neuron, the innervation ratio, varies widely, from 10 up to 2000 in larger muscles. The spatial distribution of muscle fibres belonging to one motor unit are more or less randomly scattered in a circular shaped area.
A was said, a group of muscle fibres is activated by a motor neuron. This implies that these fibres will fire more or less simultaneously. The innervation generates an intracellular action potential in the muscle fibre, the single fibre action potential (SFAP). An observed signal belonging toa motor unit, called a motor unit action potential (MUAP), is in fact the sum of all potentials from the constituent fibres and shows some similarities with the SFAP.
The innervation of muscle fibres usually takes place midway the fibres at the so-called motor endplates. However, because not all muscle fibres run parallel to each other or in line with the tendons, the innervations do not occur necessarily in the middle of the muscle.
In a static situation a restpotential of 70 to 90 m V exists over the cell membrane. The potential over the cell membrane can beseen as static dipole layer. It can be shown that when measuring outside the cell, the dipole layer potential at one side of the cell membrane is negated by the mirrored dipole at the opposite side of the membrane. This results in a zero potential measured by surface electrodes. A more formal explanation is given in [T00-98]. This static model is not valid when an action potential is generated at the motor endplate: the fibre is innervated and a potential pulse is generated. This pulse at the membrane induces a traveling two action potentials propagation in both directions. Each potential can only travel in one direction, caused by the refractory period that the previously innervated fibre area suffers. Fig. 2.5 shows a propagating potential together with the reversal of the membrane polarity caused by local depolarization.
The surface now sees passing depolarization potentials (MUAP). The propagation speed of the action-potential is typically between 0.5 and 5 ms-1 . If this potential is measured monopolar a potential similar to Fig 2.5, top is found. The combined potential of the observed MUAPS, distributed temporally and spatially is seen in the electromyogram (EMG).
11

+30
Traveling action potential
-90
++++++++----++++++++ --++++------
--++++ ++++++++-- ++++++++
Figure 2.5: Mechanism of depolarization associated with a traveling action potential.
12

Chapter 3
Experimental setup
3.1 Electrodes
The electrical activities as described insection 2.3 manifest themselves at the skin as surface potentials. They can directly be measured by electrades that are conductively connected to the skin. These surface potentials are a cumulation of all electrical activity in the body, with some activity recorded much stronger than other, depending on distance to the electrode and the properties of the activity. It is extremely diffi.cult to use surface potentials to precisely describeits source, due tothefact that the body can only roughly be approximated in its surface shape and tissue conductivity. Nevertheless, surface potentials are a good indication of electrical activities and surface electrades are used in many situations to measure them. The skin is one of the conducting tissues between the muscle fibre and the recording surface electrodes. It consists of two main layers: the epidermis ('upper skin') and the dermis ('leather skin'). The epidermis consistsof a combination of dead and living cells with most dead cells on the epidermal surface. This layer is responsible for a high electrical resistance. This resistance can be decreased by cleaning the skin, chafing and using conductive gel.
If a metal is submerged in a fiuid, ions will leave the lattice as a result of thermal excitation. The same effect is seen between electrades and the conducting paste. Due to the excursion of ions into the gel a potential difference between paste and the electrode is created. This results in an increased attraction between the free ions and the electrode until a equilibrium is reached. This steady potential is called the electrode bias. The electrode bias is the major reason that the DC signal should not be amplified, as the bias can have values up to volts compared to the EMG signal of the order of millivolts. Even if DC filtering is performed, signals originating from the bias layer can still distart the EMGdi signal. The reason for this is that when an electrode moves over the skin surface, the ions in the electrolyte need some time to adjust and restare the bias balance. This means that care should betaken to securely fasten an electrode and use an electrode that is insoluble. Another effect distarting the bias layer is the current resulting from the signal poten-
13

tial. This current is equal to the amplifier input current. This effect can be countered by reducing the current density by using large electrodes and a high input-resistance amplifier.
Power line radiation is another dominant souree of noise and hum, both through inductive and capacitive coupling. lnductive coupling is often observed when electrode wires form a loop. Wire loops can easily and effectively be reduced by twisting the cables. Capacitive coupling with the rnains is due to the conductive properties of the human body, causing induced potentials over the body surface. Rejection of this artifact will be discussed section 3.2.
The electrodes used in neonatal measurements conducted in this project, are of type Agilent (HP) 13953D, and are equal to the ECG electrodes used in neonatal care. These disposable electrodes are relatively large, with a circular lead-of area of radius 10 mm and a total size with adhesive sticker of 22x22 mm. The adhesive paste also functions as a conductive gel. Before measuring the skin is cleanedusinga 70% alcohol solution but because the skin of the neonate is thin and sensitive, chafing is not performed. The electrode is made of Silver with an outer layer of Silver Chloride (Ag/ AgCl). AgCl is poorly soluble in the electrolyte and thus bias balance is reached very quickly. This minimizes motion artifacts and current distortion.
With the anatomy of the chest and some physiological aspects of muscle contraction known, possible positions of electrodes can be determined. Several points must be taken into account. Because of small potentials of the MUAP's that are only measurable at close range, measuring can only occur on muscle fibres close to the skin surface. In order to accomplish this, the musdes in the zone of apposition are measured, forthese lie well against the chest wall (Fig. 2.3). Electrodes must also be placed low enough, to assure proximity to the muscle fibers in inspiratory phase when the diaphragm is contracted.
To measure as little as possible artifacts as aresult of to movement, the electrodes should be positioned at a stabie base. This would mean placing the electrodes on the rib cage. Combining this with the prerequisite of measuring as close to the muscle fibersas possible, electrodes should be placed between, insteadof on, ribs.
The next factor that has to be considered is the distortion caused by the heart potential. As the heart as a whole can be modelled as a large dipole, larger potential differences between electrodes are picked up when the electrodes are placed within a larger spatial angle with respect to the heart's center. This effect is minimized by reducing the interelectrode distance, but this reduction is limited.
As potential differences are measured, it must be assured that electrodes are not placed so close to each other that electrodes see the same muscle, and therefore result in virtually zero potential difference. However, MUAP's decay quickly due to the dipolar character and an inter-electrode distance of 2 to 3 cm suffices.
14

Furthermore, the geometry of the chest as well as the electrades must be considered. The electrades used are relatively large. If the small chest size of neonate (less than 10 cm) is also taken into account, the combination of these considerations results in a limited number of placements. One of these is one electrode on either side of the rib cage between the lOthand llth rib in the first axillary line. The common electrode is placed on the fossa jugularis of the sternum in the midline.
3.2 Amplifier
The amplifier unit design is the most critical aspect of the electranies apparatus which will be used to obtain the signal. The fidelity of the detected and amplified EMG signal influences all subsequent treatment of the signal. It is very difficult to improve the fidelity and signal-to-noise-ratio (digitally) of the signal beyond this point. Therefore, it is important to select an amplifier that provides minimal distartion and highest signal-to-noise ratio.
In order to eliminate the potentially much greater noise signal from power line sources, a differential detecting configuration is employed. The differential amplification setup is shown schematically in Fig 3.1. The operation is simple. The signalis detected at two sites (11 , 12 ) relative to the reference (13), electranies circuitry subtracts the two signals and then amplifies the difference. As a result, any signal that is "common" to both detection sites will be removed and signals that are different at the two sites will have a "differential" that will be amplified.
L3
Monopolar: Vu=VL2-L1 Bipolar: Vu=(VL2-L3)-(VL 1-L3)
L2
EMG signal
Figure 3.1: The electrode and amplifier setup.
This method of amplification is necessary because the body is capacitance coupled to the rnains and amplifier input lines are coupled with different loads to the rnains ground. Consicier a monopolar measurement set up. When measuring monopolar, the difference in
15

potential between two electrodes, one of which corresponds to signal-ground, is measured and amplified:
(3.1)
where a is the amplification factor. The signal ground (L1 ) is, although not directly, still capacitively coupled to rnains ground whereas the signal line (L2) is not. This is schematically depicted in Fig. 3. 2, left. The capacitive coupling (of the order of pF) results in a small AC current. This induced current results in a potential difference between the amplifier signalline and ground and is amplified along with the desired EMG signal:
V:'= aV:' u 2 (3.2)
In a bipolar measurement the setup is different: in these measurements potentials at the two different positions are measured with respect to a common electrode L3 :
(3.3)
Both signal electrades have a high electrical resistance to ground. lf the signal ground, i.e. the common electrode, is placed symmetrically relative to the measuring electrodes, phase and amplitude of the rnains signal at both electrades relative to common are approximately equal, and thus removed. This explanation requires the availability of a highly accurate "subtractor". In practice, it is very diffi.cult to subtract signals perfectly. The accuracy with which the differential amplifier can subtract the signals is determined by its Common Mode Rejection Ratio (CMRR). This factor is determined by the construction of the amplifier. A perfect subtractor would have a CMRR of infinity:
V:'= a . V:' u CCMRR
2 (3.4)
The amplifier that has been chosen for measuring EMGdi activity in this report is the Myotron 222. An alternative amplifier has been tried but did not result in clear EMG signals, mainly due to filter settings that are not optimal for EMGdi acquisition. The Myotron 222 amplifier was analyzed using the Whisper EMG tester. This appliance generates a 40 Hz sinusoidal common mode signal of a 1 V and measures its the resulting effect on the output signal. A CMRR of 66 dB has been found. Although this is not as high as possible with more modern techniques, it is suffi.cient to suppress most capacitively induced electrical noises. Additionally, a set of filters can be included in order to only allow certain frequency bands to be amplified. The Myotron 222 has two filter settings: 100-200 Hz and 100-1000 Hz, both shown in appendix A.1.
3.3 Data-acquisition
In modern neonatal research it is preferabie to be able to continuously monitor and store biologica! signals. To accomplish this, a flexible acquisition network has been developed.
16

___ 1---.-___
1-.---___ 2 20 Vac
I I
I high c I high c
Figure 3.2: Simplified electrical system. Monopolar setup (left), dipolar setup (right).
During this project it was used to measure a variety of physiologic data. This so-called PINO network was designed to acquire and store multiple signals at user definable sample rates. In total of 64 analog signals can be measured simultaneously, from 14 possible beds. This is accomplished by using 4 parallel AD samplers (PARSAMs), each capable of simultaneously and continuously sampling 16 analog signals. The sampled signals are read through the databus (PhyBUS) into the acquisition station. The acquisition station buffers the digital data and writes it to a Noveli file server. A dedicated station then formats this raw data and divides it into files cantairring 3 seconds of sampled data from all present signal sourees at all beds. A general setup is shown in Fig. 3.3. The PINO system can handle analog signal from the general purpose HP Merlin 56 S monitors available at each bed as well as from other measuring devices with an analog output with a -5 to 5 V range. The Myotron amplifier is connected to such an analog input.
17

I Phybu• Hlghry ron"cllec
.- - - - - - - - -- - - - - -- - - --- -- - -- - - -- - - - - - -I
I I
Acquisition PC
I I ------------------ ------------------~
Converter bdL~ User PC
Noveli File server
Figure 3.3: The PINO Data acquisition setup.
18

Chapter 4
Signal processing
4.1 Introduetion
The measurement setup was designed to provide an optimal fidelity breathing signal. However, due to different forms of distortion, the raw muscle activity signalas acquired is not suitable for direct use as a breathing signal. The signal in its raw form does not reveal clear breathing properties.
Breath Heart beat 0.3
QRS ... 0.2 P-peak
lnspiration Expiration
0.1
> ~~.Ji! ,~ ~ 0.0
(])
1:: "'0 ::J :!::: 0.. -0.1
~ -0.2
-0.3 0.5 1.0 1.5 2.0 2.5
lime (s]
Figure 4.1: EMG signal with cardiac activity after low-pass filtering.
The signal consists of two main contributions: the cardiac and the diaphragmatic signal. Both are present in Fig. 4.1. The breath is indicated by an envelope around the signal region showing activity consisting of polarization potentials generated by a set of
19

repetitively fired action potentials. The exact moment of transition from inspiration to expiration is hard to determine because muscle tension is gradually decreased during expiration. Because of the short distance between the heart and the neonate's diaphragm, the measured MUAP's of the diaphragm are obscured by the individual heart contractions. The ECG component signal, the cardiac activity, is seen as a set of large peaks. It differs significantly from the standard ECG form because of the high-pass filtering that has taken place. The smaller bump in front of the large peaks is the P-peak resulting from depolarization of the atrium. The larger signal activity, the QRS peaks, are a combination of depolarization and repolarization of the ventricles.
Some signal properties are listed in the table 4.1.
EMGdi ECG frequency (min -l) 45 140 duration ( ms) 600 -1500 250 PQRS
100 QRS Amplitude (m V) 0.03 0.26
Table 4.1: Typical EMGdi and ECG properties of a neonate
As can be calculated from the frequency and duration, the PQRS complex covers about 50 % of the signal. The goal of this chapter is to find a processing algorithm capable of sufficiently reducing the effects of these relatively large ECG distortions and enhancing the breathing components, without sacrificing essential elements of the latter signal. Even with a signal of high-fidelity and an optimal signal-to-noise ratio, electrical artifacts are still of such magnitude, especially those originating form heart contractions, that digital filtering is considered necessary.
The signal is already available in a sampled form. The PINO PARSAMs sample the signal at even intervals in time. Let ~ denote the time interval between two consecutive samples so that the sequence of sampled values is
xi =x( i~), i= ... - 2, -1, 0, 1, 2 ... (4.1)
The inverse of the time interval is called the sampling rate. Because the AD samplers are settoa sampling rate of 512Hz, the interval time~ is approximately 2. The generic form of a filter transformation x ----+ y is given by
(4.2)
Three fundamentally different forms of filtering will be discussed: signal removal in the frequency domain, signal subtraction in the time domain and signal removal in the time domain.
20

4.2 Frequency filtering
If the cardiac activity would be found completely in another frequency range than the diaphragmatic activity, a bandpass filter could be used to successfully remave all cardiac artifacts. This option will be reviewed in this section.
First some basic properties of Fourier transformation will be discussed. A physical process can bedescribed either in the time domain, by the values of some quantity h as a function of time h(t) or else in the frequency domain where the process is specified by giving its amplitude H as a function of frequency j, H(f). Discrete transformabons between the two are:
N-1
Hn = 2::: hke2Irikn/N k=O
N-1
hk = ~ 2::: Hne-2Irikn/N (4.3) n=O
In our setup the signal, function h(tk), is sampled at evenly spaeed intervals in time. Let D. denote the time interval between consecutive samples, so that the sequence of sampled values is
h(tk), tk = kD., k = 0, ... N- 1
H(fn), fn=(;;~), n=-~, ... ,0, ... ,~ (4.4)
(4.5)
The inverse of the time interval is called the sampling rate. For any sampling interval D., there is also a special frequency fc called the Nyquist critical frequency, given by:
1 Je= 2D. (4.6)
This means that critical sampling of a sine wave is two sample points per cycle. The Nyquist critical frequency has two important consequences:
1. If the sampled signalis indeed limited to the frequency fc, H(f > fc) = 0, the signal is completely and determined by its samples Hn. This means that h(t) is uniquely and completely described the coefficients Hn·
2. If the signal that is sampled, has higher frequency components that the critical Nyquist frequency fc the energy outside of the band-width limited range is distributed over the spectrum- fc < f < fc· This effect is called aliasing.
Practically, this means that the sampling rate must be high enough to twice encompass all frequencies in which power is present. With a maximal sampling rate of the PARSAMs
21

of 512 Hz used, the signal should not contain speetral energy above 256 Hz. This is why the 200Hz low-pass filter of the Myotron 222 was employed, see Fig. A.l. This is a valid filter setting as most energy is contained in frequencies under 200 Hz [LEV-86].
Additionally, a high-pass filter has been used for two reasons. The first is to reduce sporadic motion artifacts, which usually contain much power at the lower frequencies. The second, more important reason is to reduce the cardiac power contained at the lower frequencies [LEV-86]. This was indeed observed by using a Neuropack amplifier in ECG mode that only suppresses the DC component. The ECG component swamped the signal in such a way that no EMG signal could be observed.
Although necessary, this filtering has a disadvantage. The shape of the cardiac signal is distorted. This effect is shown in Fig. 4.2. A cardiac signal is filtered with a 100 to 200 Hz bandpass-filter. A large part of the power is removed (amplitude is 13% of the original signal) and the shape is significantly different from the original.
> E Q) "0
:ê a. E <(
-ECGsignal - bandpass filtered (1 00·200 Hz)
1.8
0.9
0.0 il.. .. rl.
V v \(
·0.9t-----...---.-----r-----.---..----+----.------, 6.00 6.25 6.50
Time [s]
6.75 7.00
Figure 4.2: ECG signal unfiltered and filtered.
In the remairring frequency domain, 100-200 Hz the cardiac peak amplitude is still an order of magnitude larger that the diaphragmatic amplitude. In Fig. 4.3 the energy of 4 pure breaths and 4 pure heart beats have been averaged. At every frequency the ECG
22

amplitude exceeds the EMG amplitude. From this it can be concluded that complete ECG filtering is not possible in the frequency domain.
1E-4
···················· averaged EMGdi spectrum
averaged ECG spectrum
1 E-7 +-..:.,..--r--r---r---r-~--.---r----.----,---r---.----.----,-.-100 120 140 160 180 200 220 240
Freq [Hz]
Figure 4.3: Power spectrum of EMGdi and ECG components compared.
4.3 R-peak detection
It is vital for most ECG rejection methods to know where the ECG complexes are positioned in the signal, in order to be able to remove them. Several methods are indicated in the literature, ranging from finding an intersection of two shifted QRS complexes to fitting a generalized ECG complex using cross correlation. The algorithm that has been used is the so-called length transformation technique, as described in [T00-98]. In this method the original sampled signal Xn is transformed using equation 4. 7.
N-1
Ln = L lxn+i+l- Xn+il i=O
(4.7)
The transfarm L can be considered as an averaged absolute variation of the signal in a window of N samples. A typical length transform of a neonatal ECG signal is shown in Fig. 4.4 left. The peaks that are created by the rising and falling slopes are now detected. This is dorre by first determining the minimaland maximal value of Landthen searching for all intersections of the signal with the threshold T · (Lmax- Lmin) + Lmin· The absolute signal maximum between the upward and downward slope of each peak is now determined. Reeall that the detection is dorre using the L signal, and the peak in the original signal does
23
not necessarily have to coincide completely with the peak in the length signal. Therefore, the peak position that was found is now used asthestarting point for finding the R-peak in the original signal. The precise position of each individual peak is further refined by employing an parabolic fit to the original signal. The curve fitting routine will fit the local maximum dosest to the peak in the transformed signal.
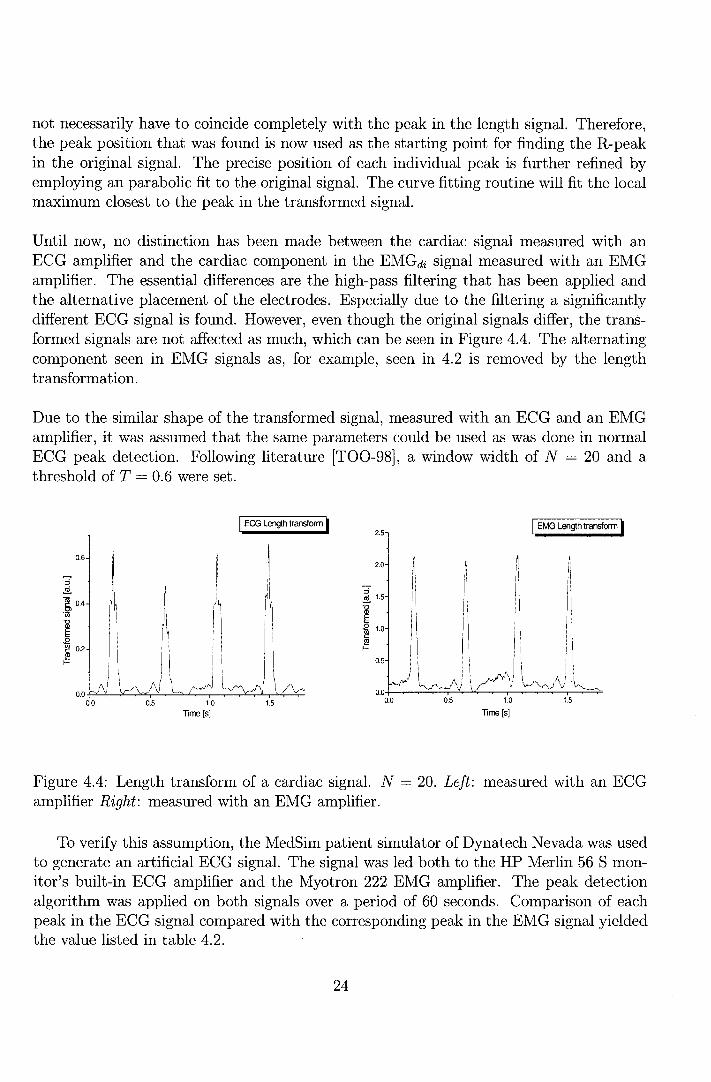
Until now, no distinction has been made between the cardiac signal measured with an ECG amplifier and the cardiac component in the EMGdi signal measured with an EMG amplifier. The essential differences are the high-pass filtering that has been applied and the alternative placement of the electrodes. Especially due to the filtering a significantly different ECG signal is found. However, even though the original signals differ, the transformed signals are not affected as much, which can beseen in Figure 4.4. The alternating component seen in EMG signals as, for example, seen in 4.2 is removed by the length transformation.
Due to the similar shape of the transformed signal, measured with an ECG and an EMG amplifier, it was assumed that the same parameters could be used as was clone in normal ECG peak detection. Following liter at ure [T00-98], a window width of N = 20 and a threshold of T = 0.6 were set.
::i ~
0.6
~ 0.4
1ii
1 ~ 0.2
~
!\i 0.0 ---J ...;
0.0 0.5 1.0
Time [s]
I ECG Length transferm I
1.5
2.5
2.0
::i ~ 1.5
1 '"@ 1.0
~ 0.5
0.5
I i
1.0
Time [s]
I EMG Length transferm I
1.5
Figure 4.4: Length transform of a cardiac signal. N = 20. Left: measured with an ECG amplifier Right: measured with an EMG amplifier.
To verify this assumption, the MedSim patient simulator of Dynatech Nevada was used to generate an artificial ECG signal. The signal was led both to the HP Merlin 56 S monitor's built-in ECG amplifier and the Myotron 222 EMG amplifier. The peak detection algorithm was applied on both signals over a period of 60 seconds. Comparison of each peak in the ECG signal compared with the corresponding peak in the EMG signal yielded the value listed in table 4.2.
24

difference ECG - EMG std. dev. R-peak 254 ms 7 ms block edge 248 ms 2 ms
Table 4.2: Signal response and R-peak times in the EMG and ECG amplifiers compared
The delay between the peaks in both signals can largely be attributed to delays in the signal processing parts of the ECG monitor. This was seen by generating a test signal consisting of several voltage steps. The occurrences of the step-up and step-down edges in the EMG-amplified signal were compared to those in the ECG-amplified signal. The difference found is also listed in table 4.2.
The larger standard deviation in R peak detection with the EMG amplifier has occurred during the last stage of the peak detection algorithm by the curve fitting, because the routine fitted a local maximum of one of the peaks in the QRS complex of the EMGdi signal. This inevitably results in a small error sirree none of these local peaks exactly correspond with the original R-peak in the ECG.
4.4 Subtraction
It is clear that frequency filtering alone is not enough. Additionally, one can also try to remove the artifacts in the time domain. One method to do this is to subtract the ECG components from the EMGdi signal. This is only possible if the exact shape and position of the cardiac components are known. The locating of the QRS complexes is dorre employing the R-peak detection algorithm described insection 4.3. If the ECG shape and the position of the R-peak within the shape are known, the position of each part of the ECG complex is defined.
The next step is determining the QRS complex in the mixture of ECG and EMG data. Separation is dorre on the basis of signal properties: it is assumed that the EMG component is purely stochastic and the PQRS complexes are purely statie. If this is true averaging successive PQRS complexes will retain the ECG complex while canceling out the EMG components. The first step of the algorithm involves the formation of an ECG template from a set of complexes. The ECG complexes are first identified by their individual R peak. The region between 150 ms before and 100 ms after the R-peak is used for the template construction, which includes the P, Q, R and S components. When a set of QRS complexes is isolated, the wavefarms are aligned using cross correlation to obtain an optimal overlap.
25

> .s
0.3
0.2
0.1
~ 0.0
.è c.. ~ -0.1
-0.2
-0.3 0.0
i.ll\1 11 .• . ,.,. ·r·
0.5
...... ~.lil,l,"d. 'lll"'"'l"'ll
1.0
Time [s]
-Signa I befere substraction I
'''" ..11, '" ., .. •·r·
1.5 2.0
Figure 4.5: EMGdi / ECG signal before subtraction.
This is dorre by varying n until Zn, given by 4.8 is maximal:
iR
Zn = L (xi · Yi+n) (4.8)
with iL = 50 and iR = 50 as the lower and upper boundary of the correlation. In this equation x is the 1 st sampled QRS complex and y the QRS area to be aligned. Next, the complexes are averaged into a general ECG template (see Fig. 4.6). As said, if the PQRS complex is taken to be stationary in time, this procedure should result in a relatively pure ECG complex due to the semi-stochastic nature of EMG signal; the EMGdi components in the ECG complex are reduced by approximately Jn after averaging n complexes. This ECG template is then again aligned with each individual QRS complex through cross correlation. After subtracting the template, the remairring signal should be cleared from QRS complexes
The algorithm was tested with the signal data acquired with the Myotron 222 EMG amplifier. A set of 4 successive ECG complexes are aligned and averaged to produce a template. In Fig. 4.6, it can be seen that the peaks in ECG complexes as present in 4.5 are not all of the same size compared with the conesponding peaks in the other complexes; peak amplitude variations up to 25% are seen. The ECG template is then aligned with each individual QRS complex and combined to forma subtraction signalas shown in Fig. 4.7. Subtracting this signal from the original signal (Fig. 4.5), results in the signal in Fig. 4.8.
26

> .s
0.3
0.2
0.1
Q) 0.0 '0
:ê c. ~ -0.1
-0.2
Aligned and averaged ECG complexes ················· ECG 1 to 4 --Averaged
-0.3 +---r-----r---,.----,--,....--.-'---r----r-----r-----, 0.00 0.05 0.10 0.15 0.20 0.25
Time [s]
Figure 4.6: Averaged ECG complex_
--substraction signa!
0.3
0.2
0.1
> .s ,,, Jl,, Jl,, Jl' '"' Ql 0.0 "'C
.... . ... . ... :ê 0.. E -0.1 <(
-0.2
-0.3 0.0 0.5 1.0 1.5
Time [s]
Figure 4. 7: Substraction signal.
27
I
2.0

Because of the steep falling and rising slopes of the alternating signal any displacement of two peaks will result in a new peak after subtraction. This is clearly seen in Fig. 4.8. New peaks have arisen, slightly displaced (up to 13 ms) relative to the original peaks and 30% slightly smaller.
> .s
0.3
0.2
0.1
.gJ 0.0
g 0..
~ ·0.1
·0.2
·0.3 0.0
,.!lil. .• 1. '1''1''1
.,. ·w
0.5
,,l,uiulllJ, "' "'1"11
1.0
Time [s]
·'"' ·n·
- Signal alter substraction J
.. I.,, .J. "~' 11'
1.5 2.0
Figure 4.8: Signal after subtraction.
The same variations in the ECG signal have been observed in all of the signals from differing subjects. It can not be expected that the ECG complex remains of equal shape, even in an unfiltered form, because during breathing the piston function of the diaphragm, causes a displacement of the heart, up to approximately 70% of the diaphragm movement. This methad will therefore not be pursued further.
4.5 Gating
Another way of filtering in the time domain is by artifact rejection. This approach to removing the ECG complexes entails the remaval of the part of the EMG cantairring the QRS segment of the ECG. This technique is termed "gating" and at the present time it is the most widely used methad of dealing with ECG contamination of EMGai· By employing gating all of the cardiac artifact is removed while all information contained in the pure diaphragm section is contained. The simplest methad is to use a gating scheme as depicted in figure 4.9. This scheme consistsof several blocks:
28

R-peak One shot detector 100 ms
0 0 a
___. Input signal Q_
"' <ä"
" !!!.
Delay-line 1 ~te
output
40 ms ~
2
Zero padding
Figure 4.9: Schematic picture of the gating scheme.
• The R-peak detector block determines whether the current sample is an R-peak. lf so, the output sample is set to a high level.
• The one-shot block will generatea high signal with a duration of 100 ms (51 samples) after it has received a low to high transition input. During this time the input is ignored.
• The delay line stores every input sample for 40 ms and then sets it as output signal.
• The gating block is controlled by the signal arriving from the one-shot block: if it is low, signals from input 1 are passed to the output; if the control signal is high, signals from input 2 are passed through.
• The zero padding block outputs a zero signal.
All blocks, except for the peak detector have been implemented as real-time components. That is, the delay-block has been implemented as a FIFO buffer while the one shot-block and gating-switch react instantaneously. It should be noted that the R-peak detector as described in 4.3 was not designed for real-time use. This is why for a region of interest the R-peak firing is preprocessed. lf a complete real-time implementation of the gating and averaging scheme is considered necessary a new R-peak algorithm should be defined. In areal-time setup this would result in an additional delay of 40 ms of the complete signal.
29

The scheme has been applied to a dataset, with the result depicted in Figure 4.10. Removing the ECG peaks and sealing to the maximum amplitude results in a clearer EMGdi signal in which breaths can be seen but at the sametime the gating scheme can obscure the actual start and end of breaths if these points coincide with a QRS complex. An additional problem is that if the zero padded region falls within a breath it can easily be misinterpreted as the low activity between two breaths.
0 0 4
> .s " "Cl
0 . 0 0
~ c_ E <(
. 0 0 4
1 0 1 2
T im e [sI
Figure 4.10: Schematic gated EMGdi signal.
As the heart rate increases, greater portions of the inspiratory EMGdi must be eliminated. Therefore, at high heart rates little uncontaminated EMG data will be available for analysis. Because of the relatively large contaminated part of the signal due to the relatively high frequency of the newborn heartbeat it was decided not to gate the P-peak out. In most cases the diaphragmatic activity supersedes the activity caused by atrium depolarization. The QRS is gated by padding the signal between 40 ms befare and 60 ms after the R-peak with zero values.
This methad will suffice if frequency components are of interest and the remaval of approximately 20% of the signal causes no problems. The gating scheme should not be used if the signal is intended as a monitor signal similar to the flow or Graseby signal.
The scheme can simply be described with the following filter function:
(4.9)
with
Zn Xn, if Xn ~ ECG
Zn 0, if Xn E EG G
30

4.6 Gating and averaging
A slightly more sophisticated method is gating and averaging. This filtering method is frequently applied in the literature [OBR-87], [SPI-98]. Insteadof zero-padded, the interval with cardiac activity is filled with the previously averaged signal. The gating & averaging method is basically an extension of the gating method based on the rejection of ECG contaminated signal regions. This extended scheme differs in that it generates new data to fill the gated region. This method has also been implemented in a way that allows for easy modification to a completereal-time scheme, as depicted in Fig. 4.11.
R-peak --->
One shot detector 100 ms
0 0 3.
Input signal Q_
"' cö" :J !!!.
Delay-line ._1, Gate f-> RMS-Circuit output
40 ms __..-
~ 200 ms
2
Figure 4.11: Schematic picture of the gating and averaging scheme.
The scheme consists of several blocks, most of which have already been explained in section 4.5. The RMS block applies a root means square average over a signal region of 200 ms (102 samples). Again all blocks, except for the peak detector, have been implemented as real-time components. Like the delay-block the RMS-block has been implemented as a FIFO buffer.
The EMG signal is duplicated and led to respectively the ( 40 ms) delay line and the R-peak detector. If no peak is detected no signal is given to the gating switch. If an R-peak is detected a signalof 200 ms duration time is send to the switch. How the signal that passes through the delay-line is handled depends on the gating switch position.
• If nocontrol signalis given from the R-peak detector, the signalis passed to the 200 ms RMS block. This results in an approximate envelope of the original signal.
• If a control signal is given, the signal is rejected and instead the output signal of the RMS block is reused as input. During the complete period of the R-peak signal each original sample is replaced by an RMS averaged sample.
31

This methad can also be presented in the form of an equation :
1 ( N ) ~ Yi = -N-+-1 ~ zl-n (4.10)
with
Zn Xn, if X ~ ECG
Zn Yn-1 1 if XE ECG
In figure 4.12 to 4.13 this process is demonstrated on the dataset that has already been depicted in Fig. 1.1.
First R-peaks in the signal are detected, thus determining which regions will be filled. These regions are shown as zero-padded areasin Fig. 4.12. The processed signal has now
0 . 0 4 -
I~ I~ I.~~ 1111. ~·~~ ,1,, lil. 1~11 I~ lil
I~ IF 1r ~Ir ~rr lf ,,. I~IT I" 1r
• 0 0 4 -
1 0 12 1 4
T im e [sI
Figure 4.12: Gated EMG signal.
been now calculated and is seen in Fig. 4.13.
Due to the smoothing action of the RMS filter, high frequencies are removed and their power is transferred to lower frequencies, into the range of the breathing frequency, of approximately 0.5 Hz. This renders the methad unsuitable to be used in conjunction with frequency analysis. A comparison with other signals will be made in chapter 6.
Because parts of the data are generated in an artificial manner, artifacts can arise. lf an ECG complex is detected during the beginning of an inspiration the gated region is filled with previous signal in which no inspiration activity is present. This can result in a significant delay in breath start. Equally, the opposite can occur. If an ECG complex is detected during the end of the expiratory phase, due to reusing the previous signal, the expiratory phase can appear langer than it is in reality.
32

0.1 0
0 . 0 8
:i 0. 0 6
~ "' "0 :J
·" 0 . 0 4 ä. E ...:
0 . 0 2
0 . 0 0
10 11 12 13 14 15
T im e [sI
Figure 4.13: Gated and averaged signal.
Another artifact that is often seen, is the generation of smaller, local peaks. These are in many cases found to coincide with the extra activity caused by the non-gated P-peaks. The gated area after the P-peak can amplify this effect because of its trend following tendency. This could be solved by gating the PQRS complex instead of the QRS, but this approximately doubled gating region would result in even larger areas of reused data, and with that, the artifacts this brings.
4. 7 Breath start detection
An interesting use of the EMGdi breath signal is breath start detection. If the start can be measured precisely enough, the data can be used to verify the administered ventilation. The EMGdi signal is already used in a similar fashion but manually. The beginning of breaths are determined with the eye and compared to trigger signals acquired from the ventilation equipment. It is of interest if the same can be done using computer algorithms. The method of gating and averaging can be used to handle such a task.
.....
i
1. Original 2. Gating & 3. Signal ~
4. minimum signal averaging smoothing detection
!. •••.....•.........
Figure 4.14: Signal analysis scheme.
A scheme implementing this is seen in Fig. 4.14. The breath starts are found by looking at the minima in the RMS averaged signal. This done by fi.rst smoothing this signal in order to remove bumps. If this is would not be done multiple local minima remain that
33

can be falsely interpreted as minima conesponding with low breath activity.
To obtain an acceptable result it is preferabie to use a more advanced smoothing technique. We will use a second order polynomial approximation of the signal called a Savitzky-Golay filter:
nR
L (Ba+ B1n1 + B2n2)xi+n (4.11)
(4.12)
This smoothing algorithm is described in more detail in Appendix B; the gated and averaged data as seen in Fig. 4.13 is smoothed to the signal seen in Fig. 4.15. The smoothing
0 1 0
0 .0 8
o .as 0
"' :è c. ~ 0 .0 4
0 .0 2
0 .0 0 7 8 10 11 12 13 14 15
T im e [sI
Figure 4.15: Smoothed signal.
removes most local minima not conesponding to a start or end of respiration. In this signal minima are found in the following manner.
In the signal the minimum and maximum values are sought and from which a threshold value is determined by T · Umax- fmin) + fmin with T = 0.5. The position at which the signal rises above this threshold is temporarily assumed to be a breath start. Now a falling signal slope is sought after a blanking period of 100 ms. This blanking period has been implemented to assure that a possible local peak near the detected breath start is not interpreted as a breath end. lf after this period the signal crosses the threshold value this is assumed to be the breath end. lf this point is not found within 1.5 s of the breath start both breath start and -end are discarded. The breath start and -end are finally both optimized by finding a minimum left and right of these points, respectively.
The next breath is detected in the same manner but with as starting point the previously detected breath end, in case of a successfully found breath start and -end. lf no breath end was found in the 1.5 s region that has been examined, breath start searching
34

begins from the end of this region. The found minima are seen in Fig. 4.16 where they are placed in the gated and averaged signal. The open markers represent the starting points of inspiration that have been found and the closed markers represent the end of expiration.
Figure 4.16: Algorithm detected breathstarts and ends.
The minima in the gated and averaged signal that have been found should coincide with minima in the unprocessed signal and thus with minima in muscle activity. Of course this is not exactly correct, but it is assumed to be a reasonable approximation. This will be tested further in Chapter 6. The detected breath starts could be further refined by finding the local minima in the unprocessed signal, near the points found in the gated and averaged reg10n.
35

Chapter 5
Software implementation
5.1 Considerations
To easily review the effects of the various processing algorithms a simple way to graphically view data was needed. lf EMGdi processing methods proveto be useful, an implementation applicable in a clinical situation would be logica!. Taking this into account, development in a mathematica! environment such as Matlab or Mathematica was not desirable. One approach considered was to implement the algorithms in the existing MS-DOS based viewing program waveview which is currently used as the standard wave-data viewer. However, in the course of this project, the data acquisition system as well as the workstations were migrated from Noveli DOS to Windows NT for several reasons:
• Upgrade possibility. MS-DOS is not capable of handling large disks due to the 16 bits architecture. Because of the need to keep most of the acquisitioned data, the demands on staragespace are steadily increasing. The harddiskspace is 2 GB. This is little when consiclering the acquisition parameters: 2 (bytes/sample)· 512 (Hz)· 60 (seconds) · 60 (minutes) results in a datastream of 3.5 MB/hour /signal. lf a large but realistic acquisition session of 1 day and 6 signals is considered a dataset of 500 MB is generated. At this rate the harddisk would be filled within only a few sessions. In an MS-DOS based environment the maximal disk size would be 4 GB.
• Year 2000 compliance. The workstations were not completely year 2000 compliant and had to be replaced. The new personal computers are powerful enough to operate Windows NT.
• Compatibility. Upgrading to Windows NT made it easy to communicate with the other network segments.
These considerations aided in the decision to migrate to Windows NT. At the mean time, to facilitate the transition to a complete wave-data viewer under the new OS, a viewing framework was developed. Because of its ease of use and availability Delphi was chosen as the preferred tooi to develop the viewer application. A subset of the capabilities of
36

the DOS-based viewer have been implemented during this project, such as: signal panning, zooming and selecting, forms of signal processing and exporting signal data and processed signals.
5.2 Program layout
To facilitate development of a complete viewer package in the future the program was set up in a modular object oriented marmer to allow for easy extension. Reusable components have been developed as wellas a wave-data reader library. In this section the most essential modules and objects will be briefly discussed.
5.2.1 Module Waveview
This is the main module. It entails the main program and front-end. The module waveview handles user input and visual representation. It groups and implements the visual objects onto a canvas and contains:
• the dataviewer object,
• the signal and bed selector object,
• the time and duration selector object.
5.2.2 Module DataiO
This module consists of one object, TDatawave, that handles reading the wave-data from multiple consecutive files stored on the file server. This object supplies functions to
• select the starting date and time as well as the duration of wavedata read,
• determine the nature (Medical Function Code) and origin (bed number) of the sarnpled signals,
• buffer the signal data starting from a certain point in time for a given duration (maximal 120 seconds),
• exporting the signal in ASCII or other formats.
5.2.3 Module ModData
This module handles modification of data from the DataiO object by signal processing algorithms. The DataMod object includes the functions for:
• R-peak detection using the length-transform algorithm,
37
• the wavedata signal gating scheme,
• the wavedata signal gating and averaging scheme,
• breath-start detection.
5.3 Screenshot
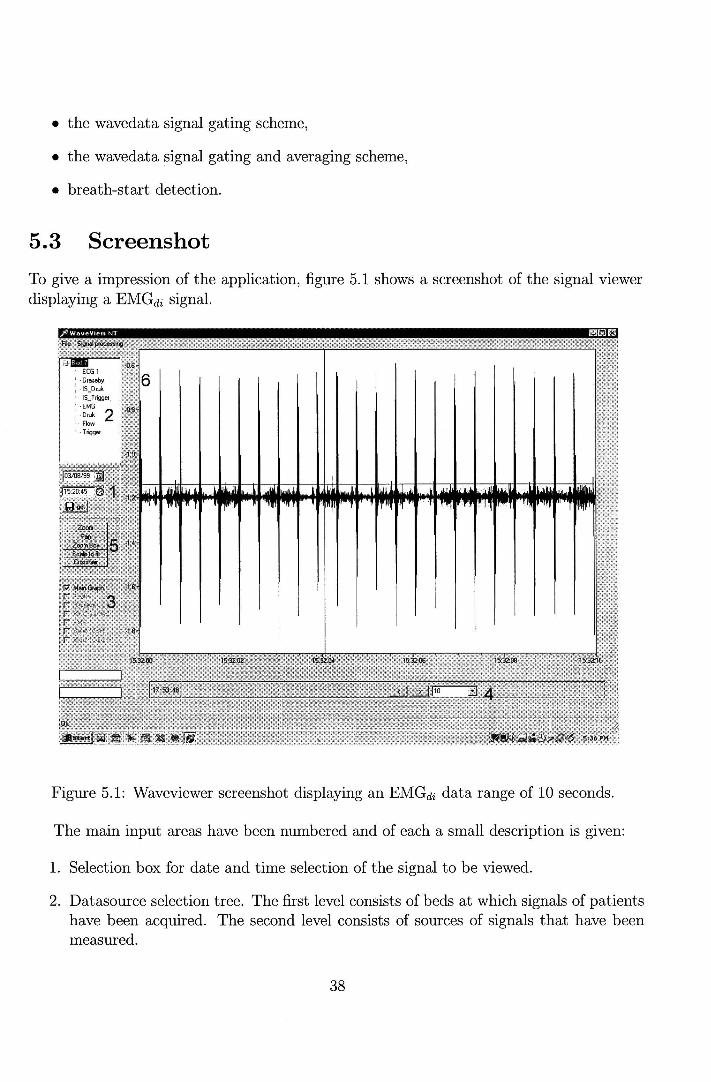
To give a impression of the application, figure 5.1 shows a screenshot of the signal viewer displayinga EMGdi signal.
Figure 5.1: Waveviewer screenshot displaying an EMGdi data range of 10 seconds.
The main input areas have been numbered and of each a small description is given:
1. Selection box for date and time selection of the signal to be viewed.
2. Datasouree selection tree. The first level consists of beds at which signals of patients have been acquired. The second level consists of sourees of signals that have been measured.
38

3. Checkboxes toselect displayed data: The original data and its transformed variants.
4. Selection of length of loaded data, forward and backward stepping buttons.
5. Buttons enabling the panning and zooming functions. These are only applicable in the loaded ciatabloek
6. Actual viewing window.
39
Chapter 6
Measurements
6.1 Comparison with conventional methods
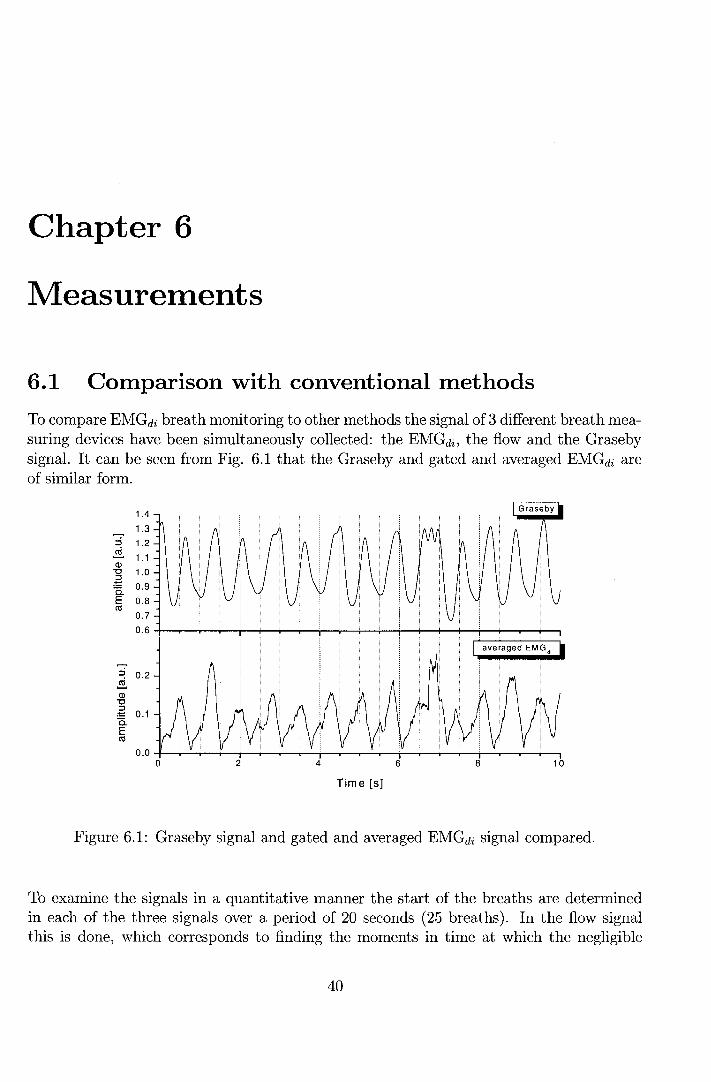
To compare EMGdi breath monitoringtoother methods the signalof 3 different breath measuring devices have been simultaneously collected: the EMGdi, the flow and the Graseby signal. It can be seen from Fig. 6.1 that the Graseby and gated and averaged EMGdi are of similar form.
1.4
1.3 ::s 1.2 ~ 1.1 Ql "0 1.0 .-È 0.9 a. E 0.8 ctS
0.7
0.6
~ 0.2 ~ Ql "0
.-ê 0.1 a. E ctS
0.04-~~-4--r-+-~~-r~~~r-T-~~~_,--r-~4-~ 0 2 4 6 8 10
Time [s]
Figure 6.1: Graseby signal and gated and averaged EMGdi signal compared.
To examine the signals in a quantitative manner the start of the breaths are determined in each of the three signals over a period of 20 seconds ( 25 breaths). In the flow signal this is dorre, which corresponds to finding the moments in time at which the negligible
40

flow becomes positive (inflow). In the Graseby signal, which closely resembles a sinusoid signal, the minima are found. These correspond with minimal chest stretching and thus lung volume.
Ui' .s Q)
E i=
400 ..,----------------1 • manual dateetion in raw EMGdi o manual dateetion in Graseby ó .._ _________ _.
0
·400
• • • • •
D~oooCJiio
0
•
0
0
•
·800 +---.--~--,---...,....---,----.---.---..---.-----, 0 5 10
Time [s]
15 20
Figure 6.2: Signal delays of different breath signals: Graseby, EMGdi·
Because flow measurement is the most commonly used method of breath monitoring this signal is used as a reference. For each of the detected breath starts in both the Graseby and unprocessed EMGdi signal the delay with respect to the corresponding minimum in the flowsignalis calculated, see Fig. 6.2. The obtained values are plotted versus the absolute time of the occurrence in the flow signal. Negative values indicate a breath start prior to the start of inflow.
The properties of the detected breaths are summarized in table 6.1:
Detection method Delay [ms] Sd. [ms] Graseby -80 120 Unprocessed EMGdi -80 120
Table 6.1: Comparison of breath starts in different signals
The order in which breaths were found was expected on the basis of physiology. Muscle contractions (EMGdi) result in an increase inchest volume (Graseby) which induces a
41

negative pressure in the lungs causing air to flow in. Both the movement of muscle activity and chest expansion where indeed found befare the flow signal but no significant detection time difference was found between Graseby and EMGdi signal. However both signals lie within one standard deviation of the breath start moment found in flow. This deviation is large, especially when a typical breath duration of 600 ms is considered. Furthermore, it should be noted that the measured points are not quite distributed normally. However, the calculated standard deviations can still be used as a measure of the spread.
N ext, the differences between breath start and -end detection methods are examined. The positions in the gated and averaged signal are compared with the delays measured in the raw EMGdi signal. Also, it is tested how accurate automatic detection with the algorithm described in section 4. 7 is by comparison with manual detection. The results are shown in Fig. 6.3, again relative to the flow minima.
7ii" É. (])
E i=
• manual dateetion in raw EMG,, 400..,---------------1 0 manual dateetion in transformed EMG•
t> automatic dateetion in tranformed EMG,,
0
• • •
·o
·400
•
·800 +---,-----,--r---...,---,-----,--r-------, 0 5 10
Time [s]
15 20
Figure 6.3: Signal delays of different forms of EMGdi signal, original, gated & averaged, manually detected and automatically detected.
The properties of the detected breaths are summarized in table 6.2:
An unexpected result is that manually detected breaths are found at an earlier moment in the gated and averaged signal than in the raw signal. This was not expected as the a ver a ging scheme generates an additional delay in the signal. However, the breath start moment stilllies within 1 standard deviation of the raw EMGdi· Due toa certain latency in the minimum detection algorithm, the automatically detected breath start was, in general,
42

Detection method Delay [ms] Sd. [ms] unprocessed EMGdi -80 120 G&A EMGdi (manually) -170 90 G & A EMGdi (automatically) -90 160
Table 6.2: Comparison of breath starts in EMGdi measurements using different methods
later than the manually obtained one and with a significantly larger standard deviation of 160 ms.
In fact, all standard deviations are large compared to ventilation trigger delays (the delay between inspiration and triggering of assisted ventilation) which should occur within 100 ms. It could be questioned if flow should be considered the reference signal. In any case, it is clear from 6.3 that automatically found breath starts do not successfully coincide with manually found breath starts in the unprocessed EMGdi· This suggests that the search should be refined in the unprocessed EMGdi signal.
Because 6 of the breaths detected in flow signal (and the unprocessed EMGdi signal) where not seen in the gated and averaged signal the question now rises how high the ratio of detected breaths is.
6.2 Signal quality
In order to be able to determine how high the ratio of detected breaths is, the algorithm has been tested on 3 randomly chosen subjects over a period of 11 minutes.
The EMG signal regions of 10 seconds are individually examined. lf almost every visually detected breath within this region is also detected by the algorithm (typically from 8 out of 10), a score of 100% is given. lf approximately half of the breaths are detected (typically 4 to 6) a score is given of 50%. Otherwise the region scores 0%. It should be noted that both regions in which so little activity is found that no breaths are detected, and regions in which so much activity is found that false breaths are detected score 0%.
Subject 1 had a clear strong (high amplitude) EMGdi signal, but the signal was regulady distorted by electrical activity caused by movement of the subject, see Fig. 6.4. This was especially prominent in two time intervals: 0-50 s and 210-270 s.
The diaphragmatic signal of subject 2 was weak and at some points non-existent, see Fig. 6.5. This can be the result of misplaced or not properly attached electrodes. This hypothesis is supported by the occurrence of potential-jumps, similar to those seen as a result of bias artifacts. Another possible reason is that the subjects respiration was mainly handled by costal muscle contractions. The relatively long low-quality period from 170 to
43

0 100 200 300 400
Time [s]
Figure 6.4: EMG signal quality of subject 1.
230 s was due to movement artifacts. In the EMGdi signal ofthe third subjectastrong diaphragmatic component was found, see 6.6. The disturbances leading to failure to detect breaths automatically found were mainly due to motion artifacts. In the period 400 to 420 s a bias artifact was observed.
Ofthe complete evaluated range of 11 minutes an averaged signal quality was calculated as listed in table 6.3:
Subject Recognized breaths 1 60% 2 45% 3 70%
Table 6.3: Amount of recognized breaths using EMGdi measurement and automatic detection
With only 45% to 70% of the breaths found, the use of EMGdi signals to monitor breathing at this point is questionable. To improve this score a more sophisticated algorithm should be implemented that is better equipped to handle distorted breath signals. It should be noted that even visually, a number of breaths were hardly discernible. It is therefore likely that also with better detection methods not all breaths will be accurately detected.
44

suitable lor breath recognition 45%
100
~ 3..... c 0
u 2 Q)
50 "0
0 ~ (ij :::> a
0 0 100 200 300 400 500 600
Time [s]
Figure 6.5: EMG signal quality of subject 2.
100
~ ~ c 0
u (J) 50 Ci5 "0
0 -~ (ij :::> a
0 0 100 200 300 400 500 600
Time [s]
Figure 6.6: EMG signal quality of subject 3.
45

Chapter 7
Conclusions and recommendations
The subject of this report has been an exploratory project todetermine the usability of the diaphragm EMGdi signal. EMGdi analysis is not a commonly used form of breath monitoring, particularly in child and neonatal care, while it can have significant advantages over more conventional methods. As muscular contractions occur before other measurable effects, faster breath detection should in principle be possible.
A disadvantage of the method is that the signal quality is relatively low due to several forms of distortions, such as motion artifacts and muscle contractions but, especially cardiac activity contaminating up to 50% of the signal. For this reason several ECG removal methods have been tested.
Frequency filtering enables us to remove a part of the cardiac activity present at lower frequencies where not much diaphragmatic power is present. Filtering in the frequencies above 100 Hz is no option as EMGdi is also present in this range. After filtering, ECG activity still exceeds breathing signals up to a factor of 10. This means that additional filtering techniques are necessary.
Signal substraction in the time domain has been tested. This method constructs a generic ECG template from multiple ECG complexes and subtracts it from the original signal at the positions of the ECG complexes. If the substraction signal equals the ECG component in the original signal, only the EMG component would remain. Due to differences in shape of the individual ECG complexes, the ECG complexes could not be deduced below 75 % of the original.
Cardiac gating is a simple form of signal rejection which can be rather easily applied. When measuring EMGdi signals of neonates an average heart beat frequency is found of approximately 140 beats· min -l. Because of this, gating should be applied on only the QRS complex instead of the entire PQRS complex, thus removing 20% instead of 50% of the signal. Although not the complete ECG complex has been removed,the parts containing more power than the EMGdi breathing signal have. This methods works well when the aim
46

is to get pure pieces of EMGdi signal, mostly for frequency analysis properties. Research on certain parts of the spectrum and their physiological interpretation has not yet been clone, although articles concerning the subject have been found: [HAG-92], [PAN-95] and [PRE-86].
The gating and averaging method results in a smooth breathing signal similar to a Grasebycapsule signal and offers an usabie signal for visual inspection. As the gating and averaging scheme results in a sort of envelope of the original alternating signal, breath finding by minimum searching is relatively easy. When the cardiac contaminated part of the data is deleted and substitution is artificially generated, artifacts arise when the breath starts and -ends coincide with the substituted region. These artifacts are often observed as additional peaks in the signal. Another point that has to be considered is that this method eliminates a large part of the frequency information. This removes the possibility to apply frequency analysis to this processed signal. Furthermore a signal delay is caused by the RMS averaging component, which reduces the possibility of a speed-up of breath detection.
Breath start detection was clone using the gated and averaged signaland displayed a 45% to 70% detection of breaths. EMGdi breath start detection is indeed faster that than either flow of Graseby detection, even when automatically detected in the gated and averaged signal (90 ms). However, the variation in the breath start moment relative to the reference signal is large, shown by the 160 ms standard deviation. This value is especially high, if it is considered that with neonates assisted ventilation should start within 100 ms after inspiration. It can be concluded that gating and averaging provides a breath detection signal that is visually sufficient, but is not preferred to find the exact starts of breaths. An alternative to gating should be explored.
If the goal is to detect only a few precise breath starts with the purpose of verifying ventilation, the gating and averaging breath detection scheme can be used to find an approximate starting point and use this afterwards to find a more precise start in the gated raw signal. This only helpsin finding clear breath starts not coinciding with heartbeat but would probably suffice in validating timing of ventilation equipment.
To be able to do a more complete detection, a method that uses subtraction instead of rejection of the cardiac signal should be used, in order retain a complete signal. If a method of substraction could be successfully implemented artifacts, resulting from interpolating data as clone in rejection schemes would be eliminated. Thus, in further research other methods of generating a subtraction signal should be tested. One interesting technique is currently tried at the AZM in Maastricht: instead of one electrode pair two electrode pairs are used. The aim is to find two signals with EMGdi activity and an opposite cardiac signal. These two signals are then subtracted to remove the cardiac signal. To obtain an equal cardiac signal, on one side of the chest three measuring electrodes are placed. The middle electrode is used by both signal channels, while the other two are placed at equal distance of approximately 2 cm at the left and right of the middle electrode. This method
47

appears to efficiently subtract the cardiac signal in adults. The method has not yet been tested with infants.
Another approach is to perfarm measurements invasively, by using an oesophageal probe with electrades attached. The probe can be inserted through the diaphragm. Due to the proximity of the electrades to the fibres a stronger, more local signal can measured with less distartion by cardiac activity, as has been described in [ONA-81] and [BEC-98].
48

Chapter 8
Technology assessment
One of the most important areas of neonatal care is monitoring and, when needed, support of ventilation. Ventilatory monitoring is of vital importance in case of neonates with a central inspiratory drive that has not yet been completely developed. Furthermore while ventilating is in some cases necessary, it can lead to lung stretching, and its use should be reduced to minimum. lt is thus of importance to have a maximal insight in the respiratory mechanisms. EMGdi analysis can help in studying breathing behavior thoroughly and, probably, in the future regulate assisted ventilation. This can have a direct effect in lowering morbidity or even mortality and makes development and refinement of EMGdi breathing analysis relevant for clinical use.
49

Bibliography
[ARE-98] T. Arends, Motor Unit Action Potentials and the influence of skin conductivity, University Hospital Nijmegen, Nijmegen, (1998).
[BAR-96] A. Bartolo, R.R. Dzwonczyk, C. Roberts, E. Goldman, Description and validation of a technique for the remaval of ECG contamination from diaphragmatic EMG signal, Med. & Biol. Eng. & Compu., 34, pp. 76-81, (1996).
[BAR-96] A. Bartolo, C. Roberts, R.R. Dzwonczyk, and E. Goldman, Analysis of diaphragm EMG signals: comparison of gating vs. subtraction for remaval of ECG contamination, J. Appl. Physiol., 80, no. 6, pp. 1898-1902, (1996).
[BEC-98] J. Beek, C. Sinderby, L. Lindström and A. Grassino, Effects of lung volume on diaphragm EMG signal strength during voluntary contractions, J. Appl Physiol., 85, no. 3, pp. 1123-1134, (1998).
[BER-94] J.A. Bernards, L.N. Bouman, Fysiologie van de mens, Bohn Stafieu Van Loghum bv, Houten, (1994).
[DUC-98] J. Duchêne and J-Y Hogrel, A model of EMG generation, IEEE trans. on Biomed. Eng, 47, no. 2, pp. 192-201, (2000).
[HAG-92] G.M. Häg, Interpretation of EMG speetral alterations and alterafion indexes at sustained contraction, J. Appl. Physiol. 73, no. 4, pp. 1211-1217, (1992).
[HAR-96] T.R. Harris, B. R. Wood, Physiologic Principles, Assisted ventilation of the Neonate, W. B. Saunders company, Philadelphia, chap 2, pp. 21-47, (1996).
[HER-91] H.J. Hermens, Surface EMG, FEBO press, Enschede, (1991).
[LEV-86] S. Levine, J. Gillen, P. Weiser, M. Gillen and E. Kwatny, Description and validation of an ECG remaval procedure for EMGdi power spectrum analysis, J. Appl. Physiol., 60, no. 3, pp. 1073-1081,(1986).
[MAT-76] B. Maton, Motor Unit differentiation and integrated surface EMG in voluntary isometrie contraction, Europ. J. Appl. Physiol., 35, pp. 149-157, (1976).
50

[MUR-81] T. Murphy and D. Woodrum, Functional development of respiratory muscles, Mechanics of breathing, chap. 99, pp. 1071-1093.
[OBR-87] M.J. O'Brien et al, Transcutaneous respiratory electromyographic monitoring, Crit. Care Med., 15, no. 4,pp. 294-299, (1987).
[ONA-81] E. Önal, M. Lopata, A.S. Ginzburg and T. O'Connor, Diaphragmatic EMG and transdiaphragmatic pressure measurements with a single catheter, Am. Rev. Respir. Dis., 124, pp. 563-565, (1981).
[PAN-95] P.C.W. Pang, M.G.Pepper, D.A. Ducker, Monitor respiratory activity ~n neonates using diaphragmatic electromyography , 33, pp. 385-390, (1995).
[PRE-86] W.H. Press, B.P. Flannery, S. A. Teukolsky and W. T. Vetterling, Numerical Recipes, Cambridge University Press, Cambridge, (1986).
[REI-94] F.J.C. Reis, d.b. Cates, L.V. Landriault, H. Rigatto, Diaphragmatic activity and ventilation in preterm infants, Biol. Neonate, 65, pp. 16-24, (1994).
[SCH-79] T.W. Schweitzer, J.W. Fitzgerald, J.A. Bowden and P, Lynne-Davies, Speetral analysis of human inspiratory diaphragmatic electromyograms. J. Appl. Physiol. 46, no. 1, pp. 152-165, (1979).
[SPI-98] A.B. Sprikkelman, L.A. van Eykerm, M.S. Laurens et al, Respiratory muscle activity in the assessment of bronchial responsiveness in astkmatic children, J. Appl. Physiol., 84, no. 3, pp. 897-901, (1998).
[T00-98] F.A.J. Toonen, De mogelijkheden tot geautomatiseerde p- en r-top detectie in electracardiogrammen van neonaten, report NF /KFM 98-02 AV, University of Technology Eindhoven, Eindhoven, (1998).
[WEI-97] J. Weiberg, C. Sinderby, L. Sullivan, A. Grassino and L. Lindström, Evaluation of diaphragm electromyogram contamination during progressive inspiratory maneuvers in humans, Electromyogr. clin. Neurophysiol, 37, pp. 143-153, (1997).
[WID-91] J. Widdicombe and Andrew Davies, Respiratory Physiology, St. Edmundsbury Press Ltd, Suffolk, (1991).
51

Appendix A
Setup specifications
A.l Amplifier characteristics
The frequency response of the Myotron 222 amplifier with the 100-200 Hz (left) and 100-200 Hz filter (right) set is shown in Fig. A.l. The figure displays the output signal divided by input amplitude.
~ Frequency characteristic
1ooo.J ~
....... r...1Y()tr()~~~~~gg~ 200Hz :
11
'' ~ ..... .. ) .. ...... , ' ""'~"'"' 1 10 100 1000 10000 100000
frequency [Hz]
1000~ ~
0.1 i 1
ru 1 1 1 11 liij 1 1 t i liiij 1 1 1 1 illlj 1 1 1 11 I lij 1 t1, 1 ""f
1 0 1 00 1 000 10000 1 00000
frequency [Hz]
Figure A.l: Frequency characteristics ofthe Myotron 222 amplifier. Bandpass filter setting 100-200 Hz (left), 100-1000 Hz (right).
52

A.2 Electrades specifications
Electrode type Agilent (HP) 13953D Material Soft-cloth Electrode Shape Square Dimensions 22mm x 22mm Lead Wire Material Metallic, Copper Lead wire length/ style non-shielded Gel Type Solid gel Sensor Type Silver/Silver Chloride (Ag/ AgCl)
53

Appendix B
Savitzky-Golay filter
The idea of Savitzky-Golay filtering is to use a filter that does not use equal filter coefficients but instead determines a set of coefficients to approximate the underlying function with a polynomial in the rnaving window. A special form of the general filter described by Eqn. 4.2 is the linear filter. This filter replaces the value of Xi with a linear combination of itself and its neighboring points:
nR
Yi = L CnXi+n
n=-nL
(B.l)
For each point xi, a polynomial is least-squares fitted to all points within the rnaving window (from i - nL to i+ nR)· Instead of least square fitting xi for each i use is made of the property that the coefficients of a fitted polynomial are linear combinations of the data values. To obtain the appropriate en values of a fitting function of Mth order over nL + nR + 1 points the polynomial ao + a1i + ... + aMiM is fitted to the values x_nL, ... ,xnR
using a matrix A.
j=O, ... ,M (B.2)
the set of normal equations for the vector of a/s in tenns of the vector of f/s is
(B.3)
Solving for a yields:
(B.4)
Sirree the coefficient Cn is the component a0 when f is replaced by the unit vector en,
-nL :::; n :::; nR, we are able to write Cn as:
M
Cn = {(AT. A)-l(AT. en) }o = L {(AT. A)-1 }om nm (B.5) m=O
54

We will use only a second order approximation, so Eqn. B.5 can he simplified to:
Bo + B1n1 + B 2n 2 (B.6) {(AT. Atl }om
substitution in B.l results in the complete filter function:
nR
Yi = 2..:.:: (Bo + B1n1 + B2n2)xi+n (B.7)
55

Appendix C
Wavedata viewer screenshots
Figure C.l: Wavedata viewer displaying an EMGdi data range of 3 seconds
56
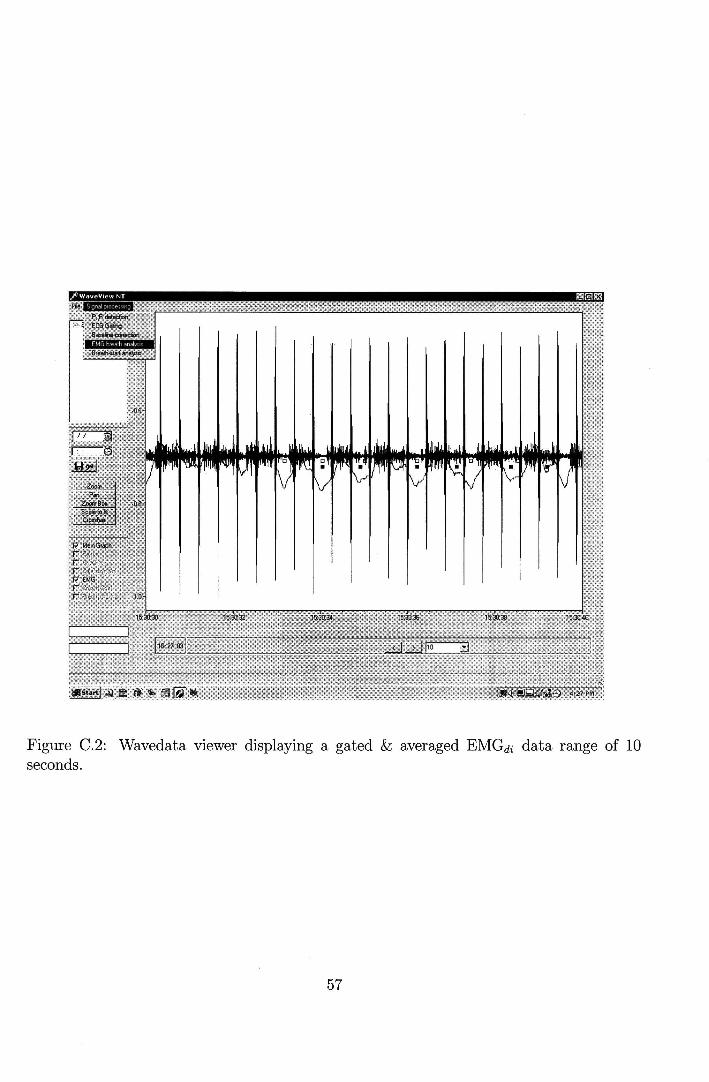
Figure C.2: Wavedata viewer displaying a gated & averaged EMGdi data range of 10 seconds.
57
Copyright © 2022 FDOKUMEN