640460-1.pdf - Eindhoven University of Technology research ...
Upload
khangminh22Category
view
1download
0
Eindhoven University of Technology
MASTER
Hyperlink perfumehelping users with different goals to find the right content
Nouwens, S.
Award date:2016
Link to publication
DisclaimerThis document contains a student thesis (bachelor's or master's), as authored by a student at Eindhoven University of Technology. Studenttheses are made available in the TU/e repository upon obtaining the required degree. The grade received is not published on the documentas presented in the repository. The required complexity or quality of research of student theses may vary by program, and the requiredminimum study period may vary in duration.
General rightsCopyright and moral rights for the publications made accessible in the public portal are retained by the authors and/or other copyright ownersand it is a condition of accessing publications that users recognise and abide by the legal requirements associated with these rights.
• Users may download and print one copy of any publication from the public portal for the purpose of private study or research. • You may not further distribute the material or use it for any profit-making activity or commercial gain
Eindhoven, May 2016
89 mm
0675707
in partial fulfilment of the requirements for the degree of
Master of Science in Human-Technology Interaction
Department of Industrial Engineering & Innovation Sciences
Eindhoven University of Technology (TU/e)
Supervisors
Dr. Ir. M.C. Willemsen IE&IS, Eindhoven University of Technology
Dr. M. Pechenizkiy Mathematics & Computer Science, Eindhoven University of Technology
In cooperation with
Ir. T.P.C. Putman StudyPortals B.V., Eindhoven
by ..............……………………

StudyPortals’ mission is to enable students to find the best studies worldwide by creating
websites where users can find detailed information about study programs and explore them
in various ways. In the ongoing search for a user interface that assists users to find a
university or study that matches their needs, this thesis aims to improve goal attainment and
usefulness of one of StudyPortals’ websites; BachelorsPortal. Through the use the
information foraging theory (IFT), which draws an analogy between the way in which
animals forage food and humans forage online information, reversed information scent is
proposed. Its aim is to be an implementation of the IFT that can be used to improve
information scent on websites, by making hyperlinks more similar to the content they refer
to.
In the construction of these optimal hyperlink texts, the goal directedness (the specificity of
the goal) of a user can influence the type of information needed. The theory of information
categorization is used to hypothesize that users with a higher goal directedness prefer
subordinate information categorization (i.e. Bayesian probability theory), while more
explorative users prefer a more general, basic information categorization (i.e. statistics). This
directedness is hypothesized to be highly dependent on the expertise of a user; experts are
expected to have more specific goals.
An online experiment was designed for BachelorsPortal’s search page where the information
scent of the search results was modified. For all 49.000 studies, labels were constructed by
using StudyPortals discipline system for the “basic” labels, and an automated labelling
process for the “subordinate” labels. In 14 days over 17.600 users experienced the
modification, and their behavior was analyzed. Moreover, 140 participants participated in a
questionnaire aimed to measure goal attainment and usefulness.
The results show significant results when information scent is increased with basic
information categorization: users spend less time searching and are more engaged with the
studies they click on compared to users who see links with no information scent. The users
viewing increased information scent with subordinate labelling show opposite behavior.
Combined with an analysis of the goals indicated by users on the survey, we suggest that the
average directedness of users on BachelorsPortal is too low for the subordinate information
scent to have a positive effect. Subjective measures show no support for the hypothesis
regarding subjective behavior, we suggest that the modification might be too small to show
an effect on the perception of users in the small sample collected.
Overall this work shows the potential of reversed information scent to increase the goal
attainment & usefulness on informational websites. A number of interesting directions could
be explored in further research, such as the algorithm for label generation and a more solidly
designed subjective measurement. It suggests that directedness is an important factor to
consider when aiming to increase information scent, and picking the correct level of
information abstraction based on user characteristics might improve desired results.

1 Introduction ........................................................................................................................ 3
1.1 BachelorsPortal ........................................................................................................... 3
1.2 Explorative analytics ................................................................................................... 3
1.3 Problem definition & proposed solution ..................................................................... 5
1.4 Methodology & Results ................................................................................................ 6
1.5 Thesis Organization ..................................................................................................... 6
2 Theoretical background ...................................................................................................... 7
2.2 Information Foraging Theory ...................................................................................... 8
2.3 Reversed information scent ........................................................................................ 11
2.4 Subjective measures ...................................................................................................14
2.5 Summary ....................................................................................................................16
3 Research Question ............................................................................................................. 17
3.1 Hypotheses ................................................................................................................ 18
4 Auto-labelling studies ....................................................................................................... 22
4.1 Collect & clean ........................................................................................................... 22
4.2 Finding the optimal label for each study ................................................................... 23
4.3 Subordinate to basic and wrong labels ...................................................................... 25
4.4 Verifying the quality .................................................................................................. 25
5 Method .............................................................................................................................. 27
5.1 Design ........................................................................................................................ 27
5.2 Procedure ................................................................................................................... 27
5.3 Participants ................................................................................................................ 30
5.4 Tracking user behavior and processing data .............................................................. 31
6 Results ............................................................................................................................... 33
6.1 Search result click-through ....................................................................................... 33
6.2 Dwelling times ........................................................................................................... 35
6.3 Conversion ................................................................................................................. 36
6.4 Time ........................................................................................................................... 38
6.5 Subjective goal attainment & usefulness ................................................................... 39
6.6 Combining subjective and objective .......................................................................... 43
7 Discussion and Conclusion ............................................................................................... 47
7.1 Findings ..................................................................................................................... 48
7.2 Limitations ................................................................................................................ 50
7.3 Conclusions & Further Research ............................................................................... 52
8 References ......................................................................................................................... 54
9 Appendix ........................................................................................................................... 58

9.1 Questionnaire ............................................................................................................ 58
9.2 Experiment data ........................................................................................................ 60
10 StudyPortals & BachelorsPortal ........................................................................................ 74
10.1 Page types & structure ............................................................................................... 77
10.2 Finding opportunities: information scent ................................................................. 79
10.3 Summary ................................................................................................................... 82
11 Pilot ................................................................................................................................... 83
11.1 Preparing data ........................................................................................................... 83
11.2 Labelling studies ........................................................................................................ 84
11.3 Method ....................................................................................................................... 87
11.4 Results ....................................................................................................................... 88
11.5 Evaluation ................................................................................................................ 100
12 User behavior data engineering ....................................................................................... 101
12.1 Data at StudyPortals ................................................................................................. 101
12.2 Scaling to the stars ................................................................................................... 107

This chapter is a general introduction to this thesis, starting with an introduction overview of
the website BachelorsPortal. It continues with explorative research on this website, from
where a problem definition and a possible solution is defined. Finally, the methodology and
its results are introduced and the organization of this thesis is described.
The complexity of choosing the right study and university has been growing significantly in
the last decades. Through the internet hundreds of thousands of programs are accessible,
leaving it up to students to find that one study that matches their needs best. StudyPortals
aims to assist users in making this choice by creating websites where users can search,
explore and find detailed information on all studies worldwide. One of these portals is
BachelorsPortal and contains over 49.000 bachelor programs. On this website, users can take
different approaches to explore their interests; studies are grouped in specific pages per
disciplines (i.e. law or computer science), country and university. Besides these page types,
there is a home page, users can manage their account on a number of account pages, and
study-options pages exists, where studies from a certain discipline in a certain country are
displayed (i.e. all biology studies in Germany).
Table 1 shows the number of page visits for specific page types over 4 weeks. It shows the
effect of StudyPortals’ underlying strategy to attract users with high quality information
pages, led them to the search page (the “heart” of the website with 15.4% of all page visits)
and let them explore studies (the main content with 34,2% of all page visits) from there.
Page views Percentage of all page visits studies 179,673 34.24% search 80,757 15.39%
study-options 50,460 9.62% account 47,874 9.12%
universities 42,317 8.06% countries 41,334 7.88%
home 37,254 7.11% disciplines 28,764 5.48%
articles 11,025 2.10%
Previous research that might assist in the design of a study choice process shows a wide
variety of selection criteria of users choosing a study; where some may focus on market
perspective and pricing (Maringe, 2006), others may look at properties like university
reputation and location (Smith, Agahi, Price, & MatzDort, 2003). Designing an interface that
supports all these different goals is challenging in itself, but becomes even larger when
accounting for the decision phase where users are in. Some might be very explorative and use
search results to make up their mind, while others can be highly directed in their search
(Payne, Bettman, & Johnson, 1993; Rose & Levinson, 2004).
Explorative analysis initially focused on big data handling (described in appendix chapter 12)
and showed that the search page was a critical point in the user journey. The link they pick in
the search result tiles such as the one presented in Figure 1 was a significant predictor for

their preference towards studies, countries or universities. Users that clicked on a university
in a search result viewed more university pages after that (µ=2.6, σ=3.5) compared to those
who clicked on study- or country links (µ=0.3, σ=1.5). Explorative A/B tests were used to
confirm these findings in terms of conversions (users clicking on buttons linking to external
websites from universities) as they appeared to be a good indicator of a user having found
something interesting.
One experiment ran between 06-11-2015 & 19-11-2015 and removed the link to the country
(i.e. “Poland” in Figure 1) while keeping the text. This was initially expected to reduce the
distraction from finding a suitable study and lead to more conversions. The opposite was
found, with users converting significantly less (1.39 times per user compared to 1.47 for the
baseline). The same drop happened in another condition where the link wouldn’t redirect to
the country page, but filtered the search results to that country (also 1.39 conversions per
user). Though quite trivial, we concluded that users might be most interested in the types of
links they click on. Moreover, the more specific the link they interact with, the more interest
they seem to show.
A visual scan of the search results, such as the one presented in Figure 1, shows a distinct
presence of the red button in the right bottom corner, drawing attention by using a very
distinct and bright color. This button is used by BachelorsPortal to give more presence to
sponsored search results (4.7% of all studies at 27-04-2016), who besides the red button also
get priority in result ordering, images in the study search tiles and conversion buttons on
their study pages. This results in 45.7% of all shown search results to be like the ones in
Figure 1, the other studies are shown as “normal” results, an example being shown in Figure
2. The content of the button, Detailed Description, is the same for all studies. This presented
an interesting opportunity as it is very generic, while early experiments suggested a more
specific link might assist users more than the current one.

At this point the interest of the search page was threefold. Firstly, it acted as the center of the
website, meaning even a little improvement could have an interesting effect for
BachelorsPortal and its users. Secondly, improving the search page was one of the intentions
of BachelorsPortal at the time of the start of this thesis: the bounce rate (percentage of page
views that were closed before interacting with the page) of the search page was high (24.9%
in October & November 2015). This showed that the search page might have had more
potential then it delivered. Finally, the explorative analysis suggested that the search page
was a central place of the website from where users picked clear paths into the website, and
clear communication of these different paths could help them reach the information they
wanted. These insights formed as base for the problem definition:
BachelorsPortal’s search page does a good job at letting users find content
they are interested in, but uses a very generic text to describe their most
distinct element on the search page. By doing so they might prevent users
from finding studies they are interested in, potentially missing out both
from commercial- and user goal perspectives.
The information foraging theory (Pirolli & Card, 1999) predicts that users follow links that
have a high similarity with their goal, and is used as underlying theory to solve this problem.
By making the links more informative we hypothesize that it becomes easier for users to pick
interesting search results, and the probability that they attain their goal increases. One of the
main additions of this thesis compared to previous IFT research is the use of information
categorization (Johnson & Mervis, 1997) to split the needs of novices and domain experts.
Where novices benefit from simpler, more abstract representation of information, experts
might benefit from more specific and complex information, as their search goals will
generally be more complex. Based on these theories we suggest that calculating specific labels
for each study and using those labels as texts instead of the current “Detailed Description”
could assist in addressing the defined problem.

An auto-labelling process was constructed for this purpose with the aim to find labels that
described the content of every study as good as possible. It matched labels from a public label
set with all 49.000 studies from BachelorsPortal by using similarity metrics comparable to
the ones used by the information foraging theory. These labels were then used to replace the
“Detailed Description” text in an online experiment, which ran on BachelorsPortal for 2
weeks. The user behavior was analyzed, as well as the subjective measures from 145 users
who participated in the survey.
Overall we found support for most hypotheses concerning behavior: buttons containing
custom labels decreased the search time and number of studies users clicked on, while
increasing the time spend on the chosen study pages and conversion. No effects were found
in the subjective measurements; we suggest that the effects might be too small to show an
effect on user perception in the small sample of survey responses we collected. Overall the
impact seems to be small but significant and makes a strong suggestion that the current
methodology can be generalized and used to help users find the information they are looking
for quicker and more successfully by improving generic hyperlinks.
This thesis is organized in a number of chapters & appendixes. Chapter 2 will discuss the
related literature and previous experiments regarding hyperlink optimization and constructs
a conceptual idea for implementation. Chapter 3 will follow up with research questions and
hypotheses and chapter 4 describes the auto-labelling process used for this thesis. Chapter 5
describes an experimental design which uses these labels to modify the buttons in the search
results. Its results are presented in chapter 6 and discussed in chapter 7.
A number of chapters are appended to this work as they contain relevant information but do
not directly fit into the main body. Chapter 10 presents an elaborate overview of StudyPortals
and BachelorsPortal and chapter 11 presents the methodology and results of the pilot that
was run prior to the main experiment. Finally chapter 12 presents an overview of the data
used in this thesis, as well as a proposal on how to scale the gathering, processing and
analytics at StudyPortals from an engineering perspective.

Navigating the web in search for a piece of information is a complex task, where an
overwhelming amount of links, buttons, images and other web elements have to be evaluated
to find the information that satisfies the goal of the user. Users with different levels of
expertise and varying goals may process these web elements differently, resulting in different
needs. The aim of this thesis is to improve navigation and simplify this process, in particular
by making links more specific and similar to their underlying content.
This chapter will cover the theoretical background of these topics and propose a method
which can be used to apply this theory to the search result buttons on BachelorsPortal.
Firstly, tagging research will be covered and while it potentially could assist in solving the
current search page problem, we suggest the use of the information foraging theory fits
better. Furthermore, the concepts of information categorization, expertise and goal
directedness are introduced as they might play an important role in the type of information
users prefer. Finally, a number of subjective measures are introduced that might be useful in
this thesis.
When trying to summarize bodies of information in just one or two words, a straight-forward
concept is that of tagging; attaching pieces of metadata (often in the form of a couple of
words) to other data. Tagging became popular with the rise of Web 2.0, where users started
to organize content with tags. It’s still widely used in blogs and Q&A platforms like Quora and
Stack Overflow, as the relatively small user-effort of adding a tag helps these platforms
organize their content, making it easy for other users to explore. Obviously this is possible
due to the large community, manually tagging 49.000 studies for a research project however
is much more tedious and biased, and would benefit from automation.
Auto-tagging documents based on their content has been studied before: one of these studies
(Sood, Owsley, Hammond, & Birnbaum, 2007) tried to auto-generate tags for a given blog
post, and found that their system could construct relevant, meaningful tags. Good results are
also achieved with summarizing email contents into keywords (Dredze, Wallach, Puller, &
Pereira, 2008). Algorithmic improvements are being made in a recent study that attempted
to auto generate tags for questions on Quora (Nie, Wang, Shen, & Chua, 2014). All these
works solve a classification problem, where the first two use a supervised approach the latter
uses unsupervised methods. As the naming suggests, supervised only predicts tags based on
tags it has been trained with before, while an unsupervised approach can also discover new
tags and is preferable in most situations, as it can adopt to changes in content over time.
Another approach to tagging is clustering, where similar documents are being clustered and
the underlying concept is used as tag. One of these systems is the matured carrot21, a web
search engine that clusters webpages and uses the tags that describe that cluster as filters.
When comparing these tagging works with the problem statement of this thesis, it was found
that the purpose of tagging is organization and resulting discovery, while this problem
searched for a solution that would guide users based on their goal. While these ideas will
sometimes overlap, a tagging system works best if a tag has a reasonable amount of
documents attached to it. A Q&A site with as many tags as questions will not benefit from the
tags. This thesis does not aim to solve this organization, and might even benefit from a larger
number of tags, as it can help users to distinct links and pick the one closest to their goal. So
while tagging is closely related, the use cases are too different for tagging research to be
1 http://search.carrot2.org/

directly applicable to this thesis. Methodologies like the relevant tag selection described in
(Nie et al., 2014) and tag concept validation in (Sood et al., 2007) can however be applied.
Besides tagging, a large body of literature exists in the topic of website navigation
optimization. A large proportion of that is devoted to personalization, i.e. changing
navigational structures based on user behavior (Lin & Liu, 2008), recommending content
(Mobasher, 2007) and finding usability problems and opportunities. Improving hyperlink
quality however is not found in current literature.
A theory that might be a better fit is the Information Foraging Theory (IFT), which draws an
analogy between the ways animals forage food and users forage information. The core
hypothesis of the IFT is that living creatures optimize reward-effort, whether they are
animals looking for food or humans looking for information (Pirolli & Card, 1999). Animals
do so by identifying patches of food, for instance a bush of berries, which they forage until
more utility can be gained from finding a new patch. Effectively, they consume a patch until
the time to look for a new patch and its expected payoff is lower than the remaining payoff in
the current patch. When locating a patch (either by initial search or by switching), the scent is
very important as it is the main driver in locating potential food.
IFT hypothesizes humans behave the same way when looking for information on the web,
hopping between different informational patches in pursuit of a certain goal. Like animals,
they do so by scent, which IFT defines as the similarity between a textually defined goal of a
user and a hyperlink text. This similarity is strongly correlated with the interest of a user in
that link, and hence the clicking probability. If a link delivers other information than its scent
promised, or scent of a patch drops below the average scent of all previously seen patches,
users are very likely to leave.
The value of this theory for information foraging has been proven in a number of
experiments and systems being described in research the last 15 years. Most of this research
has been done by created automated systems that walk through a website based on these
concepts, often motivated by some predefined goal. They analyze link texts and compute
similarities with its predefined textual goal via latent semantic analysis (LSA). The higher
the similarity between a link and the goal, the stronger the scent, and the more likely that the
system will pick that hyperlink. The paths taken by these systems is strikingly similar to paths
taken by real users with the same goal (Fu, Avenue, & Pirolli, 2007).
LSA, an important concept in IFT, is a natural language processing technique which converts
text documents to word count vectors, and reduces those vectors to a predefined number of
components. This allows a document to be described in underlying concepts, which has the
psychological concept that different words (i.e. “vector” & “array”) can be considered very
similar. It also reduces the number of features while keeping most variance, which is
desirable form a computational perspective.
LSA is a technique often used for text processing (Dredze et al., 2008; Geiß, 2011; Gomez &
Moens, 2014; Rott & Cerva, 2014), especially in the field of information scent (Blackmon,
Polson, Kitajima, & Lewis, 2002; Chi et al., 2003; Fu et al., 2007). Related techniques such as
probabilistic LSA (pLSA) and Latent Dirichlet Allocation (LDA) improved upon LSA and
have been compared extensively (Maguitman, 2008; Niraula, Banjade, Dan, & Rus, 2013).
They differ conceptually: LSA assumes that words and documents can be represented as
points in Euclidean space. On the other hand, LDA and pLSA assume that the semantic
properties of words and documents are expressed in terms of probabilistic topics

(Maguitman, 2008). As none of the 3 is superior to the others in all circumstances, LSA is a
good choice as it’s often used in IFT research.
Quite some work directly and indirectly related to IFT has been published, which will be
covered in the following subchapters.
Two streams of related automated systems have been involved into automated web analysis.
CoLiDeS on the one hand attempts to predict information foraging behavior at the level of
individual information pages and it was founded upon the Construction-Integration model of
text comprehension, action planning and problem solving (Kintsch, 1988). Its predecessors
aimed to learn and explore complex GUI’s by Kintsch model, but not in an automated way. It
considers one page to consist of several information patches: humans will first search for the
most interesting patch on a page, and from there continue to look for the most interesting
link (Blackmon, Polson, & Kitajima, 2000). Based on CoLiDeS is the Cognitive Walkthrough
of the Web (CWW): a partially automated usability evaluator that identifies website
navigational problems (Blackmon, Kitajima, & Polson, 2005). It works on a predefined goal
and website structure, and it’s still online for those interested2.
Secondly, the SNIF-ACT (Fu et al., 2007) branch directly originates from the ACT-R
computational model from the original IFT research done by (Pirolli & Card, 1999). In
contrast to CoLiDeS, SNIF-ACT considers information patches to exist on many levels, for
example different websites or different subsets of webpages, but treats a single page as a
complete patch. Therefore, it is better in predicting navigation between webpages compared
to CoLiDeS, but can be improved by considering the way in which links are presented in a
webpage. It processes links all in the same way, while it may be obvious that users looking at
a website like Figure 3 will not. All links under “history” for example will be barely interesting
for users looking for soccer clubs. This within-page patch effect has been shown by a recent
study dubbed the web party effect (Rigutti, Fantoni, & Gerbino, 2015) and shows to be a
valuable addition to CoLiDeS.
2 http://autocww2.colorado.edu/~brownr/v2/

A number of studies and experiments have been built on these frameworks, a good
introduction is the literature overview of (Mccart, Padmanabhan, & Berndt, 2013). They
showed the effect of information scent in objective measures such as page views and session
times on websites with small user bases. This is an addition to the more traditional
information scent research, that have already shown the positive effects of high information
scent. Overall, users experience higher goal attainment & site satisfaction (Pirolli & Card,
1999), experience less stress (Moody & Galletta, 2015) and choose the correct links quicker,
with more confidence and less errors (Tselios, Katsanos, & Avouris, 2009), reducing the
probability of leaving the site unsatisfied (Nielsen, 2003). Due to these highly desirable
effects for informational websites, fully automated systems besides CWW have been
developed that analyze and identify information scent problems on websites, one of them
being CogTool3 (Teo & John, 2008).
3 https://github.com/cogtool/cogtool

Given the potential benefits of optimizing links using the IFT, it seems strange that some
websites, including BachelorsPortal’s search page, still contain links without specific scents.
IFT predicts and points out the problem spots with information scent exceptionally well, but
fails to define a solution that can be used to solve them. One of the problems is that the
theory approaches the user navigation from a theoretical, top-down perspective. From this
perspective, users (or computer systems) get a written assignment and a controlled
environment. To illustrate, consider the “city task”, used in for the SNIF-ACT system (Fu et
al., 2007) which provides the following assignment:
You are the Chair of Comedic events for Louisiana State University in
Baton Rouge, LA. Your computer has just crashed and you have lost
several advertisements for upcoming events. You know that The Second
City tour is coming to your theater in the spring, but you do not know the
precise date. Find the date the comedy troupe is playing on your campus.
Also find a photograph of the group to put on the advertisement.
While the assignments are carefully designed to closely represent real-world problems, this
approach creates several impracticalities when looking for improvements in actual websites.
User goals might be unknown and expensive to discover, and differ in specificity from the
highly directed goals used by IFT research. Moreover, IFT research uses laboratory settings
and motivates users extrinsically to find a given goal. While some research (Mccart et al.,
2013) overcome most of these issues by analyzing real user data, it still leaves an
implementation gap and does not show the effects of information scent modification, both on
behavior and subjective measures.
Based on the potential improvements of IFT that can be used to solve the stated problems of
BachelorsPortal, we propose a way to construct higher information scent. Rather than trying
to find the most attractive scent on a webpage given a goal, a bottom-up analysis can be used
to construct scents based on the content they refer to. The aim then is not to analyze how
users will behave given a certain goal, but to create strong information scents that will lead
users to the most relevant content, without the system knowing their goal.
If this reversed information scent works as suggested, users should be able to better identify
what links are relevant for the information they are interested in and reach higher goal
attainment. This should result in users getting to their goal with a higher success rate, with
less clicks and time spend searching, resulting in a better user experience as well as improved
business metrics for StudyPortals.
For BachelorsPortal, IFT does not only explain why users that click on very specific (highly
scenting) links have higher engagements. By slightly changing the concept into this reversed
form it also provides a starting point for optimizing links where no scent is present, like the
“Detailed Description” button. Which, given the potential positive effects shown by previous
research, is well worth looking into.

To apply the reversed information scent to hyperlinks, one has to answer the question
Which words best describe this piece of content?
IFT provides a computational answer to determine what concepts have a high similarity with
content (i.e. studies): latent semantic analysis. Where IFT uses LSA to compute the similarity
between links and goals, the process can easily be reversed to compute the similarity between
content and a possible hyperlink. What it does not answer is what the optimal label is from a
user perspective, given a number of high-scoring labels. LSA can for instance identify that a
study scores high on “functional distributed programming” and “programming”, it now
depends on user characteristics (i.e. knowledge) to determine which label is best and most
meaningful.
A psychological theory that can assist in making decisions on information representation is
categorization (Rosch, Mervis, Gray, Johnson, & Boyes-braem, 1976). This theory states that
concrete things can be described on different levels of abstraction: superordinate-, basic- and
subordinate. Best explained by an example; a cat (basic) can also be described as a British
shorthair (subordinate) or an animal (superordinate). These different levels of
categorizations have different (dis)advantages, where the basic level representation is most
often preferred. In the original paper for instance, a number of experiments were conducted
where users either heard the word “apple” or “fruit” before being shown 2 separate images of
apples. When hearing the basic level categorization of the object, it was more likely to trigger
the semantic priming effect, which allowed them to identify the pictures quicker.
While in general basic-level naming is preferred, it has been shown that experts prefer
subordinate level representation of knowledge in some tasks, such as object naming and
masked object identification (i.e. identifying silhouettes of birds) (Johnson & Mervis, 1997).
Reflecting this on IFT, in general the basic version of a label might have the best results as it
generally is the most preferred alternative. For experts however, the subordinate version of a
label might support them better. Which leads to the question; what is an expert?
User domain expertise is defined as the level of background knowledge that a user has of a
certain topic, in this case concerning the patches of information that are being examined. As
shown by previous IFT implementations like CWW (Blackmon, Polson, Kitajima, & Muneo,
2005) and search related studies (Duggan & Payne, 2008), expertise is a concept that
influences the way a user behaves when looking for information. As mentioned in the
previous subchapter it also influences which level of information categorization appeals most
to the user, making a look into expertise literature worth the effort.
Experts are generally quicker and more successful in attaining their online information goal
(Blackmon, Polson, et al., 2005). This intuitively makes sense: if a user is interested in
computers but doesn’t know what the programming language “java” is, (s)he will not search
for it, and a link referring to this term will have very low scent for that user. These types of
words are referred to as a zero-frequency words (Blackmon, Polson, et al., 2005), meaning it
does not exist in the corpus that makes up the user’s domain knowledge. The CWW model is
based (amongst others) on the assumption that these words are usually ignored by users.
Besides this domain expertise, another type of expertise influences the way users behave on a
website, namely web expertise, meaning the level of experience a user has with using
websites. This has been well studied in the domain of web search (Duggan & Payne, 2008;

Hölscher & Strube, 2000; White, Dumais, & Teevan, 2009), and shows that both domain-
and web expertise result in similar (desirable) behavior: less time to goal attainment, better
choice of information patches and use of more specific search queries. These 2 types of
expertise have been found to strengthen each other: the best searchers on the web have both
domain and web expertise. An interesting study (Jenkins, Corritore, & Wiedenbeck, 2003)
compared the 4 conditions of expertise, and looked at how they searched (broad vs in depth)
and how they evaluated the results (see Table 2). Given the role of internet nowadays,
combined with the fact that most visitors of BachelorsPortal are expected to be suited for
bachelor-level education, we assume every user has at least an average web expertise level. As
the variance in domain expertise is more likely to be larger, it is the primary focus of
expertise in this study.
Domain novice Domain expert Web novice Breadth-first
No result evaluation Breadth first Evaluate with domain knowledge
Web expert Mixed strategy General evaluation
Depth-first Deep evaluation
While most of the previous research suggests a direct effect between expertise and behavior,
we suggest that there is a variable in between these two that matters when users are
searching for information; goal directedness. Within informational web behavior,
segmentation studies show that users differ in their goal: there are directed users who know
very specifically what their goal is, and undirected users who are more explorative (Rose &
Levinson, 2004). This level of specificity has been shown to influence user behavior on
websites (Wang, Wang, & Farn, 2009) which can be linked back to IFT: attractiveness of
information patches depends on the goal, so users with different goals will use them
differently.
Novices are constrained by their limited amount of knowledge, and therefore limited in the
directedness of the goal they can search for. Simply put, they cannot search for the things
they don’t know exist. Experts on the other hand do have extended knowledge and can
construct highly directed, specific search goals, though they do not have to. It might be
possible that experts go back to explorative searches within their field of expertise every now
and then. When relating this to information categorization, novices will always prefer basic
information categorization; it better fits their goals and the more complex, subordinate
categorized information might not even be familiar with them. Experts on the other hand
might prefer subordinate information more often, as shown before (Johnson & Mervis, 1997).
Combining these branches of research in expertise and goal directedness, we suggest the two
are highly intertwined. The goal of the user ultimately influences the preference towards
basic or subordinate most and can be explained in terms of the goal directedness.
Directedness is highly influenced by expertise, simply because the less experience a user has
in an area, the less directed his or her goal can be.

In the theories outlines above, especially the IFT, objective measurements on user behavior
dominate the evaluation of concepts and theories. In some works broad subjective metrics
such as the System Usability Scale (SUS) (Rigutti et al., 2015) or overall website attitude
(Moody & Galletta, 2015) are used. Other works focus purely on behavioral metrics and use
no subjective measures at all (Blackmon, 2012a). As this thesis aims to target only very
specific links, these broad subjective measures might be too general. They’re influenced by a
large number of aspects (site design, speed, device etc.) and might cloud the effects of the
more interesting underlying concepts: how users experience the added information scent and
if it helps them achieving their goals. Therefore, two main measures are proposed that are
more specific and relevant in this context; perceived goal attainment and usefulness.
These metrics might not only give specific insights into the areas of the user experience that
we expect to be effected, but also provide comparison with behavioral metrics. Combining the
behavior metrics with their subjective equivalents might give insights that have not been seen
before. In this subchapter we’ll further elaborate on perceived goal attainment and
usefulness.
While BachelorsPortal/StudyPortals never did an extended user goal study or task analysis,
previous mentioned research in university and study choice suggests a wide range of possible
goals. Users might focus on (amongst others) university location, reputation, market
perspectives, pricing, course content and discipline (Maringe, 2006; Smith et al., 2003). As
mentioned before, the use of reversed information scent would solve this problem as it does
not require knowledge of the goal of a user.
If the goal of the user is not known upfront it is not only interesting to find out his or her
goal, but also whether the goal is being perceived as achieved. In previous work this was
trivial to quantify; users get a specific goal where the researchers know up front where it is
located in the fake website. If users viewed that page or segment then the goal is attained,
both objectively and (almost always) subjectively. In real life this is only possible to some
extend: clicks or page viewing times do predict goal attainment partially (Mccart et al., 2013),
but not completely. Secondly, real life goals might be less specified; for example the lab-goal
“find out how much it costs to study in the Netherlands” versus the real-life goal “find out if
studying in the Netherland could be worth considering”. The first is almost binary regarding
goal achievement: either the user found out the costs or not. The latter, which might be closer
to a real-world goal, can be partly fulfilled, for example if a user already did some research
but did not consider costs yet. Summarizing, it would be most interesting to find out what
the user’s goal was, and to what extend that goal was achieved. Finally, information scent
also aims at reducing goal attaining time, which might be interesting to compare objectively
and subjectively.

At the core of information scent (and informational websites in general) is the usefulness of
the information: links with high scent are perceived as more useful and used more often. The
concept of perceived usefulness (Larcker & Lessig, 1980) is therefore a very close subjective
equivalent of information scent. It also has been found to highly correlate with self-reported
usage and expected future usage of websites (Davis, 1989), even more then general usability.
Conceptually it is very similar to a measurement called perceived system effectiveness used
in recommender research (Knijnenburg, Willemsen, Gantner, Soncu, & Newell, 2012). The
words effectiveness and usefulness are very closely related, when looking at the dictionary
definitions, they both define something to serve its purpose well:
Useful: 1. Being of use or service; serving some purpose, advantageous,
helpful, or of good effect. 2. Of practical use, as for doing work; producing
material results; supplying common needs.5
Effective: 1. adequate to accomplish a purpose; producing the intended
or expected result6
This is also reflected in the questions used by (Knijnenburg et al., 2012) to measure perceived
system effectiveness; some of them literally contain the words “useful” and “useless”. For this
project the assumption is made that both concepts (as measured by (Knijnenburg et al., 2012;
Larcker & Lessig, 1980)) measure the same thing; perceived usefulness. This might not hold
in all situations, but in this context both target the underlying concept that is most interesting
to measure: how useful is the system (with or without scent) for attaining a certain goal?
5 http://www.dictionary.com/browse/usefulness, retrieved 17-03-2016 6 http://www.dictionary.com/browse/effectiveness, retrieved 17-03-2016

Explorative analytics on BachelorsPortal showed that specific hyperlinks may assist users
better in their search for information. On the search page the most prominent design element
was identified as having very low specificity, this chapter aimed to look at related literature
that might assist in increasing the usefulness of this button. One of the potential areas of
research, tagging, showed to be closely related but the different goals made it unsuitable to
solve this thesis’ problem. The theory of information foraging showed more potential, as it is
a solid, proven theory that can help websites like BachelorsPortal to identify areas where the
information scent could be improved. We hypothesize that IFT can be reversed and in that
way applied on BachelorsPortal; by increasing the scent of web links based on the content
they refer to users might experience increases goal attaining and perceived usefulness. LSA
can be used to compute viable labels for these links, the final choice can be made using
information categorization theory. The preferred categorization level of information scent
depends on two user characteristics.
First of all, there is expertise: domain experts are better in identifying the best information
patches and accomplishing their goals more efficiently compared to domain novices. As they
have a larger body of knowledge on the specific topic, they might prefer subordinate-level
information, especially in the context of hyperlinks on the web, where room is sparse. Non-
experts will prefer basic-level representation of knowledge, if only for the fact that they might
not be familiar with the words used in the subordinate representation.
Secondly there is the level of directedness: more goal-directed users will have a more specific
and concrete goal, which lies closer to subordinate-level information. Less directed users who
will have more general goals and therefore be better served with basic-level representation of
information, as it lies closer to their goal in terms of information scent.
Finally, expertise and directedness are very closely related: users with either high expertise or
directedness both showed improvements in the same types of behavior properties: higher
and more efficient goal attaining & less page visits, among other things. Moreover, experts
have been shown to use a more goal-directed approach in problem solving (Hershey, Walsh,
Read, & Chulef, 1990).
Besides the theoretical background two subjective measures have been introduced that are of
interest in this context. Perceived goal attainment will simply measure whether the supposed
effects of IFT are actually improved when scent gets larger. Perceived usefulness will measure
the usefulness of specific elements. Measuring these subjective concepts might not only show
how modifications on information scent influence users’ perception. It also allows for
comparison between behavior and their subjective equivalents, one of the potential additions
of this thesis to the current body of literature.
Secondly, none of the previous works on IFT appear to have attempted actual website
improvements, a pragmatic aspect that might allow the IFT theory to be used for more than
just design flaw detection. Lastly, using the concepts of information categorization and
directedness to explain information scent type preferences can potentially explain effects not
covered before. We believe these three concepts can add significant knowledge to the current
literature of IFT, and might even prove to be a starting point for real-world website
improvements.

This chapter will define research questions and hypotheses that follow from concepts
introduced in chapter 2, aiming to improve BachelorsPortal’s search page with information
scent. The idea of reversed information scent lies at the core of this study, the concepts of
goal-directedness, expertise and information categorization are concepts that are expected to
heavily influence the effects of reversed information scent. Therefore, the main research
question will be:
Can increased information scent in hyperlinks be used to let users find the
information they are after more efficiently and effectively? Which level of
information categorization works best when increasing information
scent, and how is that affected by goal directedness?
There are two sub questions that can be generated from the literature overview in chapter 2
that look at the concepts of information categorization and goal directedness.
I. Does basic- or subordinate-level information scent lead to improved goal
attainment and usefulness?
II. Does the effect of basic- or subordinate-level scent depend on the directedness of
a user?
As shown in earlier literature we expect a main effect of goal directedness on goal attainment;
the more specific a user’s goal is, the more likely it will be attained (Jenkins et al., 2003;
Sánchez-Franco & Roldán, 2005; Wang et al., 2009). In this study however we are more
interested in how this directedness interacts with different levels of information
categorization, something that has not been studied before.
In summary, the objective is to see if there is a positive effect of information scent on goal
attainment and usefulness, and if the goal directedness of a user moderates the effects of
basic- and subordinate categorization of the information scent. Figure 4 Figure 4represents
this idea in graphical form: information scent and categorization are the independent
variables, goal attainment and usefulness are dependent variables and goal directedness is a
moderator. Expertise is expected to affect directedness.

A number of hypothesis are proposed to answer the research questions. These are split into
two sections: the direct effects of information scent and the influence of information
categorization, directedness & expertise.
One of the main disadvantages of having a low information scent is that users, when trying to
achieve their goal, are more likely to end up in irrelevant information patches. Once they
notice that the current patch is dried out or not the correct one, either of these 3 actions will
be performed: search for another patch (which can consist of backtracking and picking up
another scent) using other sources to initiate a new search (i.e. Google) or stopping the task
all together (Pirolli & Card, 1999). All these options will reduce the probability of goal
attainment, which after all is the goal of informational searching of the web. Therefore, it is
expected that users viewing high-scenting links complete their goal more often compared to
users viewing no-scenting links.
A number of objectively measurable behaviors (sometimes referred to as implicit interest
indicators) can indicate interest of a user towards the content on a study page. For example,
a user viewing a study page for 40 seconds and then clicking on one of its links will be more
interested in the content then a user viewing the page and closing it after 10 seconds. To link
this to goal attainment and usefulness, we make 2 assumptions based on (Mccart et al.,
2013):
Assumption 1: Higher interest means the content is closer to the goal
Assumption 2: Higher interest means the content is more useful
These assumptions will later be tested when comparing subjective and objective data.
Hypotheses 1-6 all use these assumptions to imply higher goal attainment and usefulness. All
hypotheses that are covered below are visualized in Figure 5.
To start with, users can click on studies from the search results, indicating interest. IFT
predicts that higher scent should enable the user to find the correct link more easily, making
less mistakes in the process:
H1: Users viewing highly scenting links click on a lower number of search results compared
to users viewing links without scent.
Besides picking the right study more efficiently, users are expected to be triggered more by
the information scent. So while we expect them to investigate a lower number of studies from
the search page, it is expected they are more likely to click on at least one:
H2: Users viewing highly scenting links are more likely to click on at least one search
results compared to users viewing links without scent.
The overall active time spend on a page (dwelling time) is a good overall predictor for the
interest in content on that page (Claypool, Le, Wased, & Brown, 2001; Fox, Karnawat,
Mydland, Dumais, & White, 2005), constructing the following hypotheses:
H3: Users viewing highly scenting links will have higher study page dwelling times then
users viewing links without scent.

For the search page the opposite effect is expected, as the scent should trigger users quicker:
H4: Users viewing highly scenting links will have lower search page dwelling times then
users viewing links without scent.
Conversion happens when users click on links within BachelorsPortal that refer to external
websites, usually from universities, and is one of the most significant business metrics. It
indicates a potential engagement as a user is interested enough to browse to the website of
the university, even though these buttons have no scent (most of the buttons contain “visit
programme website”, see Figure 35Figure 35). It is expected that more users achieve their
goal, but they need less attempts to do so:
H5: Users viewing highly scenting links are more likely to convert at least once compared
to users viewing links without scent.
H6: Users viewing highly scenting links will convert less often than users viewing links
without scent.
One of the primary shown effects of the IFT is that users viewing highly scenting links are
expected to need less time to complete their goal, compared to non-scenting links (Pirolli &
Card, 1999; Rigutti et al., 2015). This is partly caused by the argumentation for hypothesis 1
(users waste less time in irrelevant patches), but users can also identify the right patch more
quickly and with less effort, reducing the dwelling time on search pages. Time here is defined
as the complete session time. The IFT states that users are most likely to leave when either
their goal is achieved (why hang around any longer?) or their belief of achieving their goal at
the current patch goes below average.
H7: Users viewing highly scenting links need shorter sessions to complete their goal
compared to users viewing links without scent.
In chapter 2.4 two concepts are discussed that relate to information scent: perceived goal
attaining time and perceived usefulness. Goal attaining time is expected to reduce as not only
the actual time reduces, but potentially the increase in mental effort due to the more complex
and dynamic texts may lead to a reduced sense of time, enlarging the effect. Usefulness is
expected to increase (as argued in chapter 2.4.2), as well as goal attaining, a measure that lies
at the heart of IFT.
H8: Users viewing highly scenting links perceive higher goal attainment compared to those
viewing links without scent.
H9: Users viewing highly scenting links perceive lower goal attainment time compared to
those viewing links without scent.
H10: Users viewing highly scenting links perceive higher usefulness compared to those
viewing links without scent.
In summary we expect a number of effects on implicit interest indicators when the current
links without scent are replaced with more meaningful, highly scenting links. Under the to-
be-verified assumption that this interest correlates with goal completion, these hypotheses
suggest that higher information scent should lead to higher (implicitly stated) goal attaining.
Furthermore, it’s expected that users perceive higher goal attaining and usefulness, while
lowering that goal attaining time if the information scent increases.

As elaborated in chapter 2.3.1, information can be presented on different levels (Rosch et al.,
1976). In general basic-level categorization is preferred over the super- and subordinate
levels as it seems to have the right balance between abstraction and specificity. It is
hypothesized that the same applies to information scent:
H11: Basic-level scenting hyperlinks result in higher goal attainment and usefulness
compared to subordinate-level hyperlinks.
For sake of simplicity goal attainment and usefulness are considered to be one factor from
here on, as all independent variables are expected to affect both in the same direction.
To answer the second sub question of this thesis, the interaction between goal directedness
and categorization is reviewed. As argued in Chapter 2.5, highly directed users are
hypothesized to be served better with subordinate-level information, while undirected users
will find basic-level information to be more valuable.
H12: goal directedness moderates the effect of categorization on information scent:
subordinate-level scenting hyperlinks will affect highly directed users more in goal
attainment and usefulness, basic-level scenting hyperlinks will affect undirected users
more.
Following up on the argumentation in chapter 2.3.2 on directedness and expertise, it is
expected that expertise influences the level of directedness a user can have:
H13: Domain experts will have higher goal-directedness then novices.
For the case of BachelorsPortal, we are most interested in the domain expertise of a certain
field of study. One could also focus on the expertise of study choice, but that would be less
interesting given that the majority of the users will only pick a bachelor once, making
variance in study choice expertise a lot lower than that of study-field domain expertise.
Summarizing, high scenting basic level categorization links are expected to result in more
positive outcomes then high scenting subordinate links. This is moderated by goal
directedness, where higher goal directedness has a negative effect on basic categorization and
a positive effect on subordinate categorization. Finally, expertise positively influences goal
directedness.


One of the main challenges of this thesis, and a requirement to test for the stated hypotheses,
is the automated generation of optimal labels for all (over 49.000) bachelor studies. A
methodology was developed for that purpose, which will be elaborated in this chapter.
Overall the goal of this labelling process was to generate three labels for each study: a basic
categorization label, a subordinate categorization label, and an intentionally wrong label. The
first two were required to modify the buttons in BachelorsPortal’s search page, which in turn
was needed to test the hypotheses and answer the research questions. The third, wrong label
was added to be able to check for any side effects, i.e. users behaving differently just because
the button changed in size. A randomly (and intentionally wrong) label could account for
these effects. The usefulness of this wrong label is further covered in chapter 5.1.
To match these labels per study, a pre-defined label tree was used. A label tree is a structured
tree of concepts that specifies how these concepts relate to each other in a hierarchical way,
an example of which is shown in Figure 6. The intention of using this tree was that labels at
the end of the branches in the tree could be matched with studies as subordinate labels, and a
number of steps up in the tree would result in a decent basic level representation of that same
concept.
Firstly, the collection and cleaning of the dataset will be elaborated in 4.1, after which the
used method is described that was used to find the “best” label per study in 4.2. In 4.3 the
process of the basic- & wrong label construction is discussed, the quality of these matches are
presented in 4.4.
For each study its contents were collected with StudyPortals’ API, and 4 properties were
extracted: title, summary, description and study content (a piece of text which describes the
curriculum of a study program). These are the most significant textual properties that are
presented on the actual web page of the study and are good candidates with regards to the
ideas of reversed information scent. After concatenating these properties per study, each
study was presented as one text document, containing between 500~5000 characters per
study. The size of these documents depends on StudyPortals data inserting, and some studies
seem to be edited more elaborately than others.
Based on suggestions by (Gomez & Moens, 2014), a number of cleaning and processing steps
were performed that resulted in a cleaner data set. First of all, all HTML tags were stripped,
and 2400 English stop words (i.e. “the”, “that” etc.) were removed (Porter, 1980). Moreover
42 study specific words that occurred very often in almost all studies (i.e. “program”,
“degree”, “bachelor”) were removed as well. All reading signs and numbers were removed, all
texts were lowercased and split into a word list using spaces as delimiters. As final cleaning
step, each word was lemmatized, which made sure all words were used in the same form (i.e.
“walk”, “walking” and “walks” can be transformed to just “walk”). This was implemented with
the NLTK WordNet lemmatizer7.
The Polythematic Structured Subject Heading System (PSH) (Mynarz, Kamrádková, &
Kožuchová, 2010) was used as a label tree. It is constructed and maintained by the National
Library of Czech for categorization of literature and papers and fits this use case very well;
both this labelling process and PSH are concerned with scientific labelling, unlike more
popular label tree’s like WordNet. Moreover, it contains over 14.000 English labels and is
7 http://www.nltk.org/api/nltk.stem.html

professionally maintained. As final advantage over other label trees, it consists of a count of
the number of papers that each label has attached, which serves as popularity score. An
example of a couple of branches within the PSH tree is given in Figure 6.
The labels of the PSH were downloaded and cleaned with the same steps described above.
The resulting 2 datasets were cleaned label and study documents represented as word lists.
To find the best label for each study, study word-lists needed to be matched with label word-
lists that had the highest similarity. Latent Semantic Analysis was the most preferred
similarity matching metric, as it is used in the original works of the information foraging
theory. Moreover, it can find relationships between semantics, allowing it to match
documents with words that are really closely related, even though they are not same. While
the concept of LSA (explained in chapter 2.2) works well in a lot of use cases, it has quite a
high error rate when comparing very small documents with large documents, i.e. matching
labels with studies. The one or 2 words of a label from the PSH tree are usually not enough to
explain the concept really well, and minor effects which usually go unnoticed with decent
document sizes get more significant when the document size shrinks. This results in quite a
high error rate, too high to use just LSA for the purpose of this thesis.
To correct these errors, the term frequency, inversed document frequency (TF-IDF)
algorithm was used to filter out most of the errors. TD-IDF computes a score for each word in
each document, by counting how often it occurs in a document, and then multiplies it with an

importance score of that word over all documents. This inversed document frequency score
is computed by taking the logarithm of the number of documents divided by the number of
documents a specific word appears in. This way, words that occur only sporadically get more
weight than frequent words. This generally results in a very low error rate, but misses the
relationship properties that LSA can detect. For that reason, a combination of TF-IDF and
LSA was used in this thesis to find semantically related labels for studies without too much
errors.
For each study document the following steps were performed to reduce the set of all possible
PSH labels to the best possible label. As this process was intended to find subordinate labels,
only the PSH labels at the lowest 2 layers of the PSH tree was used.
1. Filter out all PSH labels that were literally in the title. These usually scored well, but
defeated the purpose of the experiment as they were already in each search result;
2. Filter out all PSH labels that were not in the study document. Labels were split by
words, so n-grams did not literally have to occur in the same order in the document;
3. Filter out all PSH labels that had less than 0.02 LSA similarity with the study
document. 1200 components were used for the LSA computations, distance between
word label- and study features were computed with cosine distance;
4. Filter out all PSH labels that had less than 0.01 TF-IDF similarity with the study
document;
5. Filter out all PSH labels where LSA-similarity * TF-IDF-similarity < 0.1 and LSA-
similarity < 0.7 and TF-IDF-similarity < 0.2. This forced a label either to have high
LSA similarity, high TF-IDF similarity, or both to have a reasonable score;
6. The highest scoring tag (LSA-similarity * TF-IDF-similarity * ln(number of papers
attached to label + 1)) was picked as subordinate tag.
The numbers for cutoff points were chosen during development of the method, with the aim
of having the highest possible quality while still being able to label as much studies as
possible. Due to computational resources required for step 1-5, the total set of 48,802 studies
(extracted from BachelorsPortal on 04-04-2016) was randomly split up into 10 subsets. For
8,051 studies no labels were computed, most of these were low-quality studies that were
lowly maintained, and often had only 2 or 3 sentences of generic information (the documents
were significantly shorter than the other studies). As almost all of them were non-sponsored
and had low priority, they often ended up low in the search rankings. Overall, the sacrifice of
not being able to label 16.5% of all studies was worth the increase in quality for the studies
that were labelled.
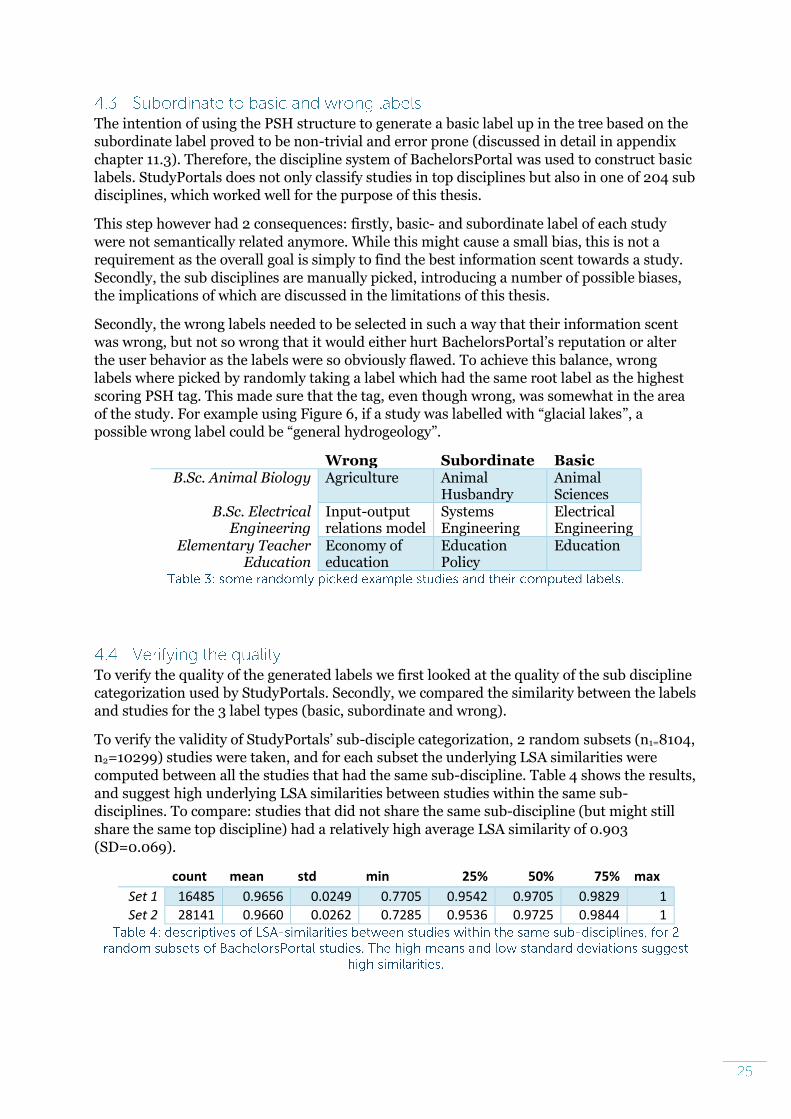
The intention of using the PSH structure to generate a basic label up in the tree based on the
subordinate label proved to be non-trivial and error prone (discussed in detail in appendix
chapter 11.3). Therefore, the discipline system of BachelorsPortal was used to construct basic
labels. StudyPortals does not only classify studies in top disciplines but also in one of 204 sub
disciplines, which worked well for the purpose of this thesis.
This step however had 2 consequences: firstly, basic- and subordinate label of each study
were not semantically related anymore. While this might cause a small bias, this is not a
requirement as the overall goal is simply to find the best information scent towards a study.
Secondly, the sub disciplines are manually picked, introducing a number of possible biases,
the implications of which are discussed in the limitations of this thesis.
Secondly, the wrong labels needed to be selected in such a way that their information scent
was wrong, but not so wrong that it would either hurt BachelorsPortal’s reputation or alter
the user behavior as the labels were so obviously flawed. To achieve this balance, wrong
labels where picked by randomly taking a label which had the same root label as the highest
scoring PSH tag. This made sure that the tag, even though wrong, was somewhat in the area
of the study. For example using Figure 6, if a study was labelled with “glacial lakes”, a
possible wrong label could be “general hydrogeology”.
Wrong Subordinate Basic B.Sc. Animal Biology Agriculture Animal
Husbandry Animal Sciences
B.Sc. Electrical Engineering
Input-output relations model
Systems Engineering
Electrical Engineering
Elementary Teacher Education
Economy of education
Education Policy
Education
To verify the quality of the generated labels we first looked at the quality of the sub discipline
categorization used by StudyPortals. Secondly, we compared the similarity between the labels
and studies for the 3 label types (basic, subordinate and wrong).
To verify the validity of StudyPortals’ sub-disciple categorization, 2 random subsets (n1=8104,
n2=10299) studies were taken, and for each subset the underlying LSA similarities were
computed between all the studies that had the same sub-discipline. Table 4 shows the results,
and suggest high underlying LSA similarities between studies within the same sub-
disciplines. To compare: studies that did not share the same sub-discipline (but might still
share the same top discipline) had a relatively high average LSA similarity of 0.903
(SD=0.069).
count mean std min 25% 50% 75% max
Set 1 16485 0.9656 0.0249 0.7705 0.9542 0.9705 0.9829 1
Set 2 28141 0.9660 0.0262 0.7285 0.9536 0.9725 0.9844 1

To check labelling quality a random study sample (n=7422) was taken and the LSA similarity
between their content and the final basic-, subordinate- and wrong labels were computed,
shown in Table 5. The difference are significant (all p-values < 0.001, see appendix 9.2.1),
suggesting the subordinate labels were “better” in terms of LSA similarity then the basic
labels, which both were a lot better than the wrong labels. The means are closer to 0 then
might be expected; this is due to the low number of words per label as explained in the
beginning of this chapter. Given the statistics of the basic labels, and considering that that is
the result of high-quality manual categorization, the labels can be considered reasonably
good.
count mean std min 25% 50% 75% max
basic 7422 0.222 0.281 -0.364 0.009 0.120 0.398 0.997
subordinate 7422 0.247 0.286 -0.331 0.019 0.145 0.451 0.981
wrong 7422 0.168 0.228 -0.344 0 0.097 0.296 0.964

An experiment was designed to answer the hypotheses and research questions., the design
and implementation of which will be described in this chapter.
Prior to the design of this experiment a pilot study was conducted, which is described in
appendix chapter 11. Overall the pilot study was underpowered but did point into the
direction of the hypotheses. This chapter will further cover the method of the main
experiment: subchapter 5.1 explains the experimental design, 5.2 explains the procedure, 5.3
elaborates on the participants and 5.4 covers the data tracking and processing.
A 4x1 between-subject design with the conditions baseline, basic, subordinate and wrong
was used for the experiment. The baseline served as original, unmodified version of the
website. The basic- and subordinate conditions increased the information scent of the search
result buttons as mentioned in the problem definition, respectively with basic and
subordinate information categorization. The comparison between the behavior and
subjective answers of users between these 3 different conditions allowed us to test the
hypotheses. Finally, a wrong condition was added that used intentionally wrong labels. The
pilot study suggested there might be “button effects”; slight differences in behavior because
the size of the buttons was modified. A condition with wrong labels allowed us to account for
that and other similar effects. Moreover, it allowed to check that the label quality was actually
better than random, as well as indicating the “damage” that an auto labelling system would
do if errors were made in the process.
The modification for the experiment were minimal and only applied to the search page;
participants that were not in the baseline conditions had a modification applied to their
search results. The red button in each study search result tile was modified so it contained the
text “Details (computed label)”, where computed label was replaced with the actual computed
(as described in chapter 4) label, as shown in Figure 7. Non-sponsored studies on
BachelorsPortal don’t have this button, but do have a regular looking link placed on the left
side of each search result, similarly labelled “Detailed Description”, which received the same
treatment.
Initially questionnaire requests where placed on the search page between search result
number 2 and 3 (see Figure 8), and on study pages below the description of the study (Figure
9). Due to a very low initial response rate, the prompts where changed halfway into the
experiment by a popup in the right bottom, which were more constant and salient in the
interface (see Figure 10), while keeping the underlying logics.

Users that clicked the participate button opened a new window that showed the introduction
screen for the questionnaire. A short introduction explained that the questionnaire would
take about 2 minutes and was concerned the search page and search results. It also stated
that 5 Amazon vouchers would be raffled between valid responses. After clicking start, 3
screens where presented:
- A general-question screen asking for age, level of finished education (selection box of
11 different levels, i.e. high school, Bachelor’s degree etc.8) and gender;
- The main question screen asked 13 Likert-style questions to measure the 4 main
concepts of interest for this thesis (explained below);
- A final question screen asked goal related question (explained below), after which
they could leave their email and the questionnaire would be closed.
On the “main question screen”, text on top of the page again explained that all the questions
were about the search page and search results (see Figure 11). The 13 questions were designed
to measure 4 underlying concepts; goal attainment, goal directedness, perceived usefulness
and expertise. The questions on goal directedness (Gomez & Moens, 2014) and usefulness
(Knijnenburg et al., 2012) were constructed based on earlier research, the other 2 concepts
had no good example questions from previous research that could be directly applied. The 13
questions were presented in the order as shown below, though without segmentation
headers.
8 See https://web.archive.org/web/20151112132635/http://www.snapsurveys.com/blog/5-survey-demographic-question-examples/ for all 11 variants that were used.

Goal attainment
- The search helped me find what I was looking for.
- The search helped me to achieve the goal I had when entering BachelorsPortal.
- With the search I found the answer I wanted to find.
Goal directedness
- I already had a particular Study (or University) in mind and just used the search to get
there.
- I had no specific piece of information in mind that I wanted to find, and used the
search to explore.
- I know very specifically what I want to find with this search.
Perceived usefulness
- The search results were useful.
- The search results allowed me to more quickly see what studies interest me.
- The search results saved me time.
- I can find better study programs with the help of the search results.
Expertise
- I'm an expert in the field of study that I searched for.
- I do not know a lot about the field of study that I searched for.
- By seeing a study in the search results I get a good idea what that study is about
On the last question-screen, 3 goal related questions were asked, aimed to measure what
their goal was, how much of that was achieved and how long they believe it took them to do
so:
- What is your goal of using this search; what do you hope to find? [text area]
- To what extend did you complete this goal? [slider, 0 = not at all, 100 = fully]
- How many seconds do you estimate it took to complete your goal from the moment
you entered Bachelorsportal? [numeric input]
The questionnaire was tested with a number of test participants to ensure the questions were
clear and unambiguous. Figure 11 shows a screenshot of the main question screen on a
desktop, appendix 9.1 contains screenshots of the other screens.

-
All users automatically participated once they entered the search page, and were randomly
assigned to one of the 4 conditions. After having seen the condition on the search page at
least once, every subsequent search page page-view had a probability of 0.5 of triggering the
questionnaire request, asking users to participate in a questionnaire. If the questionnaire
request was triggered, the request was presented on search- and study pages until the user
either participated or hid the request. This exponential approach allowed measuring user
responses on different progress levels in their search, as previous research did not indicate a
good point for questioning users.
17,691 users participated in the experiment between 07-04-2016 and 22-04-2016 by seeing
the search page at least once. Users were identified at session level using BachelorsPortal’s
session system, where users stayed in the same session if their last activity was less than 60
minutes ago. Implementation of the experiment was done by Optimizely, leading to slightly
unequal user numbers between conditions (see Table 6). This is due to Optimizely’s aim to
get equal amounts of search page views per condition, while this thesis primarily focusses on
user level aggregation.
basic original subordinate wrong
number of users 4362 4560 4364 4405
completed questionnaires 31 37 40 37

After filtering out all questionnaire-responses which were incomplete or had all the same
answers on the 13 Likert-scale questions (3 in total), 145 valid responses remained, equaling
a response rate of 0.51%. Among participants who completed the questionnaire, 5 Amazon
vouchers worth 30 euros were randomly raffled.
41.4% was male, and the average age was 21.28 years (SD=28.12) (see Figure 19). 61.4%
indicated high school as their highest finished level of education, followed by bachelor
(14.5%) and associate and nursery (both 6.2%) (see Figure 20). Based on IP addresses 62
countries where identified from where the responses came, the countries with the highest
number of participants being India (12), US (12), Germany (10), Pakistan (7) & Italy (6) (see).
Overall this is consistent with BachelorsPortal’s overall user age- (Figure 29) and location
distribution (Figure 32), suggesting the sample is a decent representation of the population
with regard to sociodemographic characteristics.
After several iterations on data tracking, collection and cleaning, a combination of
StudyPortals’ internal business tracking system and Snowplow was used to gather raw user
data. This subchapter will give a quick overview of this process, as a more detailed overview is
not in the direct scope of the project but in interest of StudyPortals, it is added as appendix
chapter 12.
Figure 11 visualizes the process. In the browser of end users, 2 independent JavaScript scripts
manage the tracking of the 2 data gathering pipelines. StudyPortals internal system sends
preconfigured events to their Tracking API, which logs these events (i.e. a tracking click or
study view) into JSON9 files. For business critical events like banner clicks, users are send to
a dedicated redirect page which logs the event, ensuring data quality. These JSONs are
zipped and made available for processing for each day. On average each of these (unpacked)
JSON is between 350-400 MB, containing around 1.4 million events. A python script was
used to process these files and put the results into a MySQL database.
The other data pipeline is a more generic user behavior data tracker based on the open source
software Snowplow10. It is configured to measure page view-, page ping- and click events and
measures a number of variables for each of these events, including timestamp, screen size, IP
address, browser language, several user ids (session ids, global user ids and StudyPortals user
ids), time zones and page referrals. It does so by requesting pixels hosted on Amazon’s AWS
cloud platform, containing all data in the request URL. AWS is configured to log these
request, resulting in ~250 files per day, combining to ~120MB. A python script was used to
parse these files and put them in the same MySQL database. Most of the data used in this
project is from this Snowplow tracker, StudyPortals system is mostly used for business
critical data such as university, study and banner referrals. Where StudyPortals data contains
data for all their websites, the Snowplow tracker only tracks data from Bachelorsportal.
The MySQL database is duplicated, and a number of outliers are removed (see below). A
number of python scripts are then used to query subsets of those data, processing them as
required. Nearly all analysis is done in Jupyter notebooks (Shen, 2014), using pandas as in-
memory data store (McKinney, 2011), MatplotLib as plotting library (Hunter, 2007) and
9 JSON stands for JavaScript Object Notation and is a popular way to save structured data in a human readable way. Valid JSON might look like: {“key”: “value”, “nested”: {“nested key”: “nested data”}} 10 snowplowanalytics.com

SciKit-learn (Pedregosa et al., 2012) & StatsModels (Seabold & Perktold, 2010) for statistical
modelling.
An effort was made to keep as much of the data as possible, mostly because the metrics (like
page views, conversions, dwelling times) are not normally distributed and have a very skewed
right tail. Therefore, even “extreme” cases, for example a user viewing two hundred studies,
can lie within the distribution.
Nonetheless, a small number of user sessions are so obviously flawed that they were
removed. Firstly, 5 sessions converted more than 30 times on the same study which does
seem like a lot (shown in appendix Figure 22). Only one of the sessions participated in the
experiment (original condition) and its conversions were removed (all of them happened in a
time span of 23 seconds).
Secondly, users who viewed the same pages too often were removed. One user viewed an
electronics study 555 times (basic condition), 6 more viewed the same page over 15 times
rapidly (at least 12 times a minute), which was considered outlier behavior as well, 2 of which
were in the wrong condition. Furthermore 1 user in the wrong condition was found to have a
very large number of page ping events (15182), who was excluded from analysis as well.
The final dataset consisted of 120,169 conversions for all portals (66,741 users) and 368,010
page views, 1,130,061 page pings & 102,865 experiment-condition views from 108,341
BachelorsPortal users.

In this chapter the results of the experiment will be presented in regards to the hypotheses.
Only users that saw the search page with modification at least once are taken into
consideration for this analysis. For most of the results all the 4 conditions of the experiment
will be analyzed at the same time;
- Original for all users who had no modifications, and serve as the baseline
- Basic for all users who saw modified, highly scenting buttons with basic information
categorization
- Subordinate for all users who saw modified, highly scenting buttons with subordinate
information categorization
- Wrong for all users who saw modified buttons with wrong labels
Even though the wrong condition is not necessary to answer the hypotheses most of the time,
it will be used later to reflect upon the quality of the basic and subordinate conditions.
Starting with users’ behavior on the search page, it was expected users viewing higher
scenting links have a lower click-through rate (CTR) from search to study (H1), but have a
higher clicking likelihood, meaning they are more likely to click on at least one search result
(H2).
A search page view was defined as the presentation of a new result set on the search page, so
pagination and filtering also resulted as one page-view count each. Study page views were
defined by study page which were referred from the search page. As we are most interested
in the studies users engage with from the search results, any study page views that did not
originate from the search page were left out. This also left out study page views that were
opened in a new tab; as their requests do not contain URL referrers it is hard to determine
where the requests came from (0.102 of all study page views had no referrer).
The search-study CTR is then defined as the number of study views divided by the number of
search page views. Table 7 describes this statistics per condition. The slight user count
discrepancy with Table 6 is due to points in time when events are registered: participation
events are recorded before page view events, some users left in between those events.
count mean std min 25% 50% 75% max
original 4547 0.266 0.516 0 0 0 0.353 9
basic 4350 0.250 0.487 0 0 0 0.333 7.5
subordinate 4355 0.236 0.455 0 0 0 0.333 8
wrong 4396 0.261 0.533 0 0 0 0.333 11
To estimate the size and significance of each condition on CTR, a negative binomial
regression is used. The reason for this can be seen in Table 7: the shape of this metric (as with
other metrics discussed below) is over-dispersed. This means the variance is larger than the
mean when it should be roughly equal, and a negative binominal distribution fits the
situation well as it is specialized in handling over-dispersed data.

The results are shown in Table 8. The distribution goodness of fit was significant (χ32= 9.49, p
= 0.0234). A simple condition coding (sometimes referred to as effect coding) was used
instead of dummy encoding, as it isolates the effect of each manipulation, making it easier to
analyze coefficient sizes (Alkharusi, 2012).
Both the basic - and subordinate high scent conditions point into the direction of H1, though
only subordinate is significant. The wrong condition points in the opposite direction: users in
the wrong condition view more studies per search. Based on these results H1 was found to be
partially confirmed, as the data points in the expected directions, but only subordinate does
so significantly. This does suggest that the higher information scent leads to users exploring
less options. As this is congruent with the IFT findings, it might mean they click on studies
that better fit their goal, and end up on wrong studies less often.
To check for H2 (higher scent resulting in higher CTR likelihood, meaning users are more
likely to click on at least one search result) a Chi-Square test was run, shown in Table 9. It
resulted in an insignificant effect (χ32= 4.79, p = 0.188), indicating that CTR likelihood does
not depend on condition.
original basic wrong subordinate
No 2587 (56.9%) 2490 (57.2%) 2571 (59.0%) 2531 (57.6%)
Yes 1960 (43.1%) 1860 (42.8%) 1784 (40.1%) 1865 (42.4%)
A logistic regression was run to check for the direction of each condition and check its
significance (see Table 10), with McFadden’s R² statistic being low (R²=0.0002). H2
expected basic and subordinate to have higher CTR likelihood, basic does point into that
direction but is not significant. Subordinate condition was significant, but points into the
other direction: less users click at least one search result in the subordinate condition. Based
on these results and the overall insignificance of the test, H2 was not supported. This
suggests that subordinate information scent might “scare” away users that would have
otherwise inspected at least one search result. Moreover, high information scent does not
seem to convince users to engage with a higher probability; those who were not interested are
still not.
11 http://patsy.readthedocs.io/en/latest/formulas.html

As the information scent is expected to allow users to select studies that better suite their
goal, dwelling times (amount of time spend on a page) are expected to be larger for study
pages (H3). Secondly, scent should lead them to clicking one of the studies faster, reducing
dwelling time on search pages (H4). Dwelling times are measured as events that are trigged if
a user actively engaged with a page within a timeframe. The first dwelling time event is
triggered 30 seconds after page load, the next ones are triggered every 10 seconds.
To measure H3, we first looked at the number of dwelling time events per user per search
result they visited. 3 outliers were removed that were very large (203 & 539 in the original
condition, 606 in the wrong condition). Table 11 shows the descriptive statistics, and again
shows a very skewed distribution.
count mean std min 25% 50% 75% max
original 3630 2.339 3.676 0 0 1 3 38
basic 3740 2.534 4.109 0 0 1 3 45
subordinate 3463 2.378 3.617 0 0 1 3 48
wrong 3598 2.336 3.555 0 0 1 3 44
Table 12 shows the results for the negative binomial regression results, of which the
distribution goodness of fit was significant (χ32 = 8.56, p = 0.0375) but McFadden’s R-squared
low (R²=0.0001). The results partially support H3: higher scent with basic information
categorization leads to higher dwelling times on study pages. The subordinate and wrong
conditions both appear to negatively influence study page dwelling time, but aren’t
significant. This is in congruence with the IFT and suggests that high, basic information scent
helps users select better links, after which they show more interest in the content they picked.
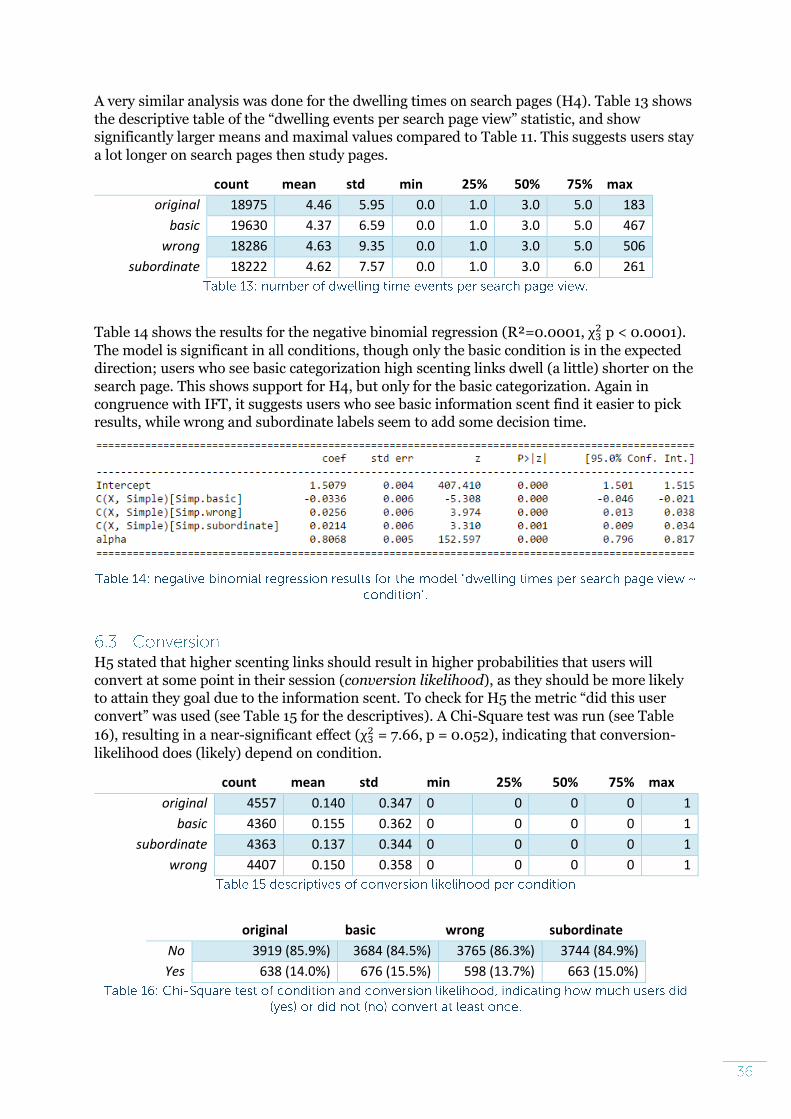
A very similar analysis was done for the dwelling times on search pages (H4). Table 13 shows
the descriptive table of the “dwelling events per search page view” statistic, and show
significantly larger means and maximal values compared to Table 11. This suggests users stay
a lot longer on search pages then study pages.
count mean std min 25% 50% 75% max
original 18975 4.46 5.95 0.0 1.0 3.0 5.0 183
basic 19630 4.37 6.59 0.0 1.0 3.0 5.0 467
wrong 18286 4.63 9.35 0.0 1.0 3.0 5.0 506
subordinate 18222 4.62 7.57 0.0 1.0 3.0 6.0 261
Table 14 shows the results for the negative binomial regression (R²=0.0001, χ32 p < 0.0001).
The model is significant in all conditions, though only the basic condition is in the expected
direction; users who see basic categorization high scenting links dwell (a little) shorter on the
search page. This shows support for H4, but only for the basic categorization. Again in
congruence with IFT, it suggests users who see basic information scent find it easier to pick
results, while wrong and subordinate labels seem to add some decision time.
H5 stated that higher scenting links should result in higher probabilities that users will
convert at some point in their session (conversion likelihood), as they should be more likely
to attain they goal due to the information scent. To check for H5 the metric “did this user
convert” was used (see Table 15 for the descriptives). A Chi-Square test was run (see Table
16), resulting in a near-significant effect (χ32 = 7.66, p = 0.052), indicating that conversion-
likelihood does (likely) depend on condition.
count mean std min 25% 50% 75% max
original 4557 0.140 0.347 0 0 0 0 1
basic 4360 0.155 0.362 0 0 0 0 1
subordinate 4363 0.137 0.344 0 0 0 0 1
wrong 4407 0.150 0.358 0 0 0 0 1
original basic wrong subordinate
No 3919 (85.9%) 3684 (84.5%) 3765 (86.3%) 3744 (84.9%)
Yes 638 (14.0%) 676 (15.5%) 598 (13.7%) 663 (15.0%)

Table 17 shows the result of the logistic regression (R²=0.0005), and shows significant effects
for basic- and subordinate level information scent: basic resulted in a higher probability that
users converted at least once, subordinate resulted in a lower probability. H5 seems partially
supported by this data and shows that replacing links without scent for highly scenting links
with basic information categorization might assist websites in increasing their business
metrics.
As users are expected to find their goal quicker with higher information scent, they are
expected to convert less often (H6). To check for this hypothesis, 2 metrics are considered:
the conversion count for a user (see Table 20 for descriptives), and the conversion CTR per
study page view (see Table 21 for descriptives). While technically the first metric would test
H1.1, it introduces a bias as users viewing more studies will in general convert more, hence
the latter metric to verify the results.
Table 18 shows the results for the regression of conversion count as dependent variable and
condition as independent variable (R²=0.0005, χ32 =10.48, p=0.015). Only basic information
categorization results in significantly more conversions (contradicting H6), the other 2
conditions’ p-values are too high to say something sensible. The conversion CTR test that is
used as validation (probability that a user converts given per single study page view, leaving
out all users with 0 conversions) is shown in Table 19. The insignificant goodness of fit (χ32 p
= 0.89) and insignificant alpha indicate that the negative binomial distribution might not be
the right distribution. This is unexpected given that the metric is over-dispersed and the
histogram looks like a traditional negative binomial distribution as shown in appendix Figure
23. For this reason the statistic will only be used to confirm the findings of Table 18 and make
sure there is no “more study pages viewed bias”. A quick comparison between Table 20 &
Table 21 show great proportional similarities in means, indicating the absence of a bias.
Based on these results, H6 is not supported: basic categorization users convert more often
than users in the baseline, no sensible conclusion can be drawn for the other conditions. This
is in congruence with the findings of H5 and might suggest an overall increase of business
performance when low scenting links are replaced with high scenting, basic links.

count mean std min 25% 50% 75% max
original 4558 0.284 1.047 0 0 0 0 20
basic 4362 0.352 1.284 0 0 0 0 23
wrong 4407 0.304 1.054 0 0 0 0 17
subordinate 4364 0.297 1.151 0 0 0 0 29
count mean std min 25% 50% 75% max
original 4558 0.0200 0.0765 0 0 0 0 1
basic 4362 0.0242 0.0938 0 0 0 0 1
wrong 4407 0.0239 0.0931 0 0 0 0 2
subordinate 4364 0.0208 0.0897 0 0 0 0 3
Based on previous research in IFT it was expected that users would not only need less time to
complete their goal (H7), but also perceive it to be lower (H9) when information scent is
higher. To check for H7, the minimal and maximal timestamp of each session were used to
create a session-timespan. Some browsers appeared to have triggered events with old session
ids, even days after their sessions ended. This made us filter out all sessions with timespans
higher than 3 hours, which manually inspection showed to be a good cutoff point. The
descriptives are stated in Table 22, a negative binomial regression showed no differences in
session time per condition as shown in Table 23, and shows no support for H7. Apparently
higher information scent did not significantly increase or decrease session time, which might
suggest it did also not affect goal finding time.
count mean std min 25% 50% 75% max
basic 4576 746.1 1198.5 0 65 270 892.75 11390
original 4766 748.6 1239.1 0 64 263 890.75 12943
subordinate 4569 721.5 1205.6 0 56 250 868 13048
wrong 4646 715.7 1144.3 0 56 252 865.5 13957

To check for H9, the time-estimation given by users was used. Quite a number of participants
set the values really high (over a million) or invalid (text or empty), leaving 101 valid
responses which are shown in Table 24. While the data is not over-dispersed, a histogram
(Figure 23) shows it’s far from normally distributed. The alpha significance and coefficient of
the negative binomial regression indicate the negative binomial to be a good fit (see Table
25).
count mean std min 25% 50% 75% max
original 27 165.26 176.01 2 30 80 290 600
basic 23 223.57 235.67 2 45 120 300 900
subordinate 26 192.88 172.85 4 90 120 300 600
wrong 25 229.08 211.65 5 60 120 300 600
Besides the alpha, the test (McFadden’s R²=0.0012, χ32 p=0.67) does not show significant
results: none of the conditions is a significant predictor for estimated goal attainment time,
leaving H9 unsupported. In congruence with the results of the session times, this suggest the
increased information scent did not alter the goal finding time in a significant way.
In order to check for the hypothesis concerning subjective measures (H8-H10), the
questionnaire responses were analyzed with a principal component analysis and Oblimin
rotation. After excluding a number of questions from the dataset 2 strong components
remained instead of 4 as expected, explaining 0.61 of all variance (eigenvalues 4.17 and 1.32).
The Kaiser-Meyer-Olkin measure of sampling adequacy (KMO-test) is 0.87, indicating that
the patterns of correlations are relatively compact and the PCA yields reliable factors.
Furthermore Bartlett’s test of sphericity suggests correlations between variables are
significantly different from 0, which is good (χ362 =472.37, p<0.0001). The 2 components
have a low, insignificant Pearson correlation: r=0.04, p=0.61.
This resulted in 4 out of the 13 questions being dropped, as the PCA showed they either
loaded poorly in one of the 2 components (< 0.3), or they cross loaded highly between

multiple components. The remaining 2 components are presented in Table 26. Component 1
was interpreted to be the factor goal attainment/usefulness, as it scores high on questions
like “The search helped me find what I was looking for” and “The search results were useful”.
Component 2 was interpreted as (the lack of) directedness/expertise, scoring high on the 2
questions “I had no specific piece of information in mind that I wanted to find, and used the
search to explore.” & “I do not know a lot about the field of study that I searched for.” The 4
questions that were dropped were:
- I already had a particular Study (or University) in mind and just used the search to get there.
- I know very specifically what I wanted to find with the search. - I can find better study programs with the help of the search results. - I'm an expert in the field of study that I searched for.
It was expected that the factors in both pairs would be very close together: all hypotheses
expected perceived goal attainment and usefulness to be effected in the same way. For
expertise and directedness, H13 suggested that they were closely related, and while this
makes it impossible to test for H13, it still allows for analytics regarding information scent,
categorization and directedness. The goal attainment/usefulness component appears to be
quite strong, with a high load from multiple questions. The expertise/directedness
component seems less strong, as 3 out of 4 questions that were removed came from that
angle. Moreover, the 2 remaining questions in the component seem to be measure some “I
don’t know” like attitude. Combining these 2 facts, the second component could be
measuring something related to directedness, but slightly different. These implications are
covered in the discussion.
The two extracted components were used to test for the hypotheses regarding subjective
measures. Their descriptives per condition are stated in appendix & .
Component
1 2
The search helped me find what I was looking for. ,756
The search helped me to achieve the goal I had when entering BachelorsPortal. ,766
With the search I found the answer I wanted to find. ,783
I had no specific piece of information in mind that I wanted to find, and used the
search to explore. ,776
The search results were useful. ,819
The search results allowed me to more quickly see what studies interest me. ,788
The search results saved me time. ,808
I do not know a lot about the field of study that I searched for. ,789
By seeing a study in the search results I get a good idea what that study is about. ,665 ,275

It was expected that higher scent would lead to higher perceived goal attainment (H8) and
usefulness (H10). As the dependent variables for both hypotheses are captured in the same
component goal/usefulness, both can be tested with a single ANOVA-test shown in Table 28.
The descriptives are stated in Table 27.
count mean std min 25% 50% 75% max
original 34 0.0156 0.8821 -1.908 -0.612 -0.043 0.679 1.544
basic 31 0.0844 0.7920 -1.128 -0.476 -0.027 0.637 1.546
subordinate 38 0.0264 1.1720 -3.417 -0.450 0.169 1.052 1.546
wrong 37 -0.1122 1.0923 -3.821 -0.507 -0.031 0.458 1.547
Overall it performed poorly, with R² = 0.005 and an F-statistic of 0.27 (p=0.87). A possibility
could be the unequal sample sizes and skewness of the data distribution (kurtosis=4.55,
skewness=-0.84). Three potential outliers with very negative scores were removed (resulting
in kurtosis=2.55, skewness=-0.05) which did not result into any significant insights.
Moreover, a non-parametric Kruskal-Wallis test was used to verify the findings, as it does not
depend on the assumption of normally distributed data. It found no significant difference in
means (χ32=0.96, p=0.81). Based on these results, both H8 and H10 are not supported,
meaning no support could be found for the hypothesis that higher information scent leads to
higher perceived goal attainment or perceived usefulness. It also shows no support for H11
(from a subjective point of view): neither the basic nor the subordinate conditions differ
significantly from the original, and seen that they both point into the same direction, do also
not differ from each other. This might indicate that an increase in information scent in the
detailed form that it was done in this experiment has no effect on the perceived usefulness or
perceived goal attainment.
In one of the questions participants were asked to indicate to what percentage they
completed their goal (see Table 29 for descriptives and appendix Figure 25), as an
independent question different from the questions used to extract the factors. Its correlation
with the goal/usefulness factor was reasonable (0.59) but showed no significant differences
between the conditions in an ANOVA (see Table 30) (R²=0.018, F(3) = 0.80, p=0.49). This
enforces the statement that H8 is not supported by this data.

count Mean std min 25% 50% 75% max
original 32 75.22 19.91 21 65.25 74.5 89.25 100
basic 29 70.38 21.30 26 57 71 88 100
subordinate 37 66.54 26.82 9 52 72 85 100
wrong 35 69.46 24.28 7 59.5 70 86.5 100
To test whether directedness moderates the effect between condition and the goal/usefulness
factor (described in Table 32), an OLS regression was done, shown in Table 31 (F(7)=0.33,
p=0.94). It showed no significant interactions from directedness/expertise on
goal/usefulness, and shows no support for H12 from the subjective point of view. This
suggests there is no evidence that goal directedness affects the preference for basic or
subordinate information scent, though we argue in the discussion that this could be due to
small effect sizes combined with a limited sample size.
count mean std min 25% 50% 75% max
original 34.0 0.104 0.931 -1.922 -0.497 -0.044 0.698 2.138
basic 31.0 -0.247 1.289 -2.817 -1.072 -0.263 0.489 2.027
subordinate 38.0 0.038 0.852 -1.359 -0.567 -0.065 0.435 2.219
Wrong 37.0 0.073 0.930 -2.169 -0.295 -0.106 0.786 2.027

From the objective perspective, all the tests done to test for H1-H6 were repeated for the
users who answered the questionnaire, with the factor expert/directedness added as
interaction. Due to the relatively low number of participants (making the data behave more
unexpectedly) and the fact that this is a copy of the analysis already done, only the regression
results will be stated in the appendix and summarized here.
Out of the 6 tests (Table 47 - Table 52) only one, with study dwelling time as dependent
variable resulted in a somewhat significant model (p=0.095), where subordinate*expert was
the strongest interaction (coefficient=-0.37, p=0.096); in the expected direction but not
significant. This however does not tell much; the tests done for H1-6 did show significant
results, the fact that they did not appear here is most likely due to the low number of
participants combined with the small effect sizes that could be expected based on effect sizes
of the behavioral data.
To predict expertise of all users and perhaps draw stronger conclusions, an attempt was
made to generate a regression model that would predict the expertise level based on user
characteristics described before. Too little variance was explained by these variables however
(R2 =0.145), and going to great lengths to compute extended features for this model is
unfortunately outside the scope of this project. The implications of this are discussed in
chapter 7.2.
H11 & H12 are only partially covered up until this point, as they are only answered from a
subjective point of view. In this subchapter we’ll try to connect the subjective and objective
data to answer H11 & H12 and check the assumptions made in chapter 3. In the process we’ll
take a look at the goals users entered in the questionnaire as well as button versus study
name link choice on the search page. Hopefully these statistics will tell something more about
the research questions, as they are not directly stated in the hypotheses but are closely related
and potentially influential.
In the pilot the metric of dropout locations (pages were users end their session) showed
interesting patterns and suggested that users ended their session more often on the search
page if the original buttons were shown (see appendix chapter 11.4.3.4). This dropout
indicates where users either satisfied their information needs or lost the confidence of doing
so and is therefore relevant for this analysis. However, the data of the main experiment
showed no significant differences between conditions (see appendix Figure 24) and is
therefore left out of this analysis.
Manual inspection showed that out of 190 users who answered this question only about a
dozen users were somewhat specific in their preferences (“.. B.A. in Filmmaking or
Photography...”, “…highly interested in Game Design/Development Courses..”), having a
goal that was similar in level as the labels in the basic condition. Two goals were so specific
that the subordinate labels might have assisted better (“I want to be a Sign Language
Interpreter…”). Most of the goals however were pretty generic (“suitable university for me”,
“Everything I need, the requirements for me to study abroad.”). Overall this suggests
something about the general level of directedness of the participants, which might be lower
than anticipated when the studies were labelled.

Figure 13 displayes a visualized network of comments, where distance between comments is
computed with LSA. This explorative analysis shows about 8 clusters that are identified by
keywords, ranging from clusters focussed on “university” & “bachelor” to “right” & “good”.
There appeared to be no significant differnence between conditions regarding the goal they
were after (shown in appendix Figure 27 and Figure 28). This visualization indicated that
users might not actually be looking for something specific as most of them seem to cluster
together around very generic topics.

An explorative analysis was done on the user defined goals by extracting ten LSA factors (see
appendix chapter 9.2.5.1), that had some interesting relations with previously covered
measures. Appendix Table 39 trough Table 43 show a number of regressions that show these
effects, summarizing the main results:
- Factor 0 (university, study, course, good, field, interest) has a positive effect on the
goal/usefulness factor (p=0.03, coefficient=0.36), and for younger users (coefficient
=-1.41, p=0.08). Apparently, users with a general goal that satisfied their interest (i.e.
not “find the best university” but “find a good university that offers interesting
courses”) find BachelorsPortal more useful.
- Factor 2 (University, -course, -field, right, best, good) has a negative effect on search
page view counts (p=0.007, coefficient =-2.0) and estimation of seconds used to
complete goal (p=0.006, coefficient =--1801). Apparently, users who are looking for a
good university use less searches and subjectively need shorter to complete their goal;
- Factor 3 (Field, -study, future, -good, life, -degree) has a positive effect on conversion
likelihood (p=0.004, coefficient =0.23), suggesting that users interested in a certain
field and a focus on their future life’s as more likely to convert.
Overall this LSA reduction showed that the user goals were quite general, making a more in-
depth LSA similarity between links that a user clicked and their goal less interesting; only a
handful of goals were specific enough to have any similarity. This suggests something about
the overall goal (and therefore directedness) of the users: they are relatively general and
subordinate information scent might be too specific and might not even be in their
knowledge space. This is further elaborated in the discussion.
In each search result, such as the one in Figure 1, users have 2 possibilities to access the
study: either by clicking on the name of the study, or by clicking on the button. What is left
unconsidered up until this point is how users accessed the study: do they click the button or
the link, and how does this differ over the different conditions?
In total 6,827 clicking events were tracked, only a fraction of the 90,745 study pages viewed
with search as the referrer. This difference is most likely because the event is triggered when
the browser starts navigating, and some browsers do not allow or stop those kind of requests.
To make sure this didn’t cause too much bias (i.e. only non-mobile devices registering clicks)
a number of comparisons were done between sessions that did register clicks and those that
did not. No indication of such a bias could be found.
The measure is described Table 33, and shows that users in the baseline condition click
significantly more often on the button compared to all others. A logistic regression was run
and confirmed these results (McFadden’s R²=0.005, χ32 p<0.0001, see Table 34). This is
somewhat surprising given previous found effects: users in the unmodified condition click
the button more often! This suggests that users might be more hesitant to click the buttons
when specific labels are put into them, though only the wrong condition was found to be
significant, allowing for the possibility that it might depend on the quality of the label.
Combining this finding with the previous results suggest that the button modification
changes the scent of the complete patch (being one search result) and does assist in drawing
users’ attention to the right search result, even though they seem to have a preference to
interact with the search result via the title link.

basic original subordinate wrong
No 1230 (74.1%) 1158 (67.9%) 1197 (75.1%) 1440 (76.9%)
Yes 429 (25.9%) 546 (32.0%) 396 (24.9%) 431 (23.0%)
In chapter 3 two assumptions were made: that high interest in content means higher goal
attainment, and higher usefulness. These were used to construct hypothesis 1-6, and
attempted to connect objective to subjective behavior.
To test whether these assumptions were correct the metrics used for H1-6 were used as
predictors for the 2 found subjective factors and the user-estimated goal completion.
Appendix 9.2.5.3 contains the detailed regression results. Using backwards stepwise
regression only a significant model for the directedness/expertise factor was found
(F(6)=4.63, p = 0.003, R²=0.53). In this model, s_pp is page dwelling events per search visit
& conv_study_count_prem is the count of premium conversions on study pages.
Overall this suggests that directedness is measurable from behavior: they convert more,
search a little more (different queries, less paging) and dwell a little longer on search pages,
while dwelling a little shorter on study pages. For goal achievement no model could be found,
leaving the assumption unsupported.

The information foraging theory (IFT) predicts how users behave on webpages based on the
goal they are after, and has been validated over different studies with different conditions (Fu
et al., 2007; Pirolli & Card, 1999). These studies often find that users browsing websites with
better, higher information scent are more likely to attain the goal they are after and have a
better experience (Mccart et al., 2013; Rigutti et al., 2015). In an exploratory research of
BachelorsPortal, a website where users can search and find detailed information about more
than 49.000 bachelor studies worldwide, links with no information scent on important places
in the user interface were found.
Based on the IFT, and the desire to continuously improve BachelorsPortal to better assist
users in their search for the perfect study, a method was proposed that allowed
implementation of the IFT. By taking the content of a study and computing the optimal labels
the information scent should be better, and it should become more attractive for users to
engage with studies they are close to the goal they are after.
An experiment was proposed and ran on BachelorsPortal for two weeks, modifying the
information scent of buttons in search results. For the construction of these labels the theory
of categorization (Johnson & Mervis, 1997) was used, with the hypothesis that more directed
users were better served with subordinate (specific) labels, while in general basic (more
abstract) labels would work better. A fourth “wrong” condition with faulty labels was added
to rule-out button effects and validate label quality.
Thirteen hypotheses were defined and tested with the data gathered from the experiment.
This chapter will summarize those results to answer the two sub-research questions,
elaborate on the limitations of this study and present a final conclusion and possibilities for
further research.
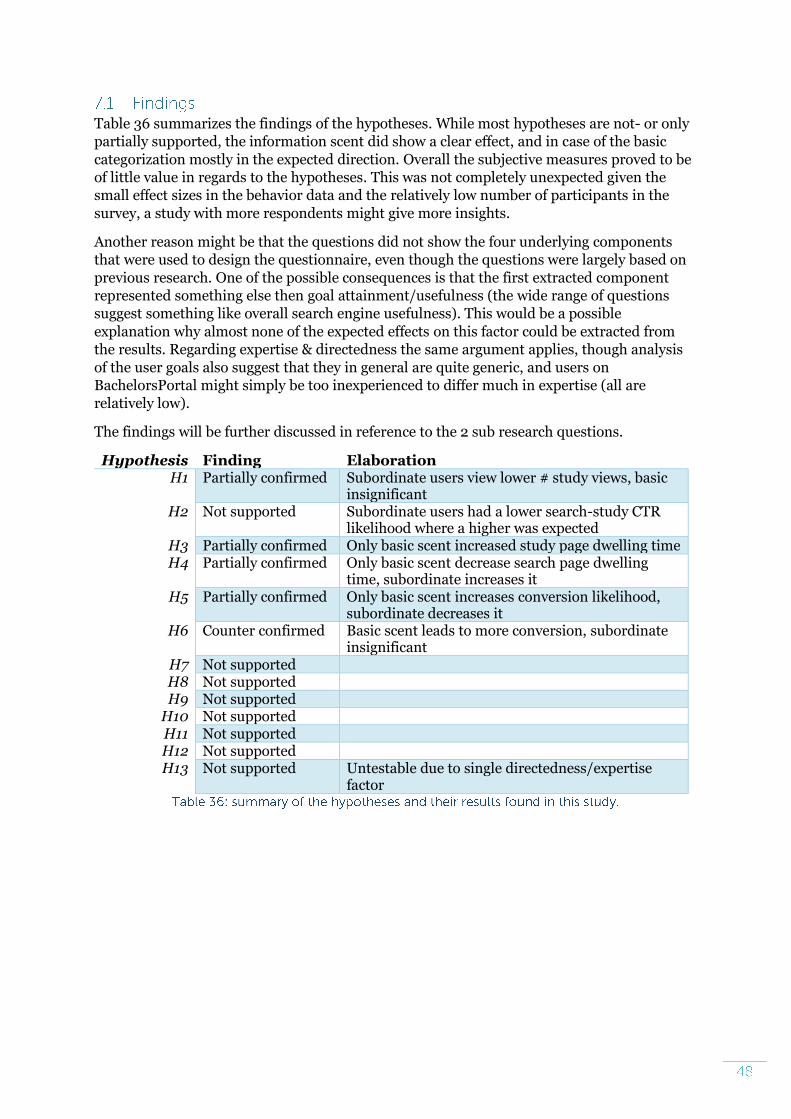
Table 36 summarizes the findings of the hypotheses. While most hypotheses are not- or only
partially supported, the information scent did show a clear effect, and in case of the basic
categorization mostly in the expected direction. Overall the subjective measures proved to be
of little value in regards to the hypotheses. This was not completely unexpected given the
small effect sizes in the behavior data and the relatively low number of participants in the
survey, a study with more respondents might give more insights.
Another reason might be that the questions did not show the four underlying components
that were used to design the questionnaire, even though the questions were largely based on
previous research. One of the possible consequences is that the first extracted component
represented something else then goal attainment/usefulness (the wide range of questions
suggest something like overall search engine usefulness). This would be a possible
explanation why almost none of the expected effects on this factor could be extracted from
the results. Regarding expertise & directedness the same argument applies, though analysis
of the user goals also suggest that they in general are quite generic, and users on
BachelorsPortal might simply be too inexperienced to differ much in expertise (all are
relatively low).
The findings will be further discussed in reference to the 2 sub research questions.
Hypothesis Finding Elaboration H1 Partially confirmed Subordinate users view lower # study views, basic
insignificant H2 Not supported Subordinate users had a lower search-study CTR
likelihood where a higher was expected H3 Partially confirmed Only basic scent increased study page dwelling time H4 Partially confirmed Only basic scent decrease search page dwelling
time, subordinate increases it H5 Partially confirmed Only basic scent increases conversion likelihood,
subordinate decreases it H6 Counter confirmed Basic scent leads to more conversion, subordinate
insignificant H7 Not supported H8 Not supported H9 Not supported
H10 Not supported H11 Not supported H12 Not supported H13 Not supported Untestable due to single directedness/expertise
factor

With increase of information scent, it was expected that goal attainment and usefulness
would improve. A number of the objective metrics supported this for the basic categorization
condition:
- Spend more time on study pages;
- Spend less time on the search page;
- Have a higher conversion likelihood;
What was not expected was that there was no difference in search-study CTR, apparently
information scent in the search result button could not trigger more users to explore studies.
This suggests information scent only works if there already is some sort of motivation.
Secondly, users in the basic condition converted more, where it was expected they converted
less often. A possible argument for this finding could be that the underlying assumption was
not valid. Conversion might not be a definitive study-choice action, but merely an extra step
in the study choice process. In that sense, conversion might just be an indication of interest,
just like longer dwelling times on a study page are.
The findings for the subordinate condition are somewhat harder to interpret. Generally, it
was expected to behave worse than the basic condition, what we found was that users:
- Have lower search-study CTR & search-study CTR likelihood;
- Dwell longer on the search. As the wrong condition has almost the same effect size, it
might be due to the added complexity, not the actual quality of the labels;
- Are less likely to convert at least once.
These findings suggest that the subordinate tags might have been too complex, as users
needed longer to process them and do not appear to pick better studies based on the labels.
A rather unexpected finding in this experiment was that the whole concept of IFT initially
was based on the idea that users would actually click the button with higher information
scent. We found the exact opposite: users clicked the button less and the title of the study
more (only significant for the wrong condition). This may suggest that the labels did not help
by being the best link, but by making the scent of the patch higher, though the evidence for
this evidence is not that strong.
To answer research question 1: behavioral measures suggest basic level information scent
improves goal attainment and usefulness. These results could not be reproduced with
subjective metrics, though it is likely due to the low number of participants, or the absence of
an effect in the users’ perception. And as the subjective results are insignificant but the
objective interest indicators are, we can conclude the modifications might not help on
subjective experience, but certainly also do not work counterproductive. This makes reversed
information scent a viable solution for information scent issues which can be used to increase
important user metrics and overall website usefulness. Determining the user’s expertise level
and balancing the categorization of the labels is critical however, and basic-level
categorization will most likely work best, unless users have a high expertise. The different
processes in label construction could also have played a role in this; perhaps the human
generated labels were better even though their LSA score was lower. This is one of the
limitations in this thesis (covered in chapter 7.2), which cannot be tested with the available
data.

It was expected that highly directed users were better supported with subordinate-level
information scent, while less directed users were better served with basic information scent.
Overall we found no support for this theory as statistical tests proved to be insignificant. So
while there is little statistical support for this question, a straight-forward argumentation can
be made that suggests possible support for out hypotheses.
As shown in the analysis of the goals defined by users themselves (chapter 6.6.1), about 90%
of the users had goals that were so generic that even the basic-level tags might have been too
specific, as they really seemed to be exploring their initial options and interests. Only about a
dozen where somewhat specific, and 2 were very specific. This suggests that the overall level
of directedness is relatively low for BachelorsPortal users. So low in fact that the subordinate
labels will have a more negative effect then the basic (and in some cases even the original)
condition. This is also what the results showed: the subordinate results were either
insignificantly different from the original, or in the opposite direction of the hypotheses.
In conclusion; the data does not show a strong, direct effect of directedness on preference for
subordinate-level tagging. It is however plausible that the effect exists, and we overestimated
the variance of directedness between users in the design of this experiment. This can be
generalized to the statement that basic information scent might be the best choice when
trying to improve hyperlink scent, except in the (perhaps rare) case when users are highly
experienced in the information field they are searching in.
The findings of this thesis can be partly explained by a number of limitations, which will be
elaborated here.
Firstly, reflecting on the results the subordinate labels might have been too complex, and the
experiment would have benefitted from less complex (though still subordinate) labels.
Different labelling processes in the pilot and the main experiment combined with the low
power of the pilot hid the fact that users generally might be undirected in their search on
BachelorsPortal.
Secondly, the quality of the labelling process was found to be reasonable, but might benefit
from a number of improvements. The results of the wrong condition indicate significantly
better quality of the labels then random though, thus it is likely significant improvements can
be made. More complex algorithms like (Nie et al., 2014; Sood et al., 2007) could improve the
overall quality and make the process independent and unsupervised. Another point in the
labelling process is the different labelling methodologies used for the basic- and subordinate
condition. The first is human, the second automated, both constructed on different label-sets
which were constructed for different purposes. One tightly managed by StudyPortals, the
other quickly scanned for computational verification. This might have caused biases which
cannot be checked for with the gathered data.
Thirdly, the survey responses caused a number of problems. The directedness factor for
example, previously tested by (Gomez & Moens, 2014), could not be extracted at all, and the
well-proven factor of usefulness (Knijnenburg et al., 2012) could not be isolated. As discussed
before, a study with more information scent modifications combined with a larger number of
survey responses could assist in better answering questions regarding subjective metrics.

Which touches the fourth point; user behavior metrics that were analyzed in this thesis only
predict a small percentage of the variance of the 2 subjective factors (less than 5% for goal
attainment/usefulness, 14.5% for directedness/expertise). This suggests we might have
missed user metrics that differ greatly between users with higher goal attainment/usefulness
or directedness/expertise from which stronger conclusions could have been drawn. The
metrics used here however are very similar to the ones used in these types of research before
(Mccart et al., 2013) and it is possible that some of the variance simply cannot be extracted
from user behavior.
Fifthly, the experiment was implemented on a very specific location, making it hard to argue
that its results are applicable in every situation. The search page of BachelorsPortal can be
seen as the “heart” of the website, which has the advantage of a lot of visitors, but the
disadvantage of low user directedness with a very wide range of motivations and goals. While
previous information scent research like (Blackmon et al., 2002; Blackmon, 2012b; Rigutti et
al., 2015) suggests similar effects found in this study also apply to different websites, it is
possible that users respond differently to these kind of information scent modifications on
different pages.
Finally, the target group limited the focus in a number of ways, again introducing uncertainty
whether these results can be generalized. Most obviously, users are targeted that are looking
for a bachelor study, which in itself implies all kind of user characteristics such as age (Figure
29), educational background (Figure 20), economical welfare and location (Figure 32). Again,
similarity between results of this study and previous work such as (Mccart et al., 2013)
suggest that the results found here will work for users with other characteristics as well.
Besides the objective measures, the way in which participation was requested biased the
questionnaire responses towards users that were motivated by financial rewards and willing
to participate. As it was only such a small percentage of the users (0.51%), event with obvious
popups, they might not have been a good representation of the whole population.

Given the conclusions drawn from sub-research questions and the studies limitations, a final
conclusion regarding the main research question is made here, and possibilities for future
research are suggested.
Overall, the aim of this study was to answer the question
Can increased information scent in hyperlinks be used to let users find the
information they are after more efficiently and effectively? Which level of
information categorization works best when increasing information
scent, and how is that affected by goal directedness?
The first part of this research question is already answered in 7.1.1, which suggested that
reversed information scent might indeed assist users in their search for certain information.
Especially user behavior showed significant improvements in desirable behavior (both from a
company and user perspective), suggesting information scent might be a good tool for
information websites. Regarding directedness and information categorization, results of this
study suggests that in alignment with earlier categorization studies (Johnson & Mervis, 1997;
Kim, Porter, & Goolkasian, 2014), basic information scent is preferred over subordinate
information scent. Basic categorized information scenting hyperlinks lead to behavior that we
expected to match goal attainment and usefulness: less time used searching, more interest in
the chosen studies & higher conversion. This could not be reproduced with subjective
metrics, where no significant effects of the different experimental conditions could be
detected. While these results in combination with the limitations presented above do not
make the most solid case, reversed information scent has proven to be a promising technique
to improve information scent in places where little is in place.
We suggest this is the most interesting idea to be extracted from this thesis, and worth
continuing to build on. One of the current limitations, the algorithm for auto labelling, is one
of the area’s where improvements can be made. Now that the underlying idea has shown its
potential more effort can be put into this as significant improvements are very plausible.
These results also suggest that one level of categorization might work fine for websites where
there is not too much variance in user directedness and expertise level; a metric worth
checking before constructing a labelling process.
Another main area that can benefit from further research is the subjective effects of
information scent. Up until this point IFT has mostly been a mathematical model, and
besides some usability studies that almost appeared more mandatory then a main focus
point, no real effort was done to look into how users experienced the information scent. One
of the goals of this thesis was to dive deeper into this information scent usability gap, but
failed to draw strong conclusions due to the small number of survey responses. Further
research might look into these subjective measures by aiming to get more responses from a
larger portion of the population, while perhaps aiming to create a bigger effect by modifying
multiple links.

This thesis could not have existed without the help, motivation, suggestions and discussions
provided by several people. Even though all of their schedules became progressively busier
throughout the project, they always allowed me to squeeze out just a little more time. They
allowed me to attain the goals I had in mind - perhaps by providing high information scent? -
for which I am very thankful.
Special thanks to my supervisor Dr. Martijn Willemsen for discussions, suggestions,
validations & idea’s, and allowing me to find my own way into the project while always
keeping an open and valuable opinion. Thanks to Dr. Mykola Pechenizkiy for asking exactly
the right questions at the right point in time, your seemingly simple statements have been
some of the most valuable lessons for me throughout this thesis.
Thanks to all superheroes working at StudyPortals for taking me in, trusting me with all the
company’s data and helping me out whenever possible. Especially Thijs Putman for being
always optimistic, picking up spirits when they were down, and allowing me the opportunity
for this project all together.
A final thanks to all friends, family & internet strangers who helped me reflecting idea’s,
learned me code & concepts, provided inspiration and bought me coffee. Especially the
coffee.
Breda, May 20th 2016

Alkharusi, H. (2012). Categorical Variables in Regression Analysis: A Comparison of Dummy
and Effect Coding. International Journal of Education, 4(2), 202–210. http://doi.org/10.5296/ije.v4i2.1962
Blackmon, M. H. (2012a). Information scent determines attention allocation and link selection among multiple information patches on a webpage, 3001(January 2016), 2–15. http://doi.org/10.1080/0144929X.2011.599041
Blackmon, M. H. (2012b). Information scent determines attention allocation and link selection among multiple information patches on a webpage. Behaviour & Information Technology, 31(1), 3–15. http://doi.org/10.1080/0144929X.2011.599041
Blackmon, M. H., Kitajima, M., & Polson, P. G. (2005). Tool for Accurately Predicting Website Navigation Problems , Non-Problems , Problem Severity , and Effectiveness of Repairs. Proceedings of the ACM SIGCHI Conference ‘05, 31–40. http://doi.org/10.1145/1054972.1054978
Blackmon, M. H., Polson, P. G., Kitajima, & Muneo. (2005). Cognitive architecture for website design and usability evaluation: Comprehension and information scent in performing by exploration. HCI International, 4.
Blackmon, M. H., Polson, P. G., & Kitajima, M. (2000). A Comprehension-based Model of Web Navigation and Its Application to Web Usability Analysis A Comprehension-based Model of Web Navigation and Its Application to Web Usability Analysis. People and Computers. http://doi.org/10.1007/978-1-4471-0515-2
Blackmon, M. H., Polson, P. G., Kitajima, M., & Lewis, C. (2002). Cognitive Walkthrough for the Web. In Proceedings of the SIGCHI conference on human factors in computing systems. (pp. 463–470).
Chapman, D. (1981). A Model of Student College Choice. The Journal of Higher Education, 52(5), 490–505.
Chi, E. H., Cousins, S., Rosien, A., Supattanasiri, G., Williams, A., Royer, C., … Chen, J. (2003). The bloodhound project: automating discovery of web usability issues using the InfoScent simulator. Proceedings of the Conference on Human Factors in Computing Systems - CHI ’03, (April), 512. http://doi.org/10.1145/642611.642699
Claypool, M., Le, P., Wased, M., & Brown, D. (2001). Implicit interest indicators. Proceedings of the 6th International Conference on Intelligent User Interfaces - IUI ’01, 33–40. http://doi.org/10.1145/359784.359836
Davis, F. D. (1989). Perceived Ease of Use, and User Acceptance of Information Technology. MIS Quarterly, 13(3), 319–340. http://doi.org/10.2307/249008
Dredze, M., Wallach, H. M., Puller, D., & Pereira, F. (2008). Generating Summary Keywords for Emails Using Topics.
Duggan, G. B., & Payne, S. J. (2008). Knowledge in the Head and on the Web: Using Topic Expertise to Aid Search.
Fox, S., Karnawat, K., Mydland, M., Dumais, S., & White, T. (2005). Evaluating implicit measures to improve web search. ACM Transactions on Information Systems, 23(2), 147–168. http://doi.org/10.1145/1059981.1059982
Fu, W., Avenue, N. M., & Pirolli, P. (2007). A Cognitive Model of User Navigation on the World Wide Web Manuscript submitted to Human-Computer Interaction SNIF-ACT : A Cognitive Model of User Navigation on the World Wide.

Geiß, J. (2011). Latent semantic sentence clustering for multi-document summarization.
Girme, S., & Laulkar, C. A. (2015). Clustering Algorithm for Log File Analysis on Top of Hadoop. International Journal of Engineering Science and Innovative Technology, 4(1), 153–160.
Gomez, J. C., & Moens, M. (2014). A Survey of Automated Hierarchical Classification of Patents. In Professional Search in the Modern World (pp. 215–249).
Hershey, D. A., Walsh, D. A., Read, S. J., & Chulef, A. D. A. S. (1990). The Effects of Expertise on Financial Problem Solving : Evidence for Goal-Directed , Problem-Solving Scripts In the past decade , a growing body of research has explored the rela- tionship between expertise and problem-solving abilities . The rationale fo. Organizational Behavior and Human Decision Processes, 46(1), 77–101.
Hölscher, C., & Strube, G. (2000). Web Search behavior of Internet experts and Newbies. Computer Networks, 33(1), 337–346.
Hunter, J. D. (2007). Matplotlib: A 2D graphics environment. Computing in Science and Engineering, 9(3), 99–104. http://doi.org/10.1109/MCSE.2007.55
Jenkins, C., Corritore, C. L., & Wiedenbeck, S. (2003). Patterns of Information Seeking on the Web: A Qualitative Study of Domain Expertise and Web Expertise, (February 2016).
Johnson, K. E., & Mervis, C. B. (1997). Effects of Varying Levels of Expertise on the Basic Level of Categorization. Journal of Experimental Psychology: General, 126(3), 248–277.
Kalola, D. (2014). Weblog Analysis with Map-Reduce and Performance Comparison of Single v / s Multinode Hadoop Cluster. Kalola, D. (2014). Weblog Analysis with Map-Reduce and Performance Comparison of Single v / S Multinode Hadoop Cluster, 3692–3696., 2(11), 3692–3696.
Kim, Y., Porter, A. M., & Goolkasian, P. (2014). Conceptual priming with pictures and environmental sounds. Acta Psychologica, 146, 73–83. http://doi.org/10.1016/j.actpsy.2013.12.006
Kintsch, W. (1988). the Role of Knowledge in Discourse Comprehension - a Construction Integration Model. Psychological Review, 95(2), 163–182.
Knijnenburg, B. P., Willemsen, M. C., Gantner, Z., Soncu, H., & Newell, C. (2012). Explaining the user experience of recommender systems. User Modeling and User-Adapted Interaction, 22(4-5), 441–504. http://doi.org/10.1007/s11257-011-9118-4
Larcker, D. F., & Lessig, V. P. (1980). Perceived Usefulness of Information: A Psychometric Examination. Decision Sciences, 11(1), 121. http://doi.org/10.1016/j.im.2007.11.001
Lee, Y., & Lee, Y. (2012). Toward scalable internet traffic measurement and analysis with Hadoop. ACM SIGCOMM Computer Communication Review, 43(1), 5–13. http://doi.org/10.1145/2427036.2427038
Lin, W., & Liu, Y. (2008). A Novel Website Structure Optimization Model for More Effective Web Navigation, (70672097), 36–41. http://doi.org/10.1109/WKDD.2008.77
Maguitman, A. (2008). A Comparative Analysis of Latent Variable Models for Web Page Classification o on Bah ´. In Web Conference, 2008. LA-WEB ’08., Latin American (pp. 23–28). http://doi.org/10.1109/LA-WEB.2008.14
Maringe, F. (2006). University and course choice. International Journal of Educational Management, 20(6), 466–479.
Mccart, J. A., Padmanabhan, B., & Berndt, D. J. (2013). Goal attainment on long tail web

sites : An information foraging approach. Decision Support Systems, 55(1), 235–246. http://doi.org/10.1016/j.dss.2013.01.025
McKinney, W. (2011). pandas: a Foundational Python Library for Data Analysis and Statistics. Python for High Performance and Scientific Computing, 1–9.
Mobasher, B. (2007). Data Mining for Web Personalization, 90–135.
Moody, G. D., & Galletta, D. F. (2015). Lost in Cyberspace : The Impact of Information Scent and Time Constraints on Stress , Performance , and Attitudes Online Lost in Cyberspace : The Impact of Information Scent and Time Constraints on Stress , Performance , and Attitudes Online. Journal of Management Information Systems, 32.1(January), 192–224. http://doi.org/10.1080/07421222.2015.1029391
Mynarz, J., Kamrádková, K., & Kožuchová, K. (2010). Polythematic structured subject heading system & creative commons. Grey Journal, 6(3), 129–135.
Nie, L., Wang, X., Shen, J., & Chua, T. S. (2014). Learning to Recommend Descriptive Tags for Questions in Social Forums. ACM Transactions on Information Systems, 32(1).
Nielsen, J. (2003). Information Foraging: Why Google Makes People Leave Your Site Faster. Retrieved from https://www.nngroup.com/articles/information-scent/
Niraula, N., Banjade, R., Dan, Ş., & Rus, V. (2013). Experiments with Semantic Similarity Measures Based on LDA and LSA, 188–199.
Niu, S. X., & Tienda, M. (2007). Choosing colleges : Identifying and modeling choice sets. http://doi.org/10.1016/j.ssresearch.2007.06.015
Payne, J. W., Bettman, J. R., & Johnson, E. J. (1993). The adaptive decision maker. The Adaptive Decision Maker, 45(7), 352. http://doi.org/10.1057/jors.1994.133
Pedregosa, F., Varoquaux, G., Gramfort, A., Michel, V., Thirion, B., Grisel, O., … Duchesnay, É. (2012). Scikit-learn: Machine Learning in Python. … of Machine Learning …, 12, 2825–2830. http://doi.org/10.1007/s13398-014-0173-7.2
Pirolli, P., & Card, S. K. (1999). Information Foraging. Psychological Review, (106(4)), 643.
Porter, M. F. (1980). An algorithm for suffix stripping. Program: Electronic Library and Information Systems. http://doi.org/10.1108/eb046814
Premchaiswadi, W., & Romsaiyud, W. (2012). Extracting weblog of Siam University for learning user behavior on MapReduce. In ICIAS 2012 - 2012 4th International Conference on Intelligent and Advanced Systems: A Conference of World Engineering, Science and Technology Congress (ESTCON) - Conference Proceedings (Vol. 1, pp. 149–154). http://doi.org/10.1109/ICIAS.2012.6306177
Rigutti, S., Fantoni, C., & Gerbino, W. (2015). Web party effect: a cocktail party effect in the web environment. PeerJ, (3), 1–27. http://doi.org/10.7717/peerj.828
Rosch, E., Mervis, C., Gray, W. G., Johnson, D., & Boyes-braem, P. (1976). Basic Objects in Natural Categories. Cognitive Psychology, 8(3), 382–439.
Rose, D. E., & Levinson, D. (2004). Understanding User Goals in Web Search. In Proceedings of the 13th international conference on World Wide Web. (pp. 13–19).
Rott, M., & Cerva, P. (2014). Investigation of Latent Semantic Analysis for Clustering of Czech News Articles. In Database and Expert Systems Applications (DEXA) (pp. 223 – 227).
Sánchez-Franco, M., & Roldán, J. (2005). Web acceptance and usage model: A comparison between goal-directed and experiential web users. Internet Research, 15(1), 21–48.

Seabold, S., & Perktold, J. (2010). Statsmodels: econometric and statistical modeling with python. … of the 9th Python in Science Conference, (Scipy), 57–61. Retrieved from https://projects.scipy.org/proceedings/scipy2010/pdfs/seabold.pdf
Shen, H. (2014). Interactive notebooks: Sharing the code. Nature, 515(7525), 5–6. http://doi.org/10.1038/515151a
Smith, L., Agahi, H., Price, I. F., & MatzDort, F. (2003). The impact of facilities on student choice of university. Facilities, 21(10), 212–222. http://doi.org/10.1108/02632770310493580
Sood, S. C., Owsley, S. H., Hammond, K. J., & Birnbaum, L. (2007). TagAssist : Automatic Tag Suggestion for Blog Posts.
Teo, L., & John, B. E. (2008). CogTool-explorer: towards a tool for predicting user interaction. Proceedings of ACM CHI 2008 Conference on Human Factors in Computing Systems, 2, 2793–2798. http://doi.org/10.1145/1358628.1358763
Tselios, N., Katsanos, C., & Avouris, N. (2009). Investigating the Effect of Hyperlink Information Scent on Users ’ Interaction with a Web Site 2 Method of the Study, 138–142.
Wang, K., Wang, E. T. G., & Farn, C. (2009). Influence of Web Advertising Strategies , Consumer Goal-Directedness , and Consumer Involvement on Web Advertising Effectiveness Infl uence of Web Advertising Strategies , Consumer Goal-Directedness , and Consumer Involvement on Web Advertising Effectiven. International Journal of Electronic Commerce, 13(4), 67–96. http://doi.org/10.2753/JEC1086-4415130404
White, R. W., Dumais, S. T., & Teevan, J. (2009). Characterizing the influence of domain expertise on web search behavior. In Proceedings of the Second ACM International Conference on Web Search and Data Mining.
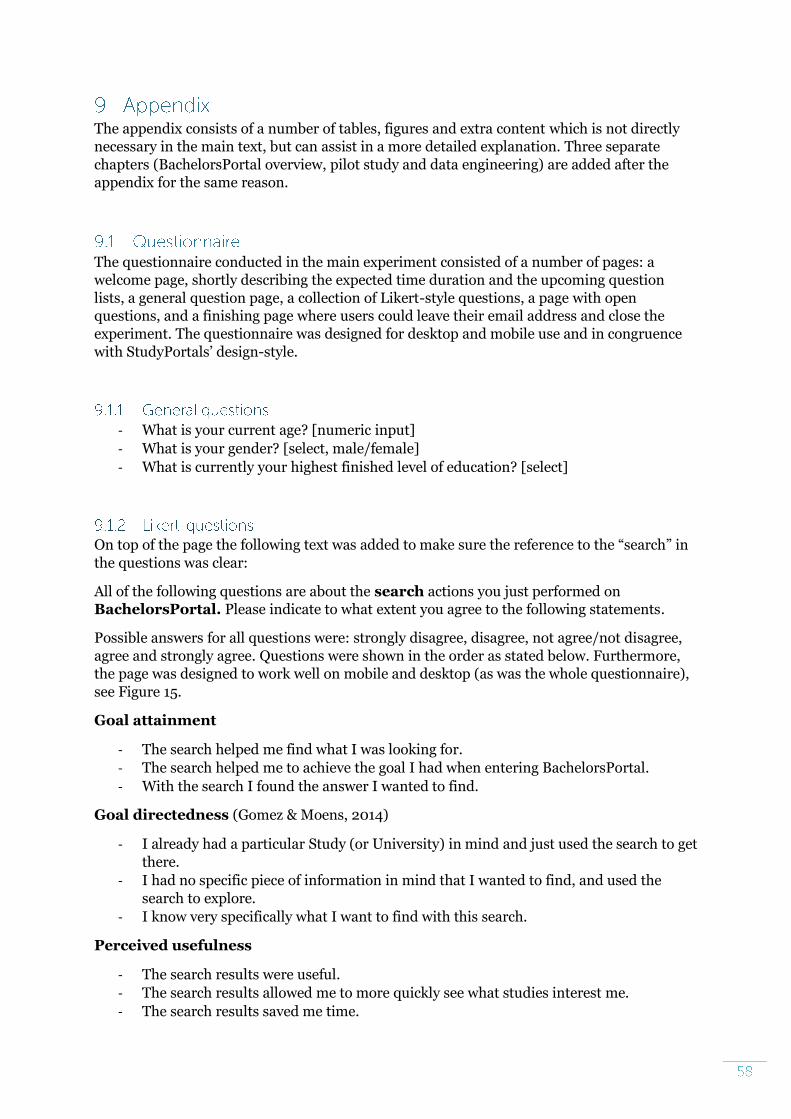
The appendix consists of a number of tables, figures and extra content which is not directly
necessary in the main text, but can assist in a more detailed explanation. Three separate
chapters (BachelorsPortal overview, pilot study and data engineering) are added after the
appendix for the same reason.
The questionnaire conducted in the main experiment consisted of a number of pages: a
welcome page, shortly describing the expected time duration and the upcoming question
lists, a general question page, a collection of Likert-style questions, a page with open
questions, and a finishing page where users could leave their email address and close the
experiment. The questionnaire was designed for desktop and mobile use and in congruence
with StudyPortals’ design-style.
- What is your current age? [numeric input]
- What is your gender? [select, male/female]
- What is currently your highest finished level of education? [select]
On top of the page the following text was added to make sure the reference to the “search” in
the questions was clear:
All of the following questions are about the search actions you just performed on
BachelorsPortal. Please indicate to what extent you agree to the following statements.
Possible answers for all questions were: strongly disagree, disagree, not agree/not disagree,
agree and strongly agree. Questions were shown in the order as stated below. Furthermore,
the page was designed to work well on mobile and desktop (as was the whole questionnaire),
see Figure 15.
Goal attainment
- The search helped me find what I was looking for.
- The search helped me to achieve the goal I had when entering BachelorsPortal.
- With the search I found the answer I wanted to find.
Goal directedness (Gomez & Moens, 2014)
- I already had a particular Study (or University) in mind and just used the search to get
there.
- I had no specific piece of information in mind that I wanted to find, and used the
search to explore.
- I know very specifically what I want to find with this search.
Perceived usefulness
- The search results were useful.
- The search results allowed me to more quickly see what studies interest me.
- The search results saved me time.

- I can find better study programs with the help of the search results.
Expertise
- I'm an expert in the field of study that I searched for.
- I do not know a lot about the field of study that I searched for.
- By seeing a study in the search results I get a good idea what that study is about
- What is your goal of using this search; what do you hope to find? [text area]
- To what extend did you complete this goal? [slider, 0 = not at all, 100 = fully]
- How many seconds do you estimate it took to complete your goal from the moment
you entered Bachelorsportal? [numeric input]

While analyzing the results from the experiment, a number of tables, figures and some texts
were constructed that did not fit in the main body of the study, but are significant in some
argumentations. They are added in this subchapter.
The quality of the labels generated for the experiment were verified by analyzing the LSA
similarity of the final labels with the content of the studies they were attached to. The OLS
regression at the bottom shows that LSA subordinate > LSA basic > LSA wrong.


This chapter presents a number of graphs explaining certain statistics from the participants
who participated in the questionnaire.


This subchapter contains some extra data for the result section of the experiment to prevent
cluttering the main text body.


Users were asked to write down their goal for coming to BachelorsPortal in the questionnaire.
This subchapter presents some of the visualizations that resulted from analyzing these
written goals.

Using LSA 10 topics where extracted, presented below. All words are stemmed, so
“university” will be reduced to “univers”.
0 -- 0.569*univers + 0.461*studi + 0.255*cours + 0.164*good + 0.163*field + 0.161*interest
+ 0.140*look + 0.120* + 0.108*offer + 0.104*futur
1 -- 0.507*studi + -0.437*cours + -0.229*interest + 0.217*field + -0.202*univers +
0.169*futur + 0.155*life. + -0.152*suitabl + -0.130*look + 0.123*goal
2 -- 0.552*univers + -0.435*cours + -0.164*field + 0.152*right + 0.141*best + 0.140*good + -
0.130*interest + -0.129*degre + -0.118*futur + -0.115*studi
3 -- 0.375*field + -0.346*studi + 0.264*futur + -0.220*good + 0.213*life. + -0.155*degre +
0.148*univers + 0.127*interest + 0.118*inform + 0.116*university,
4 -- -0.299*interest + -0.281*degre + 0.276*cours + -0.273*bachelor + -0.221*higher +
0.186*look + -0.183*program + 0.163*good + -0.151*option + -0.147*avail
5 -- 0.510*good + 0.288*help + 0.196*A + -0.169*univers + 0.166*find + -0.149* +
0.145*Studi + 0.140*Find + 0.137*much + 0.132*match
6 -- 0.217*countri + -0.210*interest + -0.203*year + 0.190*good + 0.183* + -0.179*look + -
0.162*studi + -0.147*option + -0.139*move + -0.129*finish
7 -- 0.344*help + -0.324*good + -0.267*A + 0.243*work + 0.243*line + 0.185*suit +
0.182*mani + 0.179*program + 0.155*use + -0.141*suitabl
8 -- -0.300*program + -0.259*suitabl + -0.233*A + 0.196*year + 0.193*option + -0.167*goal
+ 0.151*finish + 0.137*higher + 0.136*degre + -0.135*plan
9 -- -0.231*good + 0.219*studi + -0.200*. + -0.190*search + 0.182*look + -0.165*use + -
0.160*scienc + -0.153*knowledg + -0.153*plan + -0.147*goal


Using backwards stepwise regression, a number of objective metrics (page visit counts, page
ping counts, conversion counts, search-study CTR) were used to try and predict the 2
subjective factors from the question list. Only for the expertise factor a significant model was
found.

The regression tests done for hypothesis 1-6 were repeated for the users who answered the
questionnaire, to find the relation between directedness and objective metrics such as search-
study CTR and conversion.

χ72
χ72
χ72

χ72

In addition to the short introduction, and necessary information given about StudyPortals
and Bachelorsportal in the main text, this chapter provides a little more insight into the
website structure, StudyPortals’ underlying goals (given in this subchapter and 10.1). Chapter
10.2 summarizes some findings based on explorative research done in the early stage of this
thesis. It describes the research which lead to the main research question, and might contain
some terms and concepts which are elaborated in the main text.
StudyPortals is a company developing and maintaining a number of websites that provide
information about study courses all around the world on different levels: BSc-, MSc- and
PHD courses but also language- and online courses. The goal of the company is “Empowering
the world to choose (for) education”, which translates in platforms that aim to provide high-
quality information.
Bachelorsportal.eu is one of those websites, providing detailed information on bachelor
studies to inform new students in making their choice. With 236.300 sessions per month
from 180.610 users (February 2016), it’s a relatively large website with relatively high
engagement: users average 4 page visits per session and stay for 4:31 minutes. 71.3% of the
sessions have never been there before, and only 3-5% of the users revisit the website within a
month. These statistics are taken from Google Analytics, so might divert from the actual
numbers due to tracking- or ad blockers.
Males and females are equally represented in the visitors (respectively 0.504 and 0.496), and
most visitors are relatively young (see Figure 29). Almost 0.25 of the visitors are over 34,
something that seems counterintuitive giving age distributions of bachelor students in
western countries, such as Canada (Figure 30) and the US (Figure 31). One of the possibilities
may be parents interested in studies for their children. Analysis of the user goals (chapter
6.6.1) in the questionnaire however show no such goals, even though the age distribution in
the questionnaire is similar to the one in Figure 19. Apparently, users from older ages then
what might be expected based on student age distributions in the US and Canada are
interested in Bachelors as well.
Sessions tend to come from all over the world, led by the UK (8.95%), US (8.29%), Kenya
(6.05%) and the Netherlands (5.51%) (Figure 32).


Just over a third of the sessions (37.40%) are performed via mobile devices, tablet represent
6.17% of all sessions, all other is desktop. Almost three quarters of the sessions arrive via
search engines (73.53%), 14.79% is direct traffic and 10.95% is referred from other websites.

BachelorsPortal’s home page (hereafter referred to as home) contains a large search input
field and button, inviting users to search through the available studies. Further down the
page, links to discipline pages and country pages are given, as well as user reviews,
universities in the spotlight and a number of recommended articles.
Discipline pages contain a description and a number of studies (presented in tiles such as
Figure 34) on a certain discipline, such as “Law” or “Computer Science & IT”. These ten top
disciplines are further split into sub disciplines (little over 200 at the time of writing), which
are accessible at the bottom of a discipline page. Country pages are quite similar but contain
information about a country; not only the country itself, but also what the student life is like
as well as general live-and-work information. It also provides some extra statistics such as
population, number of students and number of universities. Both discipline- and country
pages led users to the search page (with an active filter of the discipline or country they
originated from).

The search page provides an interface for users to search and filter the available studies
(>49.000) on a number of properties, such as discipline, location, language, costs, duration
and more. Each search result is represented as a search tile (see Figure 1), giving quick facts
of a study course, and linking to the study page.
On a study page, a description, details, requirements, and possible scholarships for the
chosen study are presented. On the study page, a number of buttons and links lead to the
course page of the university. Users clicking on one of these links is referred to as a
conversion. They are labeled as “Visit Programme Website”, “You can find more information
about this programme on the programme website” or “Programme website”. Besides the
information, tiles of information about the country, references to required language tests and
related studies are given.
Besides these page types other significant page types (in terms of visits) are article pages
(containing study-related articles), university pages (very similar to study pages, only
concerning a whole university instead of one study), account pages (where users can set
account preferences and view studies that (s)he put on the wish list) and study option pages
(containing a country-discipline combination, i.e. information and study tiles of computer
science bachelors in Poland).
Table 53 shows the number of page visits for specific page types between 12-28-2015 and 01-
24-2016. In this period, 138,996 unique users with 173,835 sessions were identified (a
session being all actions from a user with less than 60 minutes between 2 consecutive
actions). The data shows a dominance of the study pages in visitor behavior: 34.2% of all
page views are on a study page. Account pages, accounting for 9.7% of all page views, differ
from the other pages as they do not directly serve the purpose of finding a study: they target
account details for users that signed up with BachelorsPortal. On a monthly basis these
statistics seem to be slowly rising; each month gaining a couple of percentages in sessions. On
smaller timespans the data fluctuates a little more; weekends are usually less busy, and
events like holidays or website downtimes introduce significant peaks and valleys.

Page views Percentage of all page visits studies 179,673 34.24% search 80,757 15.39%
study-options 50,460 9.62% account 47,874 9.12%
universities 42,317 8.06% countries 41,334 7.88%
home 37,254 7.11% disciplines 28,764 5.48%
articles 11,025 2.10%
BachelorsPortal is generally a well-optimized website: design and content have had many
years of iterations based on qualitative research and business development, resulting in a
website that’s overall pleasing to the eye and easy in its use. However, as in every company,
issues and potential area’s for improvement are always present. A number of important ones
at StudyPortals are missing body of research, willingness to become more data-driven and
missing framework for optimizing hyperlinks.
In the following subchapters, research concerning study choice will be summarized and the
conclusion will be drawn that it might not be sufficient for a global market like the one
targeted by BachelorsPortal. Secondly, the process of optimizing hyperlinks in a data-driven
way is described. While analyzing these points, an opportunity for the improvement of
information scent was found, which formed the idea for the main research question.
A lot of research has been done in the area of study and university choice. For example
(Maringe, 2006) finds that market perspectives outweigh the interest and love for the
subject, resulting in students focusing on program contents and price more than other
aspects. (Smith et al., 2003) show that most participants most often picked a university
because of a specific course that it offered, followed by university reputation and –proximity
to the hometown. Also significant is that they took measures in 2000 and 2001, where some
results differ highly between the two years, indicating possibly quick shifts of student’s choice
criteria.
There seems to be a very large body of literature that concern the student’s choice of a
university. They however all seem to miss some properties for being really relevant for this
project. First of all, all of them are localized: they all concern experiments or students from a
specific country or state, which differs significantly from the target group of BachelorsPortal,
namely all countries. Secondly, recent research seems to attempt and tackle specific topics,
for example the importance of facilitation (Smith et al., 2003) and socio-economic factors
(Niu & Tienda, 2007) in choosing universities, usually with the goal to help universities gain
insights into ways to draw more students. A general model of student choosing a study would
be most useful, and while it exists (Chapman, 1981), the research is so old that it is most
likely outdated in the context of this project, where future students have detailed information
of over 40.000 studies just a few clicks away.

Seemingly, the fact that BachelorsPortal (and other platforms of StudyPortals) is an online
study platform at world wide scale makes it hard to find research that can assist in theorizing
about user characteristics. While a lot of attention is on quantitative research, UI and UX
research and business related research, nobody has concrete results on specific questions,
such as “how is the distribution of users regarding goal-directedness”, or “what is the level of
domain-expertise of average users”.
This lack of research results in suboptimal development. A good example is the current state
of experiments run on the website: StudyPortals is very keen on the idea of A/B testing, and
puts much effort into building underlying testing systems and designing and running
experiments. Much of the current running experiments aim for the same goals of this project
(text optimization, most of the time hyperlinks specifically) but miss an underlying theory or
system.
In example, one of the currently running experiments consists of changing text related to the
conversion button on a study page (see Figure 35), some of the conditions being “Many
students visit a programme website”, “Application deadline is approaching” and “Most
students apply in {current-month}”. An underlying framework such as the reversed
information scent hypothesis can assist here by suggesting alternatives and compute their
impact before running the experiment, effectively allowing developers to compute a possibly-
optimal text before running the experiment, instead of generating variations based on non-
data driven factors, and possibly requiring multiple iterations to come to an optimal
variation.
Based on these 3 opportunities for improvements mentioned above (willingness to become
more data-driven, missing body of research, and missing framework for optimizing
hyperlinks), the theory of information foraging (elaborated in chapter 2) was found, and used
to analyze the website. It turned out two important places on the website had low information
scent: conversion links and search study tile pages.
The obvious place to look first, as it is in main interest of the company, is the conversion
links, where the company will get a financial benefit from users click those links (see Figure
35 as example). They all consist of the text “Visit Programme Website”, a text chosen based
on previously ran A/B test results. While the context may already be a great indication of the
information patch that users might end up with after clicking this link, the theory previously
outlined shows potential improvements for these texts. For example the button of Figure 35
was shown on a study page information the user about “B.A. Psychology” in Spain. Based on
information scent, “Visit B.A. Psychology Website” contains much more scent and will result
in more optimal user behavior. Looking at less intrusive interventions, the text “Many
students visit a programme website” can be optimized with a number of alternatives such as
“This website explains more about psychology and human behavior” for undirected users and

perhaps “Organizational- & consumer psychology” for more directed users with more
expertise.
Two problems exist with implementing this kind of intervention. First of all, the button links
to an external page where information is presented in a lot of different ways, compared to the
structured data available from StudyPortals. A possible solution to this could be to assume
that the contents of a certain study on BachelorsPortal are very similar to the content of the
webpage of the university which is quite likely as study descriptions are based on the
webpages they link to. Secondly, while the link opens in a new browser tab, the fact that the
website is not under StudyPortals control means no measures or questionnaires can be
performed unless the user actively returns to BachelorsPortal’s webpage. While it is not ideal,
it does offer some valuable data, for example whether a user clicked the button or not, tied to
earlier shown behavior.
Note that this will increase the information scent and might result in the benefits described
before, it may have an effect that is undesirable for StudyPortals. As users are more likely to
go for the optimized link in favor of reading information below first, users might be of lower
interest in the actual study (lower-quality of referrals), which is one of StudyPortals main
selling points towards universities.
Throughout the website several study tiles are implemented, presenting a study in a
summarized way, for example on the search page (see Figure 36) or on discipline pages (see
Figure 34). While again the information patch is quite obvious (it does give a title, some
important attributes and a very concise summary), the link does not tell the user anything
about what it is referring to. This effect is largest in the search page tiles, where the “detailed
description” button is made so distinctive in the interface that it is most likely to draw a lot of
attention, focusing the users’ attention on a link text with no scent. A small pre-experiment
was run to verify the significance of this button between 19-01-2016 and 23-01-2016. The
experiment was stopped because of the significant drop in user interaction, and might
therefor not be totally valid, it did run mostly in the weekend for example, where user
behavior on BachelorsPortal is significantly different than behavior throughout the week.
Nonetheless the results can serve as an indication.
In that period, 3640 sessions viewed a variation of the search page without the detailed
description button 12.67 times. For the baseline, 3694 sessions viewed the “normal” search
page 12.85 times. The treatment group when from the search page to a specific study 4.81
times (mean=0.379, standard error = 0.004), the control group did so 5.40 times
(mean=0.420, standard error=0.004). The 9.7% drop in study views was significant (p <
0.001 at a two-sided 99% confidence level).

This simple experiment shows the significance of making such a distinct button: users will
click it even if the text of the link has no scent. Regarding the study tiles on discipline pages:
they are quite popular. 19.73% of the users viewing a discipline page between 01-01-2016 and
20-01-2016 (n=28,775) clicked on one of the studies.
It has to be noted that for both the types of study tile, two links refer to the study page: the
title and the read more / detailed description button. Which one the user clicked was not
measured.
In this chapter the site structure of BachelorsPortal and its general user behavior was shortly
described. Motivated by the focus points of StudyPortals the information foraging theory was
used to analyze their website; conversion links and study tiles on the search page were found
to be significant buttons with low information scents. A simple experiment was run on the
search page, where the red buttons were removed. The drop in search-study CTR showed the
significance of the button, even though the information scent was very low.
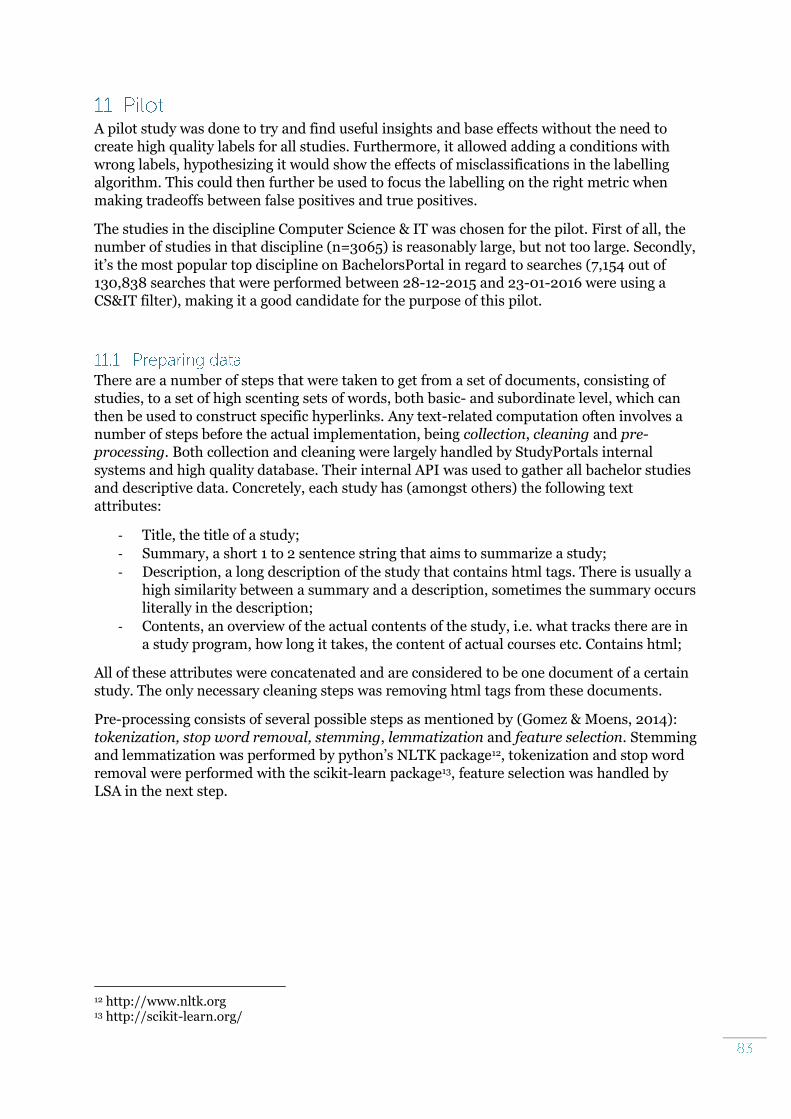
A pilot study was done to try and find useful insights and base effects without the need to
create high quality labels for all studies. Furthermore, it allowed adding a conditions with
wrong labels, hypothesizing it would show the effects of misclassifications in the labelling
algorithm. This could then further be used to focus the labelling on the right metric when
making tradeoffs between false positives and true positives.
The studies in the discipline Computer Science & IT was chosen for the pilot. First of all, the
number of studies in that discipline (n=3065) is reasonably large, but not too large. Secondly,
it’s the most popular top discipline on BachelorsPortal in regard to searches (7,154 out of
130,838 searches that were performed between 28-12-2015 and 23-01-2016 were using a
CS&IT filter), making it a good candidate for the purpose of this pilot.
There are a number of steps that were taken to get from a set of documents, consisting of
studies, to a set of high scenting sets of words, both basic- and subordinate level, which can
then be used to construct specific hyperlinks. Any text-related computation often involves a
number of steps before the actual implementation, being collection, cleaning and pre-
processing. Both collection and cleaning were largely handled by StudyPortals internal
systems and high quality database. Their internal API was used to gather all bachelor studies
and descriptive data. Concretely, each study has (amongst others) the following text
attributes:
- Title, the title of a study;
- Summary, a short 1 to 2 sentence string that aims to summarize a study;
- Description, a long description of the study that contains html tags. There is usually a
high similarity between a summary and a description, sometimes the summary occurs
literally in the description;
- Contents, an overview of the actual contents of the study, i.e. what tracks there are in
a study program, how long it takes, the content of actual courses etc. Contains html;
All of these attributes were concatenated and are considered to be one document of a certain
study. The only necessary cleaning steps was removing html tags from these documents.
Pre-processing consists of several possible steps as mentioned by (Gomez & Moens, 2014):
tokenization, stop word removal, stemming, lemmatization and feature selection. Stemming
and lemmatization was performed by python’s NLTK package12, tokenization and stop word
removal were performed with the scikit-learn package13, feature selection was handled by
LSA in the next step.
12 http://www.nltk.org 13 http://scikit-learn.org/

To label the document-matrix of studies produced, a predefined set of labels was chosen and
then linked to each document. This obviously is not entirely “bottom-up” as proposed in the
reversed information scent hypothesis and doesn’t allow for exploration of labels for
instance. Full automated label extraction proved to be a significant challenge however. It is
an unsupervised learning problem, meaning that the data is unlabeled (there is no variable
to be predicted for instance) and no error or reward signal is present to evaluate outcomes.
This makes related tagging research mostly unusable, as it has the advantage of using user
labels to train their model (Nie et al., 2014). Several methods were tried but failed to deliver
acceptable results (all evaluated by manual inspection), being:
- Reducing the documents using LSA (and LDA) and attempt to label these underlying
concepts based on the words that were most influential for each of these concepts. For
a large number of documents this proved to be near to impossible: concepts were
often very similar (the word “business” for instance occurs often (> 10 times) as most
important word for a concept) or words of concepts were so vaguely connected that it
was hard or impossible to determine what the underlying meaning was. Multiplying
by thousands of components needed to describe these studies, this was not a viable
solution. Using TF-IDF improved this a little though not enough.
- Reducing the documents using LSA (and LDA) and computing the most influential
words for a study like suggested by (Dredze et al., 2008). While it did result in good
summary keywords, they were very similar across studies (i.e. the words information,
computer, technology occurred very often for example), this was not desirable for this
experiment. The target is to describe studies with labels as specifically as possible
(creating the largest possible distance between two studies); ten studies all with the
same information scent will be of little use.
- Automated keyword discovery trough WordNet and YAGO (two taxonomy databases),
trying to explore keywords from a number of base words (computer science to start
with) and using LSA to link these words to documents. A very tight scope (for example
only the 2 dozen concepts in the branches of “computer science” in Wordnet) gave
good tags, but was again too little for the purpose of this study, expanding the scope
(for example including the branches of “database”) included words that had nothing
to do with the contents of studies at all (database has a branch “list”, which has items
like “agenda”, “FAQ”, “price list”, a kind of labels that would make little sense).
Secondly, LSA similarity only worked if the word occurred somewhere in the existing
document, for instance “tele robotics”14 did not occur in the other documents. An
attempt with the short description given by WordNet gave a huge improvement, but
was still too inaccurate: as the description generally has a dozen words, each words is
greatly significant. The description “the use of computers to translate from one
language to another” for “machine translation” made a tight fit with studies that do
something with language, which was more often learning of different languages (for
students) then the program actually teaching machine translation.
- The keywords extracted from WordNet (and YAGO15) were given to BachelorsPortal’s’
search engine (which is a TF-IFD search engine with some business rules added). The
results were used to label the studies and turn the problem into a supervised learning
problem. For each label a classifier was made (both Naïve Bayes and Support Vector
Machine techniques were tried) that predicted whether a given label was suitable for a
study. As input both LSA vectors and TF-IDF vectors were tried. After some iterations
14 a sub-sub-branch of computer science, meaning the area of robotics concerned with distant control of a robot 15 www.yago-knowledge.org
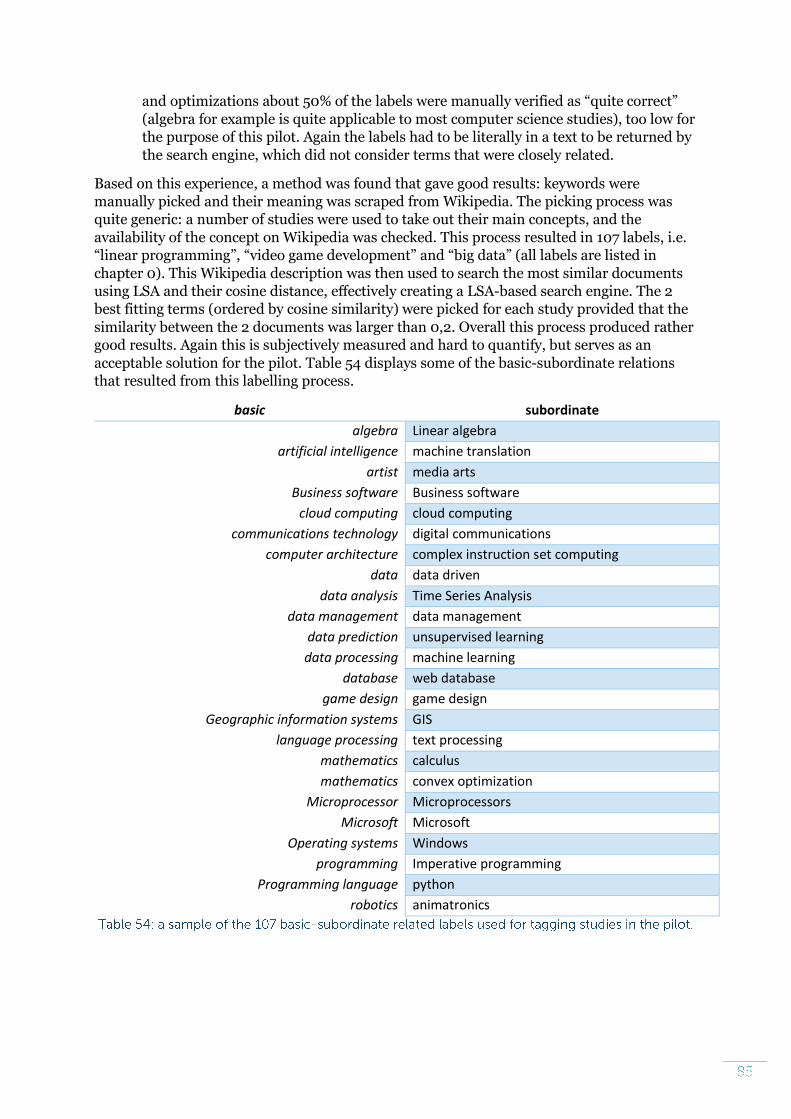
and optimizations about 50% of the labels were manually verified as “quite correct”
(algebra for example is quite applicable to most computer science studies), too low for
the purpose of this pilot. Again the labels had to be literally in a text to be returned by
the search engine, which did not consider terms that were closely related.
Based on this experience, a method was found that gave good results: keywords were
manually picked and their meaning was scraped from Wikipedia. The picking process was
quite generic: a number of studies were used to take out their main concepts, and the
availability of the concept on Wikipedia was checked. This process resulted in 107 labels, i.e.
“linear programming”, “video game development” and “big data” (all labels are listed in
chapter 0). This Wikipedia description was then used to search the most similar documents
using LSA and their cosine distance, effectively creating a LSA-based search engine. The 2
best fitting terms (ordered by cosine similarity) were picked for each study provided that the
similarity between the 2 documents was larger than 0,2. Overall this process produced rather
good results. Again this is subjectively measured and hard to quantify, but serves as an
acceptable solution for the pilot. Table 54 displays some of the basic-subordinate relations
that resulted from this labelling process.
basic subordinate
algebra Linear algebra
artificial intelligence machine translation
artist media arts
Business software Business software
cloud computing cloud computing
communications technology digital communications
computer architecture complex instruction set computing
data data driven
data analysis Time Series Analysis
data management data management
data prediction unsupervised learning
data processing machine learning
database web database
game design game design
Geographic information systems GIS
language processing text processing
mathematics calculus
mathematics convex optimization
Microprocessor Microprocessors
Microsoft Microsoft
Operating systems Windows
programming Imperative programming
Programming language python
robotics animatronics

The second challenge for this setup was to find correct basic representations of the
subordinate keywords found before. The choice for this direction was rather simple: going
from subordinate to basic should be rather trivial (windows is an operating system), going
from basic to subordinate is impossible without creating errors (windows is an operating
system, but so are Linux and OSX). While for some research this might not be a problem,
here it is: the information scent of Linux is significantly different than that of windows (some
might find it two completely different worlds).
The initial reason to use WordNet (and later YAGO) was the tree-like structure they have:
going one branch up should give (somewhat of) a basic categorization of the word. In theory
this should give a nice result (linear programming for example links to applied mathematics,
which is a nice subordinate-basic information relation), though it was found that a lot of
manual intervention was needed. First of all, some concepts are extremely nested while
others are not, making it hard to programmatically define how many up branches is the right
amount. An example is the following: biology – zoology – entomology – lepidopterology.
Lepidopterology would be the most interesting to use as tag, though entomology (and
perhaps even zoology) wouldn’t be very nice basic level information categorizations, non-
experts in the area of biology will have a hard time understanding its meaning. Secondly,
while WordNet is quite extended and contains 117.000 concepts, most of the concepts are
irrelevant for this purpose. Even when all challenges occurred in previous chapter are
conquered, “branching up” quickly reduces the number of labels to a dozen or so, again
generating problems for the purpose of this study. Thirdly a lot of interesting labels generated
were not in Wordnet at all. Finally, while some relations are far too deep, some branches
seem to be too shallow, meaning that one branch up gets to somewhere completely else16.
YAGO was used as a second attempt as it contains far more words (almost 17 million). It
however is an automatically generated network, and while the accuracy is high (95%
according to their own work), quite often relations were found to be strange or mishitting.
In the end, Wordnet and YAGO combined were able to provide labels for about 60% of the
labels, almost half of them were removed due to poor fits and manually filled, as well as all
other labels that were not found in Wordnet and YAGO. This process does definitely not
provide a full set of possibly well-fitting labels nor scales well to all studies, but serves the
purpose of the pilot well enough. The resulting set can be found in appendix chapter 1050.
16 The word “engineer” for example is related to the higher level words “disciplines” and “subject of study”. Both are technically correct subordinate-basic relations, though just “subject of study” has no value in this context.

The pilot was implemented by modifying the button in the search results for users that
searched for the keyword “computer”, or in one of the disciplines related to computer science
& IT. For each search result (like the one in Figure 36), the text of the red button leading to
the page of that study is modified, depending on the variant the user is in:
- Baseline: no modification, buttons are displayed as Figure 38;
- Basic level categorization: the basic level categorization versions of the two best fitting
labels were added to the button text;
- Subordinate level categorization: the subordinate level categorization (the original
label) of the 2 best fitting labels were added to the button text
- Mixed: 33%-33%-33% mix of original, basic and subordinate level categorization
buttons were used, randomly assigned to studies. This variation was primarily to find
out if users preferred one of the options if all were present.
- Wrong: Intentionally wrong labels (randomly picked labels that are not associated
with the study) were used, where 50% of the button had a basic level categorization
and 50% had a subordinate level. This variation was used to verify the effect of adding
text to the buttons, even if they were wrong. Note that the distance between the best
possible labels and the wrong ones were not as large as they could be, as all labels
were still from the computer science & IT domain. A big data study being labelled as
“computer circuit” is less “wrong” then being labelled as “nursing”.
If a study got modified, the button containing the word “Detailed Description” was modified
such that its text was changed to “Details (tag1, tag2)” (see Figure 37 and Figure 38). This
syntax was chosen as it needed to be clear that the button lead to the study, just the labels
would have been too vague. Implementation was done with Optimizely17, tracking of user
behavior was done with snowplow and StudyPortals own tracking system (see chapter 12.1.2).
17 An online A/B testing platform which allows inserting JavaScript snippets on webpages.

Between 11-03-2016 and 23-03-2016 1,214 session0s from 937 users were tracked that
participated in the pilot experiment. They randomly got assigned to one of the 5 conditions,
from here on referred to as “original”, “basic”, “subordinate”, “mixed” and “wrong”. Not all
conditions were completely equally balanced, as can be seen in Table 55, for the same reasons
mentioned in chapter 5.3. The differences in session counts between StudyPortals and
Snowplow are quite large as well, as they are measured in different ways. StudyPortals ends a
session when the browser closes or no page request has been done for the last 60 minutes,
snowplow ends a session when no page requests has been made for 30 minutes. A user was
assigned a condition only once, so saw the same condition even if there were multiple
sessions. In the further analyses the StudyPortals session metric will be used.
Users StudyPortals-sessions Snowplow-sessions
basic 174 208 210
mixed 199 252 245
original 201 299 262
subordinate 173 228 225
wrong 190 227 231
This subchapter will do explorative data analysis on the found data with the goal of finding
out if users behaved the ways expected by the hypothesis, and what the (if any) relations
between the variables are.
Three sessions were removed that contained a large number of study page views referred
from the search page: 171, 154 and 91. The average of this metric was 5.54, the next largest
after 91 was 36, all 3 of these sessions were in the wrong condition. Furthermore, all events
without a session id were removed. No further outliers were detected.
In the next subchapter the terms search page and study page are used to a large extend, to
avoid ambiguity, “search page” refers to the search page of BachelorsPortal where studies are
presented as search result tiles (such as Figure 1). A study page refers to a page completely
dedicated to present a single study, accessed by the user referred by the search page.
There are many ways a study page can be visited (directly through search engines, trough
overview pages etcetera), though we are only interested in the studies users view when having
seen the experimental condition. So “study page” refers to study page visits directly linked by
the search page, unless stated otherwise.

Four metrics have been defined in hypothesis 1-6 that should indicate interest in studies.
First of all, there is study click trough, identifying what studies were clicked by users in the
search results. Secondly, dwelling times measure how long a user actively engages with a
certain page (tabs are seen as different pages). Conversion refers to users clicking on one of
the links on study pages referring to the website of the specific university offering that
program. Lastly, dropout happens when sessions leave the website at a certain page, not to
return (in the current session).
One measure that is very relevant is the button clicking behavior on the search page, as that
is the location where the text is edited. Unfortunately, the measurements for the pilot where
not accurate enough: snowplow measured only 51 of these clicks while Optimizely’s
aggregated statistics showed 257 (with none of the variants being close to significantly
different then the baseline). Note that study click trough (covered in Chapter 11.5) and button
clicking are not the same; each search result has 3 links pointing to a study (title, image and
button, see Figure 1).
Study click troughs are measured by taking study page views that are referred to by the
search page, basic descriptive measures per condition are given in Table 56, and shows a very
positively skewed distribution. Table 57 shows the descriptive statistics of number of search
page visits. The decision was made to keep search page visits as a simple metric, without
considering for example backtracking, doing the same queries multiple times or pagination.
Backtracking appeared to be a really small proportion of all search queries (98 out of 2908),
measurements for pagination where invalid due to StudyPortals internal pagination
mechanism and is hard to determine a good separation point in time when 2 of the same
queries should count as 1 or 2 (is it 1 minute, 5, 1880?). Though these are all computational
impracticalities, most important are the hypotheses and calculations needed to (dis)prove
them: they are all centered around single search page views, not some overlying concept like
distinct search result pages. This does imply that each search page means one “search query
action”, and includes all the pagination of that search query. shows that not all conditions
might have equally distributed number of paginations, though for this project the focus is
how user attitudes and behaviors are regarding one search action: if a modification can
trigger them to explore less or more pages, then that’s part of the effect that we’re looking for.

count mean std min 25% 50% 75% max
original 299 1.55 3.06 0 0 0 2 25
basic 207 2.63 5.27 0 0 0 3 39
wrong 226 1.97 4.46 0 0 0 2 36
Subordinate 228 1.75 3.69 0 0 0 2 33
mixed 251 2.07 4.44 0 0 0 2 30
count mean std min 25% 50% 75% max
original 298 2.34 2.33 1 1 2 3 21
basic 207 2.65 3.48 1 1 1 3 33
wrong 224 2.34 3.13 1 1 1 3 38
subordinate 228 2.17 2.38 1 1 1 2 20
mixed 248 2.59 3.23 1 1 2 3 37
Information scent predicts that a stronger scent should lead to users clicking less links (H1)
and more users should be interested in at least one link (H2). Figure 12 shows that the
probability that a user will engage with one of the studies from the search results doesn’t
differ significantly between conditions, a Chi-Square tests resulted in χ42= 0.59, p = 0.96.
Though the power is not large enough yet to support H2, the effect points into the right
direction, with a slightly higher probability for buttons with scent. A logistic regression is

used to test the effect of each condition (see Table 58), no significant differences from the
baseline have been found.
Looking at the search click-through rate (CTR) (number of page views / number of searches)
(Figure 13) a much larger difference can be seen: users in the basic condition averagely view
0.897 studies per search, compared to 0.614 for the original condition. To estimate the size
and significance of each condition on the dependent variable, a negative binomial regression
is used, as the shape of this data (as with other measures discussed below) is over-dispersed.
This means the variance is larger than the mean when it should be equal, and a negative
binominal distribution fits the situation well as it is specialized in handling over-dispersed
data.
The regression (Table 59) shows a significant difference between the original and basic
condition. It shows the opposite of what was expected in H1. There are a number of
explanations for these results, that contradict the results in earlier IFT research. Firstly, the
“real world” differs from the fabricated goals that users had in the original experiments,
which might explain why users are more exploring in this experiment. Secondly, the
increased size (which have an extra significant impact on smaller, mobile screens) might
draw more attention, which on itself, or in combination with varying texts trigger more
action. For now, we’ll assume that any of these (or a combination of the 2) is more likely than
information scent working against users finding their goal (especially given the results of
previous research), and will be referred to as the button effect. The assumption will later be
verified with subjective data.

Page pings were tracked, effectively measuring intervals in time where users are actively
viewing a certain page on BachelorsPortal. Activity is defined by mouse movement or
scrolling in the active tab: if one of those events was performed by the user within an interval
the page ping event triggered at the end of that interval. The first interval was set to 0-30
seconds after initial page load, every sequential interval was an increment of 10 seconds.
While a shorter initial interval would have been more ideal, this period was initially chosen
due to the large number of events (and therefor data) it generates: little over 1 million out of
the 1.195 million18 events are page pings. Dwelling places is interesting in two places: first of
all, the study page - where it is expected to be higher in the high scent condition (H33).
Secondly, the search page, where dwelling times should be lower for higher information scent
(H4).
Table 60 described the statistics for the number of dwelling times per user per study page. In
example, a user that is in the basic condition averagely has 2.28 page-ping events per study
page that he or she visits from the search page, meaning that group averagely spends 42.8
seconds on each search result page they click on. A negative binomial regression used for
parameter estimation shows no significant difference between the original and modified
conditions (Table 61).
count mean std min 25% 50% 75% max
original 267 2.011 3.646 0 0 1 2,5 36
basic 260 2.285 3.325 0 0 1 3 23
wrong 235 2.340 3.171 0 0 1 3 18
subordinate 211 2.199 3.709 0 0 1 3 33
mixed 263 2.536 3.540 0 0 1 3 21
18 This is for all 86.126 users visiting the site in the pilot period, not just the ones participating in the experiment.

Significant differences do exist in whether users on a certain study page triggered at least one
page ping: χ42= 9.84, p = 0.043 (see Table 62). Table 63 shows the logit regressions results of
single page pings as dependent variable.
variation wrong original basic mixed subordinate
no 76 110 76 89 81
no proportion 0.323 0.412 0.292 0.338 0.384
yes 159 157 184 174 130
yes proportion 0.677 0.588 0.708 0.662 0.616
The button effect seems to be present: all versions where buttons are modified the mean
dwelling time is higher, which is in congruence with H3.
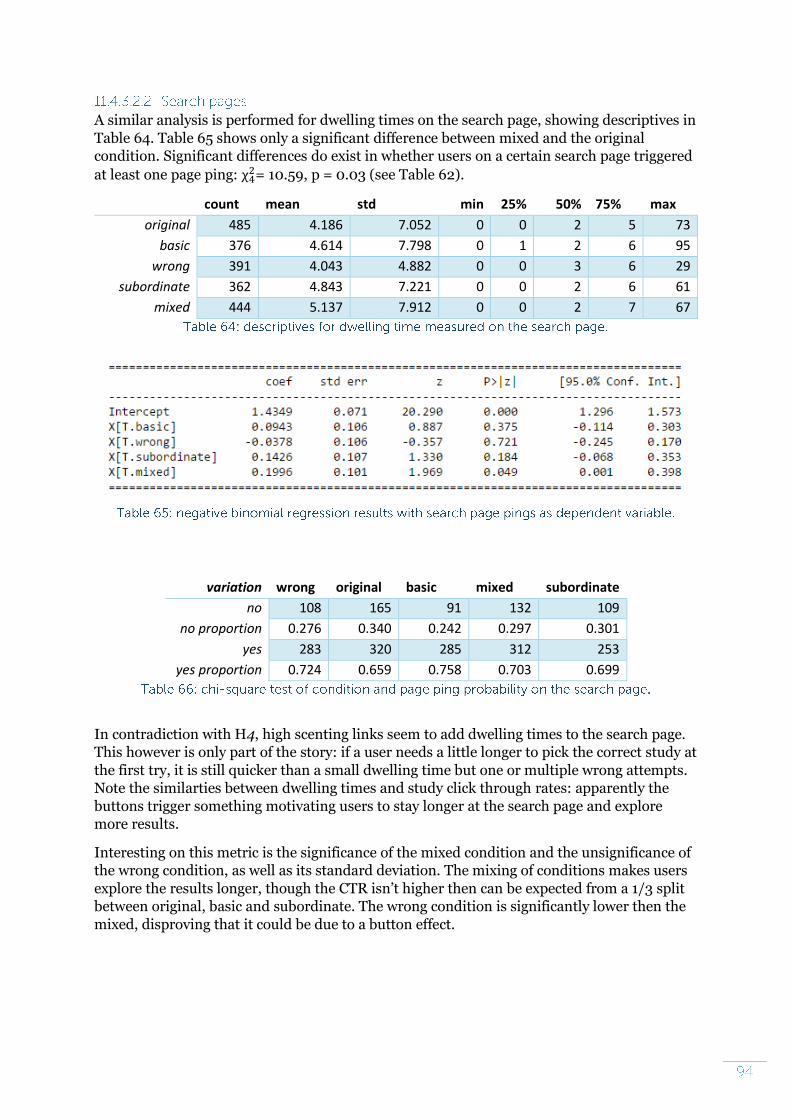
A similar analysis is performed for dwelling times on the search page, showing descriptives in
Table 64. Table 65 shows only a significant difference between mixed and the original
condition. Significant differences do exist in whether users on a certain search page triggered
at least one page ping: χ42= 10.59, p = 0.03 (see Table 62).
count mean std min 25% 50% 75% max
original 485 4.186 7.052 0 0 2 5 73
basic 376 4.614 7.798 0 1 2 6 95
wrong 391 4.043 4.882 0 0 3 6 29
subordinate 362 4.843 7.221 0 0 2 6 61
mixed 444 5.137 7.912 0 0 2 7 67
variation wrong original basic mixed subordinate
no 108 165 91 132 109
no proportion 0.276 0.340 0.242 0.297 0.301
yes 283 320 285 312 253
yes proportion 0.724 0.659 0.758 0.703 0.699
In contradiction with H4, high scenting links seem to add dwelling times to the search page.
This however is only part of the story: if a user needs a little longer to pick the correct study at
the first try, it is still quicker than a small dwelling time but one or multiple wrong attempts.
Note the similarties between dwelling times and study click through rates: apparently the
buttons trigger something motivating users to stay longer at the search page and explore
more results.
Interesting on this metric is the significance of the mixed condition and the unsignificance of
the wrong condition, as well as its standard deviation. The mixing of conditions makes users
explore the results longer, though the CTR isn’t higher then can be expected from a 1/3 split
between original, basic and subordinate. The wrong condition is significantly lower then the
mixed, disproving that it could be due to a button effect.

A conversion event is triggered when a user clicks on one of conversion links (either a button,
links within texts or links in related links lists). An analysis of which of these links were
picked by the user proved to be impossible with the pilot data: the link tracker malfunctioned
and the amount of conversion tracked by StudyPortals were multiple times higher those of
snowplow. As StudyPortals tracking system has gone through numerous verification
processes, its validity is easier to defend than that of snowplow. One outlier with 27
conversions in the basic condition was removed. While it is an outlier in the pilot data subset,
it might not be in all user data: out of all 1.28*105 user sessions within the pilot period, 64
converted more than 26 times. It is removed here as it greatly influenced the results, but
might not be a real-world outlier.
Table 67 shows the descriptive statistics of conversion, an ANOVA test showed no
significance in difference of means F(4) = 0.76, p = 0.55. In an negative binomial parameter
estimation, neither of the conditions where significant predictors for number of conversions
(Table 68).
count mean std min 25% 50% 75% max
original 299 0.4147 1.4684 0 0 0 0 15
basic 206 0.4951 1.5229 0 0 0 0 10
wrong 226 0.3363 0.9439 0 0 0 0 9
subordinate 228 0.3114 0.8777 0 0 0 0 9
mixed 251 0.3586 1.2324 0 0 0 0 14
Table 44 visualizes the means of Table 67 and does show a rather big peak for the basic
condition, though it is far from significant. Figure 43 plots the conversion probabilities that a
user converts x or more times, and gives a clear visual explanation for the effects: users in the
basic condition convert multiple times more often compared to other conditions, while the
other conditions have a slightly higher “converts at least once” statistic.

Finally, looking at the click through rate (# conversions / # study page views per user), Table
69 shows the different CTR’s per condition. Again outliers may play a large role at this small
sample size: 2 participants in the original condition converted 15 & 12 times, greatly
influencing the proportions. Finally no differences were found in whether users converted at
least once χ2(4) = 0.751, p = 0.945 (Table 70).
conversions study views CTR
original 120 3162 0.0379
basic 101 3451 0.0293
wrong 66 2688 0.0246
Subordinate 69 2459 0.0281
mixed 90 4046 0.0222

variation wrong original basic mixed subordinate
no 183 248 171 205 184
no proportion 0.809 0.829 0.830 0.817 0.807
yes 43 51 35 46 44
yes proportion 0.190 0.171 0.169 0.183 0.193
In regard to H6, users in information scent conditions would have been expected to convert
more often. The results for conversion do not yet show significant differences.
A session is considered a dropout when it leaves the website not to return in the same
session. The place where the dropout happens is of significant importance: it means the user,
for whatever the reason may be, does not want to continue browsing the website. While there
are cases where dropout can be positive from the user perspective (i.e. the perfect study was
found and just the university needed to be retrieved), we assume here that a dropout is a
negative signal if no page pings are detected, indicating that the user closed the session after
showing little interest into the content. 174 users (0.1433 of all test sessions) dropped out
with a page ping, excluding them from the analysis in this subchapter. Table 72 shows almost
equal “page ping dropouts” amongst the conditions, with a insignificantly smaller percentage
for the baseline.
original basic wrong subordinate mixed
Dropout with page ping 35 33 33 35 38
Total sessions 299 208 227 228 252
Dropout proportion with page ping 0.117 0.159 0.1454 0.154 0.151
As can be seen in Table 72, there are large differences in the dropout rates between the basic,
original and subordinate condition. A chi-square test between these 3 conditions show a
significant effect of condition on dropout rate on the search page: χ22 = 6.07, p = 0.048. A
similar pattern exists for the study dropout, though the effects are not significant: χ22 = 2.52, p
= 0.28.

A logistic regression on both variables showed that the effect of each conditions were not
significantly different (Table 73 for the search page, Table 74 for the study page).
original basic wrong subordinate mixed
Dropout search 0.4144 0.2759 0.2618 0.3160 0.2727
Dropout study 0.1597 0.1437 0.1780 0.0933 0.1100
Dropout study all 0.2091 0.1782 0.2251 0.1347 0.1866
Dropout home 0.1635 0.1667 0.1989 0.2332 0.1770
Dropout countries 0.0380 0.0172 0.0576 0.0415 0.0862
Dropout disciplines 0.0342 0.0575 0.0314 0.0726 0.0718
Dropout study options 0.0989 0.2586 0.1623 0.1347 0.1339
Dropout university 0.0228 0.0172 0.0471 0.0363 0.0431
Overall the drop-outs points at the expected effects of information scent on goal attaining:
dropout rates reduce significantly on search pages if information scent is higher, again
showing a button effect. Subordinate conditioned users drop out significantly less as study
pages as well, being congruent with the information scent theory. While not significant, the
quality of the button texts is clearly presented in the coefficients of Table 74: wrong causes
users to drop out most on study pages. Figure 44 visualizes Table 74.


Most notable in the results of the pilot is the low power: most effects (if any) are relatively
small and need a high number of participants to verify significant differences, the 1.214
sessions clearly were not enough. As there is a need for significantly more participants, a fully
automated auto-labelling algorithm wouldn’t be just convenient but a requirement for this
experiment. This would also remove the biases introduced by manual intervention, which
might have influenced the labels. Furthermore, an experiment over all study-programs
removes the “Computer Science & IT bias”: it isn’t hard to imagine that health care or law
students behave differently from CS&IT students.
The mixed condition proved to give some insights; while its main purpose was to measure
button choice behavior, which the tracker failed to measure properly. 472 tracking events
where triggered where the button details where saved, and though it’s only a small proportion
of the total number of searches it should give some idea about the preferences: in the mixed
condition, where 33% of the shown studies had the original button text, only 25% of the
clicked studies had the original text. Moreover, 50.42% of the clicks where basic
categorization, the remaining 24.58% was subordinate. Interestingly, basic and subordinate
separation in the wrong condition was almost 50-50, though a measurement error could not
be excluded based on the gathered data. This suggests a general preference towards basic
information categorization, as suggested by H13. Another surprising effect happened in the
dwelling time of the search page: mixed conditioned users used the search page significantly
(& study pages, though not significantly) longer. This wouldn’t only suggest a button effect,
but also a between-button diversity effect, effectively adding decision time if the diversity
between buttons is larger. While the conversion was not larger, dropout and CTR were
comparable in the mixed condition compared to the other modified conditions. Perhaps the
diversity triggers some curiosity. Though it’s outside of the scope of this project, it does look
like a promising effect worth looking into.
The wrong condition proved quite valuable in showing the effect size of the earlier discussed
button effect, and would therefor add valuable insight into the main experiment. The
combined metrics show a large initial interest of users due to the labels: CTR is high &
dropout rates are low on search and a low dwelling time. This optimism seems to turn tide
however when users inspect the actual studies, resulting in lower overall conversion (though
convert-at-least-once probability is higher) and higher drop rates. This could be expected: the
information scent lures them in, but on discovery that they are in the wrong patch they leave
for other information.
From a design perspective, buttons often became very long (especially with 2 labels, each one
spanning multiple words), which presented itself as a problem on mobile phones. Here the
buttons were too long, effectively making them 2 lines, making them even more prominent in
the interface. This both had aesthetical and experimental drawbacks and the choice was
made to only use one tag per button.

A large part of this project consisted of exploration into StudyPortals data to find viable
hypotheses for research. Much of the early exploration was done under the assumption that
StudyPortals had “Big Data” and therefor required analytical processes that could scale to
immense sizes. It turned out that for this project, the big data could with relative ease be
reduced to a lot of data, that still could be processed on a normal laptop. That reduction
allows for much quicker processing and iteration, though the process is not scalable in the
current form. Switching a number of processing and storage steps however allows for the
same process to scale to several hundreds of Terabytes of storage and “infinitely” scalable
analytics, which should be sufficient for StudyPortals current and upcoming data needs.
This chapter covers some of the main processes and findings of the data exploration, as well
as a recommendation for scaling the analytical process to terabyte-scale. In contrast to the
other chapters, it is mostly process focused.
Several data sources were available when the project was started. This subchapter aims to
provide a short oversight of these sources. Generally, 4 “pipelines” were available:
- Server logs: requests that are to the servers that are logged by apache2 (an open
source web server). The logs are stored as simple flat-text lines and pushed to an
aggregation service, which makes it straight forward to download all server logs from
several servers;
- Portal logs: business critical data logged by StudyPortals’ custom trackers and
processing;
- Google analytics: tracking script by Google that tracks user behavior and presents the
aggregated results in a number of reports. StudyPortals does extended effort to keep
this up to date with relevant labels, user metrics etc.;
- StudyPortals own database, which can be communicated with trough an API
accessible from their internal network. Where portal logs are the events performed by
users, this is the actual content of their websites, i.e. studies, countries etc.
Both GA and StudyPortals’ API will not be covered in detail, the first because it’s a
commercial product of which plenty of documentation is available online19, the second one
because it is essentially the core of StudyPortals’ business and allows access to over 200
database tables, making it a very long and irrelevant description. The latter is also barely
used for this project, besides gathering all available disciplines and studies.
19 www.google.com/analytics

Apache2 is server software, processing incoming HTTP requests, diverting the request to the
right scripts (PHP in this case) and outputting the response of that script to the requesting
user. Apache2 logs all these requests by default, resulting in a stream of all HTTP requests
performed by users to that certain server, including html pages, but also CSS and JS scripts
and images for examples. The formatting is done using the standard settings so that every
request that a user makes is saved into flat text files in the following format:
Two examples:
Generally, apache logs’ usefulness is limited to a number of use cases. The most
straightforward analysis is that of general web traffic, i.e. what popular pages are (Girme &
Laulkar, 2015; Kalola, 2014; Premchaiswadi & Romsaiyud, 2012) or trying to catch DOS
attacks (Lee & Lee, 2012). Clustering of users, or constructing matrices of page visits per
users can be done as well (Premchaiswadi & Romsaiyud, 2012). In the case of StudyPortals,
apache logs needed quite some filtering and work to make them somewhat more reliable and
useful, these are some of the issues found during exploration:
- Sessination: apache logs contain very little user specific information besides IP
addresses and a ‘userId’ variable, a user identifier at server level, making it unusable
for user analysis. Thereby, users can only be identified by IP address and user agent,
meaning all data that is performed by IP’s that are suspected of being used by
multiple users (about 40% of all weblogs, depending on the exact cutoff point) has to
be left out of user analysis. It is good enough for basic analysis, but user targeted
analytics need something more reliable and precise.
- Caching as well as reversed proxies are used to optimize page rendering speeds, which
is great for speed purposes but results in HTTP requests not hitting servers anymore,
therefor not logging the request while it was made.
- Quite some page interactions like modals, on-page clicks, page dwelling and repeated
search actions are web-based interactions, meaning that no specific requests are done
to the backend servers, and such the information is not logged.
- As everybody can simply make server requests, the data needs a lot of preprocessing.
Bots for example scrape whole websites and can significantly influence results. While
most of them identify themselves as bots with proper user agents, a number of “bad
behaving” bots have been found.
- The data contains every server request. This means loading a study page can consist
of dozens of requests, loading resource scripts, images, doing API requests for
additional information. While these can be filtered out with relative easy, the requests

can have some significant meaning (i.e. loading of a new piece of on-page
information, a new search query or page loading times).
For the purpose of this research project, Apache2 logs were generally found to be too
unspecific (especially with regard to user recognition) and required a lot of preprocessing and
filtering.
Several types of user interaction are recorded in a custom logging system, which was created
to save data used to invoice StudyPortals customers. The logs are generated in the browser
and are sent to the tracking API in JSON format. There they are stored as flat text files and
parsed once every 24h. In this parsing process they are validated and saved in a relational
MySQL database (in aggregated form), as well as in an ARCHIVE MySQL database. The
JSON files and archive tables are mainly for backup purposes, the relational MySQL tables
are used for invoicing, analytics and reporting. An example of a tracked event is shown in
Figure 45, in this case it is a banner (“bnnr”) impression (“impr”).
For each event a number of parameters are tracked, for example the timestamp, details on
the user and the location from where the event was triggered. Table 75 includes the details of
all these variables.

Key TYPE Description
v INT Version of the log, currently only 1
T INT UNIX Timestamp
a OBJECT This represents the logged action
a.a STRING The actual action. Possible values are: - impr Impression - clic Click - view View - subm The submission of a lead form
a.t STRING The target of the action. Possible values: - bnnr A banner on the page - study A study (i.e. comparable studies shown on a study page) - org An organization or university - srch Results of a search query - lead The submission of a lead form (in which case a.a. is subm)
A.I STRING Action identifier. Can be an integer for bnnr, study, org and a search string for srch.
a.d STRING The name of the instance id, or url of a click
A.l STRING Commercial type of the action, either premium, regular or revenue
I OBJECT Represents the object of a shown element on the requested webpage, i.e. a banner, search result or spot instance.
I.T STRING The type of the shown element. Possible values: - other - rslts - study - spot
I.I INT The id of the shown element.
I.D STRING The name
I.L STRING Commercial type of the shown element, either premium or regular
U OBJECT The object that holds data on the user
U.I STRING Ip address of the end user
U.S STRING Session ID: a unique identifier that identifies a user throughout a session.
U.l STRING Language of the user
u.c STRING Country of user
s STRING Last used search string by user. Search string is in the StudyPortals search string format.
While the data is generally accurate and clean, only information that is directly interesting to
universities and colleges is tracked, which is only a subset of the data usually required for
more detailed analytics. Only search- and study page views are tracked for example, and very
little user information (such as user agent or device type) is available. It proved to be more
useful in combination with the server logs, but the lack of a unified definition of a user (only
IP addresses are available for both datasets) made merging the two datasets error prone and
complex.
BachelorsPortal besides a custom logging system, also uses a custom query construction,
enabling every query to be summarized into a single string. This simplifies search queries
over different production and analytical systems. Each query consists of concatenated
[parameter]-[value] combinations, separated by pipes. A valid query would be lv-bachelor|di-
7, looking for bachelor studies with discipline 7. Table 76 summarizes all possible parameters
and data types.

Parameter Explanation Data Type
Lv Level of education Master, bachelor
Kw Keywords (string)
Di Disciplines List of integers
Ci Location List of integers
Ln Language of instruction List of integers
Mh Select filters Face2face, blended, online
Tm Tuition fee minimum Integer
Tx Tuition fee maximum Integer
Tt Tuition type Eea, noneea
Tu Tuition timeunit Semester, year
Dm Minimal days of program Integer, 360 days in 1 year
Dx Maximal days of program Integer, 360 days in 1 year
Sd Month on which program starts
List of integer (1=jan, 12=dec)
De Parttime/fulltime Parttime, fulltime
Dg Type of degree Msc, bsc, (+ others)
Jt Special programs Erasmus, erasmus_scholarship, joint(inter-university/joint)
As initially the perception was that analytics should be done on a “big data” scale, a Hadoop
based solution was looked into. Hadoop20 is a popular open source Apache project that
handles distributed file storage and processing, allowing analytical tasks to be spread out
over servers and chunks of data, allowing for theoretically infinitely scalable processing.
Nearly every big data product is based on Hadoop, making it the perfect framework. As most
of StudyPortals infrastructure was already run on Amazon, the decision was made to run
Hadoop on AWS.
Amazon Web Services (AWS) is a collection of cloud computing services offered by amazon,
ranging from simple storage space (S3) to computing power (EC2), email, key management
etc. Any of these service instances can be quickly deployed (in matter of minutes) and scaled
up or down – allowing for example a website to almost instantly increase or decrease their
server size depending on the current traffic. AWS is only charging the amount of server
capacity used. This pricing model, reliability and scalability has made it a popular choice to
host websites or do computations.
AWS offers an Elastic Map Reduce (EMR) service, where a cluster of worker and task nodes
can be configured and deployed with a few clicks, in a few minutes. EMR is basically a top-
level service which launches multiple EC2 instances (Virtual Private Servers), installs a
preferred Linux Distribution (AWSs own ‘AMI’ is the default), installs and configures Hadoop
and preferred libraries build on top, and configures all the underlying connections between
these EC2 instances and the S3 storage where data is pulled from. This allows for an easy
start with Hadoop with almost zero fiddling with server setups, but comes at the cost of
vendor lock-in, server costs and hiding of lower level details through higher level services.
20 http://hadoop.apache.org/

A combination of hive and impala were used for analyses. Both are built on top Hadoop and
use a subset of SQL to query data from flat files. Hive is built on the (now somewhat old)
map-reduce technique, that runs the same query on multiple data chunks, and then combines
(reduces) the results into one main output. Initially developed by google to run their massive
queries on common hardware, the technique showed good initial results but more modern
techniques have proved to be much faster. Impala uses nearly the same SQL-like syntax but
proved to be significantly faster, up to a 100 times for some queries. Practically, their main
difference is that hive accepts custom serdes: functions that allow parsing of a flat input file.
In example a JsonSerde allows parsing JSON into HDFS, where the build in RegExSerde
allows parsing files based on regular expressions. Impala doesn’t have this feature, but the
significant speed improvements make it the preferred choice for running analytics. This
makes hive perfect for the importing of data from S3 (something that AWS EMR allows to be
set as a bootstrap job) and impala for any analysis. Using a month of data (around 100
million server logs and 30 million StudyPortals logs) took an EMR cluster of 1 master and 2
worker nodes (costing a total of about 1$ an hour to run) around an hour to setup and import
all the data. Impala queries run on the cluster then gave near-instant results (depending on
the complexity).
Due to the lack of certain data types and the complex processing required to get only limited
reliability in data, alternative ways were explored to gather and structure data. Between a
wide variety of commercial products, Snowplow seemed to be an open source alternative that
met all the requirements for this project. Besides being free and allowing for full control, it
integrates well with Google Analytics tracking, and a lot of scripts are prewritten, ranging
from JavaScript trackers to clustered cleaning and processing steps allowing for scalable
processing. Giving a detailed overview of snowplow would be a mere copy of the
documentation, for that we refer to http://snowplowanalytics.com/.
For this research project only the first part of the pipeline (up until validation) provided by
Snowplow was used. They offer enrichment and modelling scripts that can be setup on AWS
clusters and allow for the process to be “massively scaled”, which was not the intention of this
project. On playing with a rough local setup, a simple python script for parsing and a MySQL
database proved to be enough to gather the necessary data.
Overall the quality of data with snowplow seemed to be higher than server logs. Bots rarely
execute JavaScript, and the setup is immune to caching proxies. Moreover, the standard data
logged by Snowplow is much better suited for analytics, and accounts for much of the
problems discussed before such as sessination.
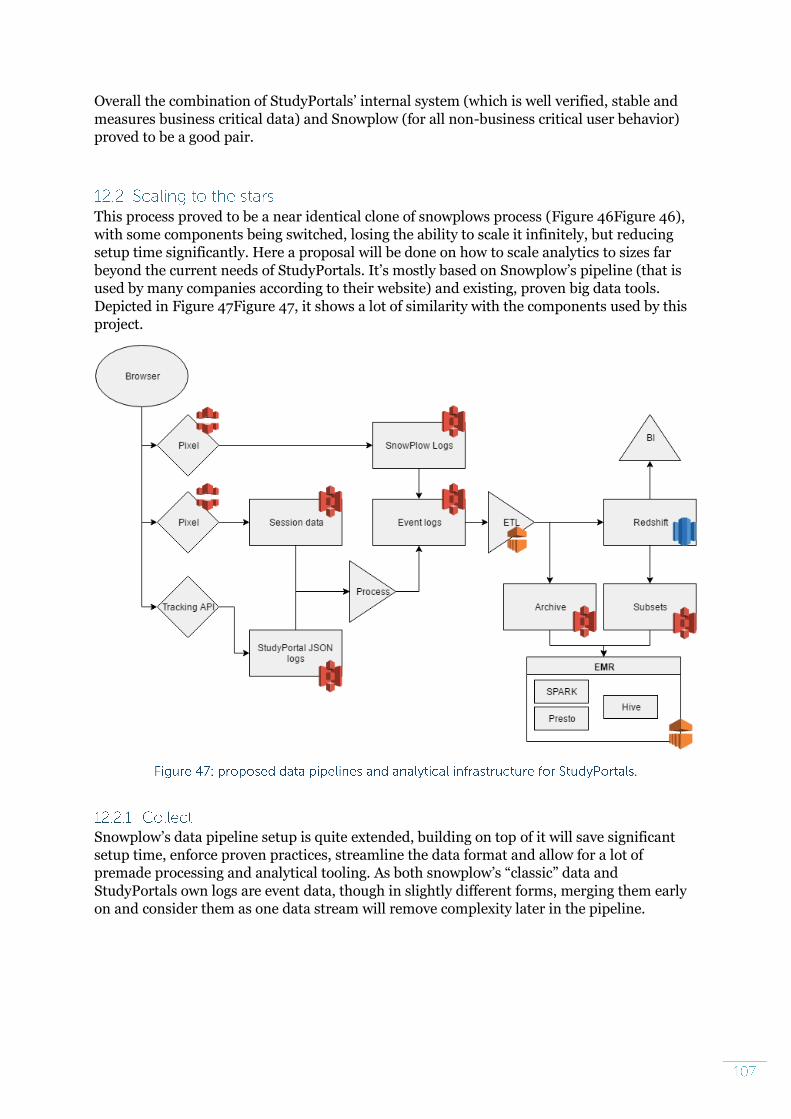
Overall the combination of StudyPortals’ internal system (which is well verified, stable and
measures business critical data) and Snowplow (for all non-business critical user behavior)
proved to be a good pair.
This process proved to be a near identical clone of snowplows process (Figure 46Figure 46),
with some components being switched, losing the ability to scale it infinitely, but reducing
setup time significantly. Here a proposal will be done on how to scale analytics to sizes far
beyond the current needs of StudyPortals. It’s mostly based on Snowplow’s pipeline (that is
used by many companies according to their website) and existing, proven big data tools.
Depicted in Figure 47Figure 47, it shows a lot of similarity with the components used by this
project.
Snowplow’s data pipeline setup is quite extended, building on top of it will save significant
setup time, enforce proven practices, streamline the data format and allow for a lot of
premade processing and analytical tooling. As both snowplow’s “classic” data and
StudyPortals own logs are event data, though in slightly different forms, merging them early
on and consider them as one data stream will remove complexity later in the pipeline.

Snowplow logs are processed the way they are now: simply stored in an S3 bucket waiting to
be processed. StudyPortals’ JSON log data however will be transformed into the same
structure with help of session data triggered by the browser. This processing step is trivial, as
it combines the data from 2 static files, and can easily be processed by AWS Lambda service
for instance, allowing for scalability and direct processing: as soon as the logs are available
they will be processed to the event log bucket.
Depending on the requirements a lot of logic can go into the processing step, ranging from IP
location lookups, IP anonymization, user agent processing & device authentication, and even
custom API calls to gather resource information. It’s main functionality however is to take the
files in the event log S3 bucket, and output it into another S3 bucket into “event files”,
optimized to be loaded into redshift. The outputs will be archived, both for later processing or
loading if required, and for input for Hadoop / EMR based analytic processes.
The ETL (extract, transform, load) step can be done instantly with snowplow’s Scala Kinesis
(an AWS service) scripts, though initially an on-schedule ran ETL-EMR setup is suggested,
that runs on set times and processes all event logs that gathered in between previous run and
the current. Kinesis adds setup and maintenance overhead and currently real-time
processing is not required.
Stored in redshift, data is available for a wide range of clients to be analyzed. As storage
infrastructure is fully managed by AWS and storage schemas are predefined by Snowplow,
this step is very low maintenance and low effort. The same goes for the events logged in S3,
waiting to be read into other data sources for further processing.
While redshift is on top of the market regarding speed, badly designed queries that run for
hours (or even days) can clough up the cluster and significantly slow down other queries. It is
therefore suggested to:
- Limit access to database-experienced users;
- Train them in redshift query optimization. Ideally deep, though a short training
session can enforce a number of good practices;
- Limit query execution time, so queries going wild can’t run forever.
All data is available in Redshift, allowing for a wide range of clients to access and query the
data. Commercial parties like Tableau and SAS provide direct connections, and with
Redshifts ODBC and JDBC connectors, all software supporting these drivers can connect to
the store and start querying data.
For custom processing, for example complex statistics, data outputs and machine learning,
custom EMR jobs can be used. They can load either all data from the archive bucket, or query
subsets from the redshift data store. The tools used from hereon are dependent on the
requirements and the engineer(s) implementing them, but is independent from the data store
itself.
Copyright © 2022 FDOKUMEN