
Eindhoven University of Technology MASTER FinTech ...
66
Eindhoven University of Technology MASTER FinTech valuation the establishment of a valuation method for approximating the value an immature and highly uncertain financial subsector by combining academic financial heuristics Langerveld, D.J.H. Award date: 2018 Link to publication Disclaimer This document contains a student thesis (bachelor's or master's), as authored by a student at Eindhoven University of Technology. Student theses are made available in the TU/e repository upon obtaining the required degree. The grade received is not published on the document as presented in the repository. The required complexity or quality of research of student theses may vary by program, and the required minimum study period may vary in duration. General rights Copyright and moral rights for the publications made accessible in the public portal are retained by the authors and/or other copyright owners and it is a condition of accessing publications that users recognise and abide by the legal requirements associated with these rights. • Users may download and print one copy of any publication from the public portal for the purpose of private study or research. • You may not further distribute the material or use it for any profit-making activity or commercial gain
-
Upload
khangminh22 -
Category
Documents
-
view
1 -
download
0
Transcript of Eindhoven University of Technology MASTER FinTech ...

Eindhoven University of Technology
MASTER
FinTech valuationthe establishment of a valuation method for approximating the value an immature and highlyuncertain financial subsector by combining academic financial heuristics
Langerveld, D.J.H.
Award date:2018
Link to publication
DisclaimerThis document contains a student thesis (bachelor's or master's), as authored by a student at Eindhoven University of Technology. Studenttheses are made available in the TU/e repository upon obtaining the required degree. The grade received is not published on the documentas presented in the repository. The required complexity or quality of research of student theses may vary by program, and the requiredminimum study period may vary in duration.
General rightsCopyright and moral rights for the publications made accessible in the public portal are retained by the authors and/or other copyright ownersand it is a condition of accessing publications that users recognise and abide by the legal requirements associated with these rights.
• Users may download and print one copy of any publication from the public portal for the purpose of private study or research. • You may not further distribute the material or use it for any profit-making activity or commercial gain

Eindhoven, November 2017
FinTech valuation: The establishment of a valuation method for approximating the value an immature
and highly uncertain financial subsector by combining academic financial heuristics
By
Daniël Langerveld
BSc Industrial Engineering & Management Sciences
Eindhoven University of Technology 2016
Student number 0833817
in partial fulfilment of the requirements for the degree of Master of Science in Operations Management
and Logistics
Supervised by
dr. A. Chockalingam, TU/e, OPAC dr. S.S. Dabadghao, TU/e, OPAC dr.B. Huang, TU/e OPAC

PREFACE This thesis marks the end of my time at the Eindhoven University of Technology. I would like to thank a
few people that supported me throughout my study period and shaped me towards the person I am now.
I would like to thank my first supervisor Arun Chockalingam, not only for tutoring me throughout the last
few months, but also for being flexible and understanding. Mainly due to his flexibility I was able to
combine full time employment with finishing my Master degree. Furthermore, the way he tutored
couldn’t be better. The meetings and conversations we had, mainly via Skype and Whatsapp (which shows
his flexibility), were not that much focusing on feedback and reviewing. The meetings can better be
described as conversations in which we did not only talk about our passion for transactions and valuations
but also about our personal life and career. I would also like to thank my second supervisor Shaunak
Dabadghao for both providing constructive feedback and for always understanding my situation when he
didn’t hear anything from me for a long time. Last, I would like to thank my bachelor tutor Simme Douwe
Flapper. Maybe it is irregular to mention a bachelor tutor in a master thesis preface, but mr. Flapper
shaped me the most during my study time. Mr. Flapper learned me to always be to the point, don’t speak
about to much hassle and he also learned me how to combine a busy life with good university grades.
Thanks to his contribution, I learned how to successfully implement the 80-20 rule in everything I do.
I can write a whole epistle about the help my parents and sister gave me throughout my time as a student,
but I don’t think that is needed. I would just like to thank them for always being there throughout the five
years, for their unconditional support and for being the family I needed. Last but certainly not least, I want
to thank Juul for both the perfect and stressful moments we had and will continue having.
I especially want to thank my dad for providing me the advises and help I needed during my Master period
in order to make the best decisions related to both my professional and academic career.
Daniël Langerveld, November 2017
TABLE OF CONTENT Preface .......................................................................................................................................................... 2
Table of Content ........................................................................................................................................... 3
Chapter 1. Introduction ................................................................................................................................ 4
1.1 What is FinTech? ................................................................................................................................. 4
1.2. Is the FinTech area comparable to other (r)evoluationary (failed) areas? ........................................ 4
1.3. Why is it worth studying FinTech? ..................................................................................................... 6
1.4. Which FinTech related valuation information is still missing? .......................................................... 8
1.7. Thesis layout .................................................................................................................................... 10
Chapter 2. Is the described problem also seen in the valuation of FinTechs? ........................................... 11
2.1. Comparing advices for newer and established FinTechs ................................................................. 12
2.2. Accuracy in direction ........................................................................................................................ 15
2.3. Comparing variance in target stock prices per company................................................................. 16
2.4. Is valuation for newer FinTechs more difficult than for established FinTechs? .............................. 17
Chapter 3. FinTech valuation difficulties .................................................................................................... 18
3.1. Introduction ..................................................................................................................................... 18
3.2. How to deal with growth? ............................................................................................................... 18
3.3. How to deal with regulation? .......................................................................................................... 27
3.4. Determine discount related items (cost of capital, costs of assets, market return and beta) ........ 37
Chapter 4. Valuation model analysis .......................................................................................................... 48
4.1. Introduction to chapter.................................................................................................................... 48
4.2. Models that are included in the test ................................................................................................ 49
4.3. Results of the analysis ...................................................................................................................... 52
Chapter 5. Conclusion ................................................................................................................................. 56
5.1. Conclusion ........................................................................................................................................ 56
5.2. Discussion, limitation and future research ...................................................................................... 58
Chapter 6. References ................................................................................................................................. 60
6.1. Literature references ....................................................................................................................... 60
6.2. Figure references ............................................................................................................................. 63
6.3. Table references .............................................................................................................................. 63
Appendix A .................................................................................................................................................. 64

CHAPTER 1. INTRODUCTION
1.1 What is FinTech? Financial Technology, commonly referred to as FinTech, is a relatively new concept which is defined as the
evolution of the interaction between technology and traditional financial services (Dula & LEE Kuo Chuen,
2018; Lee & Shin, 2017). The term mainly refers to both start-ups and established (financial) businesses
developing new financial service business models based on innovative, disrupting and efficient
technological solutions (Investorpedia, 2017). The concept and its market are evolving so rapidly that
information becomes easily outdated (Bank of Newyork Mellon, 2015; CB Insights, 2017). This is mainly
driven by the amount of new applications introduced, the immaturity of the market and the uncertainty
in terms of regulations growth, competition and evolution (EY, 2016). There are comparable historical
market developments such as the introduction of mobile phones and social media networks which had
revolutionary impact on the ‘traditional’ market. In these markets, the traditional old-fashioned business
models and products almost fully disappeared (Lloyd, Gulamhuseinwala, & Hatch, 2016).
FinTech companies are showing the same characteristics. FinTechs (FinTech companies) are trying to
disrupt the financial market (Lloyd et al., 2016). Not specific product categories are disrupted, but all
product categories are tried to be redesigned (Leong, Tan, Xiao, Tan, & Sun, 2017; ICAR, 2017; McKinsey
& Company, 2016; PWC, 2016). Furthermore, due to today’s easiness in global communication through
the internet, FinTechs are founded all over the world and have a global reach (Lloyd et al., 2016). Investors
are becoming increasingly interested in the concept, resulting in a growth in the number of introductions
and professional start-ups per period (CB Insights, 2017).
It must be noted that the number of product groups is increasing over time, since many processes and
activities are currently automated and simplified by FinTech applications. Within the European market,
payments, consumer financing and middle size business equity financing are well established and
relatively large product groups. Other product groups, such as, data science, blockchain based products
and trading are rapidly growing (Lunn, Pylarinou, & Ellerm, 2017; Sawyer, 2017). These new introduced
product groups are also indirectly increasing the size of other markets. For example, the supply chain
financing market could increase in size by adopting blockchain related FinTech applications (Dula & LEE
Kuo Chuen, 2018).
1.2. Is the FinTech area comparable to other (r)evoluationary (failed) areas? FinTech companies differ from ‘traditional’ financial institutions mainly in terms of their business model
as described in section 1.1. However, one could argue that in the past there were also trends in which

financial companies tried to come with revolutionary business models and disrupt the mature and ‘old-
fashioned’ financial market (Abreu & Brunnermeier, 2003; Brunnermeier, 2009; McKinsey & Company,
2016). This was also the case during the period of the internet-boom, the period between 1984 and 2007
(Badr, 2018; Gaban, 2018). In the following subsections, the historical evolution period of the internet-
boom is compared to the current FinTech boom. By doing this comparison, it will become clear that
FinTech companies cannot be considered as the next (r)evolutionary failure period in which ‘traditional’
business models are tried to be pressured and disrupted (Badr, 2018; Biedermann, 2015; Gaban, 2018;
Ho, 2018). This comparison also shows the significance of studying FinTech markets, companies and
products.
1.2.1. The economic crisis, a non-significant impact Since the first issued mortgage in the 11th century, banks have developed a robust but complex business
model, which remained almost the same for decades. This model kept intact by stability due to slow
changing customers (De Jonghe, 2010). Even during the last evolutional technological disruption, the
internet-boom between 1984 and 2007, the traditional model of banking was not changed significantly.
Still, during that period, banks were able to obtain sustainable returns on their equity. During this period,
banks were massively attacked by new market entrants which tried to disturb the traditional financial
banking model in terms of new digital currencies, payment methods, etcetera. Most of these new
entrants, over 450 globally, didn’t survive. Only five entrants survived and these entrants only added
additional services to the traditional banking model (Abreu & Brunnermeier, 2003; Brunnermeier, 2009;
McKinsey & Company, 2016).
1.2.2. The FinTech-boom, a disrupting evolution After the economic crisis, started in 2008, the number of FinTech companies increased with a market size
compound annual growth rate (CAGR)1 between 2008 and 2013 of 27%. After 2013, the FinTech-boom
grew exponentially with an increasing market size from $4.0 billion in 2013 to $12.2 billion in 2014
(McKinsey & Company, 2016). Different factors explain why the FinTech-boom is more disrupting
compared to the internet-boom. First, customer trust and loyalty towards the traditional banking system
decreased because of the negative influence of banks during the financial crisis. Second, availability and
easiness to reach out to financial services increased. Due to connectivity and the increased possibilities of
mobile devices, physical contact with banks became less useful. Third, a new generation, which grew up
1 The compound annual growth rate: the mean annual growth rate of over a period of multiple years (Investopedia, 2017)

with new mobile solutions, are more willing to change. (McKinsey & Company, 2016). Fourth, the total
financial sector is currently being influenced by new entrants, which was not the case during the internet-
boom (PWC, 2016).
1.2.3. Conclusion Comparing the failure figures of the earlier ‘boom’ (only one out of five companies survived) with the
FinTech-boom (ca. 56% of the start-ups were still operating after four years (Pryor, 2016), it can be
concluded that the FinTech-boom at least shows more promising results, obviously due to the lower
failure rates, the reason of existence of FinTechs is stronger. During the earlier ‘boom’ there was no real
incentive and need (for customers) to have new business models. The possibilities and potential of
internet for to set up new financials business models were there, however, there was no real need.
Customers were still satisfied with the way financial services were provided. The economic crisis resulted
in the need for new financial business models resulting in the FinTech-boom. It can be concluded that the
FinTech-boom is driven by needs instead of by possibilities. Thereby the FinTech-boom is more promising
and already more successful compared to the earlier ‘boom’.
1.3. Why is it worth studying FinTech? The FinTech-boom is still immature and developing rapidly in terms of total market capitalization,
investments made, products available, number of start-ups etcetera. Still, there are a lot of relevant
FinTech related topics are not researched yet. Furthermore, since the real potential of FinTech companies
is still not fully discovered, it is hard to determine the value of a FinTech company (later in this report the
relevance of valuing and the valuation of FinTechs is further discussed). (Excerpt, Goedhart, Koller, &
Wessels, 2018; Lavender, Pollari, Raisbeck, Hughes, & Speier, 2017; Riethdorf, 2018). For example,
‘traditional’ financial institutions recognized that changes in their business models are not only relevant
but also needed to remain competitive. But also the other way around, most FinTech companies can only
provide value by having enough scale and the right regulation approvals. Considering the pitfalls and
potentials for both ‘traditional’ financial institutions and FinTech companies, one could simply suggest
that the two types of companies will collaborate to synergize each other’s advantages. This is not always
done.
It is clear that, both parties can choose to compete or to cooperate (Skan, Dickerson, & Gagliardi, 2016).
For both parties, an assessment has been executed during the pre-thesis literature review phase in order
to understand what the impact will be of both strategies to find out if there is an overall strategy beneficial
for both sides. Currently collaborative FinTech investments are higher valued by investors in comparing

to competitive FinTech companies, which indicates that FinTech companies can better cooperate than
compete.
In total, one-fifth of all banks researched feel that traditional banks will lose market share to FinTech
companies if no internal changes are made to handle the six mentioned challenges. Two-fifth of all
researched banks forecast that the total financial industry will become more disaggregated,
whereby banks will mainly lose market share in less profitable financial segments. The remaining
percentage expects that no significant changes will occur in the banking sector due to FinTech companies.
Next to the operational reasons also strategic reasons declare the relatively low amount of invested
capital. An important strategic reason impacting the amount of capital invested in FinTech companies is
the fact that there is currently no widely used and understood valuation method. Large corporations, not
only banks but also companies from other sectors, such as logistics and insurances face this problem.
Traditionally, the metric return on investments (ROI) can be used to estimate the value of a company.
However, the main characteristic of FinTech companies is the high innovation quotient. At this moment,
there is no consensus amongst investors how to deal with high innovation. This is mainly driven by the
fact that it is currently not clear what the potential of the FinTech innovation is for a company (Accenture,
2015; EY, 2016; Skan et al., 2016).
1.3.1. How will this report contribute to this discussion? As described earlier, investors become increasingly interested in FinTechs. For both FinTech owners and
potential investors it is important that the valuation of FinTEch companies should be done properly.
Owners would like to receive a fair value for their company and investors don’t want to overpay. Currently
the market for FinTechs is still immature in terms of market size. Furthermore, there are several different
aspects that make the valuation of FinTech companies even more difficult (e.g. growth and regulation
(these topics will be discussed later). These aspects make it more difficult to value FinTechs compared to
other immature markets. There is currently no widely used valuation method which includes these
aspects. In this report, heuristics will be combined to eventually set up a valuation method which does
not only includes factors covering the immature market aspect but the other aspects (e.g. growth and
regulation) as well.
In this report a first start will be made to set-up an academic theory supported valuation model. There
are three different types of value which will be explained. Fair market value: The value of the company is
purely determined by the market mechanism. Based on the willingness of both the buyer and the seller,
the value of an enterprise is determined. Fair market value determination can only be considered if there

is sufficient supply and demand. Therefore it is mainly usable for public companies (Barker & Schulte,
2017; Siekkinen, 2016). Strategic value: The value of the company is determined by its potential for a
specific investor. Potential is determined by amongst others synergies, opportunity costs, easiness to
integrate. The determination of strategic value cannot be done by generic methods. Buyer specific aspects
determine the potential synergies, opportunity costs and the easiness to integrate. In order to determine
the strategic value, methods are most likely to be customized per investment case (Elmassri, Harris, &
Carter, 2015). Intrinsic value: The value of the company which reflects the company's economic potential.
This determination is useful for investors which do not necessarily have strategic reasons to invest in the
company (Damodaran, 2009; Kumar, 2016).
This report will focus on intrinsic valuation. The value of a stand-alone company will be determined. There
will not be focused on fair market valuation because FinTech companies are mainly private and therefore
not easily traded. There will also not be focused on strategic value because the strategic value of a FinTech
depends on the synergies that can be realized with the strategic company that is willing to invest in the
FinTech company. Since the strategic value is fully based on company specific qualitative information that
is not publicly available, it is not possible to determine the strategic value of a FinTech company. Last, the
purpose of this research is to provide a first valuation indication to investors (who are willing to invest in
a stand-alone FinTech start-ups) and to FinTech companies themselves, for these audience, an intrinsic
valuation is the most appropriate valuation.
1.4. Which FinTech related valuation information is still missing? Considering the previous sub-section, this research will try to find a way to come up with the first academic
supported FinTech intrinsic valuation method furthermore. The method will be mainly in line with current
immature market valuation methods but includes specific FinTech related aspects (discussed later). There
is still a lot of information missing in order to make an intrinsic valuation for FinTechs. In order to use the
most used valuation method, discounted cash flows (DCFs), these topics first need to be assessed. These
topics include, market definition, company definition, regulation and growth. These topics will be
researched in advance of building an intrinsic valuation model. Below a short explanation of each missing
topic is provided. These topics will all be further elaborated and deeply assessed in the coming chapters
(Damodaran, 2009).
Market definition: as described in earlier sub-sections, the definition of FinTech is hard to make. This is
mainly driven by the fact that the variety of available products is rapidly expanding. For example, in first
instance FinTech was defined as changing banking technology, nowadays there are much more FinTech

products such as, amongst others, insurance payment providers, supply chain financing methods and so
on. Due to the increasing variety FinTech related research companies all have their own market definition.
In this report these market definitions will be compared and a general market definition is set up which is
supported by the definitions of the research companies (Dietz, Vinayak, & Lee, 2016).
Regulation: During recent years, FinTechs mainly focused on offering products which are complements to
traditional financial institution products (Graetz et al., 2017). By using new technological methods, new
risks are possessed. Since the business model of these FinTech companies are driven by technology, these
companies are most of the time considered as technology companies and not as financial service
companies. In terms of regulation this is a big advantage since the financial service regulations are much
stricter compared to the technological regulations. Due to the increasing availability and impact of FinTech
companies, regulation instances are changing the regulations which must be applied by FinTech
companies. This increase in mandatory applicable regulations for FinTech companies results in less
competitive advantage of FinTech companies compared to ‘traditional’ financial institutions. This will
ultimately affect the value of a FinTech company and should therefore be carefully considered in valuing
these firms (Arner, Barberis, & Buckley, 2018; Burden, 2017; Michaels & Homer, 2018; Motsi-Omoijiade,
2018).
Growth: One of the main problems analysts see in valuing FinTech companies is the estimation of
potential growth. As described in previous sub-sections the market for FinTech is currently immature.
Thereby the expected growth for a company cannot simply be estimated by using comparable companies.
First, ‘traditional’ financial companies were most of the time established in other era’s in which consumer
and technology adaption rates were considerably lower. Furthermore, the number of already mature
FinTech companies is currently limited, so other proxies should be used to determine the potential growth
rates of FinTech companies (Reuters, 2016, 2017).
Important ratios: Using discount rates in valuations for immature markets and companies is challenging.
According to Damodaran (2009): “The standard approaches for assessing the risk in a company and
coming up with discount rates are dependent upon the availability of market prices for the securities issued
by the firm. Thus, we estimate the beta for equity by regressing returns on a stock against returns on a
market index, and the cost of debt by looking at the current market prices of publicly traded bonds. In
addition, the traditional risk and return models that we use to estimate the cost of equity focus only on
market risk, i.e., the risk that cannot be diversified away, based on the implicit assumption that the

marginal investors in a company are diversified. With young companies, these assumptions are open to
challenge”.
For a DCF valuation of a mature and well established company the S&P 500 is normally used for
determining the CAPM and corresponding WACC2 that should be used for calculating discount factors.
Analysts argue that the S&P 500 is not a good proxy for FinTechs. Therefore, the DCF method is less often
used for valuing FinTech companies. By academically assessing these ratios it could be that DCF method
will become useful as well (Reuters, 2016, 2017).
Valuation methods: one of the main problems analyst experience is the struggle about choosing the right
valuation method. As can be concluded from analyst reports, relatively simple and not very accurate
transaction multiples are still used to value FinTechs. This is mainly because the information that is needed
for more comprehensive valuation methods, such as DCFs, is not available yet (as described above)
(Damodaran, 2009; Elmassri et al., 2015; Excerpt et al., 2018; Kumar, 2016; Reuters, 2016, 2017).
1.7. Thesis layout The report can be divided in three parts.
The first part, chapter 2, mainly focuses on the current FinTech valuation performance of the largest global
investments banks including, amongst others, Goldman Sachs, J.P. Morgan, Morgan Stanley, and so on.
These companies provide analyst reports including the intrinsic valuation of a company. In order to
determine whether the valuation of FinTech is indeed an issue, the valuation accuracy of these reports
will be assessed. In case the accuracy of these analyst reports is already high, then there is no valuation
problem. Then, the valuation methods used by the investment banks can simply be copied and reused.
The result of the chapter will be a conclusion regarding the significance and importance of this report.
The second part, chapter 3, will focus on the missing information regarding FinTech intrinsic valuation.
Here, growth, regulation and important ratios will be assessed based on academic theories. The outcome
of these topics will be used in valuation methods.
In the third and last part, chapter 4, different valuation methods will be tested on accuracy. Here, the
results of the second part of the report are used to set up an extensive DCF valuation model. This model
2 A WACC is a weighted average cost of capital. The WACC is “a calculation of a firm's cost of capital in which each category of capital is proportionately weighted” (Investopedia, 2017). The WACC is a factor that is used in valuation methods to include compensation for risk and lost opportunities.

will be tested against simpler and more often used methods. In this part conclusions will be made about
which method to use for calculating the value of FinTech companies.
CHAPTER 2. IS THE DESCRIBED PROBLEM ALSO SEEN IN THE VALUATION OF
FINTECHS? In order to accept the fact that valuation of FinTech companies is relatively difficult and new solutions for
the different aspects involved in the valuation must be investigated, a research needs to be conducted.
This research will focus on the valuation performance of the biggest investment banks globally, including
amongst others: Goldman Sachs, J.P. Morgan, Morgan Stanley, Nomura, Barclays, HSBC, Deutsche Bank
and 50 more. In order to determine this valuation difficulty, the valuation performance for more mature
FinTech companies is compared to the valuation performance of ‘new’ FinTech. Normally, investment
banks provide analyst reports for public companies. The more popular a company is, the more analyst
reports a written about the company. Since the FinTech market is currently very popular, suffucient
analyst reports can be obtained. In this report, Thomson One and Capital IQ are used for gathering the
reports. Each analyst report is written at time t. Each stock has a specific value at time t. Each report
contains a forecasted target stock value for the company at 12 months after t. The value at time t can be
compared to the actual stock value at time t+12 months to see whether the company’s value went up or
down. Furthermore, the value at time t can be compared to the forecasted target stock value at time t+12
months. A relatively big difference between the target (forecast) value and the actual stock value at time
t+12 indicates difficulties in valuation. This comparison will eventually tell something about the difficulties
of FinTechs. Next to the forecasted stock value, the reports provide an advice whether or not to buy.
In this analyst report research 2 groups are compared to each other: the established and more mature
FinTech companies and the newer and more immature FinTech companies. The first group contains of
Paypal, Mastercard, AMEX an VISA. The second group contains of Lending Club, Lending Tree, On Deck
Capital, Square, Market Axess, Ellie Mae and Zillow.
This chapter contains four subsectors. 1) In the first subsector (subsector 2.1), advice behavior for
established and newer FinTechs are compared. It is expected that differences between these groups
already occur in this subsector. 2) In the second subsector (subsector 2.2), the accuracy difference in terms
of direction (up or down) between the two groups is determined. For example, in case a stock price went
up between t and t+12 months and the forecast was also that the price went up, then the advice was
good. 3) In the third subsector the advice variance for each company is determined. In case the variance
of a specific company is high, then the opinions provided by the analyst reports differ highly from each
other. In case the variance is low, then the analyst reports agree more with each other. 4) in the last
subsector, conclusions are made about the difficulty to value FinTech companies.
2.1. Comparing advices for newer and established FinTechs First, stock price forecasts are analyzed. Each company analyst reports are analyzed in terms of their stock
price forecasts. Each investment bank has its advice scale which always has sell (a stock forecast which is
lower than the current stock value) and buy (a stock forecast which is higher than the current stock value)
as boundaries. The intermediate steps between these two boundaries can differ (MarketWatch, 2018).
For this report five steps are defined. 1: Sell, 2: Underperform, 3: Hold, 4: Outperform, 5: Buy. If the advice
is sell, then the advice is to sell the shares. The price is expected to drop significantly. If the advice is
underperform, then the company performs below market standards and the current stock price is too
high for the current performance of the company. In that case, it is likely that the stock price will decrease
in the future, the company underperforms. If the advice is hold, then the company is performing around
earlier set targets. The price of the stock is in line with the performance of the company. If the advice is
outperform, then the company performs above expectations and above market standards. In that case,
the stock price of the company is not in line with the performance of the company and is expected to
increase in the next 12 months. If the advice is buy, then the advice is to buy the shares. The price is
expected to increase significantly (McGraw Hill, 2018).
It is expected that the buying advices for newer FinTechs vary more for the same company compared to
established FinTechs. Established FinTech companies are already more mature and their value proposition
is better proven. These companies have shown that their value proposition can resist for a relatively long
time compared to newer FinTech companies (Damodaran, 2009; Koller, Marc, & Wessels, 2015).
Below the results for established FinTech companies are shown. In total 109 analyst reports are
investigated manually. The analyst reports are all coming from the same time frame. All of the analyst
reports are written between July 2016 and September 2016. This is mainly be done so that all analyst
reports are made within the same quartile and based on more or less the same information. By doing that
the information availability bias is reduced.
2.1.1. Advices for established FinTech companies As can be concluded from Table 1, all analysts agreed more or less with each other for each researched
company. This is indicated by the fact that each analyst forecasted the same stock price direction (buy or
sell). There is no case that one analyst advices to sell shares and that another analyst advices to buy. If
this would have been the case, both buy and sell advices were provided for the same company, it would

have indicated that it is also hard to value established FinTech companies. However, the ‘opportunism’ of
the analysts can differ. Some analysts provide a stronger buy advice than others. It can also be concluded
that the market as a whole is at the moment attractive. For the four companies investigated, none of the
analysts provide a 1 or a 2. This means that none of the analysts expects decreasing stock prices for the
four companies.
Table 1: Analyst report overview – established FinTech companies
Paypal MasterCard Visa AMEX Established
Buying advice
33 23 30 23 109
1 0 0 0 0 0
2 0 0 0 0 0
3 13 6 3 14 36
4 13 9 14 3 39
5 7 8 13 6 34
% 1 of total
0% 0% 0% 0% 0%
% 2 of total
0% 0% 0% 0% 0%
% 3 of total
39% 26% 10% 61% 33%
% 4 of total
39% 39% 47% 13% 36%
% 5 of total
21% 35% 43% 26% 31%
Figure 1: Advice graph – established FinTech companies
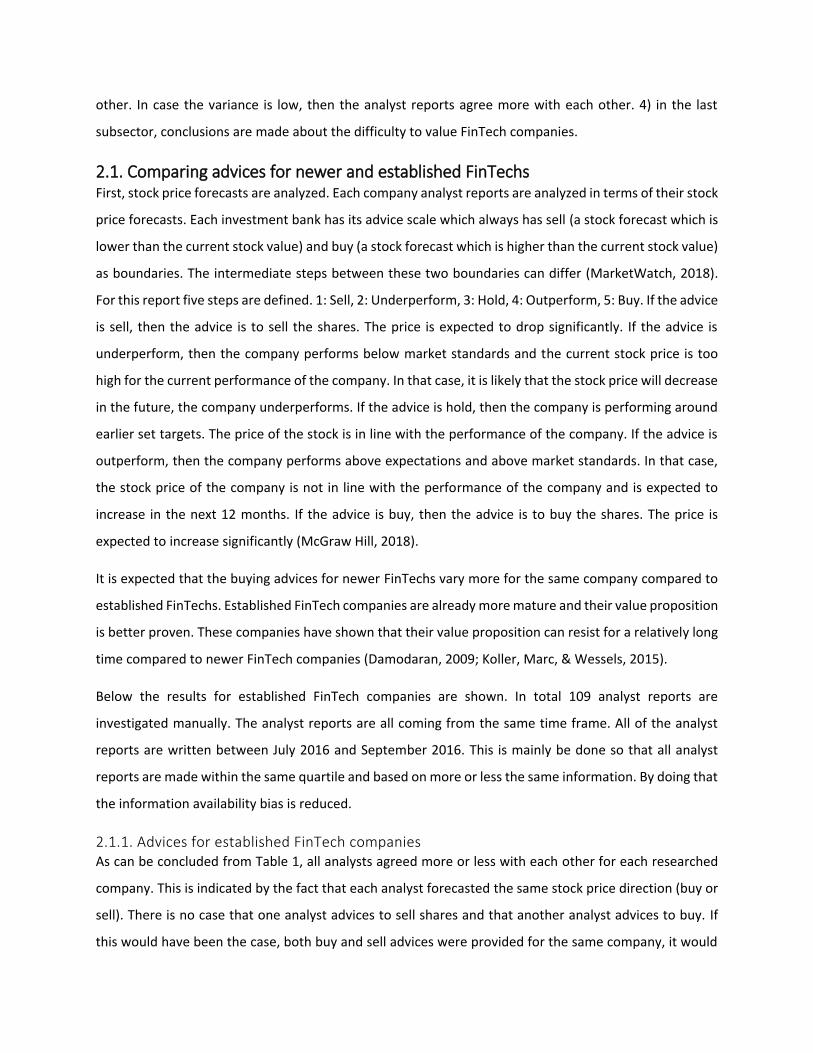
2.1.2. Advices for newer FinTech companies A same analysis is conducted for newer FinTech companies. 122 analyst reports are analyzed. Seven
companies are included. Some companies, OnDeck Capital, Market Axess, LendingTree and Ellie Mae have
a relatively low number of analyst reports. As can be seen in Table 2; the opinion of analysts in terms of
0% 0%
33%36%
31%
1 2 3 4 5
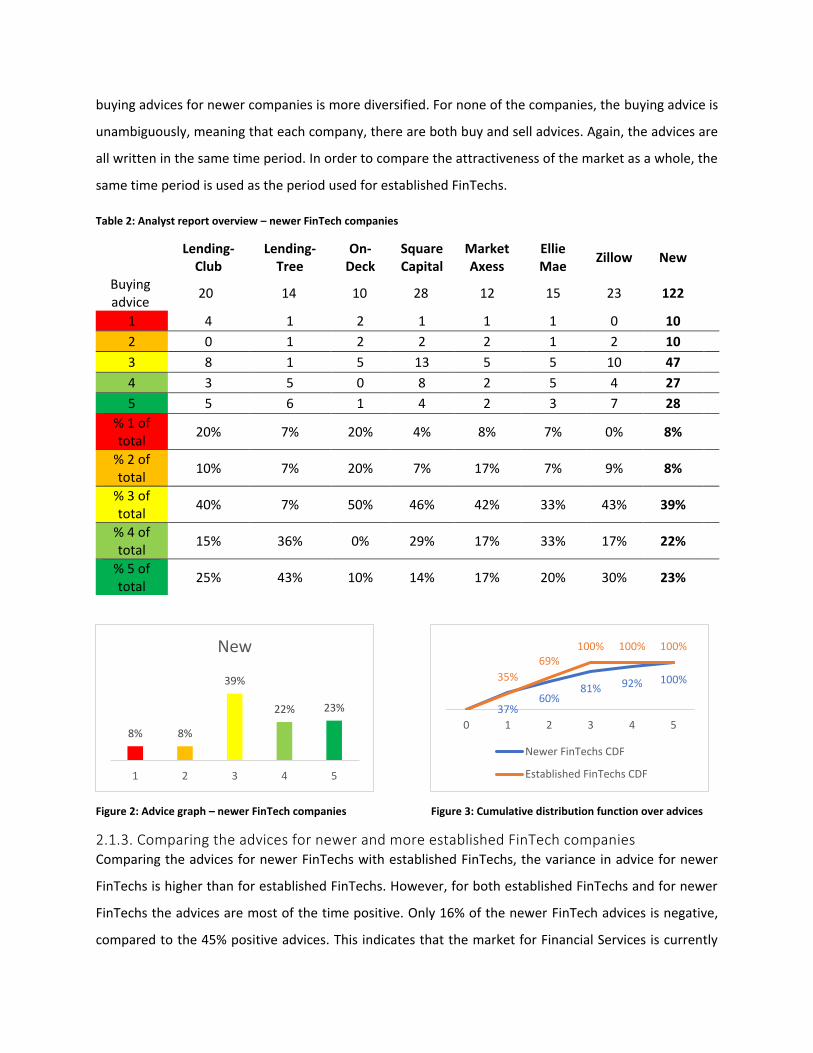
buying advices for newer companies is more diversified. For none of the companies, the buying advice is
unambiguously, meaning that each company, there are both buy and sell advices. Again, the advices are
all written in the same time period. In order to compare the attractiveness of the market as a whole, the
same time period is used as the period used for established FinTechs.
Table 2: Analyst report overview – newer FinTech companies
Lending-Club
Lending-Tree
On-Deck
Square Capital
Market Axess
Ellie Mae
Zillow New
Buying advice
20 14 10 28 12 15 23 122
1 4 1 2 1 1 1 0 10
2 0 1 2 2 2 1 2 10
3 8 1 5 13 5 5 10 47
4 3 5 0 8 2 5 4 27
5 5 6 1 4 2 3 7 28
% 1 of total
20% 7% 20% 4% 8% 7% 0% 8%
% 2 of total
10% 7% 20% 7% 17% 7% 9% 8%
% 3 of total
40% 7% 50% 46% 42% 33% 43% 39%
% 4 of total
15% 36% 0% 29% 17% 33% 17% 22%
% 5 of total
25% 43% 10% 14% 17% 20% 30% 23%
Figure 2: Advice graph – newer FinTech companies Figure 3: Cumulative distribution function over advices
2.1.3. Comparing the advices for newer and more established FinTech companies Comparing the advices for newer FinTechs with established FinTechs, the variance in advice for newer
FinTechs is higher than for established FinTechs. However, for both established FinTechs and for newer
FinTechs the advices are most of the time positive. Only 16% of the newer FinTech advices is negative,
compared to the 45% positive advices. This indicates that the market for Financial Services is currently
8% 8%
39%
22% 23%
1 2 3 4 5
New
37%60%
81% 92% 100%35%
69%100% 100% 100%
0 1 2 3 4 5
Newer FinTechs CDF
Established FinTechs CDF

attractive and that analysts are in general postive about the performance expectations for both
established and newer and more uncertain FinTechs. The difference in variance between established and
newer FinTech companies could probabily be driven by differences in uncertainty. This will be further
outlined in chapter 3 of this report.
2.2. Accuracy in direction The target stock price does not say everything about the success of a forecast. For example, if the forecast
was to increase from 100 to 200 and the actual increase was only from 100 to 150. Then the forecast was
too ambiguous but still in the good direction. An increase in capital would still have been made. The
direction could be positive, negative or remain neutral (no increase or decrease in stock price expected).
In case the direction is positive, the analyst expects a higher future target stock rate and a buy advice is
given, the direction of the advice was good. In case the direction is negative, the analyst expects a lower
future target stock rate, and a sell advice is given. In both cases a profit can be made, the only requirement
is that the direction of the forecast is the same direction as the direction of the actual stock price. In case
all forecasts were made in the right direction, the accuracy would have been 100%. This analysis is also
done for the data available from the analyst reports. Below the results of the analysis are shown (for the
analysis the same data is used as in subchapter 2.1).
Figure 4: Accuracy of analyst reports for established and newer FinTechs
For established FinTechs, 84% of all the targets were in the good direction. Meaning that at least a profit
is made in 84% of all the cases for established FinTechs. In 16% of the cases, the analysts provided a target
stock price which was in the wrong direction. For new FinTechs, only 56% of the forecasts were made in
the right direction. This means that in almost 50% of the cases no profit is made. To conclude, it seems to
be harder to value newer FinTech companies compared to established FinTEch companies, which is in line
with expectations.
56%44%
Good Flase
New
84%
16%
Good False
Established
False
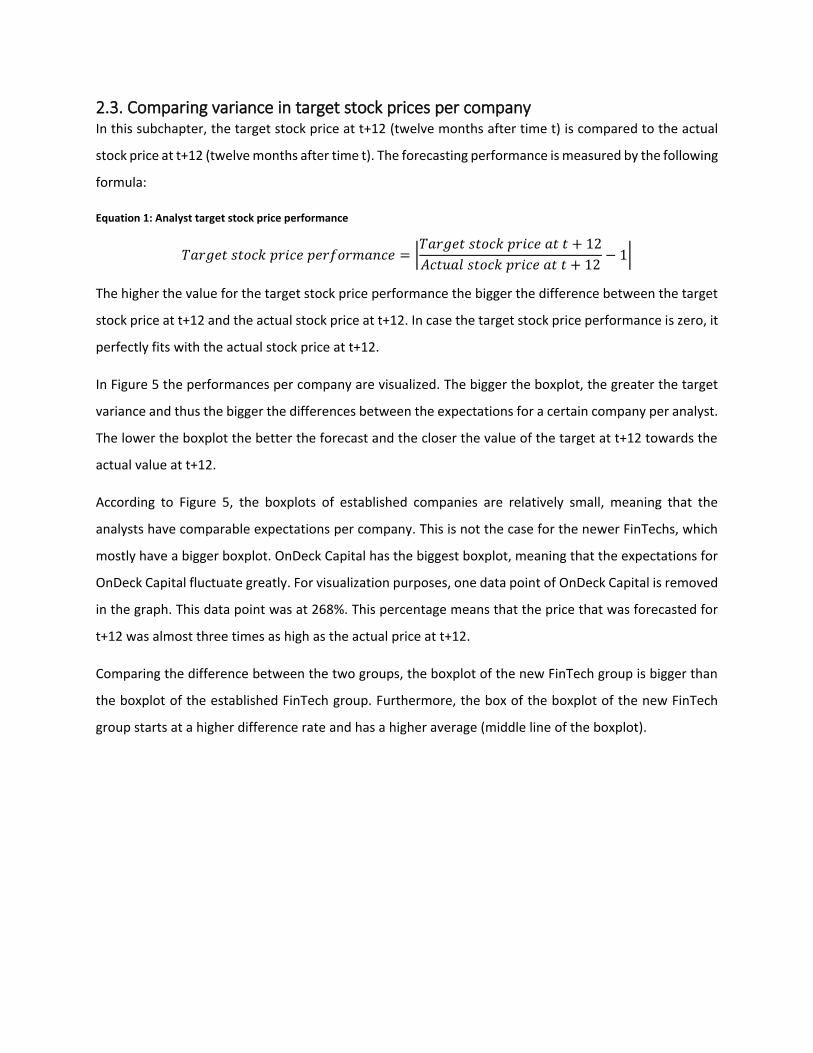
2.3. Comparing variance in target stock prices per company In this subchapter, the target stock price at t+12 (twelve months after time t) is compared to the actual
stock price at t+12 (twelve months after time t). The forecasting performance is measured by the following
formula:
Equation 1: Analyst target stock price performance
𝑇𝑎𝑟𝑔𝑒𝑡 𝑠𝑡𝑜𝑐𝑘 𝑝𝑟𝑖𝑐𝑒 𝑝𝑒𝑟𝑓𝑜𝑟𝑚𝑎𝑛𝑐𝑒 = |𝑇𝑎𝑟𝑔𝑒𝑡 𝑠𝑡𝑜𝑐𝑘 𝑝𝑟𝑖𝑐𝑒 𝑎𝑡 𝑡 + 12
𝐴𝑐𝑡𝑢𝑎𝑙 𝑠𝑡𝑜𝑐𝑘 𝑝𝑟𝑖𝑐𝑒 𝑎𝑡 𝑡 + 12− 1|
The higher the value for the target stock price performance the bigger the difference between the target
stock price at t+12 and the actual stock price at t+12. In case the target stock price performance is zero, it
perfectly fits with the actual stock price at t+12.
In Figure 5 the performances per company are visualized. The bigger the boxplot, the greater the target
variance and thus the bigger the differences between the expectations for a certain company per analyst.
The lower the boxplot the better the forecast and the closer the value of the target at t+12 towards the
actual value at t+12.
According to Figure 5, the boxplots of established companies are relatively small, meaning that the
analysts have comparable expectations per company. This is not the case for the newer FinTechs, which
mostly have a bigger boxplot. OnDeck Capital has the biggest boxplot, meaning that the expectations for
OnDeck Capital fluctuate greatly. For visualization purposes, one data point of OnDeck Capital is removed
in the graph. This data point was at 268%. This percentage means that the price that was forecasted for
t+12 was almost three times as high as the actual price at t+12.
Comparing the difference between the two groups, the boxplot of the new FinTech group is bigger than
the boxplot of the established FinTech group. Furthermore, the box of the boxplot of the new FinTech
group starts at a higher difference rate and has a higher average (middle line of the boxplot).

Figure 5: Variance comparisons on company and group levels
2.4. Is valuation for newer FinTechs more difficult than for established FinTechs? Combining the observations of the three researched aspects of subchapters 2.1, 2.2 and 2.3, it can be
concluded that the valuation of newer FinTech is harder than the valuation of established FinTechs. For
newer FinTechs, the expectations of analysts are not in line with each other. For the same company both
sell and buy advices were given in the same period. This is not the case for established FinTechs. For these
companies, analysts were in line with each other. This indicates that the valuation of new FinTechs is
harder than the valuation of established FinTechs and that there is not one consistent method that is used
by analysts. That it is harder to valuate new FinTechs is also indicated by the ratio between good and false
direction forecasts. In relatively more cases of established FinTechs a profit is made compared to new
FinTechs. Lastly, the variance in expectations between analysts for a specific company is bigger than for
new FinTechs compared to established FinTechs. However, according to Figure 5, the variance of
established FinTech companies can still be improved. The forecasts were most of the time in the right
direction, but the magnitude of the direction could be improved.
The main issues analysts mention regarding the difficulty of the valuation of FinTechs are growth
forecasting in terms of value and revenue, how to deal with uncertain discount ratios and how to deal
with regulations. These difficulties are also mentioned by McKinsey and Company in the book “Measuring
and Managing the Value of Companies”. These topics will discussed in the next chapter.

CHAPTER 3. FINTECH VALUATION DIFFICULTIES This chapter will focus on specific FinTech aspects and will provide answers to the research question:
Which key aspects that characterizes FinTech companies? How does the FinTech market and its
companies define and distinguish themselves? (sections 3.1, 3.2., 3.3. and 3.4).
What are the main criteria that should be covered by the valuation methods? How to include
these criteria in the valuation methods? (sections 3.1, 3.2., 3.3. and 3.4).
How to define the key financial forecast metrics? (section 3.4.)
3.1. Introduction Refering to the analyst reports which were investigated in Chapter 2, several issues regarding the
valuation of FinTech companies were found. The biggest and most mentioned issues are: 1) How to deal
with growth? 2) How to deal with regulation uncertainty? 3) What are appropriate values to use in a
FinTech discounted cash flow valuation? These three topics need to be analyzed before setting up
appropriate valuation methods. These topics are discussed in the following subchapters.
3.2. How to deal with growth? As described in chapter 2, one of the main problems analysts see in valuing FinTech companies is the
estimation of potential growth of FinTech companies. First of all, the financial performance in terms of
revenue and profit cannot be compared to an already established company (Damodaran, 2009; Koller et
al., 2015; Kumar, 2016). For example, most of the new FinTech companies have limited revenue streams
and no profit is currently made. Therefore, it is hard to use standard growth forecasting methods
discounted cash flow models (Damodaran, 2009). In this chapter, a scientific approach towards growth
measurement and forecasting will be executed, to find a pattern and guidelines onf how to assess the
potential growth of a FinTech company in order to be more able tof use standard forecasting methods
such as discounted cash flow models.
3.2.1. Understanding the problem As mentioned, standard growth forecasting methods cannot be used for new FinTech companies. In order
to sketch the problem, profit and loss statements of three new FinTech companies are investigated
(financial information obtained from S&P CapitalIQ), the results are shown in 3. The three companies,
LendingTree, LendingClub and OnDeck Capital all have the same kind of value proposition and have
comparable business models. LendingTree is founded earlier compared to LendingClub and OnDeck
Capital and also has a positive EBITDA. LendingClub and OnDeck Capital are both founded in the same
year, provide the same services, have the same geographical scope but their financial performances are

different. The total costs before EBITDA made by OnDeck Capital are much higher compared to
LendingClub. In total, OnDeck Capital has a costs base of 141% of its revenue stream. LendingClub has a
total cost base of 118% of its revenue stream. This can possibly be the result of economies of scale, the
total costs can be divided over more orders. Since the companies provide comparable services, it can be
assumed that the average revenue per order is comparable, resulting in more orders for LendingClub.
Analysts have difficulties in finding consistent growth forecasting procedures for these companies with
very different financial performances but with same activities and market fields.
Table 3: Financial comparison of thee comparable FinTech companies
LendingTree LendingClub OnDeck Capital
Revenue 384 501 141
COGS 14 74 52
% COGS of Revenue 4% 15% 37%
Gross Margin (GM) 371 427 89
% GM of Revenue 96% 85% 63%
OPEX 315 515 146
% OPEX of Revenue 82% 103% 104%
EBITDA 55 -87 -58
% EBITDA of Revenue 14% -17% -41%
3.2.2. How to academically assess growth? In order to understand the potential growth of high potential markets and the potential revenue streams,
the academically proven s-shape is used (see Figure 6) (Kucharavy & De Guio, 2015). According to Cocking
& McCullen (2017), the adoption rate and growth of a company and a market can be described with three
phases. The first phase is the launch phase. During this early phase the company or market gets limited
attention. The adoption rates are small but the growth rates are immense. After a while, the company or
the market has gained enough popularity to have a wide reach. For FinTech companies, most of the time
this is a global reach. Once having established this wide reach, growth rates will increase (Lloyd et al.,
2016).
From this point, the absolute growth values will increase drastically and will become constant and steep
after a while. Year relative growth rates will decline. The duration of the growth phase depends on the
maturity and the size of the market and it also depends on the value proposition of the specific company.
After having a period of steep growth, the company or the market will become mature. During the mature
phase both relative as absolute growth rates will decline.

Figure 6: Growth and value s-shaped curve
Regarding the maturity growth rates, there are two contradictory allegations. Hypothesis 1): The first
allegation is that regardless of the fact that one company is newer than another company, the growth and
maturity rates are equal. According to this allegation, newer companies start with an already higher value
from the beginning, due to a more mature market, but the growth rates and maturity rates are
comparable to older companies (Cocking & McCullen, 2017). Hypothesis 2): The second allegation is that
the newer the company and thereby the newer the technique, the greater the growth rates. According to
this allegation, maturity rates a comparable between newer and older companies. This second allegation
uses the media-entertainment market as an example. One of the first media-entertainment providers
were newspapers. It took over 80 years for the newspaper market to become mature in 1980. The video
game console products only took 15 years to become mature. According to the second allegation a
company or market can reach its mature phase earlier due to new, better and replaceable products,
companies or markets. Due to this, some rising markets or companies cannot reach expected sizes (Watt,
Fisher, & Bolton, 2014).
Figure 7: Visual representation of allegation 1 (left) and allegation 2 (right)

3.2.3. Understanding growth for high potential markets In order to assess the growth potential for the FinTech companies, a proxy market will first be assessed.
This is in line with the valuation method of McKinsey & Company (Koller et al., 2015).
In order to find a plausible proxy for the FinTech market, the market first needs to be characterized. There
are five characteristics that define the FinTech market:
1. Regulation uncertainty: Described in the section 3.3
2. Disrupting traditional business models: One of the main value propositions of FinTechs is that
their business models are more efficient compared to traditional financial companies.
3. New customer opportunities: This is in line with characteristic 2. By changing business models,
new customer opportunities arise. For example, it is nowadays possible request a mortgage fully
online via FinTech companies. This is not possible at traditional financial companies.
4. Business model dependent on use of technology: The business model of the FinTech company is
fully driven by (information) technology
5. Maturity: The market of the FinTechs is currently immature.
A potential proxy should have the same characteristics except from characteristic five. The market should
be mature, because this will show usable growth rates. Four potential proxy markets were assessed,
including the social media market (i.e. Facebook and LinkedIn), the Software-as-a-Service (SAAS)3 market
(i.e. Microsoft 365), the non-assed owned market disruptor platform providers (i.e. UBER), online market
places (i.e. Ebay). The SAAS market has comparable answers to characteristics 1 till 4, but is also immature.
The non-assed owned market disruptor platform providers is also immature but also provides the same
services as traditional market players (i.e. taxi companies). The online market places market have
significant less regulation uncertainty compared to FinTech companies. Only the social media market
show comparable results for characteristics 1 till 4 and is also a mature market. Therefore the social media
market will be further researched.
The market became globally available in 2003 and 2004. In those years, the world’s current biggest social
media companies were founded. Two years later, the platforms became globally popular. For the social
media market, we first test whether or not the social media market follows the academic s-shape as
described in the previous section. Secondly, we also assess whether or not the growth rates and mature
3 Software provided by a subscription model, mostly hosted in the cloud and only accessible via internet (Interoute, 2017).
rates of newer social media platforms are comparable to traditional social media platforms, in order to
draw a conclusion about the contradicting allegations of the previous section. Based on this, two
hypotheses are formulated.
Hypothesis 1: The social media market follows the S-shape
Hypothesis 2: Newer social media platforms have steeper growth rates and the same maturity rates as
older social media platforms
Social media, hypothesis one testing In order to determine the growth rate of the social media market a common used variable must be used.
Different variables such as revenue or profit can describe the size of the market. For the social media
market in specific, it is better to focus on the number of users of social media instead of focusing on the
monetary value of the market. This is mainly the case because the revenue conversion per user/customer
is not comparable to ‘traditional’-markets. In traditional markets the revenue can be determined by taking
an average price per customer and multiply this number by the number of users. This is not the case for
social media. The more users a platform has, the higher the average revenue per user. This is driven by
the fact that the revenue of a social media platform is marketing dependent. The financial business model
of social media platforms mainly focuses on marketing income, meaning users get free subscription but
are exposed to marketing content. The more users on a platform, the higher the average price a company
will pay to expose the users of the social media platform (Hollebeek, 2017).
When focusing on the number of users, one can argue that a person can have accounts on multiple social
media platforms. Again, from a marketing perspective, all used accounts should be taken into account. An
advertiser is willing to pay an amount per user to one platform but also to another platform regardless
the fact that both platforms have the same users. Therefore, multiple social media accounts per users are
allowed and not normalized in this research (Hollebeek, 2017).
Inactive users are normalized. Social media platforms monitor the number of active users, since
advertisers only pay for exposure to active users. Furthermore, only the number of active users says
something about the popularity of the platform. To conclude, the number of monthly active users is used
to exercise the market size. It is not expected that there is in-year seasonality in the number of monthly
active users.

Figure 8: Growth of monthly active users in Social Media
In Figure 8: Growth of monthly active users in Social Media; the number of active users per platform is
monitored on the primary y-axis. The secondary y-axis shows the total monthly active users of the social
media market. The beginning of the x-axis is the start of the social media market. The eight social media
platforms investigated are accountable for over 80% of the total monthly active users of the social media
market. It can be concluded from Figure 8: Growth of monthly active users in Social Media; that most
companies are currently becoming mature or are already mature. This is in line with the fact that the
market is currently in its mature phase.
0
5000000
10000000
15000000
20000000
25000000
30000000
35000000
40000000
45000000
0
2000000
4000000
6000000
8000000
10000000
12000000
1 2 3 4 5 6 7 8 9 10 11 12 13
In t
ota
l
Per
med
ia p
latf
orm
Growth of monthly active users in Social Media
Facebook Whatsapp Youtube LinkedIn Instagram
Pinterest Snapchat Google+ TotaalTotal

Figure 9: Total market size (number active users) in Social Media
In Figure 9; the total market size, in terms of monthly active users, is visualized. The growth line can be
split in three parts, the early stage, the growth stage and the perpetuity stage. This is in line with the
explanation of the s-shape. As can be seen, the growth stage is three times as steep as the early stage and
the perpetuity stage, based on their trend lines. The three trend lines have high R2 values, indicating a
good fit between the trend and the actual values. It is worth to mention that there indeed still is a
significant growth rate, even though the perpetuity phase is already started. The rate of the growth phase
is 43% growth per year. The rate of the perpetuity phase is 16% growth per year.
Social media, hypothesis two testing In order to give answer on the question whether or not newer social media platforms have steeper growth
rates and higher perpetuity rates that older social media platforms growth rates, two groups are
identified. LinkedIn and Facebook are considered as older social media platforms, Snapchat and Instagram
are considered as newer social media platforms. These are the only four social media platforms with five
years of data available as from two years after foundation and can either be considered as older social
media platform or as newer social media platform.
Considering Figure 10; the following growth rates can be found: Facebook: 49% LinkedIn: 35%, Snapchat:
39% and Instagram: 46%. Based on these figures, it cannot be concluded that newer social media
platforms have steeper growth rates compared to traditional social media. It is expected that this
conclusion is mainly driven by the limited data available. It was expected that growth rates of newer social
media platforms have higher growth rates. This expectation was mainly driven by the fact that the
popularity of Social Media platforms increased over time (Interoute, 2017).
0.0 1.04.0 4.9
7.57.5
13.5
19.223.8
31.135.235.2
37.6 39.342.6
y = 2E+06x - 2E+06R² = 0.9743
y = 6E+06x - 2E+07R² = 0.9966
y = 2E+06x + 1E+07R² = 0.9838
0
10
20
30
40
50
60
2005 2006 2007 2008 2009 2010 2011 2012 2013 2014 2015 2016 2017
Mill
ion
s

Figure 10: Growth rate comparison between different social media platforms
Based on the described findings, the following conclusions can be made about the hypotheses.
Hypothesis 1: The social media market follows the S-shape - Accepted
Hypothesis 2: Newer social media platforms have steeper growth rates and the same maturity rates as
older social media platforms – Not accepted
FinTech, hypotheses one and two testing (same testing as for social media) The same kind of tests applied to the social media market can also be applied to the limited data of the
FinTech market available. By running the test, three groups were identified. Earlier in the report only two
groups were mentioned, traditional financial companies and FinTechs. By running tests with growth rate
data, the conclusion is drawn that it is better to split the data in three groups. The first group is the
traditional group, these are companies which are already in the perpetuity phase for a long time. No
growth rate data is available for these companies. The second group is the FinTech 1.0 group, this group
of FinTechs is young compared to traditional financial companies, but already exists for many years
(around 10 to 15). For these companies, there is both a growth rate and a perpetuity rate available. At the
moment these companies became public they were in their growth phase. All of these companies are
currently in the perpetuity phase. The last group is FinTech 2.0, this group is still in growth phase and
these companies are relatively young. For example, Figure 11, shows the revenue growth of Paypal over
the years. The red line, a power trend line indicates high growth rates from the beginning and more
constant growth rates at the end. The power trend line has a good fit with the actual annual revenue
0
2000000
4000000
6000000
8000000
10000000
12000000
14000000
16000000
18000000
20000000
0
1000000
2000000
3000000
4000000
5000000
6000000
7000000
8000000
9000000
1 2 3 4 5
Tota
l mo
nth
ly a
ctiv
e so
cial
med
ia u
sers
Act
ive
use
rs p
er p
latf
orm
Facebook Snapchat Instragram Linkedin Average

growth rate (R^2 = 79%). For the revenue expectations of 2017, 2018, 2019 and 2020, analysts forecasts
are used. These forecasts are in line with the perpetuity growth rates. The steps PayPal is expected to
make in its perpetuity phase are in absolute figures large, however the revenue growth rate (in
percentages) will be constant.
Figure 11: Paypal's annual revenue growth rates
In Table 4; the growth rates and perpetuity rates are provided. The growth rates for the start-up phase
are not meaningful, due to low absolute values. Comparing the growth rates of FinTech 1.0 and FinTech
2.0 companies, the growth rates differ significantly. Within the specific groups the growth rates are
comparable. This indicates that the growth rates of newer FinTechs are steeper than the growth rates of
older financial (technology) organizations. Comparing the perpetuity rates of traditional financial
organizations with FinTech 1.0 companies, the perpetuity rates are comparable, this indicates that
companies in perpetuity phase can expect a specific rate regardless the age of the technology or company.
The growth rates within the social media market are in line with the growth rates of FinTech 1.0
companies. The perpetuity rate of the social media market is comparable to both the traditional and the
FinTech 1.0 companies, this indicates that social media can indeed be used as a proxy for the FinTech
market.
Table 4: Growth rates of compared companies
Group Company Start-up rate Growth Rate Perpetuity rate
Social media Overall Not meaningful 42,70% 13,06%
2004
2005
2006
2007
2008
2009
2010
2011
2012
2013
2014
2015
2016
2017
2018
2019
2020
Actual Revenue 680, 1,00 1,40 1,83 2,40 2,79 3,43 4,41 5,66 6,72 8,02 9,24 10,8
Estimated Revenue 12,8 15,1 17,7 20,9
Actual Growth 56% 47% 40% 31% 31% 16% 23% 28% 28% 19% 19% 15% 17%
Estimated Growth 17% 18% 18% 17% 18%
56%47%
40%
31% 31%
16%23%
28% 28%
19% 19%15% 17%
y = 0.6086x-0.484
R² = 0.7946
0%
10%
20%
30%
40%
50%
60%
70%
0
5,000
10,000
15,000
20,000
25,000
An
nu
al r
even
ue
gro
wth
Rev
enu
e (€
m)
Paypal's revenue growth

Traditional VISA Not meaningful No data available 15,27%
Traditional Mastercard Not meaningful No data available 12,45%
Traditional AMEX Not meaningful No data available 12,37%
Fintech 1.0 On Deck Capital Not meaningful 45,36% 13,51%
Fintech 1.0 Lending Tree Not meaningful 47,74% 22,57%
Fintech 1.0 Market Axess Not meaningful 47,07% 16,07%
Fintech 1.0 Evestnet Not meaningful 38,46% 15,28%
Fintech 1.0 Paypal Not meaningful 43,17 17,84%
Fintech 2.0 Lending Club Not meaningful 61,28% Not started yet
Fintech 2.0 Ellie Mae Not meaningful 65,93% Not started yet
Fintech 2.0 Zillow Not meaningful 63,56% Not started yet
Based on previous findings, the following conclusions can be made.
Hypothesis 1: The FinTech market follows the S-shape - Accepted
Hypothesis 2: Newer FinTech companies have steeper growth rates and the same maturity rates as older
FinTech companies – Accepted
For further analysis and the model that will be made in chapter 4, revenue rates from Table 4 will be used.
Depending on the age of the company it is determined whether the company is a traditional financial
institution, a FinTech 1.0 or a Fintech 2.0. It is important to mention that at the moment of doing the
growth analysis, only a limited dataset was available. For chapter 4 a larger dataset became available. All
companies used in the growth analysis are also represented in chapter 4. Due to time constraints, the
growth analysis is not cross-checked with the larger dataset.
3.3. How to deal with regulation?
3.3.1. What is the problem? According to the analyst reports researched in chapter 2, regulation is a key topic for the value
development of FinTech companies. During recent years, FinTechs mainly focus on offering products
which are complements to traditional financial institution products (Graetz et al., 2017). By using new
technological methods, new risks are possessed, including laundering of money, cyber-security, user
protection and securing data. This resulted in a growing need for regulations (Jacoby et al., 2017).
However, it is hard to estimate which legislations are applicable to FinTechs. This is mainly driven by the
fact that FinTechs are comparable, but not totally the same as ‘traditional’ financial institutions (Warfel,
2017). Most FinTech companies act as IT-focused firms which are specialized in providing or enhancing
financial services. There is one main reason why they want to be considered as a IT firm, that is regulation.
Financial organizations have high regulation standards for providing financial services to both consumers
and corporates. For example, the credit check of consumers in the application for a mortgage is relatively
difficult. By acting as an IT-firm, FinTechs are not directly considered as financial organizations. Therefore,
they do not have to deal with all the difficult regulations of financial organizations. Going back to the
example about the consumer mortgage, FinTechs can automate a huge part of the application process.
By doing this, a consumer mortgage is easier and faster granted. It can be concluded that the regulation
issues for financial organizations are a value proposition for FinTech companies. Due to the increase in
popularity, new regulations are currently set up. FinTechs have to deal with more regulations and are
more and more considered as financial organizations in terms of regulation. The value proposition that
FinTechs had compared to financial organizations is less valuable. Since the regulations for FinTech firms
are currently developed, the topic is highly uncertain. This involves the issues in valuing FinTech
companies.
The amount of investments has declined a bit comparing the first quartile of 2016 with the first quartile
of 2017. According to Smith (2017), this drop is mainly influenced by the increased government
regulations for FinTechs. Mainly due to their rising innovation, FinTechs are confronted with new
regulations. Regulators mainly focus on protecting customers, however the regulations can be a serious
and significant obstacle for further progress of the development of the FinTech industry. As also indicated
by Smith (2017), 86% of all CEO’s active in the financial service industry are worried because of the
increased amount of regulations.
On the other side, governments and financial public instances are willing to innovate in the financial
sector. By doing this, the financial market will become more competitive which will eventually lead to
better products and more satisfaction amongst consumers. Many regulators in Europe, including the
national regulators of the UK, France, Germany, Luxembourg and the Netherlands have announced that
new regulatory initiatives will be started in order to encourage innovation in the financial industry. In
March 2017, the European Commission started a new consultation on technology and its influence on the

financial market. This consultation focusses on obtaining responses till June 2017 in order to establish a
clear vision regarding its policy approach (Jacoby et al., 2017).
3.3.2. Setting the scene In March 2017, Christopher Woolard (Woolard, 2017), director at the Financial Conduct Authority (FCA)
mentioned four different topics on which to focus on in terms of regulation establishment. He only
mentioned these four topics, because of their high level of innovativeness and their high level of coverage
in terms of FinTech companies. In this chapter, the four different topics mentioned by Christopher
Woolard are examined (Woolard, 2017). Jacoby et al. (2017) performed a study on the financial service
regulation on these most disrupting technologies. These technologies are blockchain securities services,
computerized advice, Forex (FX) payments and peer-to-peer lending. They defined the first concepts as
follows. “Blockchain is a data storage structure which is maintained and replicated across a decentralized
network of “nodes” to prevent any individual node from tampering with the information records in the
ledger by rewriting transaction history”. According to multiple sources, blockchain was first introduced by
its use in bitcoin environment (Jacoby et al., 2017). However, blockchain networks can also revolutionize
the way how transactions are executed and assets are transferred. Jacoby et al. (2017) defined peer-to-
peer lending as follows: “Rather than a central institution making loans, these are made by “peers”
(typically retail or institutional investors) on a multilateral basis (e.g. one lender may make many loans
and one borrower may have many lenders)”. Computerized advice regards computerized decision making
for personal investments by the use of provided personal information. Smart contracts are comparable to
computerized advices, in that way that contracts are produced by the use of computerized codes that can
produce contracts by itself, without the intervention of any party (Jacoby et al., 2017). FX payments are
defined as payments of currencies.
As mentioned earlier the regulatory framework for FinTechs is highly differentiated to country level.
However, not all countries have the same strategy in developing regulation programs for FinTech
companies (Financial Market Authority Liechtenstein, 2017; Financial Market Authority of Liechstenstein,
2017). The amount of effort countries put in the development of regulation programs for FinTechs differs
per country. Some countries, such as the Netherlands, are putting a relatively large amount of effort in
the establishment of such programs. In the Netherlands, two instances, the AFM and DNB, set up the
“InnovationHub” which supports companies in finding their way through the FinTech regulation
landscape. As of January 2017, FinTech companies are able to request help by obtaining needed licenses.
Obviously, the regulation landscape in the Netherlands is relatively difficult due to its high level of

maturity. However, the Dutch DNB and AFM are providing resources to FinTech companies in order to
encourage FinTech developments regardless of the fact that regulation is becoming more difficult. Other
countries, such as the United Kingdom, also have their own innovation hubs (sandboxes). However, these
countries are not establishing regulations on a standalone basis. Together with other countries they are
setting up one standard regulation set which is applicable in multiple countries. The United Kingdom
develops such a standard regulation program in collaboration with Australia, Southern Korea and
Singapore. These countries do not only provide a standardized regulation set and help towards FinTech
companies, but they also back FinTech companies in order to compete and accelerate their businesses.
The purpose of this collaboration between different countries is not only to reduce workload but also has
the purpose to get as much experience on risk and challenges as possible (EurActiv, 2017). In 2016, Sir
Mark Walport (Chief Scientist of the UK), published a report on how the government of the United
Kingdom helps to accelerate the introduction of distributed ledger technology in order to transform
traditional ledger services. There are also countries which are less focusing on FinTech regulation.
Countries such as Italy are providing specific legislation incentives in order to promote FinTechs.
“Innovative” companies can apply for these incentives. However, it is not clear how these “Innovative”
companies are defined (Jacoby et al., 2017).
3.3.3. What is the impact of Financial regulation and trust on the stock value? Fintech regulation can also be approximated by trust, since trust is highly related with reglation. Once the
trust of financial public instances in FinTechs decreases more regulations will rise up. Regulations are, in
that case, established to regain trust. This is mainly due to the fact that the main purpose of the financial
public instances is to protect consumers and corporates from risk and financial problems. In the next part
of the research an assessment of the impact of trust levels on stock values is executed in order to
understand the impact of regulations on the stock levels.
3.3.4. Determining the impact on the FinTech P2P lending market For determining the impact of changes in trust, and thereby the potential impact of regulation, on the
stock levels of companies, announcements and publications regarding trust related topics are analyzed.
First of all it must be determined if regulation/trust changes have impact on company level or on a
macroeconomic level. It can be the case that changes in trust have similar impact on similar companies
and that trust have impact on product/market value. In order to elaborate on this, two lending companies
are compared to each other on stock levels. The companies have the same characteristics. The companies
became public in the same year and provide the same lending services to consumers. In Figure 12 the
relative stock levels of the two companies are visualized. In order to compare the two companies, the

stock levels of the companies are normalized. This means that they stock levels at the start are for both
of the companies 100%. For each data point in the graph, the stock levels at a certain moment are shown
as a percentage of the stock value at start (100%). By doing this the valuation of the companies can be
compared to each other, regardless the fact that the actual high of the stock values differ. Since there is
limited data available, this test could only be executed for this specific situation. Each trading day has a
data point and each data point is calculated by the stock value closing price of each day. Since the
companies are both listed on the same exchange, the New York Stock Exchange (NYSE), the closing price
of each day for the two companies is calculated at exactly the same moment, thereby the market
information and situation cannot be different between the two companies calculating the closing prices.
If one of the two companies was listed on a European stock exchange, and the other company was
calculated at the New York Stock Exchange, then there was a timing gap between the moment that two
closing prices of the two companies are calculated. The closing price of the company listed on the New
York Stock Exchange is determined a few hours after the closing price of the European listed company is
determined, in the meantime new things could happen which influence the closing stock price of the NYSE
listed company but not the closing stock price of the European listed company.
The two companies compared to each other are Lending Cub and On Deck Capital. As can be concluded
form Figure 12; the stock value trend of the two companies can be compared to each other. Both stock
values follow the same decreasing trend. The trend lines of the stock values of the two companies are
comparable. Both are polynomial with two orders. The equation coefficients are also somewhat similar.
The trend lines have a good fit with the underlying stock value data.

Figure 12: Market Cap comparison P2P online lending Fintechs
In Figure 13; a scatter plot is shown. The scatter plot is made to determine the fit between the datapoints
of Lending Club with the data points of On Deck capital. A linear regression and trend line are established
to determine the fit. The R^2 value of the linear regression is 0.9076. This means that the variance of the
stock value (in percentage) of one company can for almost 91% be explained by the variance of the stock
value (in percentage) of the other company.
Figure 13: Scatter plot P2P online lending Fintechs comparison
y = 1E-06x2 - 0.1011x + 2161.2R² = 0.9467
y = 1E-06x2 - 0.0875x + 1872.2R² = 0.9077
0
0.2
0.4
0.6
0.8
1
1.2
Lending Club On Deck Capital Poly. (Lending Club) Poly. (On Deck Capital)
R² = 0.9076
0
0.1
0.2
0.3
0.4
0.5
0.6
0.7
0.8
0.9
1
0 0.1 0.2 0.3 0.4 0.5 0.6 0.7 0.8 0.9 1
Scatter plot of the datapoints

Obviously macro related factors have an higher influence on these companies compared to company
specific factors. The value of the these companies is mainly driven by the expected value proposition the
companies have. In case the value proposition of the companies is less impactful, the value of the
companies decrease. In case trust in the companies decrease and new regulations are established, the
value propositions FinTech companies have compared to traditional financial service companies,
decrease. This eventually leads to lower valuations.
In order to determine if regulations/trust is indeed one of the main factors involving the value of these
companies, specific spikes are analyzed.
In Figure 14; five situations are highlighted which are further analyzed. In four of the five situations, the
value of the companies are highly decreased. In situation five, the relative stock values of the companies
slightly increase.
Figure 14: Market Cap comparison P2P online lending Fintechs (including remarkable situations)
1. Decrease is mainly the result of the Madden vs. Midland case. In this case, a consumer bought a
lending. The lender was charging tremendous interest rates which were way above the interest
rates of traditional banks. Traditional banks have specified rates they can ask for lending products.
The FinTech P2P-lender was obviously actively avoiding traditional bank regulations. The case
between the consumer and the FinTech lending provider was eventually won by the consumer.

The consumer winning this case indicated that regulatory instances question the business model
of P2P lenders. This indicates that the value proposition of the FinTech lender is less sustainable
and trustable. Both OnDeck Capital and Lending Club provide the same activities. Both companies
were not indirectly and directly involved in the case. However, the market capitalization of the
companies decreased by 15% due to this case. This highly indicates that both companies are not
mature enough and that market questioning directly means questioning their business model as
well.
2. In Q2 of 2015 OnDeck Capital published its half year results. According to the half year results, the
Company is underperforming on professionalizing its regulation management. This resulted in a
drop of ca. 10% in its market capitalization (compared to its starting value in December 2014).
The market capitalization of Lending Club was also decreased by 10%. Lending Club was again not
actively involved in the situation. However, the result of OnDeck Capital also reflects on the
valuation of Lending Club. According to new articles, FinTech lenders, such as OnDeck Capital and
Lending Club are considered as too risky.
3. At the end of 2015, the UK financial authority, FCE, published an article regarding the risk
management of traditional banks. The main result of the article was that traditional banks lacks
in risk management in the collaboration with FinTech P2P-lenders. According to the results of the
FCA, FinTech lenders provide too much risk to traditional banks because they have risky and
unstable business models resulting in also high risks for traditional banks. The publication of the
article resulted in a market capitalization drop of ca. 15% in less than a month for both companies.
Again both companies were not directly involved or named in the article.
4. In April 2016, Lending Club was sued in a ‘true-lender’ case. Lending Club was lending money
under violations of usury laws. As a result, the market capitalization of both Lending club and
OnDeck Capital dropped with ca. 20% in less than a month. During this case the integrity of
FinTech P2P lenders is questioned, which directly effects the trust in the P2P-lending market. In
this case, OnDeck Capital was not direct or indirectly involved.
5. After ca. eight monhts, the ‘true-lender’ case came to an end. Lending Club won ‘true-lender’
case. The market capitalization of both LendingClub and On Deck Capital was not restored. The
damage of the ‘true-lender’ case is still visible. Regardless the fact that the Company won the
‘true-lender’-case, the trust in the value proposition and the business models of FinTech P2P-
lenders is damaged.

As can be concluded from the market capitalization development of both LendingClub and OnDeck
Capital, the trust in the companies and thereby the regulation impact highly influences the value of the
companies and their value proposition in the market. Since the companies are both still immature and the
business models of the companies is still not ‘proven’, the value of the companies is highly dependent on
market activities. This means, that the value of one company is highly affected by activities and
circumstances of the other company. This results in difficulties in and highly uncertain valuations.
3.3.5. Determining the impact on the FinTech crypto currency market Another market with high uncertainty in acceptance, trust and regulations is the blockchain and crypto
currency market. This market, mainly driven by Bitcoin, uses disrupting technologies to innovate the
financial market for payments. In this research comparable analysis is conducted as described above is
executed for Bitcoin, to determine the impact of trust and regulations on the value of Bitcoins. In total 27
situations are analyzed to determine the impact of specific activities on the value of Bitcoin.
Table 5: Overview of regulation related news moments
Description Start End Difference Direction Chinese Government Bans Financial Institutions From Using Bitcoin 1022 840 -18% Negative
IRS Declares Bitcoin To Be Taxed As Property 582 453 -22% Negative
Coinbase Launches US Licensed Exchange 281 223 -21% Negative
Three New Exchanges Open Supporting More Fiat Currencies 0.83 0.72 -13% Negative
Mt. Gox Hacked 30 15 -50% Negative
Paxum and Tradehill Drop Bitcoin 5.7 4.31 -24% Negative
Panic sell, since people think there is a Ddos 180 108 -40% Negative
IAFCU determines that it can not reasonably handle the myriad regulatory 132 126 -5% Negative
Major Exchanges Hit With DDoS Attacks 718 626 -13% Negative
Bitstamp Hacked 275 200 -27% Negative
Bitcoin XT Fork Released 267 214 -20% Negative
Mike Hearn declared that Bitcoin 431 397 -8% Negative
SEC denies Winkelvos ETF 1201 1037 -14% Negative
EU Declares No VAT on Bitcoin Trades 273 318 16% Positive
Japan Declares Bitcoin as Legel Tender 1085 1215 12% Positive
Mt. Gox Opens For Business - July 18, 2010 0.07 0.08 14% Positive
Gawker Publishes Article About The Silk Road 12 17.61 47% Positive
Wordpress Accepts Bitcoin 11.04 12.46 13% Positive
panelists and Senators agree that Bitcoin holds great promise 686 1072 56% Positive
People’s Bank of China OK's Bitcoin 686 1072 56% Positive

Gemini Exchange Launched 245 286 17% Positive
Bitcoin Featured on Front Page of The Economist 323 367 14% Positive
Bitcoin price breaks $1000 1000 1250 25% Positive
Figure 15: Stock value change due to news articles (left is possitive, right is negative)
According to the results as shown in Figure 15, the positive impact of a positive publication or incident
can vary heavily between +13% and +56%, this means that a positive incident can increase the value of
the Bitcoin with more than 50%. This also means that the usefulness of a valuation heavily depends on
the trust uncertainty at the moment. In case there is grounded trust in Bitcoin, this will be when the
currency becomes more mature, it is expected that the influence of a positive incident will have less
influence. Now, the currency is still relatively immature, and valuations most of the time are hard to make
and do not make sense at all due to uncertainties in terms of trust and regulations. This is also the case
for negative incidents. However, here the impact is within a smaller range compared to positive incidents.
It is, also for negative incidents (almost) impossible to include the impact and trust and regulation forecast
in the valuation.
3.3.6. How to deal with the uncertainty in terms of regulation and trust in valuations? As can be concluded from both the analysis of the FinTech P2P-lending market and the crypto currency
market, the value of a company (or currency) can be heavily influenced by only a negative or positive
publication about the product in which trust or regulation is discussed. The main issue in taking these
incidents into account in the valuation of a FinTech company is the fact that the impact of these incidents
also influences the value of a FinTech that is not directly related to the incidents. This means, that only
looking at the specific company is not sufficient in terms of regulations and trust. The market as a whole,
the market competitors and the trends of the market must also be assessed in terms of regulations and
trust. This is very difficult because even a negative publication about a competitor can have big negative

influences on the valuation of the company. If regulation and trust must be taken into account for the
valuation, someone can only give indications about the direction and a range of the potential value of the
company. Still the uncertainty is very high. This conclusion is in line with the conclusion made by analysts
of reputable corporate finance organizations. However, the topic was not grounded by an analysis before.
3.4. Determine discount related items (cost of capital, costs of assets, market return
and beta) One of the key issues that was found when looking at the valuation of FinTechs is the fact that these
FinTechs do not act as already established and mature companies. Therefore, it is not fully clear which
market index is appropriate for determining the discount factors. A market index is an index which shows
the growth of a group of companies. As example, the S&P 500 shows the performance of the biggest 500
U.S. based companies. In case the index of the S&P 500 increases from 1.00 to 1.10 it can bse stated that
the overall improvement of the 500 U.S. companies is 10%. It is not fully clear if the standard and widely
used S&P 500 market index can be used to determine the market return and to determine the cost of
capital. This is mainly because on average the FinTech companies have returns that are higher than
‘traditional’ companies but also have higher risks.
In this light it is important to determine whether a more specific market index (i.e. KBW FinTech) should
be used or that a general index (i.e. S&P 500) should be used to determine the discount factor for the
valuation of a FinTech company. This issue is mentioned in multiple analyst reports of the biggest and
most reputable U.S. based investment banks. In all cases the S&P 500 index is still used instead of an
alternative market index. In this chapter this issue is exercised following a specific and academical
heuristic, including commonly used (financial) formula’s, on how to determine an appropriate market
index for FinTech related companies. The heuristic that is followed is set up based on common sense,
there is no heuristic that fully covers all the steps as described in the applied heuristic. The applied
heuristic is based on multiple and already available heuristics for determining fitness of models and
valuation figures.
3.4.1. The heuristic to determine the best suitable index for FinTech companies In order to come up with the most appropriate index to determine weighted average cost of capital
(WACC) related values for each company, a heuristic of thirteen steps is set up. The heuristic consists of
the following steps:
1. Determine which companies should be included in the research;
2. Retrieve the stock prices for the past years for each company;

3. Index all the stock prices so that at t=0 all companies have a stock price with an index of 1;
4. Determine groups of company categories;
5. Determine which potential market indices can be used;
6. Retrieve the index prices of all potential market indices and set the price of the index to 1 at t=0;
7. Determine the Beta between the market indices and the companies (based on indexed stock
prices and index prices);
8. Determine which index has the best average Beta with all companies (best average Beta is defined
as the average Beta which is closest to 1 but taking into consideration the number of companies
that are included in a market index);
9. Determine for each company category (1, 2 and 3) which index should be used;
10. Determine the market return for the selected market indices;
11. Calculate Beta for each company based on its selected market index;
12. Determine the cost of assets (CAPM) for each company;
13. Determine the WACC for each company.
3.4.2. Step 1,2 and 3: Getting stock price indices for all included companies On the next page a summary of the first three steps is provided. As already can be seen, the unweighted
average Compound Annual Growth Rate (CAGR) between 2013 and 2017 is 21%, meaning that on average
each company had a yearly growth of 21% compared to the previous year. Considering Figure 16, the
differences between companies is relatively large, but almost all companies have positive indices over
time. As from the first year (01-01-2014), over 95% of all companies have an index which is greater than
1. This means that the market capitalization, the value of the company, increased compared to t=0 (01-
01-2013).
There is only one company with a negative CAGR between 2013 and 2017. This is VeriFone Systems, Inc.
(NYSE:PAY). This is mainly driven by a more difficult competitive landscape which is established in 2017.
This explains the decrease from 0.94 to 0.60.
For large companies in terms of market capitalization, the indices are more stable compared to smaller
companies in terms of market capitalization.. The calculated CAGRs for the period between 2013 and 2017
are in line with earlier found revenue growth rates. The earlier found revenue growth rates were based
on another data set and contained just a few companies. The revenue growth rates provide extra evidence
regarding the conclusions made earlier. An overview is provided in Appendix A
Table 12
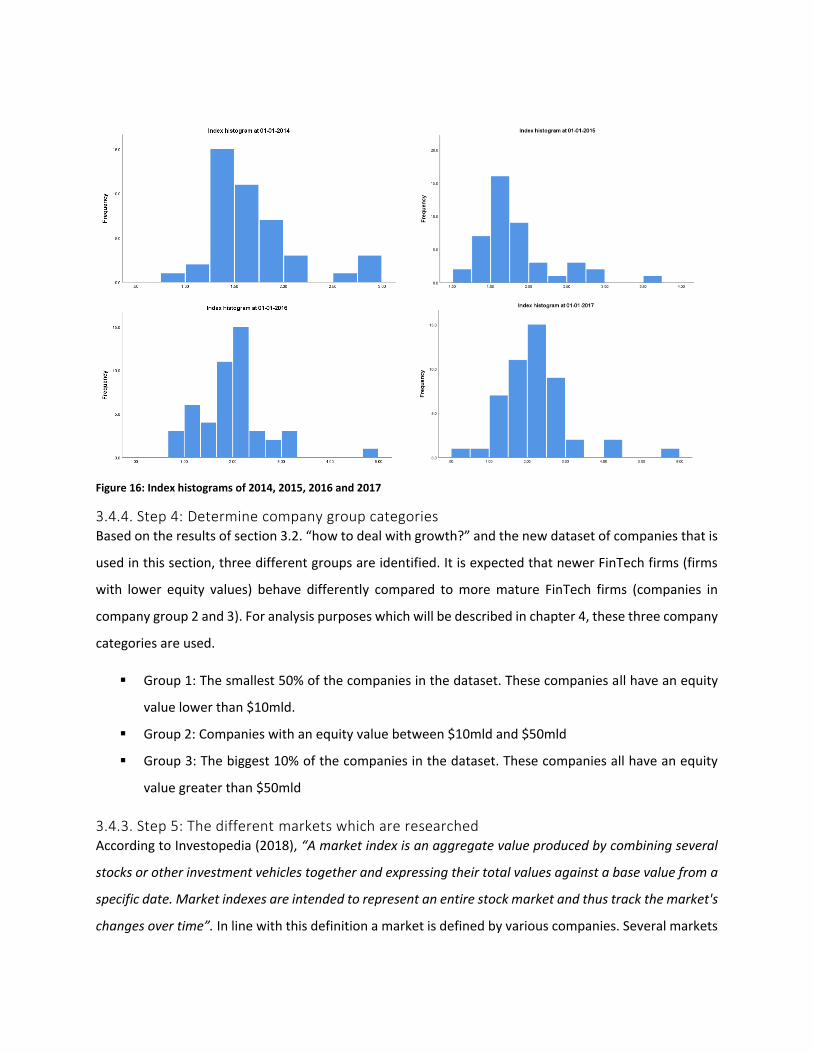
Figure 16: Index histograms of 2014, 2015, 2016 and 2017
3.4.4. Step 4: Determine company group categories Based on the results of section 3.2. “how to deal with growth?” and the new dataset of companies that is
used in this section, three different groups are identified. It is expected that newer FinTech firms (firms
with lower equity values) behave differently compared to more mature FinTech firms (companies in
company group 2 and 3). For analysis purposes which will be described in chapter 4, these three company
categories are used.
Group 1: The smallest 50% of the companies in the dataset. These companies all have an equity
value lower than $10mld.
Group 2: Companies with an equity value between $10mld and $50mld
Group 3: The biggest 10% of the companies in the dataset. These companies all have an equity
value greater than $50mld
3.4.3. Step 5: The different markets which are researched According to Investopedia (2018), “A market index is an aggregate value produced by combining several
stocks or other investment vehicles together and expressing their total values against a base value from a
specific date. Market indexes are intended to represent an entire stock market and thus track the market's
changes over time”. In line with this definition a market is defined by various companies. Several markets

are assessed in this study. All markets have something to do with financial institutions and FinTech
organizations. Some markets are broader compared to other markets. For example, the S&P 500 market
index contains not only financial services related companies but also companies from other industries,
whereas the S&P Global Financials Index (SPF) only contains financial services related companies. For this
study ten different market indices are researched. These markets are described below.
The S&P 500 The S&P 500 index was formed in 1957 by Standard & Poor’s. The S&P 500 index consists of U.S. listed
companies which are traded on the NYSE and the NASDAQ. The S&P 500 index consists of 500 companies
with the largest market capitalization in the U.S. which have over 80% coverage of the total equities of
the U.S. The S&P 500 is not focused on a specific sector and includes, amongst others, companies from
the industry, energy, financial and health sector. The total market capitalization of the index’ portfolio is
USD 23,408,792.2 mm.
KBW Nasdaq Financial Sector Dividend Yield Index (KDX) The KBW Financial Sector Dividend Yield Index is an index which is based on a weighted dividend yield of
financial companies situated and listed in the U.S. Most of these companies provide banking, insurance
and financial services.
S&P Global Financials Index (SPF) The S&P Global Financials Index is a large financial sector related index with over 200 companies in its
portfolio. The companies included in this portfolio are not location restricted. Companies from all over
the world are included in this index. Both newer financial companies and older financial companies are
included.
Kbw Capital Markets Index (KSX) The KSX index tries to provide information about the performance of companies that are brokers, asset
managers, trusts and custody banks. Companies included in this portfolio are all situated in the U.S. in
total, 24 companies are included in this index. S&P 500 Information Technology
S&P 500 Information Technology (SPIT) The S&P 500 information technology index is a sub-index of the S&P 500 which only includes companies
that have information technology related activities. All companies included in this index are listed on a
U.S. based exchange. In total 68 companies are included in the portfolio of this index. The current market
capitalization of the companies included in the portfolio of this index is USD 5,651,210 mm.

S&P 500 Banks (SPB) The S&P 500 Banks index is a sub-index of the S&P 500 which only includes companies that have banking
related services (i.e. custody banks, diversified banks, regional banks, asset managers). In total, 17
companies are included in this index. The current total market capitalization of the index’ portfolio is USD
1,535,215 mm. All companies included in this index are listed on a U.S. based exchange.
KBW Bank Total Return Index (BKX) The KBW Bank Index tracks the performance of the U.S. biggest banks. The index included 24 different
banks.
Kbw Nasdaq Regional Banking Index (KRX) Kbw Nasdaq Regional Banking Index tracks the performance of U.S. based banks that are regional banks
or thrifts.
FTSE Emerging Markets Index – Financials (FTSE) The FTSE Emerging Markets for financials indicates the performance of different Chinese listed companies
which are operating in emerging markets. These companies are not selected on their size. The index
included companies with both small and large market capitalizations.
KBW Nasdaq Financial Technology Index (KFTX) This can possibly be the most appropriate index for indicating the performance of the FinTechs researched
in this paper. All companies included in the index are Financial Technology companies that are based in
the U.S. The index began in July 2016 and included 50 companies.
3.4.4. Step 6: Retrieve the index prices of all potential market indices and set the price of the
index to 1 at t=0 In line with step 1, 2, 3, a similar approach is used to determine the indices for the different markets. For
each market the weighted average stock price change for the included companies is calculated.
In Table 6, the results of step 4 are shown. As seen, the CAGR between 2013 and 2017 of the KBW FinTech
index is highly in line with the CAGR between 2013 and 2017 for the companies as described in step 1, 2
and 3. It is expected that the KBW FinTech market will be used for at least for one of the company
categories (1, 2 or 3).

Table 6: Summary per market
3.4.5. Step 7: Determine the Beta between the market indices and the companies (based on
indexed stock prices and index prices) In order to determine whether companies follow the same trend as market indices do, the Beta between
each company and each market should be calculated. This is done in four sub-steps:
1. The index difference for each day is calculated for both company stock price indices and market
indices. These differences show the change of each company and market index per day and
thereby their dynamics (defined as DYN). These values are relative returns and not the absolute
returns, since all the values are indexed. The following formula is used to calculate the dynamics:
𝐷𝑌𝑁𝑡=𝑖+1 =𝐼𝑛𝑑𝑒𝑥 𝑝𝑟𝑖𝑐𝑒𝑡=𝑖+1 − 𝐼𝑛𝑑𝑒𝑥 𝑝𝑟𝑖𝑐𝑒𝑡=𝑖
𝐼𝑛𝑑𝑒𝑥 𝑝𝑟𝑖𝑐𝑒𝑡=𝑖
Where i is defined as a specific date and i+1 is defined as one day later than day i. The outcome
can be both positive and negative. In case the outcome is negative, the index price at t=i+1 is
lower than the index price at t=i (the day before). In general, most dynamics were positive, which
is in line with the results of step 1, 2 and 3.
2. Based on the outcomes of sub-step 1, the covariance (COV) between the market indices and the
companies can be calculated. The following formula is used:
𝐶𝑂𝑉 = ∑ (𝐶𝑜𝑚𝑝𝑎𝑛𝑦𝑗 − 𝐶𝑜𝑚𝑝𝑎𝑛𝑦)̅̅ ̅̅ ̅̅ ̅̅ ̅̅ ̅̅ ̅̅ (𝑀𝑎𝑟𝑘𝑒𝑡𝑘 − 𝑀𝑎𝑟𝑘𝑒𝑡̅̅ ̅̅ ̅̅ ̅̅ ̅̅ )𝑛
𝑗=1
𝑗 − 1
Company = company price index
Market index = market price index
n = sample size
1/1/2013 1/1/2014 1/1/2015 1/1/2016 1/1/2017
S&P 500 IQ2668699 NA NA 1.00 1.30 1.44 1.43 1.57 12%
KBW Financial Sector Dividend Yield IQ118487778 NA NA 1.00 1.19 1.29 1.16 1.41 9%
S&P Global Financials Index (iShares) IQ2668600 NA NA 1.00 1.24 1.25 1.17 1.28 6%
Kbw Capital Markets Index IQ12867402 NA NA 1.00 1.52 1.69 1.61 1.85 17%
S&P 500 Information Technology IQ2671442 NA NA 1.00 1.26 1.49 1.56 1.74 15%
S&P 500 Banks (Industry Group) IQ2668853 NA NA 1.00 1.32 1.50 1.48 1.80 16%
KBW Bank Total Return IQ41540182 NA NA 1.00 1.38 1.51 1.51 1.95 18%
Kbw Nasdaq Regional Banking IQ23266784 NA NA 1.00 1.44 1.44 1.49 2.02 19%
FTSE Emerging Index - Financials IQ256609512 NA NA 1.00 0.93 0.99 0.79 0.86 -4%
KBW Fintech NA NA NA 1.00 1.68 1.83 2.04 2.22 22%
Average NA NA NA 1.00 1.32 1.44 1.42 1.67 13%
Index name Ticker Founding Year Category
Index CAGR
' 13-' 17

j = indicator of a specific company
k = indicator of a specific market
For understanding, all possible market - company combinations are calculated and will be used in
sub-step 4.
3. Based on the outcomes of sub-step 1, the variance (VAR) between the market indices and the
companies can be calculated. The following formula is used:
𝑉𝐴𝑅 = √∑ (𝐶𝑜𝑚𝑝𝑎𝑛𝑦𝑗 − 𝐶𝑜𝑚𝑝𝑎𝑛𝑦̅̅ ̅̅ ̅̅ ̅̅ ̅̅ ̅̅ ̅𝑛
𝑗=1 )2
𝑛 − 1∗ √
∑ (𝑀𝑎𝑟𝑘𝑒𝑡𝑘 − 𝑀𝑎𝑟𝑘𝑒𝑡̅̅ ̅̅ ̅̅ ̅̅ ̅̅𝑛𝑘=1 )2
𝑛 − 1
The different variables in the formula have the same definition as in sub-step 2.
4. Based on the outcomes of sub-steps 2 and 3, the Beta (COR) between the market indices and the
companies can be calculated with the following formula:
𝐶𝑂𝑅 =𝐶𝑂𝑉
𝑉𝐴𝑅=
∑ (𝐶𝑜𝑚𝑝𝑎𝑛𝑦𝑗 − 𝐶𝑜𝑚𝑝𝑎𝑛𝑦)̅̅ ̅̅ ̅̅ ̅̅ ̅̅ ̅̅ ̅̅ (𝑀𝑎𝑟𝑘𝑒𝑡𝑘 − 𝑀𝑎𝑟𝑘𝑒𝑡̅̅ ̅̅ ̅̅ ̅̅ ̅̅ )𝑛𝑗=1
𝑗 − 1
√∑ (𝐶𝑜𝑚𝑝𝑎𝑛𝑦𝑗 − 𝐶𝑜𝑚𝑝𝑎𝑛𝑦̅̅ ̅̅ ̅̅ ̅̅ ̅̅ ̅̅ ̅𝑛
𝑗=1 )2
𝑛 − 1∗ √∑ (𝑀𝑎𝑟𝑘𝑒𝑡𝑘 − 𝑀𝑎𝑟𝑘𝑒𝑡̅̅ ̅̅ ̅̅ ̅̅ ̅̅𝑛
𝑘=1 )2
𝑛 − 1
The Betas show the fit between a company and a market. The closer the fitness between a
company and a market to 1, the better the fit. In case there is a perfect fit, a Beta of 1.00, the
company and the market follow the same pattern. This means that the market is a perfect
indicator for the company’s performance. In case there is no fit at all, that is when there is a Beta
which is far away from 1.00, the variance and the dynamics of the company cannot be explained
by the dynamics of the market. This means that the market cannot indicate the company’s
performance variability.
The outcomes of sub-step 4 are included in Table 13 (Appendix A) and will be further discussed in
the coming steps.

3.4.6. Step 8 and 9: Determine which index has the best average Beta with all companies and
which index has the best average Beta for specific company categories In order to determine which market is appropriate to use per product category two things must be
considered. 1. The average Beta. 2. The CAGR for the period between 2014 and 2016. As explained the
average beta must be close to 1 in order to have a good fit between the market dynamics and the
company’s dynamics. Furthermore, the CAGR must be in line with expectations. As example, S&P Global
Financials Index (iShares), has a good overall Beta, however the growth rate is only one percent.
Three markets indices are defined as best fitted and further researched. These market indices are KBW
Financial Sector Dividend Yield, S&P Information technology, and KBW Fintech. These three markets have
good overall betas and respectable CAGRs.
In order to determine which of the market indices is appropriate for each of the three company categories,
the beta is also determined on company category level for the chosen market indices. This is done,
because it is expected that the different company categories react differently on market trends. For
example, large companies are expected (due to maturity) to have less problems when the market is
stressed. This can also be concluded from Table 7. Companies from category 3, the large companies of the
data set, have relatively low betas compared to companies from category 1 and 2.
Table 7: Market overview
Market index Overall
B
CAGR ' 14-'
16
B Category
1
B Category
2
B Category
3
S&P 500 1.21
0.07
1.24
1.16
1.16
KBW Nasdaq Financial Sector Dividend Yield 0.96
(0.03)
1.03
0.90
0.77
KBW Financial Sector Dividend Yield 0.96
0.07
1.03
0.90
0.77
S&P Global Financials Index (iShares) 0.96
0.01
0.95
0.91
0.86
Kbw Capital Markets Index 0.78
0.07
0.83
0.72
0.67
S&P 500 Information Technology 0.93
0.11
0.94
0.90
0.93
S&P 500 Banks (Industry Group) 0.68
0.11
0.71
0.65
0.60
KBW Bank Total Return 0.67
0.13
0.72
0.63
0.58
Kbw Nasdaq Regional Banking 0.61
0.13
0.68
0.53
0.47

FTSE Emerging Index - Financials 0.41
(0.02)
0.41
0.43
0.41
KBW Fintech 1.11
0.10
1.18
1.03
0.94
Average 0.85
0.07
0.88
0.80
0.74
Based on the values of Table 7, the S&P 500 Information Technology is chosen as the best market index
for both company category 1. This means that the smaller (and newer) FinTech companies can be better
considered as information technology companies instead of financial companies. This is in line with the
conclusions of the regulation chapter. There it was concluded that one of the main FinTech regulation
topics is that newer FinTech companies are operating as information technology companies in order to
undermine financial stricter regulations. Bigger (and older) financial companies don’t have that possibility.
For these companies it is better to use another market as indicator. For company category 2 and 3 the
KBW Fintech market index is chosen as best market. This indicates and also strengthens the conclusion
that the companies included in the data set cannot easily be considered as financial companies but should
be considered as innovative FinTech companies.
3.4.7. Step 10: Determine the market return for the selected market indices
Based on the results of step 7 and 8 the used market return (Rm) can be determined. This is needed in
order to be able to use the CAPM formula to indicate the cost of equity. For this research the CAGR ’14-
’16 is used as market return. This CAGR is taken over a longer period and aggregates abnormal spikes. To
conclude, the market return for category 1 is 11% and the market return for company category 2 and
company category 3 is 10%. This means that it is expected that in the coming years the return of the
market as a whole will be around 10%. It is also worth to mention that regardless of the fact that the
companies included in the two different markets KBW Fintech and S&P 500 information technology, the
expectations for these markets are comparable.
3.4.8. Step 11, 12 and 13: Costs of equity and WACC for each company based on its selected
market index Based on all previous steps the different components of the discount rate, the WACC, can be calculated
by using the following formulas.
Cost of equity The cost of equity is approximated by using the Capital Asset Pricing Model (CAPM) formula. According to
Investopedia (2017), “The capital asset pricing model (CAPM) is a model that describes the relationship

between systematic risk and expected return for assets, particularly stocks”. The CAPM formula takes into
account two compensations.
The first compensation is the value of money over time. In case no investment is made, the value
of money can still increase. This is defined as the risk-free rate. This is the value increase of money
at a risk-free basis. Normally this is the yield on government bonds (currently 2.41% and used for
calculations).
The second compensation is the compensation for taking additional risk.
The following formula is used for determining the cost of equity:
�̅�𝑒 = 𝑟𝑓 + 𝛽𝑎(�̅�𝑚 − 𝑟𝑓)
rf = risk free rate, βa is the beta of the company, rm is the expected return of the market.
Cost of debt Most investment are not fully funded by equity. This is mainly because of two reasons. 1): investors do
not have sufficient own resources available to fund the investment themselves. 2): by using external
resources (debt) an investor can lever its own money and can eventually make more investments and get
higher absolute returns. The cost of debt is an effective rate that is paid on an investor’s all debts. Most
debts consist of bank loans and is part of the of the capital structure.
For example, investor A can buy two companies which both are worth USD 1000. The investor only has
USD 1000 of own resources available. Both companies are expected to have a yearly dividend of USD 100.
A bank wants to borrow the investor USD 1000 for a yearly rate of 3% (USD 30). By taking the debt, the
investor can buy both companies for USD 2000. The investor will make 2*100-30 = USD 170 per year. In
case the investor did not attract the debt, the investor was only able to buy one of the companies and
have a yearly return of USD 100.
WACC Based on the cost of equity and cost of debt, the weighted average cost of capital (WACC) can be
calculated. The WACC is the discount rate (return) which an investor minimally wants on the investments
that are made. The formula of the WACC is:
𝑊𝐴𝐶𝐶 = 𝐸𝑞𝑢𝑖𝑡𝑦
𝑉𝑎𝑙𝑢𝑒∗ �̅�𝑒 +
𝐷𝑒𝑏𝑡
𝑉𝑎𝑙𝑢𝑒∗ �̅�𝑑 ∗ (1 − 𝑇𝑐)
re = the cost of equity, rd = the cost of debt, Value = equity + debt, Tc = the corporate tax rate
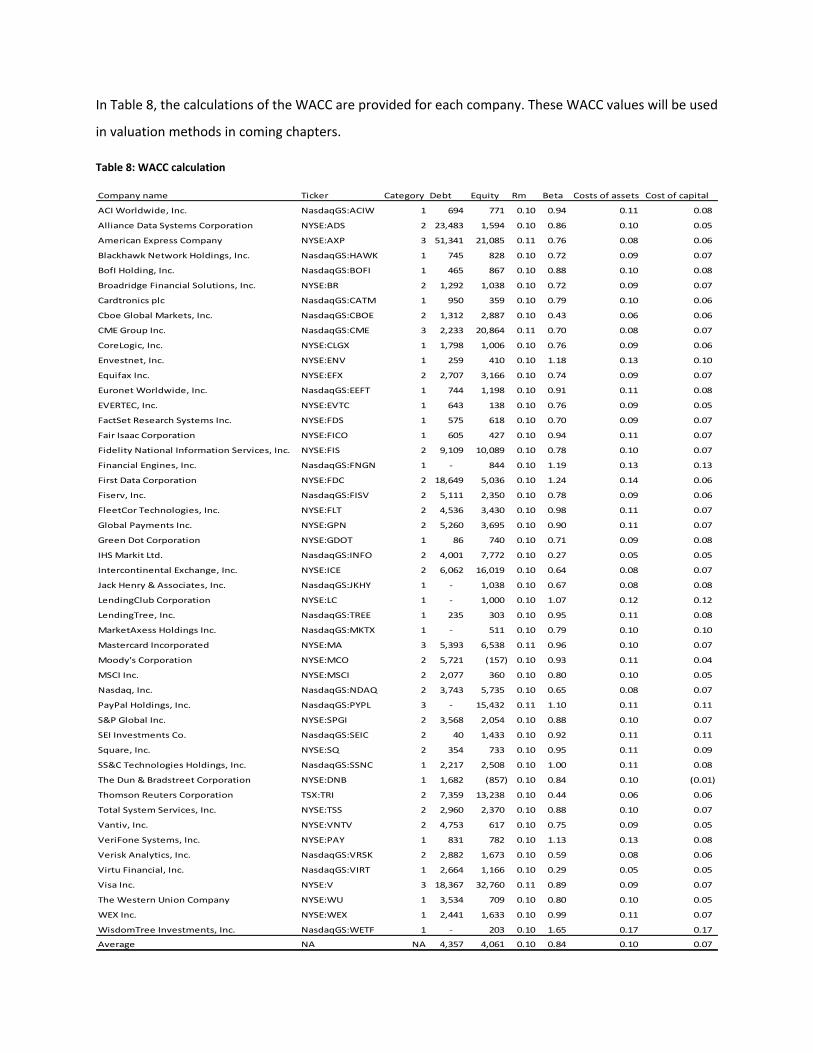
In Table 8, the calculations of the WACC are provided for each company. These WACC values will be used
in valuation methods in coming chapters.
Table 8: WACC calculation
Company name Ticker Category Debt Equity Rm Beta Costs of assets Cost of capital
ACI Worldwide, Inc. NasdaqGS:ACIW 1 694 771 0.10 0.94 0.11 0.08
Alliance Data Systems Corporation NYSE:ADS 2 23,483 1,594 0.10 0.86 0.10 0.05
American Express Company NYSE:AXP 3 51,341 21,085 0.11 0.76 0.08 0.06
Blackhawk Network Holdings, Inc. NasdaqGS:HAWK 1 745 828 0.10 0.72 0.09 0.07
BofI Holding, Inc. NasdaqGS:BOFI 1 465 867 0.10 0.88 0.10 0.08
Broadridge Financial Solutions, Inc. NYSE:BR 2 1,292 1,038 0.10 0.72 0.09 0.07
Cardtronics plc NasdaqGS:CATM 1 950 359 0.10 0.79 0.10 0.06
Cboe Global Markets, Inc. NasdaqGS:CBOE 2 1,312 2,887 0.10 0.43 0.06 0.06
CME Group Inc. NasdaqGS:CME 3 2,233 20,864 0.11 0.70 0.08 0.07
CoreLogic, Inc. NYSE:CLGX 1 1,798 1,006 0.10 0.76 0.09 0.06
Envestnet, Inc. NYSE:ENV 1 259 410 0.10 1.18 0.13 0.10
Equifax Inc. NYSE:EFX 2 2,707 3,166 0.10 0.74 0.09 0.07
Euronet Worldwide, Inc. NasdaqGS:EEFT 1 744 1,198 0.10 0.91 0.11 0.08
EVERTEC, Inc. NYSE:EVTC 1 643 138 0.10 0.76 0.09 0.05
FactSet Research Systems Inc. NYSE:FDS 1 575 618 0.10 0.70 0.09 0.07
Fair Isaac Corporation NYSE:FICO 1 605 427 0.10 0.94 0.11 0.07
Fidelity National Information Services, Inc. NYSE:FIS 2 9,109 10,089 0.10 0.78 0.10 0.07
Financial Engines, Inc. NasdaqGS:FNGN 1 - 844 0.10 1.19 0.13 0.13
First Data Corporation NYSE:FDC 2 18,649 5,036 0.10 1.24 0.14 0.06
Fiserv, Inc. NasdaqGS:FISV 2 5,111 2,350 0.10 0.78 0.09 0.06
FleetCor Technologies, Inc. NYSE:FLT 2 4,536 3,430 0.10 0.98 0.11 0.07
Global Payments Inc. NYSE:GPN 2 5,260 3,695 0.10 0.90 0.11 0.07
Green Dot Corporation NYSE:GDOT 1 86 740 0.10 0.71 0.09 0.08
IHS Markit Ltd. NasdaqGS:INFO 2 4,001 7,772 0.10 0.27 0.05 0.05
Intercontinental Exchange, Inc. NYSE:ICE 2 6,062 16,019 0.10 0.64 0.08 0.07
Jack Henry & Associates, Inc. NasdaqGS:JKHY 1 - 1,038 0.10 0.67 0.08 0.08
LendingClub Corporation NYSE:LC 1 - 1,000 0.10 1.07 0.12 0.12
LendingTree, Inc. NasdaqGS:TREE 1 235 303 0.10 0.95 0.11 0.08
MarketAxess Holdings Inc. NasdaqGS:MKTX 1 - 511 0.10 0.79 0.10 0.10
Mastercard Incorporated NYSE:MA 3 5,393 6,538 0.11 0.96 0.10 0.07
Moody's Corporation NYSE:MCO 2 5,721 (157) 0.10 0.93 0.11 0.04
MSCI Inc. NYSE:MSCI 2 2,077 360 0.10 0.80 0.10 0.05
Nasdaq, Inc. NasdaqGS:NDAQ 2 3,743 5,735 0.10 0.65 0.08 0.07
PayPal Holdings, Inc. NasdaqGS:PYPL 3 - 15,432 0.11 1.10 0.11 0.11
S&P Global Inc. NYSE:SPGI 2 3,568 2,054 0.10 0.88 0.10 0.07
SEI Investments Co. NasdaqGS:SEIC 2 40 1,433 0.10 0.92 0.11 0.11
Square, Inc. NYSE:SQ 2 354 733 0.10 0.95 0.11 0.09
SS&C Technologies Holdings, Inc. NasdaqGS:SSNC 1 2,217 2,508 0.10 1.00 0.11 0.08
The Dun & Bradstreet Corporation NYSE:DNB 1 1,682 (857) 0.10 0.84 0.10 (0.01)
Thomson Reuters Corporation TSX:TRI 2 7,359 13,238 0.10 0.44 0.06 0.06
Total System Services, Inc. NYSE:TSS 2 2,960 2,370 0.10 0.88 0.10 0.07
Vantiv, Inc. NYSE:VNTV 2 4,753 617 0.10 0.75 0.09 0.05
VeriFone Systems, Inc. NYSE:PAY 1 831 782 0.10 1.13 0.13 0.08
Verisk Analytics, Inc. NasdaqGS:VRSK 2 2,882 1,673 0.10 0.59 0.08 0.06
Virtu Financial, Inc. NasdaqGS:VIRT 1 2,664 1,166 0.10 0.29 0.05 0.05
Visa Inc. NYSE:V 3 18,367 32,760 0.11 0.89 0.09 0.07
The Western Union Company NYSE:WU 1 3,534 709 0.10 0.80 0.10 0.05
WEX Inc. NYSE:WEX 1 2,441 1,633 0.10 0.99 0.11 0.07
WisdomTree Investments, Inc. NasdaqGS:WETF 1 - 203 0.10 1.65 0.17 0.17
Average NA NA 4,357 4,061 0.10 0.84 0.10 0.07

CHAPTER 4. VALUATION MODEL ANALYSIS
4.1. Introduction to chapter In order to test the accuracy and correctness of the findings of previous chapters, the aspects are tested
in a valuation model. This valuation model is an extensive version of a discounted cash flow, in which
growth figures, regulation impact and discount factors are included as described in previous chapters. In
order to examine the accuracy of the extensive DCF, historical data is used. The equity value of a company
at moment t for moment t+1 or t+1.5 is forecasted. The forecasts are compared to the actual value at
moment t+1 and t+1.5. t is in years. So if the forecast is made based on data available on January 1, 2014,
then the results are compared to the actual equity value of the company at January 1 2015 and June 1
2015. This comparison says something about the accuracy of the extensive DCF model.
The accuracy measurement as described above does not say much on itself. Therefore, other valuation
models will also be involved. It is expected that this academically improved discounted cash flow model
is a better predictor than other widely used valuation models. The model is tested against nine other
valuation models which will be described later.
Last, the model performance will be compared to the valuation performance of analyst reports of
investment banks.
Only in case the three different tests satisfy the expectations, the model is a real contribution to the
valuation literature.
All equity values calculated in this part of the report are based on two different formulas:
The number of shares outstanding multiplied by the stock price. The outcome of this calculation
is the market capitalization, which is mostly a close approximation for the equity value.
The enterprise value deducted by the value of debt. The enterprise value of a company is the
value of debt plus the value of equity. By deducting the value of debt, the equity value is found.
This chapters will focus on two research questions
Which valuation methods are best suitable for valuing FinTech companies?
What is better? Valuing a FinTech company by one specific method or by multiple methods?
4.1.1. What to test?
During the tests, only valuations for equity value are done. Equity value mainly describes and indicates
the real value of the company since it does not include any debt. It describes what a company is worth on
itself.
4.2. Models that are included in the test Ten different models are included in the comparison. These models highly differ in terms of difficulty,
sophistication, input, output values and usability. All valuation models only calculate the equity value of
a company.
4.2.1. Extensive discounted cash flow model (DCF) The extensive discounted cash flow model is the main model of the assessment. As described above, the
extensive DCF includes all findings of previous chapters. All needed financial data of a company is retrieved
via Standard and Poor’s CapitalIQ.
4.2.2. Simple discounted cash flow model The simple DCF uses secondary data as input for WACC, growth, speed of convergence and others. This
secondary data is provided by Aswath Damodaran, Professor of Finance at the Stern School of Business at
New York University. This model does not include the possibility to have different company categories (1,
2,3). For this model, market averages for revenue growth rates and WACCs are used. These market
averages are not tailored towards FinTech companies but keep on a higher level, namely the financial
service industry. It is expected that this model is less accurate compared to the extensive DCF.
4.2.3. Transaction multiples In general, investors and advisors use transaction multiples to determine the value of a company.
Multiples paid for comparable companies in historical deals are used to determine a multiple that should
be paid for the company under valuation. These models are most of the time not as accurate as DCF
models. This is mainly because the multiples of comparable companies cannot be fully used, since
companies significantly differ from each other, most of the time. Nevertheless, transaction multiples are
a good first rough indication about the value of a company, therefore transaction multiple models are
normally only used as control model. For simple valuations and less drastically investments, it is
sometimes sufficient to only use a transaction multiple valuation for an investment.
In this test various transaction multiple models are included. These models are:
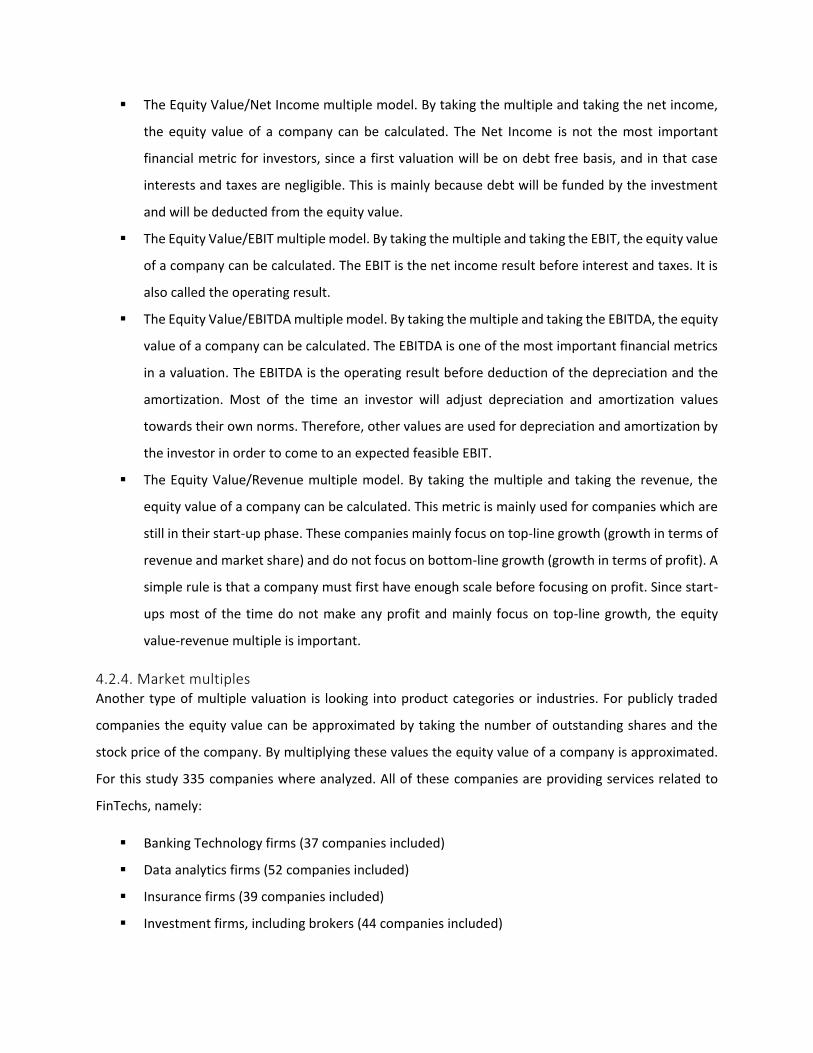
The Equity Value/Net Income multiple model. By taking the multiple and taking the net income,
the equity value of a company can be calculated. The Net Income is not the most important
financial metric for investors, since a first valuation will be on debt free basis, and in that case
interests and taxes are negligible. This is mainly because debt will be funded by the investment
and will be deducted from the equity value.
The Equity Value/EBIT multiple model. By taking the multiple and taking the EBIT, the equity value
of a company can be calculated. The EBIT is the net income result before interest and taxes. It is
also called the operating result.
The Equity Value/EBITDA multiple model. By taking the multiple and taking the EBITDA, the equity
value of a company can be calculated. The EBITDA is one of the most important financial metrics
in a valuation. The EBITDA is the operating result before deduction of the depreciation and the
amortization. Most of the time an investor will adjust depreciation and amortization values
towards their own norms. Therefore, other values are used for depreciation and amortization by
the investor in order to come to an expected feasible EBIT.
The Equity Value/Revenue multiple model. By taking the multiple and taking the revenue, the
equity value of a company can be calculated. This metric is mainly used for companies which are
still in their start-up phase. These companies mainly focus on top-line growth (growth in terms of
revenue and market share) and do not focus on bottom-line growth (growth in terms of profit). A
simple rule is that a company must first have enough scale before focusing on profit. Since start-
ups most of the time do not make any profit and mainly focus on top-line growth, the equity
value-revenue multiple is important.
4.2.4. Market multiples Another type of multiple valuation is looking into product categories or industries. For publicly traded
companies the equity value can be approximated by taking the number of outstanding shares and the
stock price of the company. By multiplying these values the equity value of a company is approximated.
For this study 335 companies where analyzed. All of these companies are providing services related to
FinTechs, namely:
Banking Technology firms (37 companies included)
Data analytics firms (52 companies included)
Insurance firms (39 companies included)
Investment firms, including brokers (44 companies included)

Mortgage service firms (22 companies included)
Financial outsourcing firms (35 companies included)
Payment firms (76 companies included)
Wages services firms (30 companies included)
For each of these services two different multiples are calculated:
Enterprise value/Revenue
Enterprise value/EBITDA
For each company that is used in the analysis of this report, it is determined which of the above services
are mainly provided by the company. Based on the corresponding enterprise value-Revenue or -EBITDA
multiple and the total value of debt, the equity value of the company can be determined.
4.2.5. Statistical valuation methods
Based on CapitalIQ data for different financial metrics, two statistical valuation methods were set up.
These valuation methods do not include any common sense. This means that by using logical reasoning
the methods do not make any sense. These methods are only used for comparison.
Model 1, high valued (useful for smaller companies):
((𝐸𝐵𝐼𝑇𝐷𝐴 %𝑡 + 𝑅𝑒𝑣𝑒𝑛𝑢𝑒 𝐶𝐴𝐺𝑅 %𝑡−1,𝑡+1) ∗ 16.468 − 1.5424)
∗ 𝑅𝑒𝑣𝑒𝑛𝑢𝑒𝑡 – 𝑡𝑜𝑡𝑎𝑙 𝑣𝑎𝑙𝑢𝑒 𝑜𝑓 𝑑𝑒𝑏𝑡𝑡 = 𝑒𝑞𝑢𝑖𝑡𝑦 𝑣𝑎𝑙𝑢𝑒𝑡
Model 2, low valued (useful for larger companies):
((𝐸𝐵𝐼𝑇𝐷𝐴 %𝑡 + 𝑅𝑒𝑣𝑒𝑛𝑢𝑒 𝐶𝐴𝐺𝑅 %𝑡−1,𝑡+1) ∗ 16.905 + 2.1273)
∗ 𝑅𝑒𝑣𝑒𝑛𝑢𝑒𝑡 – 𝑡𝑜𝑡𝑎𝑙 𝑣𝑎𝑙𝑢𝑒 𝑜𝑓 𝑑𝑒𝑏𝑡𝑡 = 𝑒𝑞𝑢𝑖𝑡𝑦 𝑣𝑎𝑙𝑢𝑒𝑡
Both models are based on a separate set of companies. None of the companies used in this assessment
are used for determining these statistical valuation models. The other separate set of companies had
comparable characteristics as the companies used in this assessment. Smaller companies had a
correlation with model 1 of 0.80. Larger companies had a correlation with model 2 of 0.64.
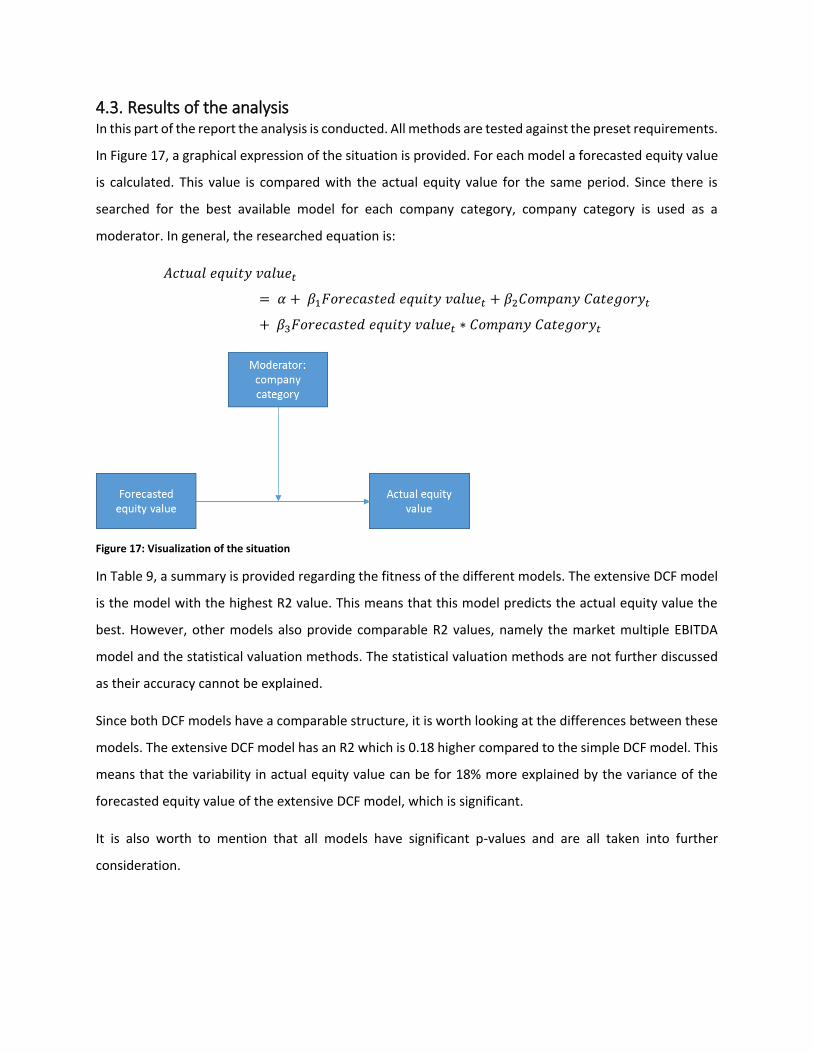
4.3. Results of the analysis In this part of the report the analysis is conducted. All methods are tested against the preset requirements.
In Figure 17, a graphical expression of the situation is provided. For each model a forecasted equity value
is calculated. This value is compared with the actual equity value for the same period. Since there is
searched for the best available model for each company category, company category is used as a
moderator. In general, the researched equation is:
𝐴𝑐𝑡𝑢𝑎𝑙 𝑒𝑞𝑢𝑖𝑡𝑦 𝑣𝑎𝑙𝑢𝑒𝑡
= 𝛼 + 𝛽1𝐹𝑜𝑟𝑒𝑐𝑎𝑠𝑡𝑒𝑑 𝑒𝑞𝑢𝑖𝑡𝑦 𝑣𝑎𝑙𝑢𝑒𝑡 + 𝛽2𝐶𝑜𝑚𝑝𝑎𝑛𝑦 𝐶𝑎𝑡𝑒𝑔𝑜𝑟𝑦𝑡
+ 𝛽3𝐹𝑜𝑟𝑒𝑐𝑎𝑠𝑡𝑒𝑑 𝑒𝑞𝑢𝑖𝑡𝑦 𝑣𝑎𝑙𝑢𝑒𝑡 ∗ 𝐶𝑜𝑚𝑝𝑎𝑛𝑦 𝐶𝑎𝑡𝑒𝑔𝑜𝑟𝑦𝑡
Figure 17: Visualization of the situation
In Table 9, a summary is provided regarding the fitness of the different models. The extensive DCF model
is the model with the highest R2 value. This means that this model predicts the actual equity value the
best. However, other models also provide comparable R2 values, namely the market multiple EBITDA
model and the statistical valuation methods. The statistical valuation methods are not further discussed
as their accuracy cannot be explained.
Since both DCF models have a comparable structure, it is worth looking at the differences between these
models. The extensive DCF model has an R2 which is 0.18 higher compared to the simple DCF model. This
means that the variability in actual equity value can be for 18% more explained by the variance of the
forecasted equity value of the extensive DCF model, which is significant.
It is also worth to mention that all models have significant p-values and are all taken into further
consideration.

Table 9: Analysis summary
Considering Table 10, the detailed summary of the parameters provides more information regarding the
strengthens of the relations. For seven of the ten different models all variables are significant. This is the
case for all models with relatively high overall R2 values (Table 9). For three transaction multiple models,
the input of the model itself is not significant, but only the moderators has a significant relation with the
dependent variable. This is again in line with the relatively low R2 values.
Model R R2 MSE F df1 df2 p
F_EQV_DCF_E 0.82 0.67 261976165 186 3 280 0
F_EQV_DCF_S 0.70 0.49 413780412 85 3 271 0
F_EQV_TM_NI 0.63 0.39 488682549 59 3 272 0
F_EQV_TM_EBIT 0.60 0.37 539561800 42 3 220 0
F_EQV_TM_EBITDA 0.61 0.37 534853502 43 3 220 0
F_EQV_TM_REV 0.62 0.39 514481727 47 3 225 0
F_EQV_MM_EBITDA 0.80 0.64 385310909 82 3 140 0
F_EQV_MM_REV 0.60 0.36 256178503 137 3 128 0
F_EQV_SC_LOW 0.80 0.63 325893143 136 3 234 0
F_EQV_SC_HIGH 0.80 0.64 252081812 146 3 244 0
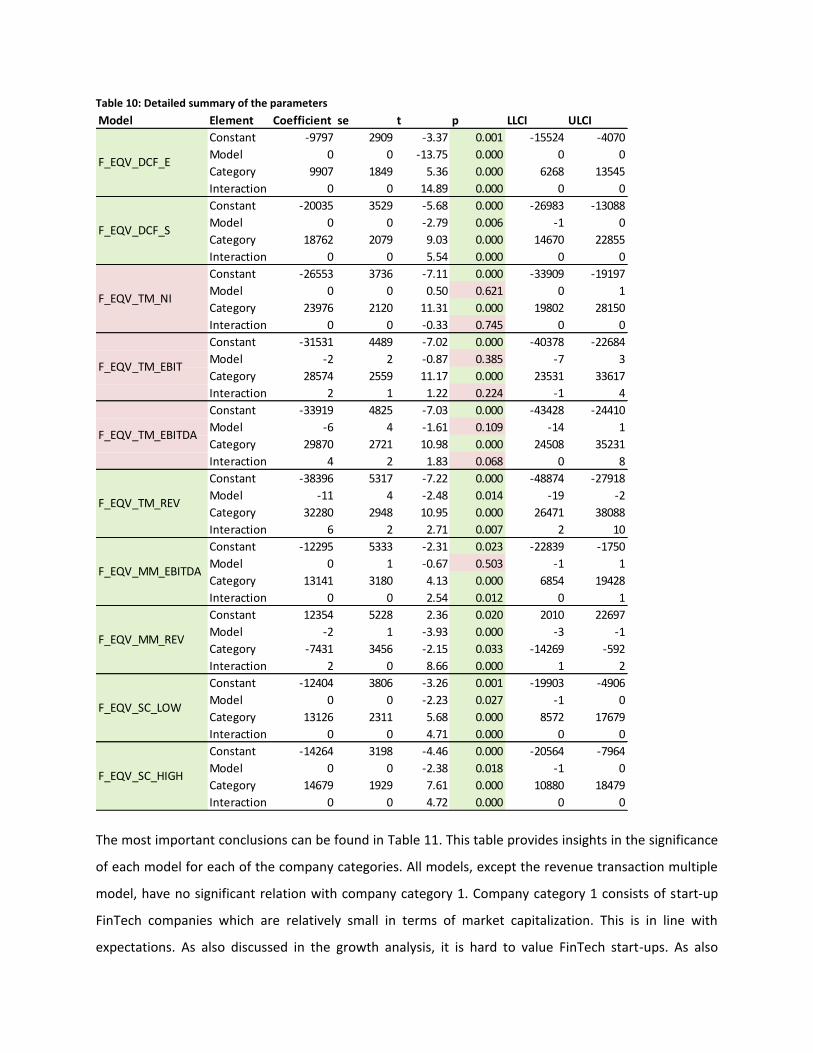
Table 10: Detailed summary of the parameters
The most important conclusions can be found in Table 11. This table provides insights in the significance
of each model for each of the company categories. All models, except the revenue transaction multiple
model, have no significant relation with company category 1. Company category 1 consists of start-up
FinTech companies which are relatively small in terms of market capitalization. This is in line with
expectations. As also discussed in the growth analysis, it is hard to value FinTech start-ups. As also
Model Element Coefficient se t p LLCI ULCI
Constant -9797 2909 -3.37 0.001 -15524 -4070
Model 0 0 -13.75 0.000 0 0
Category 9907 1849 5.36 0.000 6268 13545
Interaction 0 0 14.89 0.000 0 0
Constant -20035 3529 -5.68 0.000 -26983 -13088
Model 0 0 -2.79 0.006 -1 0
Category 18762 2079 9.03 0.000 14670 22855
Interaction 0 0 5.54 0.000 0 0
Constant -26553 3736 -7.11 0.000 -33909 -19197
Model 0 0 0.50 0.621 0 1
Category 23976 2120 11.31 0.000 19802 28150
Interaction 0 0 -0.33 0.745 0 0
Constant -31531 4489 -7.02 0.000 -40378 -22684
Model -2 2 -0.87 0.385 -7 3
Category 28574 2559 11.17 0.000 23531 33617
Interaction 2 1 1.22 0.224 -1 4
Constant -33919 4825 -7.03 0.000 -43428 -24410
Model -6 4 -1.61 0.109 -14 1
Category 29870 2721 10.98 0.000 24508 35231
Interaction 4 2 1.83 0.068 0 8
Constant -38396 5317 -7.22 0.000 -48874 -27918
Model -11 4 -2.48 0.014 -19 -2
Category 32280 2948 10.95 0.000 26471 38088
Interaction 6 2 2.71 0.007 2 10
Constant -12295 5333 -2.31 0.023 -22839 -1750
Model 0 1 -0.67 0.503 -1 1
Category 13141 3180 4.13 0.000 6854 19428
Interaction 0 0 2.54 0.012 0 1
Constant 12354 5228 2.36 0.020 2010 22697
Model -2 1 -3.93 0.000 -3 -1
Category -7431 3456 -2.15 0.033 -14269 -592
Interaction 2 0 8.66 0.000 1 2
Constant -12404 3806 -3.26 0.001 -19903 -4906
Model 0 0 -2.23 0.027 -1 0
Category 13126 2311 5.68 0.000 8572 17679
Interaction 0 0 4.71 0.000 0 0
Constant -14264 3198 -4.46 0.000 -20564 -7964
Model 0 0 -2.38 0.018 -1 0
Category 14679 1929 7.61 0.000 10880 18479
Interaction 0 0 4.72 0.000 0 0
F_EQV_MM_EBITDA
F_EQV_MM_REV
F_EQV_SC_LOW
F_EQV_SC_HIGH
F_EQV_DCF_E
F_EQV_DCF_S
F_EQV_TM_NI
F_EQV_TM_EBIT
F_EQV_TM_EBITDA
F_EQV_TM_REV

discussed, start-ups are mainly valued based on their revenue. That is mainly because these companies
focus on top-line growth and did not have the chance to also focus on bottom-line growth. Therefore, this
finding is in line with expectation. Regarding company category 2 and company category 3, all models
except the transaction multiple Net Income and EBIT models have significant relations. The impact of the
moderator is the most for the extensive DCF model. This means that, without using the moderator, the
R2 of the extensive DCF model is much lower. This again indicates that not all models can be used for
valuing all companies in all three the company categories.
Table 11: Impact of moderation summary
4.3.1. So which model is best to use? Based on the results of the analysis it can be stated that the extensive DCF model has the highest R2 value
and is significant for company category 2 and company category 3. Thereby this model can best be used
to value companies that are already established or to value companies that are currently in their growth
phase. The model is not the best model to use for valuing start-up FinTechs, for these companies a
relatively simple transaction multiple analysis on revenue should be used. Relating this to the earlier
introduced s-shape curve, the following conclusion can be made:
Model Element R2 impact F p cat 1 p cat 2 p cat 3 p
F_EQV_DCF_E Interaction 0.2643 221.6 0 0.8646 0 0
F_EQV_DCF_S Interaction 0.0582 30.7 0 0.5202 0 0
F_EQV_TM_NI Interaction 0.0002 0.1 0.7446 NA NA NA
F_EQV_TM_EBIT Interaction 0.0043 1.5 0.2235 NA NA NA
F_EQV_TM_EBITDA Interaction 0.0096 3.4 0.0679 0.1729 0.0068 0.0068
F_EQV_TM_REV Interaction 0.02 7.3 0.0073 0.027 0.0052 0.0052
F_EQV_MM_EBITDA Interaction 0.0167 6.5 0.0122 0.7573 0.0026 0.0026
F_EQV_MM_REV Interaction 0.1393 75.0 0 0.4133 0 0
F_EQV_SC_LOW Interaction 0.0347 22.2 0 0.3738 0.0045 0.0045
F_EQV_SC_HIGH Interaction 0.0327 22.3 0 0.2636 0.0135 0.0135

4.3.2. Accuracy of the models compared to the performance of analyst reports It is hard to estimate whether the newly developed extensive DCF model is better than the models used
for analyst reports. This has multiple reasons; the amount of available data was limited during this
research and multiple different models are used by the different analyst reports. What can be said is,
based on the results of the analysis, that the model should at least be able to give a first and feasibly
approximation of the potential value of the company that is being valued.
CHAPTER 5. CONCLUSION
5.1. Conclusion
According to a variety of analyst reports, valuing FinTech companies has some complications. These
complications are mainly driven by the immaturity of the FinTech market. This research provides a first
valuation approach for Financial Technology firms which is based on academic theories. The main purpose
of the thesis was to come up with a model that is based on solid parameters such as, amongst others,
growth rates that are supported by academic theories and plausible market returns (again based on
academic approaches and heuristics). The most sophisticated model which includes all researched
variables can, as expected, best be used for valuing FinTech companies that have passed their start-up
phase.
Three FinTech company categories are identified in this research. These categories distinguish from each
other mainly based on current market capitalization of each company. On average, the greater the market
Transaction Multiple Revenue model Extensive DCF

capitalization and thereby the value of a company, the more mature a company is. The three FinTech
company categories that are identified are: companies with a market capitalization below $10mld,
companies with a market capitalization between $10mld and $50mld, and companies with a market
capitalization greater than $50mld. The FinTech company categories indicator was a leading moderator
throughout the report. It was expected that the value of newer FinTech companies, with relatively low
market capitalization and a lower FinTech company category, is best to be predicted by other methods
compared to more mature FinTech companies (with a higher FinTech company category and higher
market capitalization). The results were as expected.
Newer FinTech companies, companies in the group of category 1, were relatively difficult to predict. Only
one valuation method, the transaction multiple looking at revenue figures, showed a significant relation
between the forecasted company value and the actual value. This is, again, in line with expectations.
Newer FinTech companies have no sustainable financial results. These companies are growing in terms of
revenue, but still have a negative income (both EBITDA and net income). This can be logically explained
by the fact that newer FinTech companies are mainly focusing on top line growth. Top line which
eventually results in more market share and better economies of scale, which are main value propositions
of FinTech companies. FinTech companies can provide comparable financial services against lower rates,
because they can provide the same service against lower rates (due to a simpler business model). This
only works as long as there is enough scale in terms of sales. This results in the fact that these companies
have a negative net income in their beginning years but great revenue growth rates. This conclusion is in
line by what is seen at the transaction service valuation department at EY Netherlands. According to EY,
several (financial service) start-ups are valued for non-strategic investors, which only look at the stand-
alone value of a company. For these companies it is not necessary and useful to use extensive DCF models,
a simple revenue multiple will provide more value.
More mature FinTech companies with constant growth rates or declining growth rates (companies
grouped in category 2 or 3) can be valued by multiple valuation models. Eight models had significant
results for companies in category 2 and category 3. Out of these models, the extensive DCF model, which
is the only model which includes all the outcomes as researched in this thesis, has the highest R2 value
for the relation between the forecasted value and the actual value. This is a relatively high R2 value. This
high value is mainly driven by constant and stable financial performance of the companies included in
these groups. These companies can better deal with uncertainty of, for example, regulation issues. These
companies have proven their existence is sustainable which results in less volatility in stock prices and

market capitalization. Companies in category 1, newer FinTech companies, haven’t yet proven their
existence. Potential customers are still having lack of trust in the services offered. This results in more
volatility in terms of stock price and market capitalization. This difference results in greater valuation
accuracy values for more mature FinTech companies.
Using a valuation method that is based on academic theories, can be useful to value FinTech companies.
The model in this thesis performed significantly better in tests compared to the accuracy rates of analyst
reports. There are still lots of improvements to be made, which will be discussed in next subchapter.
5.2. Discussion, limitation and future research This research is limited by several aspects which are described below.
First, the results in this report are only based on public data. Private, non-publicly traded, companies are
not obliged to publish their financial results. Since their value propositions and strategies can be indicated
by their financial performance, none of the private FinTech companies publish their financial results. We
were lucky that we were able to use EY’s Standard & Poor’s Capital IQ license to obtain public data. By
using this tool, public data could be obtained easily and models that retrieve financial data could be built.
However, since the model is only based on data of publicly-traded companies, there could be an accuracy
discrepancy when the models are used for private companies. In future research the valuation models
should be tested with private FinTech company data to test the solidness and usability of these models.
Second, for estimating a growth rate proxy, only a few possibilities were tested. For the growth rate
estimation, it could be the case that other proxies provide more accurate results. The possible proxies for
growth rates were only based on rational reasoning. By thinking about the characteristics of FinTech
companies, potential growth rate market proxies were identified. In this thesis, only four different growth
rate proxies were indicated and only one, the social media market proxy, is tested (with positive results).
The data of this social media market proxy was almost just as limited as the data that was available for
FinTech companies. However, this proxy could still be used because the market is more mature and the
trends that are seen (s-shaped curve) are less uncertain. Again, future research should contain other
datasets with which both other market proxies can be tested and per market proxy there should also be
more data available.
Third, there are only a few market indices tested as possible proxies for determining the market returns
of companies. In the introduction, it was indicated that newer FinTech companies behave more like

information technology firms instead of financial firms (this was mainly driven by regulation
requirements). However, only one information technology market index is tested.
Fourth, the input for the transaction multiple valuation methods was obtained from capital IQ. This means
that CapitalIQ searches for comparable transactions in order to come up with valuation multiples.
However, it is not indicated why a transaction is seen as a good peer for the research company. There is
no influence on the transactions that are included as peer transactions to determine the value of a
company. By manually determining which transactions can be used as peer transactions the results could
be different. This could possibly lead to significant results for the currently insignificant transaction
multiples (EBITDA, EBIT and net income).
Fifth, in this thesis only three company categories were indicated. A more detailed differentiation could
possibly lead to better results, because the steps that are currently made are relatively big. For example,
companies in company category 1 have still relatively large market capitalization figures. It is expected
that the market capitalization figures for private companies are (much) smaller. Possible redefinition of
company categories could be a solution in future research. In this research is was not possible to make
more company categories, due to the limited availability of data.
Sixth, as described in the introduction, the number of companies and product categories is currently
rapidly increasing. New solutions and services are invented at a high rate. It could, for example, be the
case that newer product categories are less influenced by financial regulation uncertainty. In that case the
valuation methods need to be modified for these companies. Less uncertainty results in lower discount
rates, because less risk has to be covered.
Seventh, regulation is currently changing. As explained in chapter three, there is no clear direction on how
to deal with regulation uncertainty. It could be the case that regulation becomes more restrictive in the
near future, in that case the value proposition of newer FinTech firms will be decreased. The newer
FinTech companies currently operate as information technology firms and do not have to deal with the
same (high) regulation restrictions that financial service companies have. In case the regulation
requirements for the newer FinTechs will reach the level of regulation for financial service companies, the
value proposition of these companies will decrease.

CHAPTER 6. REFERENCES
6.1. Literature references Abreu, D., & Brunnermeier, M. K. (2003). Bubbles and Crashes. Econometrica, 53(9), 1689–1699.
https://doi.org/10.1017/CBO9781107415324.004
Accenture. (2015). The Future of Fintech and Banking. Accenture, 1–12.
Arner, D. W., Barberis, J., & Buckley, R. P. (2018). RegTech: Building a Better Financial System. Handbook of Blockchain, Digital Finance, and Inclusion, Volume 1 (1st ed., Vol. 1). Elsevier Inc. https://doi.org/10.1016/B978-0-12-810441-5.00016-6
Badr, B. (2018). The Blockchain mania and the dot-com bubble !, 1–6.
Bank of Newyork Mellon. (2015). Innovation in Payments: The Future is Fintech. The Bank of Newyork.
Barker, R., & Schulte, S. (2017). Representing the market perspective: Fair value measurement for non-financial assets. Accounting, Organizations and Society, 56, 55–67. https://doi.org/10.1016/j.aos.2014.12.004
Bell Pottinger. (2017). The 10 Hottest FinTech Trends for 2017.
Biedermann, J. (2015). Fintech – Dot-com bubble 2.0 or game changer in the financial industry?, (July).
Brunnermeier, M. K. (2009). Deciphering the Liquidity and Credit Crunch 2007–2008. Journal of Economic Perspectives, 23(1), 77–100. https://doi.org/10.1257/jep.23.1.77
Burden, K. (2017). EU update. Computer Law and Security Review, 33(6), 884–891. https://doi.org/10.1016/j.clsr.2017.10.001
CB Insights. (2017). The global FinTech Report: 2016 in review.
Cocking, S., & McCullen, A. (2017). Innovation lessons from the all blacks.
Damodaran, A. (2009). Valuing Young, Start-Up and Growth Companies: Estimation Issues and Valuation Challenges. SSRN Electronic Journal, (May), 1–67. https://doi.org/10.2139/ssrn.1418687
De Jonghe, O. (2010). Back to the basics in banking? A micro-analysis of banking system stability. Journal of Financial Intermediation, 19(3), 387–417. https://doi.org/10.1016/j.jfi.2009.04.001
Dietz, M., Vinayak, H., & Lee, G. (2016). Bracing for seven critical changes as fintech matures. McKinsey & Company, (November), 1–8. Retrieved from http://www.mckinsey.com/industries/financial-services/our-insights/bracing-for-seven-critical-changes-as-fintech-matures?cid=other-eml-alt-mip-mck-oth-1611
Dula, C., & LEE Kuo Chuen, D. (2018). Reshaping the Financial Order. Handbook of Blockchain, Digital Finance, and Inclusion, Volume 1 (1st ed., Vol. 1). Elsevier Inc. https://doi.org/10.1016/B978-0-12-810441-5.00001-4
Elmassri, M. M., Harris, E. P., & Carter, D. B. (2015). Accounting for strategic investment decision-making under extreme uncertainty. British Accounting Review, 48(2), 151–168. https://doi.org/10.1016/j.bar.2015.12.002
EurActiv. (2017). The European Commission consults on FinTech regulation.

Excerpt, B., Goedhart, B. M., Koller, T., & Wessels, D. (2018). Valuing high-tech companies, 1–10.
EY. (2016). Capital Markets : innovation and the FinTech landscape.
Financial Market Authority Liechtenstein. (2017). Fachts and figures on the financial intermediaries supervised by the FMA.
Financial Market Authority of Liechstenstein. (2017). Overview – FinTech regulation.
Gaban, L. (2018). How the Cryptocurrency boom is the same and di erent than the early Internet boom, 1–8.
Ho, F. (2018). Is Fintech Another Dotcom Bubble , Destined To Burst ?, 1–9.
Hollebeek, L. D. (2017). Developing business customer engagement through social media engagement-platforms: An integrative S-D logic/RBV-informed model. Industrial Marketing Management, (January), 0–1. https://doi.org/10.1016/j.indmarman.2017.11.016
ICAR. (2017). What are the new collaboration models between banks and Fintech firms?, 1–8.
Interoute. (2017). What is SaaS, 1–4.
Investorpedia. (2017). The definition of FinTech, 6–8.
Jacoby, S., Prinz, U., Khodabaks, A., Scheele, M., Namiotkiewicz, G., Biala, A., … Lee, S. (2017). European Fintech Regulation - An Overview.
Koller, T., Marc, G., & Wessels, D. (2015). Measuring and Managing the Value of Companies (6th ed.).
Kucharavy, D., & De Guio, R. (2015). Application of logistic growth curve. Procedia Engineering, 131, 280–290. https://doi.org/10.1016/j.proeng.2015.12.390
Kumar, R. (2016). Perspectives on Value and Valuation. Valuation, 3–46. https://doi.org/10.1016/B978-0-12-802303-7.00001-2
Lavender, J., Pollari, I., Raisbeck, M., Hughes, B., & Speier, A. (2017). Global Analysis of Investment in Fintech. Kpmg, (February), 97. Retrieved from https://assets.kpmg.com/content/dam/kpmg/xx/pdf/2017/02/pulse-of-fintech-q4-2016.pdf
Lee, I., & Shin, Y. J. (2017). Fintech: Ecosystem, business models, investment decisions, and challenges. Business Horizons, 61(1), 35–46. https://doi.org/10.1016/j.bushor.2017.09.003
Leong, C., Tan, B., Xiao, X., Tan, F. T. C., & Sun, Y. (2017). Nurturing a FinTech ecosystem: The case of a youth microloan startup in China. International Journal of Information Management, 37(2), 92–97. https://doi.org/10.1016/j.ijinfomgt.2016.11.006
Lloyd, J., Gulamhuseinwala, I., & Hatch, M. (2016). EY FinTech Adoption Index. EY Fintech 2017, 1–38. Retrieved from http://www.ey.com/GL/en/Industries/Financial-Services/ey-fintech-adoption-index
Lunn, B., Pylarinou, E., & Ellerm, J. (2017). How we define & categorize Fintech. Daily Fintech.
MarketWatch. (2018). Guide to analyst recommendations, 1–17.
McGraw Hill. (2018). Your Guide to Standard & Poor ’ s Stock Reports.
McKinsey & Company. (2016). FinTechnicolor: The New Picture in Finance.

Michaels, L., & Homer, M. (2018). Chapter 14 - Regulation and Supervision in a Digital and Inclusive World. Handbook of Blockchain, Digital Finance, and Inclusion, Volume 1 (1st ed., Vol. 1). Elsevier Inc. https://doi.org/https://doi.org/10.1016/B978-0-12-810441-5.00014-2
Motsi-Omoijiade, I. D. (2018). Financial Intermediation in Cryptocurrency Markets – Regulation, Gaps and Bridges. Handbook of Blockchain, Digital Finance, and Inclusion, Volume 1 (1st ed., Vol. 1). Elsevier Inc. https://doi.org/10.1016/B978-0-12-810441-5.00009-9
Pryor, K. (2016). Here Are the Startup Failure Rates by Industry. Tech.co. Retrieved from https://tech.co/startup-failure-rates-industry-2016-01
PWC. (2016). Blurred Lines: How FinTech is shaping Financial Services.
Reuters, T. (2016). Analyst observastions LendingTree, 1–162. https://doi.org/10.1016/S0022-5223(13)00065-2
Reuters, T. (2017). Analyst observastions Ellie Mae, 8(1), 1–11. https://doi.org/10.1016/S0022-5223(13)00065-2
Riethdorf, C. (2018). Startup valuation - how to value an early-stage company?, 1–7.
Sawyer, S. (2017). Mapping the European Fintech Market : 500 EU Fintechs, 2015–2017.
Siekkinen, J. (2016). Value relevance of fair values in different investor protection environments. Accounting Forum, 40(1), 1–15. https://doi.org/10.1016/j.accfor.2015.11.001
Skan, J., Dickerson, J., & Gagliardi, L. (2016). Fintech and the evolving landscape : landing points for the industry, 1–12. Retrieved from www.fintechinnovationlablondon.co.uk/pdf/Fintech_Evolving_Landscape_2016.pdf
Smith, R. (2017). Do Regulatory Questions Threaten the Rise of Fintech?
Watt, E. C., Fisher, P., & Bolton, N. (2014). BlackRock Investment Institute, (December 2013).
Woolard, C. (2017). The FCA’s regional FinTech engagement, 1–4.

6.2. Figure references Figure 1: Advice graph – established FinTech companies .......................................................................... 13
Figure 2: Advice graph – newer FinTech companies Figure 3: Cumulative distribution function over
advices 14
Figure 4: Accuracy of analyst reports for established and newer FinTechs ............................................... 15
Figure 5: Variance comparisons on company and group levels ................................................................. 17
Figure 6: Growth and value s-shaped curve ............................................................................................... 20
Figure 7: Visual representation of allegation 1 (left) and allegation 2 (right) ............................................ 20
Figure 8: Growth of monthly active users in Social Media ......................................................................... 23
Figure 9: Total market size (number active users) in Social Media ............................................................ 24
Figure 10: Growth rate comparison between different social media platforms ........................................ 25
Figure 11: Paypal's annual revenue growth rates ....................................................................................... 26
Figure 12: Market Cap comparison P2P online lending Fintechs ............................................................... 32
Figure 13: Scatter plot P2P online lending Fintechs comparison ............................................................... 32
Figure 14: Market Cap comparison P2P online lending Fintechs (including remarkable situations) ......... 33
Figure 15: Stock value change due to news articles (left is possitive, right is negative) ............................ 36
Figure 16: Index histograms of 2014, 2015, 2016 and 2017 ....................................................................... 39
Figure 17: Visualization of the situation ..................................................................................................... 52
6.3. Table references Table 1: Analyst report overview – established FinTech companies .......................................................... 13
Table 2: Analyst report overview – newer FinTech companies .................................................................. 14
Table 3: Financial comparison of thee comparable FinTech companies .................................................... 19
Table 4: Growth rates of compared companies ......................................................................................... 26
Table 5: Overview of regulation related news moments ........................................................................... 35
Table 6: Summary per market .................................................................................................................... 42
Table 7: Market overview ........................................................................................................................... 44
Table 8: WACC calculation .......................................................................................................................... 47
Table 9: Analysis summary .......................................................................................................................... 53
Table 10: Detailed summary of the parameters ......................................................................................... 54
Table 11: Impact of moderation summary ................................................................................................. 55
Table 12: Summary per company ............................................................................................................... 64
Table 13: Beta summary ............................................................................................................................. 65

APPENDIX A Table 12: Summary per company
1/1/2013 1/1/2014 1/1/2015 1/1/2016 1/1/2017
ACI Worldwide, Inc. NasdaqGS:ACIW 1975 1 1.00 1.49 1.38 1.47 1.25 6%
Alliance Data Systems Corporation NYSE:ADS 1996 2 1.00 1.82 1.98 1.91 1.58 12%
American Express Company NYSE:AXP 1850 3 1.00 1.58 1.62 1.21 1.29 7%
Blackhawk Network Holdings, Inc. NasdaqGS:HAWK 2001 1 NA 1.09 1.67 1.90 1.62 NA
BofI Holding, Inc. NasdaqGS:BOFI 1999 1 1.00 2.82 2.80 3.03 4.11 42%
Broadridge Financial Solutions, Inc. NYSE:BR 1962 2 1.00 1.73 2.02 2.35 2.90 30%
Cardtronics plc NasdaqGS:CATM 1989 1 1.00 1.83 1.63 1.42 2.30 23%
Cboe Global Markets, Inc. NasdaqGS:CBOE 1973 2 1.00 1.76 2.15 2.20 2.51 26%
CME Group Inc. NasdaqGS:CME 1898 3 1.00 1.55 1.75 1.79 2.28 23%
CoreLogic, Inc. NYSE:CLGX 1894 1 1.00 1.32 1.17 1.26 1.37 8%
Envestnet, Inc. NYSE:ENV 1999 1 1.00 2.89 3.52 2.14 2.53 26%
Equifax Inc. NYSE:EFX 1899 2 1.00 1.28 1.49 2.06 2.18 22%
Euronet Worldwide, Inc. NasdaqGS:EEFT 1994 1 1.00 2.03 2.33 3.07 3.07 32%
EVERTEC, Inc. NYSE:EVTC 1988 1 NA 1.39 1.25 0.94 1.00 NA
FactSet Research Systems Inc. NYSE:FDS 1978 1 1.00 1.23 1.60 1.85 1.86 17%
Fair Isaac Corporation NYSE:FICO 1956 1 1.00 1.50 1.72 2.24 2.84 30%
Fidelity National Information Services, Inc. NYSE:FIS 1968 2 1.00 1.54 1.79 1.74 2.17 21%
Financial Engines, Inc. NasdaqGS:FNGN 1996 1 1.00 2.50 1.32 1.21 1.32 7%
First Data Corporation NYSE:FDC 1989 2 NA NA NA 2.05 1.81 NA
Fiserv, Inc. NasdaqGS:FISV 1984 2 1.00 1.49 1.80 2.31 2.69 28%
FleetCor Technologies, Inc. NYSE:FLT 1986 2 1.00 2.18 2.77 2.66 2.64 27%
Global Payments Inc. NYSE:GPN 1967 2 1.00 1.43 1.78 2.85 3.06 32%
Green Dot Corporation NYSE:GDOT 1999 1 1.00 2.06 1.68 1.35 1.93 18%
IHS Markit Ltd. NasdaqGS:INFO 1959 2 NA NA NA NA 2.07 NA
Intercontinental Exchange, Inc. NYSE:ICE 2000 2 1.00 1.82 1.77 2.07 2.28 23%
Jack Henry & Associates, Inc. NasdaqGS:JKHY 1976 1 1.00 1.51 1.58 1.99 2.26 23%
LendingClub Corporation NYSE:LC 2006 1 NA NA 1.92 0.84 0.40 NA
LendingTree, Inc. NasdaqGS:TREE 1996 1 1.00 1.82 2.68 4.95 5.62 54%
MarketAxess Holdings Inc. NasdaqGS:MKTX 2000 1 1.00 1.90 2.03 3.16 4.16 43%
Mastercard Incorporated NYSE:MA 1966 3 1.00 1.70 1.75 1.98 2.10 20%
Moody's Corporation NYSE:MCO 1900 2 1.00 1.56 1.90 1.99 1.87 17%
MSCI Inc. NYSE:MSCI 1998 2 1.00 1.41 1.53 2.33 2.54 26%
Nasdaq, Inc. NasdaqGS:NDAQ 1971 2 1.00 1.59 1.92 2.33 2.69 28%
PayPal Holdings, Inc. NasdaqGS:PYPL 1998 3 NA NA NA 2.00 2.18 NA
S&P Global Inc. NYSE:SPGI 1888 2 1.00 1.43 1.63 1.80 1.97 18%
SEI Investments Co. NasdaqGS:SEIC 1968 2 1.00 1.49 1.72 2.25 2.11 21%
Square, Inc. NYSE:SQ 2009 2 NA NA NA 2.13 2.21 NA
SS&C Technologies Holdings, Inc. NasdaqGS:SSNC 1986 1 1.00 1.92 2.53 2.96 2.48 25%
The Dun & Bradstreet Corporation NYSE:DNB 1841 1 1.00 1.56 1.54 1.32 1.54 11%
Thomson Reuters Corporation TSX:TRI 1799 2 1.00 1.40 1.63 1.82 2.04 20%
Total System Services, Inc. NYSE:TSS 1982 2 1.00 1.55 1.59 2.32 2.29 23%
Vantiv, Inc. NYSE:VNTV 2009 2 1.00 1.60 1.66 2.32 2.92 31%
VeriFone Systems, Inc. NYSE:PAY 1981 1 1.00 0.90 1.25 0.94 0.60 -12%
Verisk Analytics, Inc. NasdaqGS:VRSK 1971 2 1.00 1.29 1.26 1.51 1.59 12%
Virtu Financial, Inc. NasdaqGS:VIRT 2008 1 NA NA NA 2.03 1.43 NA
Visa Inc. NYSE:V 2007 3 1.00 1.47 1.73 2.05 2.06 20%
The Western Union Company NYSE:WU 2006 1 1.00 1.27 1.32 1.32 1.60 12%
WEX Inc. NYSE:WEX 1983 1 1.00 1.31 1.31 1.17 1.48 10%
WisdomTree Investments, Inc. NasdaqGS:WETF 1985 1 1.00 2.89 2.56 2.56 1.82 16%
Average NA NA NA 1.00 1.67 1.82 2.02 2.18 21%
Indexed stock price
Company name Ticker Founding Year Category
CAGR
' 13-' 17
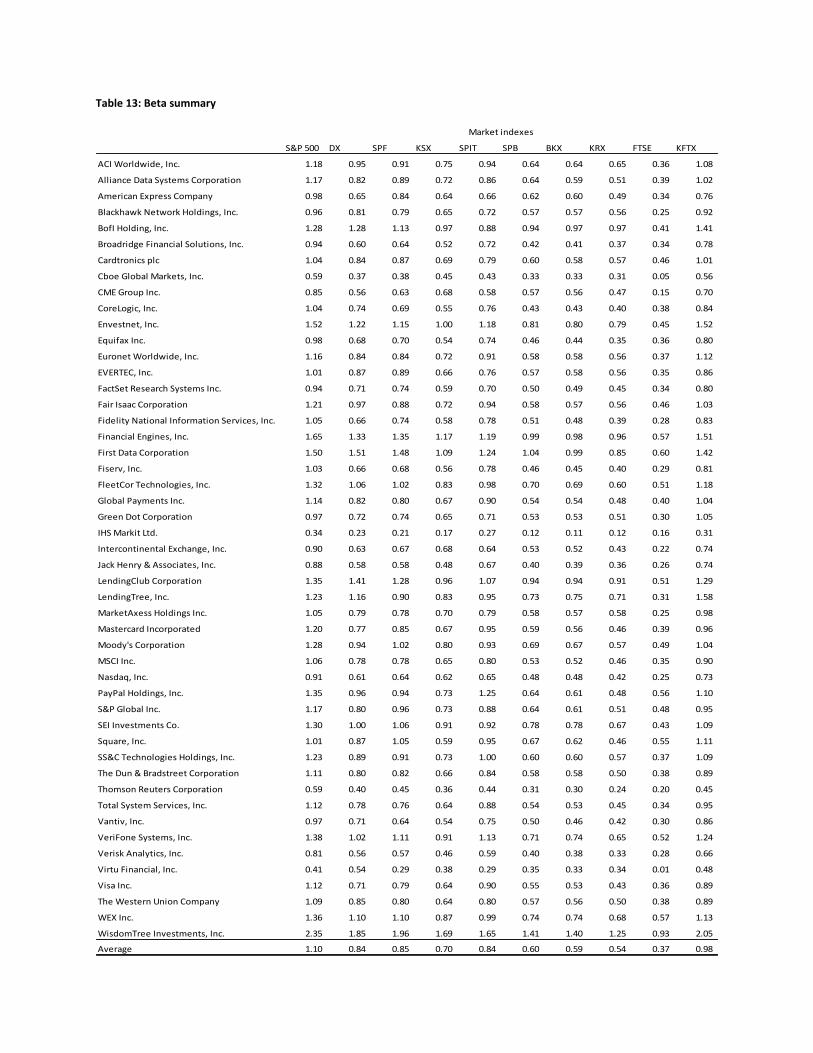
Table 13: Beta summary
S&P 500 DX SPF KSX SPIT SPB BKX KRX FTSE KFTX
ACI Worldwide, Inc. 1.18 0.95 0.91 0.75 0.94 0.64 0.64 0.65 0.36 1.08
Alliance Data Systems Corporation 1.17 0.82 0.89 0.72 0.86 0.64 0.59 0.51 0.39 1.02
American Express Company 0.98 0.65 0.84 0.64 0.66 0.62 0.60 0.49 0.34 0.76
Blackhawk Network Holdings, Inc. 0.96 0.81 0.79 0.65 0.72 0.57 0.57 0.56 0.25 0.92
BofI Holding, Inc. 1.28 1.28 1.13 0.97 0.88 0.94 0.97 0.97 0.41 1.41
Broadridge Financial Solutions, Inc. 0.94 0.60 0.64 0.52 0.72 0.42 0.41 0.37 0.34 0.78
Cardtronics plc 1.04 0.84 0.87 0.69 0.79 0.60 0.58 0.57 0.46 1.01
Cboe Global Markets, Inc. 0.59 0.37 0.38 0.45 0.43 0.33 0.33 0.31 0.05 0.56
CME Group Inc. 0.85 0.56 0.63 0.68 0.58 0.57 0.56 0.47 0.15 0.70
CoreLogic, Inc. 1.04 0.74 0.69 0.55 0.76 0.43 0.43 0.40 0.38 0.84
Envestnet, Inc. 1.52 1.22 1.15 1.00 1.18 0.81 0.80 0.79 0.45 1.52
Equifax Inc. 0.98 0.68 0.70 0.54 0.74 0.46 0.44 0.35 0.36 0.80
Euronet Worldwide, Inc. 1.16 0.84 0.84 0.72 0.91 0.58 0.58 0.56 0.37 1.12
EVERTEC, Inc. 1.01 0.87 0.89 0.66 0.76 0.57 0.58 0.56 0.35 0.86
FactSet Research Systems Inc. 0.94 0.71 0.74 0.59 0.70 0.50 0.49 0.45 0.34 0.80
Fair Isaac Corporation 1.21 0.97 0.88 0.72 0.94 0.58 0.57 0.56 0.46 1.03
Fidelity National Information Services, Inc. 1.05 0.66 0.74 0.58 0.78 0.51 0.48 0.39 0.28 0.83
Financial Engines, Inc. 1.65 1.33 1.35 1.17 1.19 0.99 0.98 0.96 0.57 1.51
First Data Corporation 1.50 1.51 1.48 1.09 1.24 1.04 0.99 0.85 0.60 1.42
Fiserv, Inc. 1.03 0.66 0.68 0.56 0.78 0.46 0.45 0.40 0.29 0.81
FleetCor Technologies, Inc. 1.32 1.06 1.02 0.83 0.98 0.70 0.69 0.60 0.51 1.18
Global Payments Inc. 1.14 0.82 0.80 0.67 0.90 0.54 0.54 0.48 0.40 1.04
Green Dot Corporation 0.97 0.72 0.74 0.65 0.71 0.53 0.53 0.51 0.30 1.05
IHS Markit Ltd. 0.34 0.23 0.21 0.17 0.27 0.12 0.11 0.12 0.16 0.31
Intercontinental Exchange, Inc. 0.90 0.63 0.67 0.68 0.64 0.53 0.52 0.43 0.22 0.74
Jack Henry & Associates, Inc. 0.88 0.58 0.58 0.48 0.67 0.40 0.39 0.36 0.26 0.74
LendingClub Corporation 1.35 1.41 1.28 0.96 1.07 0.94 0.94 0.91 0.51 1.29
LendingTree, Inc. 1.23 1.16 0.90 0.83 0.95 0.73 0.75 0.71 0.31 1.58
MarketAxess Holdings Inc. 1.05 0.79 0.78 0.70 0.79 0.58 0.57 0.58 0.25 0.98
Mastercard Incorporated 1.20 0.77 0.85 0.67 0.95 0.59 0.56 0.46 0.39 0.96
Moody's Corporation 1.28 0.94 1.02 0.80 0.93 0.69 0.67 0.57 0.49 1.04
MSCI Inc. 1.06 0.78 0.78 0.65 0.80 0.53 0.52 0.46 0.35 0.90
Nasdaq, Inc. 0.91 0.61 0.64 0.62 0.65 0.48 0.48 0.42 0.25 0.73
PayPal Holdings, Inc. 1.35 0.96 0.94 0.73 1.25 0.64 0.61 0.48 0.56 1.10
S&P Global Inc. 1.17 0.80 0.96 0.73 0.88 0.64 0.61 0.51 0.48 0.95
SEI Investments Co. 1.30 1.00 1.06 0.91 0.92 0.78 0.78 0.67 0.43 1.09
Square, Inc. 1.01 0.87 1.05 0.59 0.95 0.67 0.62 0.46 0.55 1.11
SS&C Technologies Holdings, Inc. 1.23 0.89 0.91 0.73 1.00 0.60 0.60 0.57 0.37 1.09
The Dun & Bradstreet Corporation 1.11 0.80 0.82 0.66 0.84 0.58 0.58 0.50 0.38 0.89
Thomson Reuters Corporation 0.59 0.40 0.45 0.36 0.44 0.31 0.30 0.24 0.20 0.45
Total System Services, Inc. 1.12 0.78 0.76 0.64 0.88 0.54 0.53 0.45 0.34 0.95
Vantiv, Inc. 0.97 0.71 0.64 0.54 0.75 0.50 0.46 0.42 0.30 0.86
VeriFone Systems, Inc. 1.38 1.02 1.11 0.91 1.13 0.71 0.74 0.65 0.52 1.24
Verisk Analytics, Inc. 0.81 0.56 0.57 0.46 0.59 0.40 0.38 0.33 0.28 0.66
Virtu Financial, Inc. 0.41 0.54 0.29 0.38 0.29 0.35 0.33 0.34 0.01 0.48
Visa Inc. 1.12 0.71 0.79 0.64 0.90 0.55 0.53 0.43 0.36 0.89
The Western Union Company 1.09 0.85 0.80 0.64 0.80 0.57 0.56 0.50 0.38 0.89
WEX Inc. 1.36 1.10 1.10 0.87 0.99 0.74 0.74 0.68 0.57 1.13
WisdomTree Investments, Inc. 2.35 1.85 1.96 1.69 1.65 1.41 1.40 1.25 0.93 2.05
Average 1.10 0.84 0.85 0.70 0.84 0.60 0.59 0.54 0.37 0.98
Market indexes