Adoption Intention of Fintech Services for Bank Users - MDPI
16
symmetry S S Article Adoption Intention of Fintech Services for Bank Users: An Empirical Examination with an Extended Technology Acceptance Model Zhongqing Hu 1,2 , Shuai Ding 1,2, *, Shizheng Li 1,2,3, *, Luting Chen 4 and Shanlin Yang 1,2 1 School of Management, Hefei University of Technology, Hefei 23009, China; [email protected] (Z.H.); [email protected] (S.Y.) 2 Key Laboratory of Process Optimization and Intelligent Decision-Making (Ministry of Education), Hefei University of Technology, Hefei 23009, China 3 School of Finance, Anhui University of Finance and Economics, Bengbu 233030, China 4 School of Management, Shanghai University of International Business and Economic, Shanghai 201620, China; [email protected] * Correspondence: [email protected] (S.D.); [email protected] (S.L.) Received: 13 January 2019; Accepted: 21 February 2019; Published: 7 March 2019 Abstract: Along with the development of Fintech, many scholars have studied how information technology is applied to financial services with a focus on extended methods for application. Few scholars have studied the influence mechanism behind the adoption of Fintech services. This paper proposes an improved technology acceptance model (TAM) that incorporates user innovativeness, government support, brand image, and perceived risk as determinants of trust to investigate how users adopt Fintech services. We designed a questionnaire, sent it to active customers of the Hefei Science and Technology Rural Commercial Bank, and obtained 387 eligible responses. We analyzed the data with a structural equation model (SEM) to test the hypotheses, including the relationships of all latent variables. The results reveal that users’ trust in Fintech services has a very significant influence on users’ attitudes for adoption. In addition, perceived ease of use and perceived risk does not affect users’ attitudes toward the adoption regarding Fintech services. This study contributes to the literature of the adoption of Fintech services by providing a more comprehensive view of the determinants of users’ attitudes by combining trust of Fintech services with TAM. Keywords: technology acceptance model; Fintech services; adoption 1. Introduction Fintech is a digital technology with block chain, big data, and intelligent investment consulting at its core and is widely used in the financial field. According to the data of the American consulting firm Accenture, from 2010 to 2016, global Fintech investment increased from 12.2 billion dollars to 153.1 billion dollars, an increase of nearly 12 times. The number of global Fintech companies increased from approximately 800 before April 2015 to more than 2000 in December 2016, with Fintech investment reaching $23.2 billion in 2016, up 21.5 percent year-on-year [1]. From a competitor’s perspective, unlike banks that offer consumers three key financial services (i.e., deposit, payment, and lending), some Fintech companies are more focused on providing customers with a better user experience as a niche. As the traditional financial service company, banks understand the importance of user experiences, and some of them have begun to improve their core competitiveness and market share by acquiring or cooperating with Fintech companies. For example, Banco Bilbao Vizcaya Symmetry 2019, 11, 340; doi:10.3390/sym11030340 www.mdpi.com/journal/symmetry
-
Upload
khangminh22 -
Category
Documents
-
view
5 -
download
0
Transcript of Adoption Intention of Fintech Services for Bank Users - MDPI

symmetryS S
Article
Adoption Intention of Fintech Services for BankUsers: An Empirical Examination with an ExtendedTechnology Acceptance Model
Zhongqing Hu 1,2, Shuai Ding 1,2,*, Shizheng Li 1,2,3,*, Luting Chen 4 and Shanlin Yang 1,2
1 School of Management, Hefei University of Technology, Hefei 23009, China; [email protected] (Z.H.);[email protected] (S.Y.)
2 Key Laboratory of Process Optimization and Intelligent Decision-Making (Ministry of Education),Hefei University of Technology, Hefei 23009, China
3 School of Finance, Anhui University of Finance and Economics, Bengbu 233030, China4 School of Management, Shanghai University of International Business and Economic, Shanghai 201620,
China; [email protected]* Correspondence: [email protected] (S.D.); [email protected] (S.L.)
Received: 13 January 2019; Accepted: 21 February 2019; Published: 7 March 2019�����������������
Abstract: Along with the development of Fintech, many scholars have studied how informationtechnology is applied to financial services with a focus on extended methods for application.Few scholars have studied the influence mechanism behind the adoption of Fintech services.This paper proposes an improved technology acceptance model (TAM) that incorporates userinnovativeness, government support, brand image, and perceived risk as determinants of trustto investigate how users adopt Fintech services. We designed a questionnaire, sent it to activecustomers of the Hefei Science and Technology Rural Commercial Bank, and obtained 387 eligibleresponses. We analyzed the data with a structural equation model (SEM) to test the hypotheses,including the relationships of all latent variables. The results reveal that users’ trust in Fintechservices has a very significant influence on users’ attitudes for adoption. In addition, perceived easeof use and perceived risk does not affect users’ attitudes toward the adoption regarding Fintechservices. This study contributes to the literature of the adoption of Fintech services by providinga more comprehensive view of the determinants of users’ attitudes by combining trust of Fintechservices with TAM.
Keywords: technology acceptance model; Fintech services; adoption
1. Introduction
Fintech is a digital technology with block chain, big data, and intelligent investment consulting atits core and is widely used in the financial field. According to the data of the American consultingfirm Accenture, from 2010 to 2016, global Fintech investment increased from 12.2 billion dollarsto 153.1 billion dollars, an increase of nearly 12 times. The number of global Fintech companiesincreased from approximately 800 before April 2015 to more than 2000 in December 2016, with Fintechinvestment reaching $23.2 billion in 2016, up 21.5 percent year-on-year [1]. From a competitor’sperspective, unlike banks that offer consumers three key financial services (i.e., deposit, payment,and lending), some Fintech companies are more focused on providing customers with a better userexperience as a niche. As the traditional financial service company, banks understand the importanceof user experiences, and some of them have begun to improve their core competitiveness and marketshare by acquiring or cooperating with Fintech companies. For example, Banco Bilbao Vizcaya
Symmetry 2019, 11, 340; doi:10.3390/sym11030340 www.mdpi.com/journal/symmetry

Symmetry 2019, 11, 340 2 of 16
Argentaria has acquired the company Simple that mainly focuses on online banking business in theUnited States and enjoys high user satisfaction [2].
The developmental history of the banking industry has been responsible for most of the innovativedevelopment in the financial field. From the first application of physical media technology containinginformation or value in the early 15th century to the use of simulation technology in the 19th century,the banking field broke through the previous limitations on the use of physical media to enable themarket to move within a regional scope. From the middle of the 20th century to the financial crisisin 2007, the application of digital information and communication technology opened the digitalfinancial technology era, supporting the formation of transnational electronic networks, the launchof interface standards, and the development of standard software. In the digital stage, the spread ofinformation and communication technologies has increased the outsourcing processes and activitiesof banks, but the degree of vertical integration is still very high. In addition, the number of bankemployees keeps increasing, while the number of banking institutions keeps decreasing. Meanwhile,banks spend more on digital information and communication technology than other companies in thefinancial industry. The high investment in information and communication technology is not consistentwith the digital transformation of the banking business process and business model. The inefficiencyinduced by this situation has also led to the development of Fintech banking business as is manifestedcurrently [3].
The purpose of using Fintech for banking is to improve the user experience and banking efficiency.The existing research is mainly about Fintech strategy and risk for banking from the supply side.Zavolokina et al. studied the “peer to peer” collaboration model between Indonesian banks andFintech companies [4]. Chang et al. analyzed how Indonesian banks changed business processes in thecontext of Fintech and competed with Fintech companies. On the demand side, unlike the millennialswho make up the majority of users of Fintech companies, the parents and grandparents of millennialsare the dominant customers of the banks, according to Moody’s [5]. Therefore, we need to considerthe influence of the adoption of Fintech services from the demand side. From a static point of view,studying the impact factors of Fintech adoption by bank users can help provide them with betterservices and strengthen the contact between banks and users. It can provide new insights and a morecomplete understanding of adoption attention for Fintech services [6,7]. From a dynamic point ofview, millennials are currently less financially capable than their elders, thus this generation is notcurrently a major user of banks. However, as time goes on, the financial capacity of millennials willgradually strengthen, and they will become the main users. Therefore, the study of the influencebehind the adoption of Fintech services by bank consumers will help the banks to meet the demand ofthe millennial generation in the future.
Based on the above analysis, this paper studies the influence and relationship of the adoptionbehavior of bank users and conducts in-depth research and discussion on it through a technologyacceptance model (TAM). The innovative contributions of this paper are as follows:
• Most existing research mainly studies the application model from the supply side of Fintechservices to improve the efficiency and user experience of banks—that is to say, scholars’ concernabout how and what kind of Fintech services are provided. Even if someone studies the adoptionproblems, they focus on a specific Fintech service, such as mobile banking or internet bankingservice, but the existing research rarely pays attention to a more empirical extension of previousstudies in TAM applied in Fintech from the demand side.
• This paper comprehensively and concretely analyzes the influencing factors and their relationshipwith the adoption of Fintech services, and it extends the applicability of traditional TAM modelsas we consider more factors influencing the users’ adoption.
• The research results provide valuable information for the adjustment of bank marketing strategiesand the implementation of strategic goals. How to change users’ behavioral intentions throughthe adjustment of influencing factors when providing users with financial and technologicalproducts is of great significance for the development of banks in the digital age.

Symmetry 2019, 11, 340 3 of 16
This paper applies the technology acceptance model to study the influence behind the adoptionof Fintech services by users. The remainder of this paper is organized as follows. In the next section,some relevant literature is reviewed, and a conceptual framework and some hypotheses are introducedin detail, along with some reasons for their adoption. Section 3 introduces the data analysis and results,followed by the discussion and conclusions of this paper in Section 4. Finally, Section 5 concludes withlimitations and suggestions for future work.
2. Literature Review and Conceptual Framework
2.1. Fintech
The correlation of technological development and finance innovation has been extensively studiedfrom different perspectives by domestic and foreign scholars. Since “Financial Deepening” was firstproposed by McKinnon and Shaw in 1973, Sci-tech finance has developed rapidly [8]. Unlike theconcept of providing financial services for scientific and technological enterprises, Fintech can bedefined as some new tools that use emerging information technologies, such as big data, Internet ofThings, and cloud computing, to broaden financial service areas [9]. Keke Gai et al. describedFintech as a financial technology section in one company that would improve service quality andmanagement efficiency by using a new generation of information technology [10]. Therefore, it mightimprove the efficiency and scope of financial services through the application of technology in thebanking domain. Along with the sustainable development of Fintech, there are many technologicalbreakthroughs in this field, such as big data [11], cloud computing [12], Internet of Things [13],and data analytic techniques [14]. Du et al. divided the main issues of security and privacy of Fintechinto four dimensions—data-oriented, facility and equipment, applications, and service models [15].Arner et al. explained the dissimilarities between traditional financial services and Fintech and thatFintech is not a simple combination of information technology and financial services but an applicationof technology to traditional services to broaden their scope [16]. In this paper, Fintech is definedas innovative financial services using new technology tools, such as big data, cloud computing,and mobile technology.
2.2. Hypotheses Development for the Proposed Model
TAM was originally intended to make up for the defects of the theory of reasoned action (TRA)in 1986. It was proposed from the perspective of behavioral science, integrating expectation theoryand self-efficacy theory, and is mainly used to study the behavioral intentions of individuals to usetechnology [17]. The TAM model divides the factors affecting individual behavioral attitudes intoperceived usefulness and perceived ease of use, which have a significant impact on the adoption ofnew technology [18].
Because the TAM does a good job explaining the difference in consumer willingness to adoptinformation technology and can be improved and specified according to the analysis problem,it has become one of the most widely used models in the field of information technology adoptionresearch [19]. For Fintech services, the essence of them is to apply the new generation of informationtechnology tools to financial innovation, thus the TAM has a strong adaptability in this paper.Although the TAM is widely used for technical adoption in areas such as e-commerce mobile payment,the uniqueness of Fintech services (e.g., privacy and security challenges, government encouragement,etc.) results in a significant difference between the TAM and the information technology adoption oftraditional e-commerce in the application process [20].
2.2.1. Perceived Usefulness
In the TAM, perceived usefulness is a factor widely used in the process of information systemadoption and is defined as the degree to which a consumer using this new technology would improvethe work efficiency of that consumer [17]. In this study, perceived usefulness refers to the fact that

Symmetry 2019, 11, 340 4 of 16
users choose to adopt the service if they think the application of Fintech can have a positive impact [21].A large number of empirical studies on the adoption of information technology in the past decade haveshown that perceived usefulness can have a positive impact on users’ intentions [22–25]. Chang et al.regarded Chinese banking institutions as research objects, and the results show that the most importantadvantage of Fintech lies in the in-depth mining of user data and the construction of a user knowledgemap [26]. Carlin et al. analyzed the determinants of millennials’ adoption of Fintech, and the resultsshow that life expectancy and financial knowledge attainment have important influences on thebehavioral intentions of Fintech adoption [27]. Thus, in light of the previous studies, the followinghypothesis was developed:
Hypothesis 1 (H1): Users’ perceived usefulness (PU) has a positive impact on their attitudes (ATT) related tothe adoption of Fintech services.
2.2.2. Perceived Ease of Use
Perceived ease of use is another important factor in the TAM, which is defined as the degreeof effort involved in using this new technology [17]. In this study, perceived ease of use refers tothe degree to which consumers feel relaxed and make efforts in the process of trying to learn touse Fintech services. Fintech services provide better services and customer experiences for bankcustomers, which can well make up for the bank’s business weakness to meet the personalized needsof customers, and Fintech’s ease of use is the core element that determines its adoption by users [28,29].In the research field of banking, many scholars have demonstrated a significant correlation betweenperceived ease of use and new technology adoption attitudes [30,31]. Riquelme et al. consideredthat perceived usefulness significantly affects users’ attitudes and willingness to adopt Fintech whenusers use complex information systems to conduct financial transactions through portable mobiledevices. If users think that Fintech services are convenient, friendly, and easy to operate, then usersare more inclined to adopt them [32]. Taylor et al. compared the TAM, TPB (theory of plannedbehavior), and DTPB (decomposed theory of planned behavior) models during the use of a computerresource center and found that perceived ease-of-use had positive effects on perceived usefulness [33].According to the above analysis, the following hypotheses were developed:
Hypothesis 2 (H2): Users’ perceived ease of use (PEU) has a positive impact on their attitudes (ATT) relatedto the adoption of Fintech services.
Hypothesis 3 (H3): Users’ perceived ease of use (PEU) has a positive impact on perceived usefulness (PU)related to the use of Fintech services.
2.2.3. Attitudes
Attitude refers to the user’s subjective judgments and personal tendencies related to something,and behavior intention is defined as the strength of one’s intention to perform a specific behavior [34].In the study of TAM, it is found that a positive attitude toward new technology is the premise ofintentions to adopt this technology [22,35]. The traditional TAM holds that there is a significantlypositive correlation between users’ attitudes toward a certain technology and their adoption intentions,which has been widely confirmed in the research of the banking field [36–38]. Thus, we posit thefollowing hypothesis:
Hypothesis 4 (H4): Users’ attitudes (ATT) and intentions (INT) toward the adoption of Fintech services for abetter experience are positively correlated.

Symmetry 2019, 11, 340 5 of 16
2.2.4. Trust
Trust has always been a focus of research on the issue of adoption and is often used asanother important basis to attract users besides PU and PEU. In the application scenario of Fintech,the role of trust is more important due to the big and high-dimensional data involved in the service.Therefore, it is of great significance to study how trust affects the attitudes of potential users and theirwillingness to adopt, as well as which factors can affect trust. Trust is an interdisciplinary conceptthat has been studied by scholars in sociology, management, organizational behavior, and otherfields [39–41]. This study believes that trust refers to users’ overall perceived utility of objects.Kesharwani et al. discovered that users’ trust can induce behaviors, and trust is formed by theirinherent characteristics [42]. Due to the inherent characteristics of Fintech, its adoption has certaininherent risks, and researchers have found that trust is closely related to brand image and perceivedrisks [43]. A user’s cognition of bank brands and perception of service risk will have a significantimpact on trust of banks. In addition, many scholars have confirmed that users’ trust of services playsan important role in adoption decision-making in the context of Fintech. In other words, the more theuser trusts the service provider, the more willing the user will be to use the service, and the easier it isto promote behavior [44,45]. Hanafizadeh et al. found some evidence of indirect effects between trustand the adoption of Fintech services [46]. Therefore, we had reasons to make the following hypothesis:
Hypothesis 5 (H5): Users’ trust (TRU) of Fintech services has a significant impact on their attitudes (ATT)toward the adoption of Fintech services.
2.2.5. Brand Image
This paper holds that brand image (BI) is an intangible asset with economic value, which showsits difference with abstract and distinctive identifiable concepts, thus producing a comprehensivereflection of positive effects on users. The brand effect of service providers has an importantinfluence on the provision of reliable services to users, and it plays a positive role in promotingusers’ achievements of their intended purposes [47]. Sang et al. found that one of the reasons foradopting the government administration information system (GAIS) is higher brand image amongpeers [48]. A large number of studies on Fintech show that brand has an important influence on users’perceptions of quality [49], value [50], and their satisfaction [51].
In the context of the application of Fintech, users’ perceptions of the brand has been conceptualizedand seen as a precondition for organizational trust [52]. In the process of receiving Fintech services,users need to provide much private personal information. Semuel et al. proposed that a good brandimage can improve user trust because it effectively reduces risk [53]. According to psychologicalresearch results, a good brand image can generate trust among users [54]. Therefore, brand image isthe guarantee of products and services, which enables users to clearly define the service orientationof the enterprise, helps enterprises and users build a solid relationship, improves user recognitionand satisfaction, and ultimately affects customer recognition and builds trust [55]. Based on the aboveliterature analysis, we made the following hypotheses:
Hypothesis 6 (H6): Brand image (BI) has a significant impact on users’ attitudes (ATT) toward the adoptionof Fintech services.
Hypothesis 7 (H7): Brand image (BI) has a significant impact on users’ trust (TRU) of Fintech services.
2.2.6. Perceived Risk
Perceived risk is a form of lack of trust, and most scholars believe that perceived risk is the mainfactor that negatively affects adoption of technology [42,56]. In this paper, perceived risk refers to

Symmetry 2019, 11, 340 6 of 16
the financial and privacy risk that users perceive when they choose Fintech services. Financial riskrefers to the property damage caused by consumers’ concerns about product yield rate or othercarelessness, and privacy risk refers to the risk that personal data, transaction data, and other privacyinformation are disclosed when consumers choose internet financial products. Khedmatgozar et al.believed that the degree of risk perception is the most important factor affecting the adoption ofe-services [57]. Bansal et al. insisted that users are most worried about the misuse of personalinformation when using Fintech services, which will lead to more serious consequences. Based onthese considerations, perceived risks arising from the use of Fintech can significantly affect users’willingness to use technology for purchase or consumption [58].
Fintech services usually involve technologies such as big data, the Internet of Things, and cloudcomputing, thus there are some potential risks for users in receiving the service [59]. In addition,when banks provide financial services to users through technological means, bank customers usuallyneed to provide their private information to complete the comprehensive evaluation of services,which will reduce users’ trust in services of banks [60]. Kim et al. found that perceived risk wouldaffect users’ trust [61]. Thus, the following hypothesis was developed:
Hypothesis 8 (H8): Perceived risk (PR) will negatively influence users’ attitudes (ATT) toward the adoptionof Fintech services.
Hypothesis 9 (H9): Perceived risk (PR) will negatively influence users’ trust (TRU) of Fintech services.
2.2.7. Government Support
Government support is one of the biggest drivers of Fintech adoption [62]. Because thegovernment has good credibility, it can increase the credibility and reliability of products or servicesby improving the publicity of the application of technology in financial innovation and investingin infrastructure such as communication network construction, thus making Fintech services moreacceptable to potential consumers. Kiwanuka et al. found that government support has a positiveinfluence on technological adoption and continuous use intention, and the research results have arealistic guiding significance for the government to formulate relevant policies [63]. By integratingrelevant antecedents into the TAM model, Marakarkandy et al. helped study the influencing factors ofonline banking adoption, and finally found that government support is crucial to the trust of onlinebanking products [64]. Based on the above literature analysis, we made the following hypotheses:
Hypothesis 10 (H10): Government support (GS) has a significant impact on users’ attitudes (ATT) towardthe adoption of Fintech services.
Hypothesis 11 (H11): Government support (GS) has a significant impact on users’ trust (TRU) ofFintech services.
2.2.8. User Innovativeness
In this paper, user innovativeness is defined as the degree of early adoption of a certain innovationby individuals; that is, the degree of inclination of individuals to try new products, new technologies,or services. When individuals are highly innovative, they can bear the high degree of uncertainty andhave a more positive intention to use the innovation. In other words, they are less likely to perceiverisks and more receptive to technological innovation [65]. Adeiza et al. held that innovation is a basicfeature of human beings, which reflects the degree of interest of users in a new field [66]. In the researchon the adoption behavior of mobile payment users, Kim et al. believes that, since most people haveinsufficient professional knowledge of a wide range of mobile services, their individual innovation
Symmetry 2019, 11, 340 7 of 16
plays an important positive role in their intention of use, which has also been verified by empiricalresearch [67]. Thus, the following hypotheses were developed:
Hypothesis 12 (H12): User innovativeness (UI) has a significant impact on users’ attitudes (ATT) toward theadoption of Fintech services.
Hypothesis 13 (H13): User innovativeness (UI) has a significant impact on users’ trust (TRU) ofFintech services.
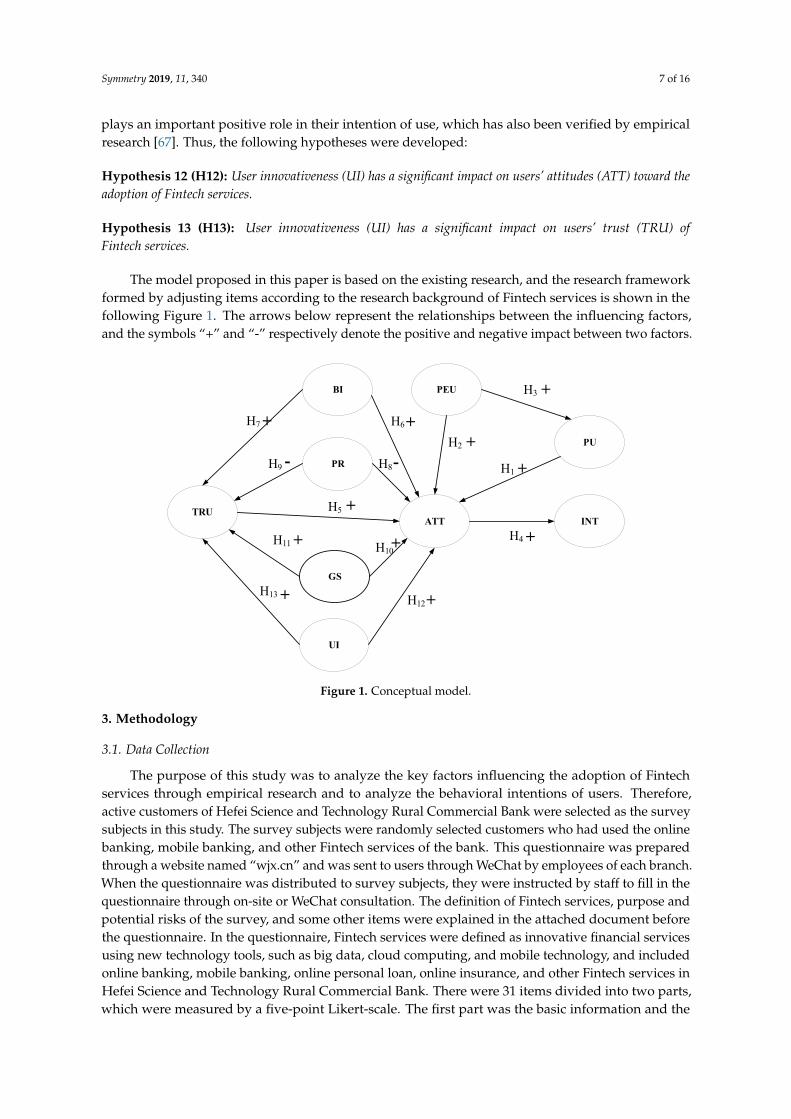
The model proposed in this paper is based on the existing research, and the research frameworkformed by adjusting items according to the research background of Fintech services is shown in thefollowing Figure 1. The arrows below represent the relationships between the influencing factors,and the symbols “+” and “-” respectively denote the positive and negative impact between two factors.Symmetry 2019, 11, x FOR PEER REVIEW 7 of 16
PU
PEU
PR
BI
TRU
GS
UI
ATT INT
H1
H2
H3
H4
H5
H6H7
H8H9
H10H11
H12H13
+
-
+
+
+ +
+
+
+
+
+
+
-
Figure 1. Conceptual model
3. Methodology
3.1. Data Collection
The purpose of this study was to analyze the key factors influencing the adoption of Fintech services through empirical research and to analyze the behavioral intentions of users. Therefore, active customers of Hefei Science and Technology Rural Commercial Bank were selected as the survey subjects in this study. The survey subjects were randomly selected customers who had used the online banking, mobile banking, and other Fintech services of the bank. This questionnaire was prepared through a website named “wjx.cn” and was sent to users through WeChat by employees of each branch. When the questionnaire was distributed to survey subjects, they were instructed by staff to fill in the questionnaire through on-site or WeChat consultation. The definition of Fintech services, purpose and potential risks of the survey, and some other items were explained in the attached document before the questionnaire. In the questionnaire, Fintech services were defined as innovative financial services using new technology tools, such as big data, cloud computing, and mobile technology, and included online banking, mobile banking, online personal loan, online insurance, and other Fintech services in Hefei Science and Technology Rural Commercial Bank. There were 31 items divided into two parts, which were measured by a five-point Likert-scale. The first part was the basic information and the second part was the survey of Fintech services. A total of 587 responses were collected in this study. After preliminary screening, invalid questionnaires with insufficient response times and random filling were rejected, and 387 valid responses were included for an effective response rate of 65.93%.
In this paper, the sample data were analyzed statistically using SmartPLS 3.0. The descriptive statistical results of 387 questionnaires that analyzed the demographic characteristics of the respondents, such as gender, age, education level, monthly disposable income, and the use of Fintech services or products, are shown in Table 1. As for the age distribution, people aged 26-35 years old (56.07%) accounted for the highest proportion, and new technologies and lifestyles are always first accepted by these consumers. Thus, this sampling was reasonable. As for use frequency, frequent users (68.73%) accounted for a relatively high proportion, which indicates that the popularizing rate of Fintech services is relatively high at present, and the study of the factors affecting their adoption is of great practical significance to the successful implementation of Fintech strategies in banks.
Figure 1. Conceptual model.
3. Methodology
3.1. Data Collection
The purpose of this study was to analyze the key factors influencing the adoption of Fintechservices through empirical research and to analyze the behavioral intentions of users. Therefore,active customers of Hefei Science and Technology Rural Commercial Bank were selected as the surveysubjects in this study. The survey subjects were randomly selected customers who had used the onlinebanking, mobile banking, and other Fintech services of the bank. This questionnaire was preparedthrough a website named “wjx.cn” and was sent to users through WeChat by employees of each branch.When the questionnaire was distributed to survey subjects, they were instructed by staff to fill in thequestionnaire through on-site or WeChat consultation. The definition of Fintech services, purpose andpotential risks of the survey, and some other items were explained in the attached document beforethe questionnaire. In the questionnaire, Fintech services were defined as innovative financial servicesusing new technology tools, such as big data, cloud computing, and mobile technology, and includedonline banking, mobile banking, online personal loan, online insurance, and other Fintech services inHefei Science and Technology Rural Commercial Bank. There were 31 items divided into two parts,which were measured by a five-point Likert-scale. The first part was the basic information and the

Symmetry 2019, 11, 340 8 of 16
second part was the survey of Fintech services. A total of 587 responses were collected in this study.After preliminary screening, invalid questionnaires with insufficient response times and random fillingwere rejected, and 387 valid responses were included for an effective response rate of 65.93%.
In this paper, the sample data were analyzed statistically using SmartPLS 3.0. The descriptivestatistical results of 387 questionnaires that analyzed the demographic characteristics of therespondents, such as gender, age, education level, monthly disposable income, and the use of Fintechservices or products, are shown in Table 1. As for the age distribution, people aged 26–35 years old(56.07%) accounted for the highest proportion, and new technologies and lifestyles are always firstaccepted by these consumers. Thus, this sampling was reasonable. As for use frequency, frequent users(68.73%) accounted for a relatively high proportion, which indicates that the popularizing rate ofFintech services is relatively high at present, and the study of the factors affecting their adoption is ofgreat practical significance to the successful implementation of Fintech strategies in banks.
Table 1. Sample characteristics.
Demographic Variable and Category Frequency Percentage
GenderMale 182 47.03
Female 205 52.97
Age
18–25 52 13.44
26–35 217 56.07
36–45 61 15.76
46–55 52 13.44
=56 5 1.29
Employ status
Student 11 2.84
Civil service/institution staff 47 12.14
Business management personnel 64 16.54
Employee 200 51.68
Self-employed 21 5.43
Other 44 11.37
Education
Less than diploma 35 9.04
Diploma 79 20.41
Bachelor 223 57.36
Master or more 51 13.18
Income (¥)
Less than 2000 51 13.18
2000–6000 210 54.26
6001–10000 75 19.38
More than 10000 51 13.18
Fintech service usage
Never 8 2.07
Occasionally 67 17.31
Usually 266 68.73
Frequently in everyday 46 11.89
3.2. Instrument Development
In the design of the questionnaire, this paper made full reference to the problems of domestic andforeign scholars in relevant research and made appropriate expansions and adjustments accordingto the characteristics of Fintech services studied in this paper, as shown in Table 2. PU was adopted

Symmetry 2019, 11, 340 9 of 16
from Lockett et al. and Huh et al. [68,69]; PEU was adopted from Cheng et al. and Wang et al. [70,71];TRU was adopted from Chong et al. and Sanchez et al. [62,72]; BI was adopted from Ha et al.and Ruparelia et al. [73,74]; PR, GS, UI, ATT, and INT were adopted from Marakarkandy et al.,Grabner-Kr et al., Zhang et al., and Patel et al. [19,64,75,76]. The scale consisted of nine latent variablesas external influencing factors, and each variable was composed of two to six measurement variables.The item of each measurement variable was expressed by a five-point Linkert-scale. Respondents wererequired to express their attitudes according to their true meaning. The options were strongly disagree,disagree, uncertain, agree, and strongly agree. In this paper, the structural equation model wasused for data processing and analysis. SEM is a statistical method to deal with the relationshipbetween multiple variables based on the covariance matrix of variables by multiple regression analysis,path analysis, and confirmatory factor analysis. This method can explain the causal relationshipbetween independent variables and dependent variables and is widely used in the fields of economicpsychology and behavioral science. PLS is a parameter estimation method of SEM, which does notneed a sufficient theoretical basis to support validation and explanatory research and is suitablefor exploratory research and model tests [77]. Therefore, this paper used SmartPLS3.0 to study theparameter estimation of SEM.
Table 2. Measurement instruments.
Latent Variables Measurement Items Sources
Perceived usefulness (PU)
Using Fintech can meet my service needs.Lockett et al. [68] andHuh et al. [69]
Fintech services can save time.Fintech services can improve efficiency.Overall, Fintech services are useful to me.
Perceived ease of use (PEU)It is easy to use Fintech services. Cheng et al. [71] and
Wang et al. [70]I think the operation interface of Fintech is friendly andunderstandable.It is easy to have the equipment to use Fintech services(cellphone, APP, WIFI, et al.).
Trust (TRU)I believe Fintech services keep my personal information safe. Chong et al. [62] and
Sanchez et al. [72]Overall I believe Fintech services are trustable.
Brand image (BI)This bank can provide good services and products. Ha et al. [73] and
Ruparelia et al. [74]I think I prefer to accept the services provided by familiarbrands.The bank has a good reputation.
Perceived risk (PR)I believe that the money is easy to be stolen by using Fintechservices.
Marakarkandy et al.[64] and Grabner et al.[75]I believe personal privacy will be disclosed by using Fintech
services.Overall, I feel Fintech services are risky.
Government support (GS)I believe the government supports and improve the use ofFintech services. Marakarkandy et al.
[64]I believe the government has introduced favorable legislationand regulations for Fintech services.I believe the government is active in setting up all kinds ofinfrastructure such as the infrastructure telecom network,which has a positive role in promoting Fintech services.
User innovativeness (UI)When I hear about a new product, I look for ways to try it Zhang et al. [19]Among my peers, I am usually the first one to try a newproduct.
Attitude (ATT)I believe using Fintech services is a good idea.
Grabner et al. [75]Using Fintech services is a pleasant experience.I am interested in Fintech services.
Intention (INT)If I have used Fintech services, I am willing to continue usingthem. Marakarkandy et al.
[64] and Patel et al. [76]I would like to use Fintech services soon.I will recommend Fintech services to my friends.

Symmetry 2019, 11, 340 10 of 16
4. Results
4.1. Scale Validity and Reliability
Confirmatory factor analysis was used to test the model, including tests of internal consistencyreliability, convergent validity, and discriminant validity. Reliability refers to the degree of consistencyor stability of the measurement results, which reflects reliability of the questionnaire items. In thispaper, composite reliability (CR) and Cronbach’s alpha were used to test the internal consistency ofthe data. As suggested by Fornell and Larcker, the CR of the sample is required to be larger than 0.7,and Cronbach’s alpha to be larger than 0.8 [78]. As shown in Table 3, the CR and Cronbach’s alpha ofall latent variables were all larger than the critical values, which indicates that the model has a goodinternal consistency.
Table 3. Reliability and validity measures.
Constructs Item λ AVE CR Cronbach’s Alpha
PU
PU1 0.725
0.680 0.894 0.840PU2 0.878PU3 0.801PU4 0.883
PEUPEU1 0.860
0.755 0.902 0.837PEU2 0.886PEU3 0.859
BIBI1 0.906
0.812 0.928 0.884BI2 0.904BI3 0.893
PRPR1 0.809
0.767 0.908 0.851PR2 0.928PR3 0.886
GSGS1 0.840
0.713 0.882 0.799GS2 0.809GS3 0.883
UIUI1 0.922
0.844 0.915 0.815UI2 0.916
TRUTRU1 0.889
0.827 0.905 0.793TRU2 0.930
ATTATT1 0.914
0.830 0.936 0.897ATT2 0.902ATT3 0.916
INTINT1 0.884
0.737 0.894 0.822INT2 0.816INT3 0.874
λ, Standardized Factor Loadings; CR, composite reliability; AVE, average variance extracted.
Validity means the degree to which the model fits the survey data, including convergent validityand discriminant validity. The convergent validity reflects the correlation degree of multiple indicatorsfor a variable, which is measured by the average variance extracted (AVE) [79] of the latent variable,the CR [80], and the loading of corresponding measurable variables [81]. AVE values of the sampleare required to be larger than 0.5, and the loadings of measurable variable to be larger than 0.7.Then, as shown in Table 3, all the evidence below supports the convergent validity of all constructs.Discriminant validity refers to there being no correlation between each variable; that is to say,the measures of each variable can be distinguished from others. It is supported if the AVE is greaterthan the square of interscale correlation in this model. Then, as shown in Table 4, the AVE was greater

Symmetry 2019, 11, 340 11 of 16
than the squared interscale correlation in all cases, which indicates that the discriminant validity ofeach variable is good.
Table 4. Discriminant validity of constructs.
Construct PU PEU BI PR GS UI TRU ATT INT
PU 0.824 - - - - - - - -PEU 0.741 0.869 - - - - - - -
BI 0.425 0.421 0.901 - - - - - -PR −0.205 −0.168 −0.244 0.876 - - - - -GS 0.504 0.508 0.502 −0.184 0.844 - - - -UI 0.294 0.355 0.41 −0.136 0.507 0.919 - - -
TRU 0.453 0.49 0.541 −0.369 0.567 0.486 0.909 - -ATT 0.583 0.58 0.569 −0.221 0.71 0.617 0.607 0.911 -INT 0.518 0.547 0.582 −0.234 0.591 0.552 0.572 0.793 0.858
4.2. Structural Equation Model: Hypotheses Testing
Structural Equation Modeling is a statistical method to explore variable relations by using thecovariance matrix of the variables. In addition, it is an important tool for multivariate data analysis.After the validity and reliability analysis, this section conducted an empirical study of the adoptionmodel of Fintech services based on the analysis of the sample data and used the sample data andstructural equation model to test the hypothesis. Standardized path coefficient (β) and t value wereobtained by SmartPLS 3.0 using SEM model, which were used to test the hypotheses proposed inthis paper. In general, if t > 1.96, the coefficient test is significant at the p < 0.05 confidence level.If t > 2.58, the coefficient test is significant at the p < 0.01 confidence level. If t > 3.1, the coefficienttest is significant at the p < 0.001 confidence level. The test results of the hypotheses are shown inFigure 2 below.
Symmetry 2019, 11, x FOR PEER REVIEW 11 of 16
Construct PU PEU BI PR GS UI TRU ATT INT PU 0.824 - - - - - - - -
PEU 0.741 0.869 - - - - - - - BI 0.425 0.421 0.901 - - - - - - PR −0.205 −0.168 −0.244 0.876 - - - - - GS 0.504 0.508 0.502 −0.184 0.844 - - - - UI 0.294 0.355 0.41 −0.136 0.507 0.919 - - -
TRU 0.453 0.49 0.541 −0.369 0.567 0.486 0.909 - - ATT 0.583 0.58 0.569 −0.221 0.71 0.617 0.607 0.911 - INT 0.518 0.547 0.582 −0.234 0.591 0.552 0.572 0.793 0.858
4.2. Structural Equation Model: Hypotheses Testing
Structural Equation Modeling is a statistical method to explore variable relations by using the covariance matrix of the variables. In addition, it is an important tool for multivariate data analysis. After the validity and reliability analysis, this section conducted an empirical study of the adoption model of Fintech services based on the analysis of the sample data and used the sample data and structural equation model to test the hypothesis. Standardized path coefficient (β) and t value were obtained by SmartPLS 3.0 using SEM model, which were used to test the hypotheses proposed in this paper. In general, if t > 1.96, the coefficient test is significant at the p < 0.05 confidence level. If t > 2.58, the coefficient test is significant at the p < 0.01 confidence level. If t > 3.1, the coefficient test is significant at the p < 0.001 confidence level. The test results of the hypotheses are shown in Figure 2 below.
PU
PEU
PR
BI
TRU
GS
UI
ATT INT
0.178***
(0.086)NS
0.741***
0.793***
0.101**
0.132**
(-0.006)NS
0.315***0.295***
0.270***0.200***
-0.025***
0.256***
Figure 2. Structural results of the proposed model (*, p < 0.05; **, p < 0.01; ***, p < 0.001).
As shown in the above figure, the results show that PU (β = 0.178, t = 3.339), BI (β = 0.132, t = 2.852), TRU (β = 0.101, t = 2.122), GS (β = 0.315, t = 5.584), and UI (β = 0.270, t = 6.322) all had a positive significant impact on ATT. As the threshold of t value for hypothesis testing [17], their t values were larger than 1.96, thus hypotheses H1, H6, H5, H10, and H12 were supported. BI (β = 0.256, t = 4.925), PR (β = -0.025, t = 6.251), GS (β = 0.295, t = 5.625), and UI (β = 0.200, t = 4.669) had significant influences on TRU, and their t values were all greater than 1.96, thus supporting H7, H9, H11, and H13. The t value of PEU for PU was greater than 1.96, and the former (β = 0.741, t = 18.397) had a significant impact on the latter, thus hypothesis H3 was supported. TRU played a significant intermediary role in the relationship between BI, GS, and UI. Since ATT (β = 0.793, t = 25.410) had a significant effect on
Figure 2. Structural results of the proposed model (*, p < 0.05; **, p < 0.01; ***, p < 0.001).
As shown in the above figure, the results show that PU (β = 0.178, t = 3.339), BI (β = 0.132,t = 2.852), TRU (β = 0.101, t = 2.122), GS (β = 0.315, t = 5.584), and UI (β = 0.270, t = 6.322) all had apositive significant impact on ATT. As the threshold of t value for hypothesis testing [17], their t valueswere larger than 1.96, thus hypotheses H1, H6, H5, H10, and H12 were supported. BI (β = 0.256,

Symmetry 2019, 11, 340 12 of 16
t = 4.925), PR (β = −0.025, t = 6.251), GS (β = 0.295, t = 5.625), and UI (β = 0.200, t = 4.669) had significantinfluences on TRU, and their t values were all greater than 1.96, thus supporting H7, H9, H11, and H13.The t value of PEU for PU was greater than 1.96, and the former (β = 0.741, t = 18.397) had a significantimpact on the latter, thus hypothesis H3 was supported. TRU played a significant intermediary rolein the relationship between BI, GS, and UI. Since ATT (β = 0.793, t = 25.410) had a significant effecton INT, the t value of ATT for INT was greater than 1.96, indicating the significance of H4. However,PEU (β = 0.086, t = 1.306) and PR (β = −0.006, t = 0.204) had no significant influences on ATT, and thet value of PEU and PR for ATT was less than 1.96, thus hypotheses H2 and H8 were not supported.
5. Discussion and Conclusions
This paper discusses the potential reasons for the adoption and use of Fintech services by bankusers and how the Fintech services affects the interaction and behavior between consumers andbanking institutions. Consistent with the research results of Sikdar et al., this paper finds that PU,trust, and UI have positive influences on INT for the adoption of Fintech services [56]. However,unlike the research of Marakarkandy et al., the research results of this paper show that GS is animportant predictive factor for the adoption of Fintech services [64]. According to the research resultsof Kesharwani et al., this paper also provides additional evidence that PEU, PR, and the impact ofservice reception are not significantly correlated [42]. In addition, the significant relationship betweenBI and ATT is consistent with the findings of Zhang et al.
Based on the TAM, this paper constructs a user adoption model for Fintech services, which mainlyconsiders the role of TRU and its determinants and uses empirical data for verification. The hypothesistest results of this model show that the popularity of the internet and intelligent terminal equipmentmay have an effect on users’ demands for Fintech services. In the interaction of users and banks,risk, privacy, usefulness, perceived ease of use, user innovativeness, and government support areplaying increasingly important roles. Banks need to determine Fintech service strategies based onuser preferences and factors affecting service adoption. Through empirical research in this paper, it isfound that:
First, brand image, government support, and user innovation have significantly positive impactson the adoption of Fintech services. These impacts are not only direct effects but can also have indirectimpacts on trust in services, while trust will have a positive impact on the adoption of the service.
Second, perceived risk can affect users’ attitudes through their trust of Fintech services.The mechanism is that perceived risk has a significantly negative impact on trust, while trust activelyguides users to engage with Fintech services. This shows that users’ perceived risk of Fintech serviceshas a substantial role in reducing the level of trust in services. Financial institutions providing Fintechservices need to adopt measures to reduce the perceived risk to users to strengthen trust in productsand services, thereby increasing users’ willingness to employ the services.
Third, perceived ease of use has no significant impact on a user’s adoption of Fintech services.This is similar to the results of previous studies. Some scholars believe that in the early stage oftechnology or service adoption, perceived ease of use often does not have a significant impacton adoption behavior because users are unfamiliar with it or have no opportunity to use it [82].This reflects the fact that current Chinese development of Fintech services is still in its primary stage,and many bank users have no experience with actually using Fintech services.
In summary, consumers use a new technology or service under the influence of governmentsupport, user innovativeness, and brand image. Then, they weigh the benefits and potential risks,which ultimately affect their adoption attitude. Therefore, our findings provide a consumer assessmentand empirical framework for banks to adopt new, user-centered services.
6. Limitations and Future Directions
By integrating the trust of Fintech services into the TAM, this paper attempts to use the elements ofservice trust to explain and predict the adoption of Fintech services by bank users. A more refined and

Symmetry 2019, 11, 340 13 of 16
comprehensive view of the determinants of behavioral intention is provided, and finally, the modelis validated by empirical research. However, the influencing factors of our research have certainlimitations. We have not studied psychological factors, such as social influences. At the same time,we should also analyze risks from multiple dimensions, such as financial risks, privacy risks, and cybersecurity risks. A comprehensive and effective assessment will help us better analyze the adoptionmodel of Fintech services.
Author Contributions: Conceptualization, Z.H. and S.Y.; methodology, Z.H. and S.D.; software, S.L. and L.C.;investigation, S.L. and L.C.; resources, Z.H.; data curation, Z.H. and S.L.; writing—original draft preparation,Z.H.; writing—review and editing, S.L. and S.D.; supervision, S.L.; project administration, Z.H., S.D. and S.L.;funding acquisition, S.D. and S.L.
Funding: This work is fully supported by the National Natural Science Foundation of China [Nos. 91846107,71571058, 71690235 and 71472001], and Anhui Provincial Science and Technology Major Project [Nos. 16030801121and 17030801001]. and Key Project of Humanities and Social Sciences in Colleges and Universities of AnhuiProvince under Grant No. SK2017A0443.
Acknowledgments: This work is fully supported by the National Natural Science Foundation of China[Nos. 91846107, 71571058, 71690235 and 71472001], and Anhui Provincial Science and Technology Major Project[Nos. 16030801121 and 17030801001], and Key Project of Humanities and Social Sciences in Colleges andUniversities of Anhui Province under Grant No. SK2017A0443.
Conflicts of Interest: The authors declare no conflict of interest.
References
1. Gabor, D.; Brooks, S. The Digital Revolution in Financial Inclusion: International Development in the FintechEra. New Polit. Econ. 2017, 22, 1–14. [CrossRef]
2. Leong, C.; Tan, B.; Xiao, X.; Tan, F.T.C.; Sun, Y. Nurturing a Fintech Ecosystem: The Case of a Youth MicroloanStartup in China. Int. J. Inf. Manag. 2017, 37, 92–97. [CrossRef]
3. Alt, R.; Beck, R.; Smits, M.T. Fintech and the Transformation of the Financial Industry. Electron. Mark. 2018,28, 235–243. [CrossRef]
4. Zavolokina, L.; Dolata, M.; Schwabe, G. The Fintech Phenomenon: Antecedents of Financial InnovationPerceived by the Popular Press. Financ. Innov. 2016, 2, 16. [CrossRef]
5. Chang, Y.; Wong, S.; Lee, H.; Jeong, S. What Motivates Chinese Consumers to Adopt Fintech Services: A RegulatoryFocus Theory; ACM: New York, NY, USA, 2016.
6. Priem, R.L.; Li, S.; Carr, J.C. Insights and new directions from demand-side approaches to technologyinnovation, entrepreneurship, and strategic management research. J. Manag. 2012, 38, 346–374. [CrossRef]
7. Priem, R.L.; Swink, M. A demand-side perspective on supply chain management. J. Supply Chain Manag.2012, 48, 7–13. [CrossRef]
8. Hermes, N.; Lensink, R. Does Financial Liberalization Influence Saving, Investment and Economic Growth?Evidence from 25 Emerging Market Economies, 1973; Palgrave Macmillan: Basingstoke, UK, 2008; pp. 47–57.
9. Nakashima, T. Creating Credit by Making Use of Mobility with Fintech and IoT. IATSS Res. 2018, 42, 61–66.[CrossRef]
10. Gai, K.; Qiu, M.; Sun, X. A Survey on Fintech. J. Netw. Comput. Appl. 2018, 103, 262–273. [CrossRef]11. Yin, H.; Gai, K. An Empirical Study on Preprocessing High-Dimensional Class-Imbalanced Data for
Classification. In Proceedings of the IEEE International Conference on High PERFORMANCE Computingand Communications, New York, NY, USA, 24–26 August 2015.
12. Gai, K.; Qiu, M.; Zhao, H. Energy-Aware Task Assignment for Mobile Cyber-Enabled Applications inHeterogeneous Cloud Computing. J. Parallel Distrib. Comput. 2017, 111, 25–38. [CrossRef]
13. Cuomo, S.; Somma, V.D.; Sica, F. An Application of the One-Factor Hullwhite Model in an Iot FinancialScenario. Sustain. Cities Soc. 2018, 38, 18–20. [CrossRef]
14. Mishra, S. Financial Management and Forecasting Using Business Intelligence and Big Data Analytic Tools.Int. J. Financ. Eng. 2018, 6, 10–31. [CrossRef]
15. Du, W.D.; Pan, S.L.; Leidner, D.E.; Ying, W. Affordances, Experimentation and Actualization of Fintech:A Blockchain Implementation Study. J. Strateg. Inf. Syst. 2018. [CrossRef]

Symmetry 2019, 11, 340 14 of 16
16. Buckley, R.; Arner, D.; Barberis, J. The Evolution of Fintech: A New Post-Crisis Paradigm? Soc. Sci. Electron.Publ. 2015, 47, 1271–1319.
17. Davis, F.D. A Technology Acceptance Model for Empirically Testing New End-User Information Systems:Theory and Results. Ph.D. Thesis, Massachusetts Institute of Technology, Cambridge, MA, USA, 1986.
18. Venkatesh, V.; Bala, H. Technology Acceptance Model 3 and a Research Agenda on Interventions. Decis. Sci.2010, 39, 273–315. [CrossRef]
19. Zhang, T.; Lu, C.; Kizildag, M. Banking “On-the-Go”: Examining Consumers’ Adoption of Mobile BankingServices. Int. J. Qual. Serv. Sci. 2018, 10, 279–295. [CrossRef]
20. Stewart, H.; Jürjens, J. Data Security and Consumer Trust in Fintech Innovation in Germany. Inf. Comput.Secur. 2018, 26, 109–128. [CrossRef]
21. Ryu, H. What Makes Users Willing or Hesitant to Use Fintech?: The Moderating Effect of User Type.Ind. Manag. Data Syst. 2018, 118, 541–569. [CrossRef]
22. Ng, A.W.; Kwok, B.K.B. Emergence of Fintech and Cybersecurity in a Global Financial Centre:Strategic Approach by a Regulator. J. Financ. Regul. Compliance 2017, 25, 422–434. [CrossRef]
23. Barakat, A.; Hussainey, K. Bank Governance, Regulation, Supervision, and Risk Reporting: Evidence fromOperational Risk Disclosures in European Banks. Int. Rev. Financ. Anal. 2013, 30, 254–273. [CrossRef]
24. Featherman, M.S.; Pavlou, P.A. Predicting E-Services Adoption: A Perceived Risk Facets Perspective. Int. J.Hum. -Comput. Stud. 2003, 59, 451–474. [CrossRef]
25. Hong, W.; Zhu, K. Migrating to Internet-Based E-Commerce: Factors Affecting E-Commerce Adoption andMigration at the Firm Level. Inf. Manag. 2006, 43, 204–221. [CrossRef]
26. Chang, Y.; Wong, S.F.; Lee, H.; Jeong, S.P. What Motivates Chinese Consumers to Adopt Fintech Services:A Regulatory Focus Theory. In Proceedings of the International Conference on Electronic Commerce:E-Commerce in Smart Connected World, Suwon, Korea, 17–19 August 2016.
27. Carlin, B.; Olafsson, A.; Pagel, M. Technology Adoption across Generations: Financial Fitness in the InformationAge; Working Paper Series; National Bureau of Economic Research: Cambridge, UK, 2017.
28. Chau, V.S.; Ngai, L.W.L.C. The Youth Market for Internet Banking Services: Perceptions, Attitude andBehaviour. J. Serv. Mark. 2013, 39, 42–60.
29. Abbad, M.M. E-Banking in Jordan. Behav. Inf. Technol. 2013, 32, 681–694. [CrossRef]30. Akturan, U.; Tezcan, N. Mobile Banking Adoption of the Youth Market. Mark. Intell. Plan. 2012, 30, 444–459.
[CrossRef]31. Szopinski, T.S. Factors Affecting the Adoption of Online Banking in Poland. J. Bus. Res. 2016, 69, 4763–4768.
[CrossRef]32. Riquelme, H.E.; Rios, R.E. The Moderating Effect of Gender in the Adoption of Mobile Banking. Int. J. Bank
Mark. 2010, 28, 328–341. [CrossRef]33. Taylor, S.; Todd, P.A. Understanding Information Technology Usage: A Test of Competing Models. Inf. Syst.
Res. 1995, 6, 144–176. [CrossRef]34. Zhao, A.L.; Koenig-Lewis, N.; Hammer-Lloyd, S.; Ward, P. Adoption of Internet Banking Services in China:
Is It All About Trust? Int. J. Bank Mark. 2010, 28, 26.35. Gupta, A.; Arora, N. Consumer Adoption of M-Banking: A Behavioral Reasoning Theory Perspective. Int. J.
Bank Mark. 2017, 35, 733–747. [CrossRef]36. Shaikh, A.A.; Karjaluoto, H. Mobile Banking Adoption: A Literature Review. Telemat. Inform. 2015, 32,
129–142. [CrossRef]37. Hsu, C.L.; Wang, C.F.; Lin, J.C.C. Investigating Customer Adoption Behaviours in Mobile Financial Services.
Int. J. Mob. Commun. 2011, 9, 477–494. [CrossRef]38. Aboelmaged, M.G.; Gebba, T.R. Mobile Banking Adoption: An Examination of Technology Acceptance
Model and Theory of Planned Behavior. Int. J. Bus. Res. Dev. 2013, 2, 35–50. [CrossRef]39. Mcknight, D.H.; Chervany, N.L. What Trust Means in E-Commerce Customer Relationships:
An Interdisciplinary Conceptual Typology. Int. J. Electron. Commer. 2001, 6, 35–59. [CrossRef]40. Lewis, J.D.; Weigert, A. Trust as a Social Reality. Soc. Forces 1985, 63, 967–985. [CrossRef]41. Lee, M.K.O.; Turban, E. A Trust Model for Consumer Internet Shopping. Int. J. Electron. Commer. 2001, 6,
75–91. [CrossRef]42. Kesharwani, A.; Singh Bisht, S. The Impact of Trust and Perceived Risk on Internet Banking Adoption in
India. Int. J. Bank Mark. 2012, 30, 303–322. [CrossRef]

Symmetry 2019, 11, 340 15 of 16
43. Malaquias, R.F.; Hwang, Y. An Empirical Study on Trust in Mobile Banking: A Developing CountryPerspective. Comput. Hum. Behav. 2016, 54, 453–461. [CrossRef]
44. Koksal, M.H. The Intentions of Lebanese Consumers to Adopt Mobile Banking. Int. J. Bank Mark. 2016, 34,327–346. [CrossRef]
45. Basak, S.K.; Govender, D.W.; Govender, I. Examining the Impact of Privacy, Security, and Trust on the Tamand Ttf Models for E-Commerce Consumers: A Pilot Study. In Proceedings of the 14th Annual Conferenceon Privacy, Security and Trust (PST), Auckland, New Zealand, 12–14 December 2016.
46. Hanafizadeh, P.; Behboudi, M.; Abedini Koshksaray, A. Mobile-Banking Adoption by Iranian Bank Clients.Telemat. Inform. 2014, 31, 62–78. [CrossRef]
47. Park, E.; Kim, H.; Ohm, J.Y. Understanding Driver Adoption of Car Navigation Systems Using the ExtendedTechnology Acceptance Model. Behav. Inf. Technol. 2015, 34, 741–751. [CrossRef]
48. Sang, S.; Lee, J.D.; Lee, J. E-Government Adoption in Cambodia: A Partial Least Squares Approach.Transform. Gov. People Process Policy 2010, 4, 138–157. [CrossRef]
49. Riyadh, A.N.; Bunker, D.; Rabhi, F. Barriers to E-Finance Adoption in Small and Medium Sized Enterprises(Smes) in Bangladesh. In Proceedings of the 5th Conference on Qualitative Research in IT, Brisbane, Australia,17 November 2010.
50. Shapiro, S.L.; Reams, L.; So, K.K.F. Is It Worth the Price? The Role of Perceived Financial Risk, Identification,and Perceived Value in Purchasing Pay-Per-View Broadcasts of Combat Sports. Sport Manag. Rev. 2018.[CrossRef]
51. Saleem, Z.; Rashid, K. Relationship between Customer Satisfaction and Mobile Banking Adoption in Pakistan.Int. J. Trade Econ. Financ. 2014, 2, 537–543. [CrossRef]
52. Srivastava, S.C.; Chandra, S.; Theng, Y.L. Evaluating the Role of Trust in Consumer Adoption of MobilePayment Systems: An Empirical Analysis. Commun. Assoc. Inf. Syst. 2010, 27, 561.
53. Semuel, H.; Lianto, A.S. Analisis E-Wom, Brand Image, Brand Trust Dan Minat Beli Produk Smartphone DiSurabaya. J. Manaj. Pemasar. 2014, 8, 7–54.
54. Lee, K.C.; Chung, N. Understanding Factors Affecting Trust in and Satisfaction with Mobile Banking inKorea: A Modified Delone and Mclean’s Model Perspective. Interact. Comput. 2009, 21, 385–392. [CrossRef]
55. Siamagka, N.T.; Christodoulides, G.; Michaelidou, N.; Valvi, A. Determinants of Social Media Adoption byB2B Organizations. Ind. Mark. Manag. 2015, 51, 89–99. [CrossRef]
56. Sikdar, P.; Kumar, A.; Makkad, M. Online Banking Adoption: A Factor Validation and Satisfaction CausationStudy in the Context of Indian Banking Customers. Int. J. Bank Mark. 2015, 33, 760–785. [CrossRef]
57. Khedmatgozar, H.R.; Shahnazi, A. The Role of Dimensions of Perceived Risk in Adoption of CorporateInternet Banking by Customers in Iran. Electron. Commer. Res. 2018, 18, 389–412. [CrossRef]
58. Bansal, S.K.; Bansal, A.; Blake, M.B. Trust-Based Dynamic Web Service Composition Using Social NetworkAnalysis. In Proceedings of the IEEE International Workshop on Business Applications of Social NetworkAnalysis, Bangalore, India, 15 December 2010.
59. Zhou, T.; Lu, Y.; Wang, B. Integrating Ttf and Utaut to Explain Mobile Banking User Adoption. Comput. Hum.Behav. 2010, 26, 760–767. [CrossRef]
60. Malaquias, F.F.D.O.; Hwang, Y. An Empirical Investigation on Disclosure about Mobile Banking on BankWebsites. Online Inf. Rev. 2018, 42, 615–629. [CrossRef]
61. Kim, K.; Prabhakar, B. Initial Trust, Perceived Risk, and the Adoption of Internet Banking. In Proceedings ofthe Twenty First International Conference on Information Systems, Brisbane, Australia, 10–13 December 2000.
62. Chong, A.Y.L.; Ooi, K.B.; Lin, B.; Tan, B.I. Online Banking Adoption: An Empirical Analysis. Int. J. BankMark. 2010, 28, 267–287. [CrossRef]
63. Kiwanuka, A. Acceptance Process: The Missing Link between Utaut and Diffusion of Innovation Theory.J. Theor. Appl. Inf. Technol. 2015, 46, 11–16.
64. Marakarkandy, B.; Yajnik, N.; Dasgupta, C. Enabling Internet Banking Adoption: An Empirical Examinationwith an Augmented Technology Acceptance Model (Tam). J. Enterp. Inf. Manag. 2017, 30, 263–294. [CrossRef]
65. Leicht, T.; Chtourou, A.; Youssef, K.B. Consumer Innovativeness and Intentioned Autonomous Car Adoption.J. High Technol. Manag. Res. 2018, 29, 1–11. [CrossRef]
66. Adeiza, A.; Ismail, N.A.; Malek, M.A. An Empirical Examination of the Major Relationship Factors AffectingFranchisees’ Overall Satisfaction and Intention to Stay. Iran. J. Manag. Stud. 2017, 10, 21–40.

Symmetry 2019, 11, 340 16 of 16
67. Kim, C.; Mirusmonov, M.; Lee, I. An Empirical Examination of Factors Influencing the Intention to UseMobile Payment. Comput. Hum. Behav. 2010, 26, 310–322. [CrossRef]
68. Lockett, A.; Littler, D. The Adoption of Direct Banking Services. J. Mark. Manag. 1997, 13, 791–811. [CrossRef]69. Huh, H.J.; Kim, T.; Law, R. A Comparison of Competing Theoretical Models for Understanding Acceptance
Behavior of Information Systems in Upscale Hotels. Int. J. Hosp. Manag. 2009, 28, 121–134. [CrossRef]70. Wang, Y.S.; Wang, Y.M.; Lin, H.H.; Tang, T. Determinants of User Acceptance of Internet Banking:
An Empirical Study. Manag. Sci. Lett. 2014, 4, 501–519. [CrossRef]71. Cheng, T.C.E.; Lam, D.Y.C.; Yeung, A.C.L. Adoption of Internet Banking: An Empirical Study in Hong Kong.
Decis. Support Syst. 2007, 42, 1558–1572. [CrossRef]72. Sánchez-Torres, J.A.; Canada, F.A.; Sandoval, A.V.; Alzate, J.S. E-Banking in Colombia: Factors Favouring its
Acceptance, Online Trust and Government Support. Int. J. Bank Mark. 2018, 36, 170–183. [CrossRef]73. Ha, H. Factors Influencing Consumer Perceptions of Brand Trust Online. J. Prod. Brand Manag. 2004, 13,
329–342. [CrossRef]74. Ruparelia, N.; White, L.; Hughes, K. Drivers of Brand Trust in Internet Retailing. J. Prod. Brand Manag. 2010,
19, 250–260. [CrossRef]75. Grabner-Kr Uter, S.; Faullant, R. Consumer Acceptance of Internet Banking: The Influence of Internet Trust.
Int. J. Bank Mark. 2008, 26, 483–504. [CrossRef]76. Patel, K.J.; Patel, H.J. Adoption of Internet Banking Services in Gujarat. Int. J. Bank Mark. 2018, 36, 147–169.
[CrossRef]77. Poolthong, Y.; Mandhachitara, R. Customer expectations of CSR, perceived service quality and brand effect
in Thai retail banking. Int. J. Bank Mark. 2009, 27, 408–427. [CrossRef]78. Fornell, C.; Larcker, D.F. Evaluating Structural Equation Models with Unobservable Variables and
Measurement Error. J. Mark. Res. 1981, 18, 39–50. [CrossRef]79. Ruvio, A.; Shoham, A.; Brencic, M.M. Consumers’ Need for Uniqueness: Short-Form Scale Development
and Cross-Cultural Validation. Int. Mark. Rev. 2008, 25, 33–53. [CrossRef]80. Chin, W.W. Commentary: Issues and Opinion on Structural Equation Modeling. Mis Q. 1998, 22, 7–16.81. Bagozzi, R.P.; Phillips, L.W. Assessing Construct Validity in Organizational Research. Adm. Sci. Q. 1991, 36,
421–458. [CrossRef]82. Davis, F.D. Perceived Usefulness, Perceived Ease of Use, and User Acceptance of Information Technology.
Mis Q. 1989, 13, 319–340. [CrossRef]
© 2019 by the authors. Licensee MDPI, Basel, Switzerland. This article is an open accessarticle distributed under the terms and conditions of the Creative Commons Attribution(CC BY) license (http://creativecommons.org/licenses/by/4.0/).