
The ROI of omni-channel digital banking - FinTech Futures
21
/ 1 The ROI of omni-channel digital banking Backbase presents
-
Upload
khangminh22 -
Category
Documents
-
view
6 -
download
0
Transcript of The ROI of omni-channel digital banking - FinTech Futures

/ 1
The ROI of omni-channel digital banking
Backbase presents

/ 3/ 2
Contents
Why start a conversation on the value of digital banking?
What this whitepaper offers you
The omni-channel customer experience
is more relevant than ever
Better understanding promotes action
Banks are leaving money on the table
Meet our banks
What is your retail customer worth to you?
The back-of-the-envelope method
A more detailed approach
The value of onboarding and origination
The value of increases in conversion
Sidebar: Why do new customers
churn at higher rates?
The value of higher engagement
Sidebar: Attrition and Hidden
Defection hurt customer value.
Sidebar: Engagement builds
customer intimacy
The costs of onboarding
The value of speed
The costs of everyday service The costs of routine service interactions
The costs of systems maintenance
Sidebar: Platforms are paramount
The digital-first banking platform: Making it happenReferencesBackbase named leader by analystsAbout Backbase
5
5
5
6
6
7
99
11
1313
15
16
17
19
20
23
2727
30
31
35384041

/ 5/ 4
Why start a conversation on the value of digital banking?
What this whitepaper offers youIn this paper we intend to move away from the feature show that so often dominates the conversation on digital banking. We would like to raise awareness of the value that digital banking can bring to your organization by illustrating the impact of some of the most salient value drivers. Through simple quantitative models this paper aims to explicitly show the value banks can derive from digital banking initiatives. Of course, it cannot provide definitive answers specific to a particular bank, as different countries and market segments face different economic challenges. It is however, a great starting point for anyone wishing to build an internal business case for investments in the banking customer experience. We are happy to start a conversation with you on the value of digital banking.
The omni-channel customer experience is more relevant than everOver the past decade customers’ expectations of digital banking have rapidly changed. Digital banking was perceived as a modern ‘nice-to-have’ a decade
ago, but its acceptance came about quickly. Online retailers, streaming music, taxi hailing apps, and instant messaging have all contributed to the expectation of instant digital services. Presently, customers not only expect to interact with their bank online and via mobile, they increasingly expect to complete all banking tasks online.
Where does this leave banks? The service level they provided yesterday no longer meets customers’ expectations today. Banks need to step up and make banking easier, more available and more personal to please customers and retain their business.
Central to meeting customers’ expectations is the idea of providing an omni-channel customer experience for digital banking. Banking does not take place in a vacuum. Customers demand service that is available at all times and on any device they may have at hand. For shopping, communications, music, and travel this is already a reality.
/ 7/ 6
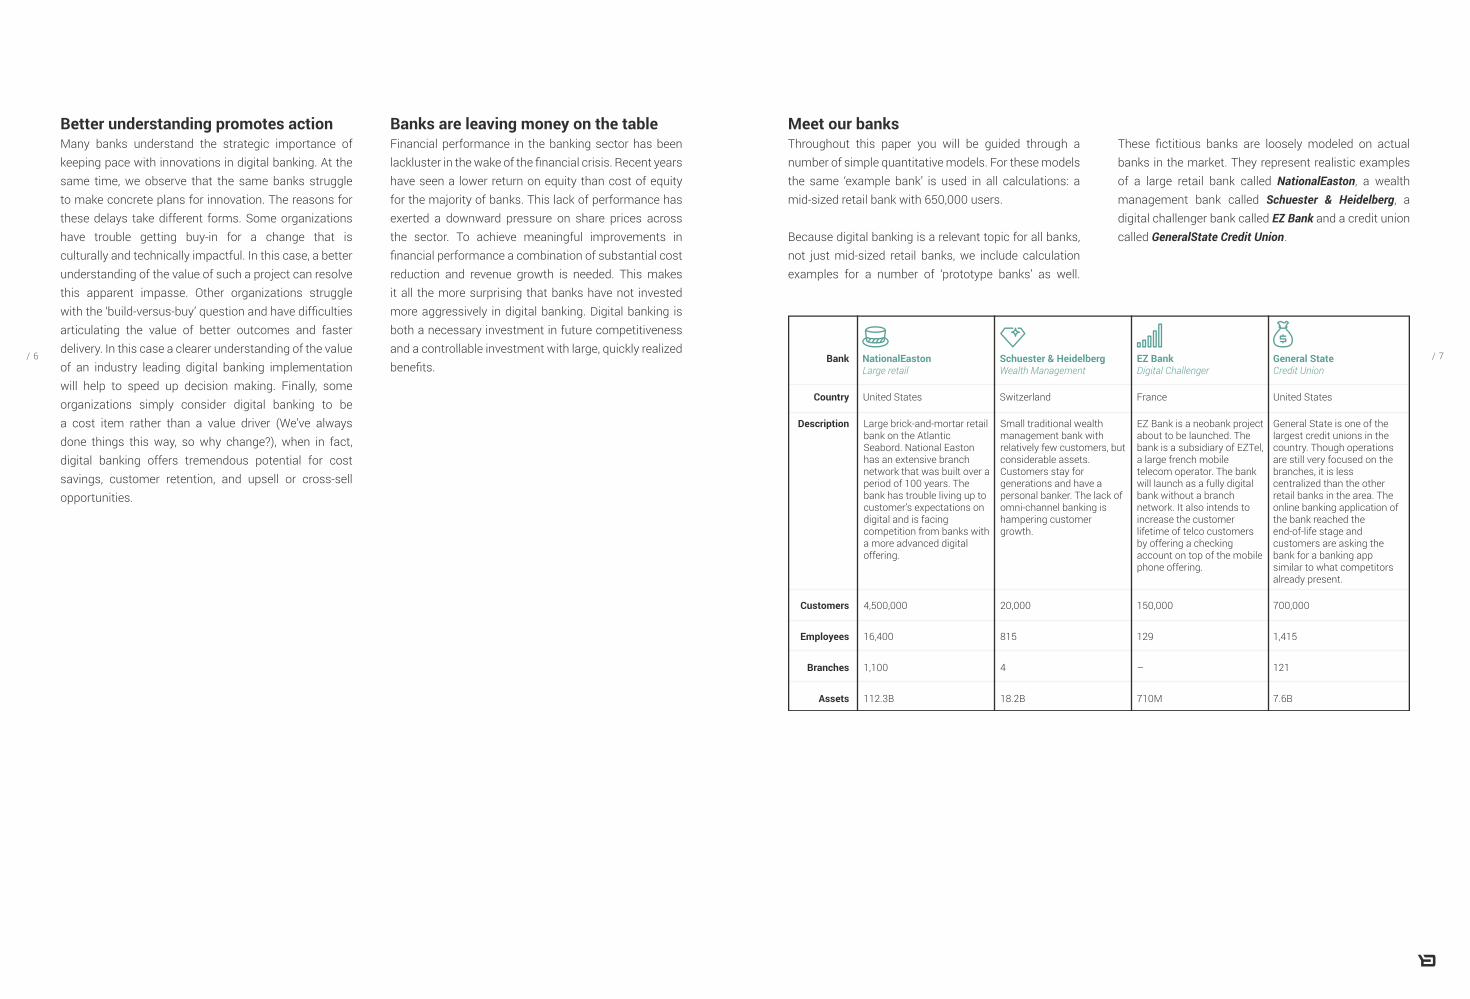
Better understanding promotes actionMany banks understand the strategic importance of keeping pace with innovations in digital banking. At the same time, we observe that the same banks struggle to make concrete plans for innovation. The reasons for these delays take different forms. Some organizations have trouble getting buy-in for a change that is culturally and technically impactful. In this case, a better understanding of the value of such a project can resolve this apparent impasse. Other organizations struggle with the ‘build-versus-buy’ question and have difficulties articulating the value of better outcomes and faster delivery. In this case a clearer understanding of the value of an industry leading digital banking implementation will help to speed up decision making. Finally, some organizations simply consider digital banking to be a cost item rather than a value driver (We’ve always done things this way, so why change?), when in fact, digital banking offers tremendous potential for cost savings, customer retention, and upsell or cross-sell opportunities.
Banks are leaving money on the tableFinancial performance in the banking sector has been lackluster in the wake of the financial crisis. Recent years have seen a lower return on equity than cost of equity for the majority of banks. This lack of performance has exerted a downward pressure on share prices across the sector. To achieve meaningful improvements in financial performance a combination of substantial cost reduction and revenue growth is needed. This makes it all the more surprising that banks have not invested more aggressively in digital banking. Digital banking is both a necessary investment in future competitiveness and a controllable investment with large, quickly realized benefits.
Customers
Description
Country
Bank
United States
4,500,000
16,400
1,100
112.3B
20,000
815
4
18.2B
150,000
129
–
710M
700,000
1,415
121
7.6B
Switzerland France United States
NationalEastonLarge retail
Schuester & HeidelbergWealth Management
EZ BankDigital Challenger
General StateCredit Union
Employees
Branches
Assets
Large brick-and-mortar retail bank on the Atlantic Seabord. National Easton has an extensive branch network that was built over a period of 100 years. The bank has trouble living up to customer’s expectations on digital and is facing competition from banks with a more advanced digital offering.
Small traditional wealth management bank with relatively few customers, but considerable assets. Customers stay for generations and have a personal banker. The lack of omni-channel banking is hampering customer growth.
EZ Bank is a neobank project about to be launched. The bank is a subsidiary of EZTel, a large french mobile telecom operator. The bank will launch as a fully digital bank without a branch network. It also intends to increase the customer lifetime of telco customers by offering a checking account on top of the mobile phone offering.
General State is one of the largest credit unions in the country. Though operations are still very focused on the branches, it is less centralized than the other retail banks in the area. The online banking application of the bank reached the end-of-life stage and customers are asking the bank for a banking app similar to what competitors already present.
Meet our banksThroughout this paper you will be guided through a number of simple quantitative models. For these models the same ‘example bank’ is used in all calculations: a mid-sized retail bank with 650,000 users.
Because digital banking is a relevant topic for all banks, not just mid-sized retail banks, we include calculation examples for a number of ‘prototype banks’ as well.
These fictitious banks are loosely modeled on actual banks in the market. They represent realistic examples of a large retail bank called NationalEaston, a wealth management bank called Schuester & Heidelberg, a digital challenger bank called EZ Bank and a credit union called GeneralState Credit Union.

/ 9/ 8
What is your retail customer worth to you?
Banks create value through the services they offer to companies and individual customers. The simplest way to think about growing revenues in banking is to add customers or to increase banks’ share-of-wallet with the customer. But, before we do that, let’s consider what the individual retail customer is actually worth. This really helps to put into perspective the cost savings and revenue gains of a digital banking project: once you know what a customer is worth you can think about how many new customers a project can add per year.
The back-of-the-envelope methodTo start simple, let’s consider a quick and easy way to estimate what a customer is worth to the bank. Firstly, divide customers’ deposits by the number of customers the bank has. This gives the average deposits per customer, and such underlying data should be readily available. Subsequently, multiply the average deposits
per customer by the net interest margin to arrive at the average interest income per customer. The implicit assumption here is that when the bank gains customers, it will convert the deposits of these customers into loans as effectively as it has done before. Finally, add the average fee income per customer to arrive at the yearly revenue per customer. This yearly revenue value per customer can be converted into the customer lifetime value (expressed in revenue) by dividing by the churn rate. The table 1 guides you through the calculations. For our example bank of 650,000 retail customers the average customer yields about $890 in revenue per year. In table 2 the customer value for the prototype bank is calculated. Clearly, there are large differences. Wealth management banks generate over 10x as much revenue from a single customer than retail banks, and for digital challengers the reverse is true.

/ 11/ 10
1_Calculation table for the back-of-the envelope method
2_Example of calculation for prototype banks
Number of customers
Total deposit of customers
Average deposits
Net interest margin
Average interest income
Average fee income
Customer value
Churn
Customer lifetime value
Item
4,500,000
85,000,000,000
18,889
3.2%
604
272
876
6%
14,607
20,000
12,000,000,000
600,000
2.1%
12,600
11,340
23,940
3%
798,000
150,000
684,000,000
4,560
1.3%
59
9
68
7%
974
700,000
7,000,000,000
10,000
2.5%
250
100
350
3%
11,667
NE S&H EZ GS
A Number of customers 650,000 Customer
B Total deposit of customers 17,134,000,000 –
C Average deposits B / A
C x D
E + F
G / H
26,360 Customer
D Net interest margin 2.5% Customer
E Average interest income 659
F Average fee income 230 Customer
G Customer value 889 –
H Churn 5% Industry Average
I Customer lifetime value 17,780 –
Item Calculation Example Bank Source
A Number of customers 650,000 Customer
B Revenue split by product and penetration
ProductB1: Penetration
B2: Average Size
B2: Spread Revenue/ year
1 - Mortgage2 - Home equity loan3 - Home equity line of credit
Car loanStudent loanCredit card
n - Unsecured loan
2.5%2.5%
15.0%12.0%
5.0%5.0%5.0%
175,00020,00025,00028,00047,00016,000
5,000
3.5%6.0%3.5%3.5%5.5%
10.0%7.0%
99,531,25019,500,00085,312,50076,730,06384,012,50052,000,00011,375,000
428,461,313∑ (A x B1n x B2n x B3n)
C Average NII per customer B / A
C x D
C + E
F / G
659 –
–
Customer
D Fee income ratio 35% Customer
E Fee income per customer 231
F Total income per customer 890
Industry averageG Churn 5%
–
H Customer lifetime value 17,798 –
I Weighted average value 1 product 1,401.13 –
Item Calculation Example Bank Source
1-n
3_Calculation table for detailed approach
A more detailed approach of customer valueWith a product-based estimate of customer value, we can generate even more insights. By considering the penetration, size, and spread of the various loan products in the bank we can estimate not only the value of the customer, but also which products contribute most. This type of analysis highlights, as an example, how improvements in onboarding and origination for mortgages will be more impactful than for unsecured personal loans.
The calculation is very straightforward. For each loan product, the number of customers with that product is multiplied by the average product size and the spread of the product. This gives you the revenues by product. From the resulting total revenue, the net interest income per customer is calculated. The remaining calculations are similar to the earlier back-of-the-envelope method
3.

/ 13/ 12
The value of onboarding and origination
The value of increases in conversionOne of the advantages of digital onboarding relative to physical onboarding is the visibility companies can create in their onboarding funnel. What do we mean by this? In e-commerce it is completely normal to analyze the revenue of a webstore in terms of traffic to the website, time spent on the site, the volume of product baskets created, and the percentage of product baskets ordered and paid for. To the average e-commerce professional this is a completely standard way of looking at performance. It creates a lot of insight and control over the process: bottlenecks are easily identified, and improvements are easily tested and implemented.
The same cannot be said for physical onboarding. You may know how many people come into your branch offices per week. You will probably know what these customers require. However, you have limited understanding of what happened before that customer walked into the branch, as you only see the end of the customer journey. Between the advertising spend and the physical transaction, there is limited understanding and influence.
Even though there is limited visibility, it is not hard to think of a few compelling reasons why people fail to become your customer, when they need to go to a branch office to do so:
• Firstly, there is effort: If signing-up for a bank account cannot be completed digitally and in one session, the prospective customer must plan next steps and make time to follow-up later.
• Secondly, there is purchase intent: when an application is started, the prospective customer is ready to open the account. If there is a delay he or she might reconsider or open an account with a competitor.
• Lastly, there is opportunity: most banks have opening hours from 09:00-18:00 on weekdays, and perhaps also Saturday mornings. Most customers work full-time jobs and hate to sacrifice their family time during the weekend.

/ 15/ 14
Taking all of this into account it’s easy to see why digital onboarding can increase the conversion rate of onboarding processes. Let’s consider the value of a marginal improvement in onboarding: our example bank needs to successfully onboard 52,000 customers to achieve a growth of 3%. This means that at the end of the year, there must be 52,000 people left at the bottom of the onboarding funnel. How many people entered at the top of the funnel to start the onboarding process, and what is the drop-off?
Typically, digital onboarding flows have a drop-off of 50% [1]. On top of that new customers churn at a much higher rate than customers with longer tenure, at 10-20% over the first year [See page 19: Why do new customers churn at higher rates?]. This means that to arrive at 52,000 new customers there needs to be an inflow in the onboarding process of 116,000 customers (116,000 x (1 - 50%) x (1 - 10%)).
What would be the value of a single percentage point improvement in the onboarding process? In terms of customers if would be 1,600 customers (116,000 x (1 - 49%) x (1 - 9%)). With a yearly revenue of USD 890 per customer this represents USD 1.45M per year… for every percent of improvement! 45
Typically, a modern industry leading digital banking implementation does not just improve the conversion by 1%, but in the range of 10 - 15% in year 1. The improvements are attributable to a better customer interface, faster performance, retargeting of incompletely onboarded customers, and of course straight-through-processing.
A End of year ‘net new’ customers 52,000 Cost of onboarding
B Year 1 churn 10% Industry average
C Onboarded customers before churn A / (1 - B)
C / (1 - D)
E x (1 - F)
B - 1%
D - 1%
G x (1 - H)
57,778 –
D Typical onboarding leakage 50% Industry average
E Customers who started onboarding 115,556
F 1% improvement on leakage 49% Assumption
G Onboarded customers before churn 58,993 –
H 1% improvement on churn 9% Assumption
I End of the year ‘net new’ customers 53,629 –
I - A
J x K
J Additional customers 1,629 –
K Customer value per year 890 Value of customer
L Revenue increase per year 1,449,931 –
–
Item Calculation Example Bank Source
4_Calculation table for increases in conversion
Why do new customers churn at higher rates?
Your newest customers are your least loyal customers. Churn is not uniform across all cohorts. The customers
who have been with your bank for longer are more loyal. There are a couple of reasons for this. Customers
with longer tenure tend to have more products with you and so they are less inclined to leave. Leaving
would mean changing a lot of financial arrangements at once. Additionally, customers who have longer
tenure are familiar with the products and procedures of the bank. They don’t need to spend a lot of mental
energy getting things done. This affords a level of convenience.
Conversely, new customers are completely unfamiliar with the basics of your bank and have to figure this
out as they go along. On top of that new customers have often just given up on their former bank. Whatever
the reason was that they left, they are, ipso facto, disloyal customers who need to be won over.
5_Calculation table for increases in conversion for prototype banks
360,000
6%
382,979
50%
765,957
49%
390,638
5%
371,106
1,000
3%
1,031
50%
2,062
49%
1,052
2%
1,031
54,000
7%
58,065
20%
72,581
19%
58,790
6%
55,263
42,000
43,299
50%
86,598
49%
44,165
2%
43,282
11,106 31 1,263 1,282
876 23,940 68 350
9,734,128 730,540 86,095 448,577
End of year ‘net new’ customers
Year 1 churn
Onboarded customers before churn
Typical onboarding leakage
Customers who started onboarding
1% improvement on leakage
Onboarded customers before churn
1% improvement on churn
End of the year ‘net new’ customers
Additional customers
Customer value per year
Revenue increase per year
Item NE S&H EZ GS

/ 17/ 16
The value of higher engagementCustomer acquisition is not complete once people sign-up for a checking account. On the contrary, it is just the start. Customers only become profitable once they buy additional products from the bank, such as mortgages, personal loans and credit cards. Banks compete with each other to become the primary banking relationship for customers. The checking account is merely a foot in the door.
On average consumers have about 5 to 7 banking products, but not all these products are bought from a single financial institution (that is rarely the case). However, the more engaged customers are with their bank, the more likely it is that they will have more products from that bank. In other words, engagement correlates with share-of-wallet.
A large-scale questionnaire from The Financial Brand [2] illustrates this for digital engagement. Customers who are highly digitally engaged with their bank have more than 4 products with their bank. Compare this to the digitally disengaged customers who have only 3
products on average and it becomes clear that digital engagement promotes share-of-wallet.6
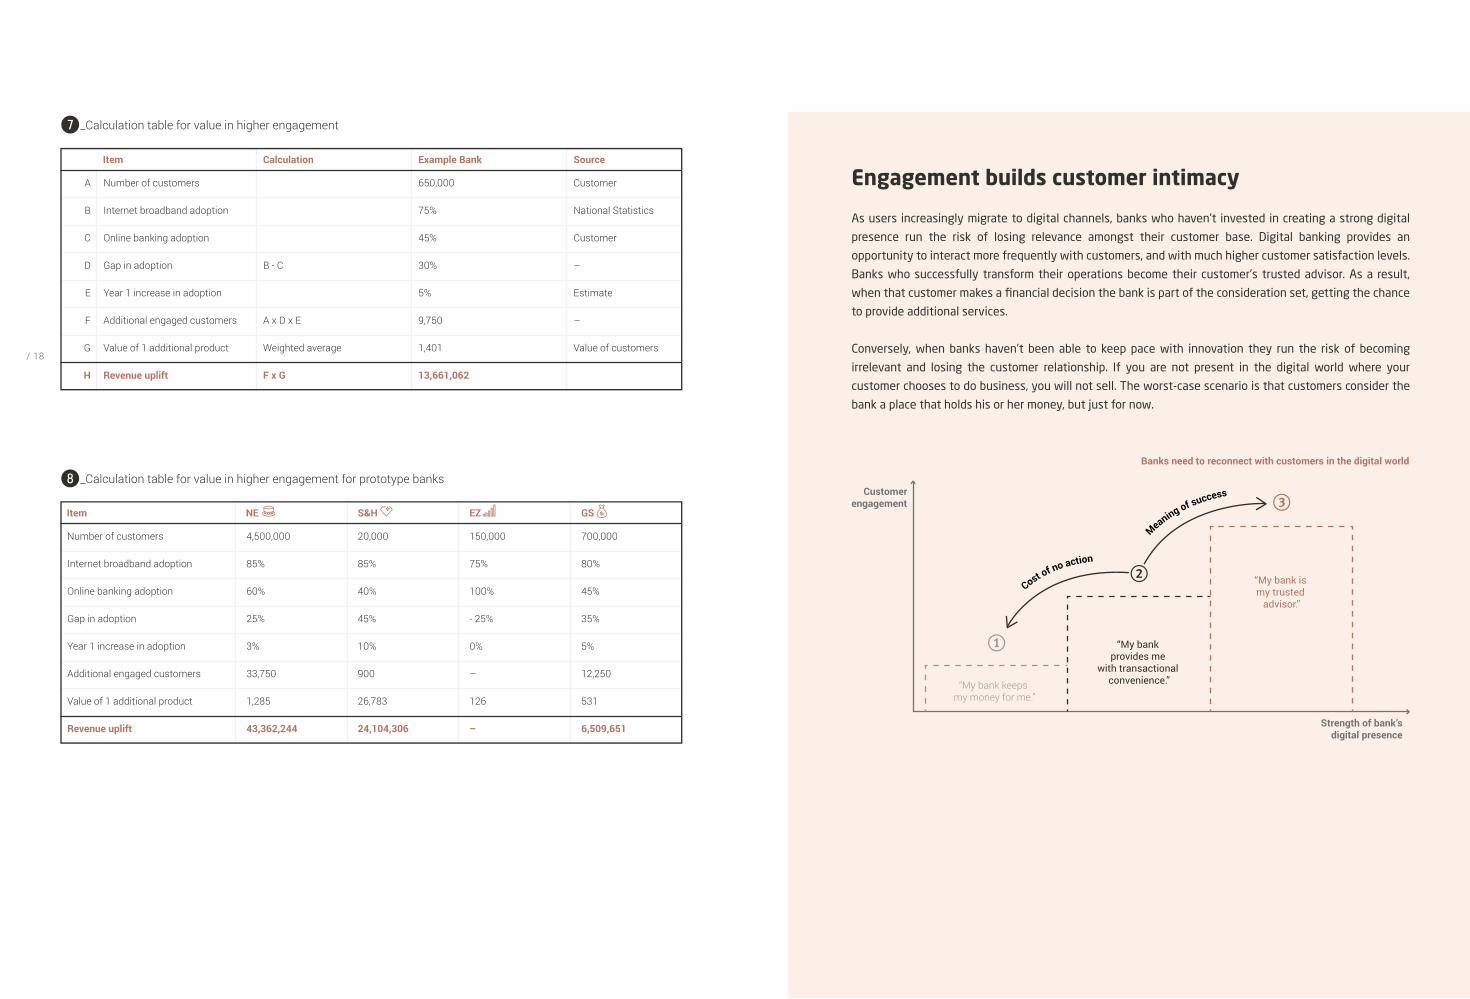
How digitally engaged are your customers? How much room for improvement is there? Let’s make an estimate for our example bank. National statistics for the US suggest that at least 75% of customers have access to the internet, but only 45% of customers use online banking. This represents a gap of at least 30%. That gap of 30% represents 195,000 customers. If we could increase the digital engagement of 5% of this group and sell one additional product via digital channels, what revenue would this represent? One additional product has an estimated value of $1,400 per year. Selling one additional product to 9,750 customers yields $13.6M.78
Digital banking doesn’t only increase the likelihood that people will sign-up for an account with your bank. Increased engagement due to digital banking also promotes share-of- wallet.
Highly digitally engaged 4.4
Digitally engaged
Less digitally engaged
Digitally disengaged
3.8
3.2
2.7
6_Average number of products with main bank by level of digital engagement
Attrition and Hidden Defection hurt customer value
All banks work hard to grow their customer numbers. When growth levels disappoint, the underlying causes
are not always apparent. One of the more visible drivers is increased attrition: when customers leave the
bank to begin a primary banking relationship elsewhere alarm bells should go off. However, there is also
a second form of attrition, which is more insidious: hidden defection. When a bank’s relationship with
its customers isn’t strong enough, competition creeps in. Banks don’t necessarily lose these customers
completely, but they will not buy a second, third or fourth product from the bank. Instead they move to
competing institutions and the primary bank loses an opportunity to grow share of wallet.
Account
Customer 1
Customer 2
Customer 4
Customer 3
MortgageCard Loan
Attrition Hidden defection
Product purchases lost due to hidden defection Clients lost due to attrition
/ 19/ 18
A Number of customers 650,000 Customer
B Internet broadband adoption 75% National Statistics
C Online banking adoption
B - C
A x D x E
F x G
Weighted average
45% Customer
D Gap in adoption 30% –
EstimateE Year 1 increase in adoption 5%
F Additional engaged customers 9,750 –
G Value of 1 additional product 1,401 Value of customers
H Revenue uplift 13,661,062
Item Calculation Example Bank Source
7_Calculation table for value in higher engagement
8_Calculation table for value in higher engagement for prototype banks
Number of customers
Internet broadband adoption
Online banking adoption
Gap in adoption
Year 1 increase in adoption
Additional engaged customers
Value of 1 additional product
Revenue uplift
Item
4,500,000
85%
60%
25%
3%
33,750
1,285
43,362,244
20,000
85%
40%
45%
10%
900
26,783
24,104,306
150,000
75%
100%
- 25%
0%
–
126
–
700,000
80%
45%
35%
5%
12,250
531
6,509,651
NE S&H EZ GS
Engagement builds customer intimacy
As users increasingly migrate to digital channels, banks who haven’t invested in creating a strong digital
presence run the risk of losing relevance amongst their customer base. Digital banking provides an
opportunity to interact more frequently with customers, and with much higher customer satisfaction levels.
Banks who successfully transform their operations become their customer’s trusted advisor. As a result,
when that customer makes a financial decision the bank is part of the consideration set, getting the chance
to provide additional services.
Conversely, when banks haven’t been able to keep pace with innovation they run the risk of becoming
irrelevant and losing the customer relationship. If you are not present in the digital world where your
customer chooses to do business, you will not sell. The worst-case scenario is that customers consider the
bank a place that holds his or her money, but just for now.
Customerengagement
2
1
3
Strength of bank’s digital presence
Banks need to reconnect with customers in the digital world
“My bank keeps my money for me.”
“My bank provides me
with transactional convenience.”
“My bank is my trusted
advisor.”
Meaning of success
Cost of no action

/ 21/ 20
The costs of onboarding Customer onboarding remains the most important customer facing activity, regardless whether you are a brick-and-mortar bank or a fully digital bank. You cannot grow deposits or write loans without reaching new customers. Every bank in the world knows this, and as a result a large portion of operational expenses is dedicated to branch offices, back office processes, IT, cards, direct mail, checkbooks, marketing, and other standard expenses related to onboarding. McKinsey estimates that these costs add up to $300 per customer for customers who open a new checking account [3].
For a lot of banks this is an investment that will only pay off after new customers start generating revenue by taking a loan or generating enough fee income on, e.g., a new credit card. Customers who are not buying additional products from the bank remain unprofitable. This means that the bank needs to reduce onboarding costs in order to make a profit on more of their customers (banks that tried to increase fees instead dealt with severe criticism from customers).
One way of reducing onboarding costs is to take away the need for a branch visit and digitize onboarding completely. This model was first popularized by direct banks such as ING Direct. The onboarding cost for these direct banks is estimated by McKinsey at $100 per customer. A $200 per customer cost saving!
Furthermore, fully digital banks that have neither a front office nor a back office have almost negligible costs when it comes to onboarding.9
For banks with a branch network the first step to save costs is to make onboarding independent from the branch, or any other physical interaction. What could banks save if they would reach the level of cost of a typical direct bank? Let’s do the math: If we consider a medium-sized bank with 650,000 customers that has a net growth in customers of 3% per year that growth alone represents 19,500 new customers. Additionally, replacing yearly churn of 5% adds another 32,500 customers to onboard. In total this makes 52,000 customers. The onboarding for these customers would traditionally cost $300 per person, but would be reduced to $100 per person. The resulting cost savings of $200 per person for 52,000 new customers amounts to $10.4M per year.
Even if adoption of digital onboarding is not immediate, the cost savings are very attractive. One look at the income statement of a direct or fully digital bank confirms this of course. In fact, we are only expressing in numbers what most bankers already know: digital onboarding is a big value driver. To see how your costs could be reduced, please take a look at the calculation tables q and w.
9_Onboarding costs estimated by bank’s business model
Traditional bank 300
Direct bank
Digital challenger
110
5
q_Calculation table for cost savings from digital onboarding processes
w_Calculation table for cost savings from digital onboarding processes for prototype banks
A Number of customers with a current account 650,000 Customer
B Percent churn per year 5% Industry average
C Percent growth per year (net)
B + C
D x A
F - G
H x E
3% Customer
D Percent customers to onboard 8% –
E Customers to onboard 52,000
F Cost of onboarding - traditional 300 McKinsey
G Cost of onboarding - direct 100 McKinsey
H Difference in onboarding cost 200 –
I Cost savings 10,400,000 –
I x (1 - J)
J Discount for time-to-value year 1 30% Backbase analysis
K Value 7,280,000 –
–
Item Calculation Example Bank Source
4,500,000
6%
2%
8%
360,000
300
100
200
72,000,000
20,000
3%
2%
5%
1,000
300
100
200
200,000
–
–
–
–
–
–
–
–
–
700,000
3%
3%
6%
42,000
300
100
200
8,400,000
30% 30% – 30%
50,400,000 140,000 – 5,880,000
Number of customers with a current account
Percent churn per year
Percent growth per year (net)
Percent customers to onboard
Customers to onboard
Cost of onboarding - traditional
Cost of onboarding - direct
Difference in onboarding cost
Cost savings
Discount for time-to-value year 1
Value
Item NE S&H EZ GS

/ 23/ 22
The value of fast implementationIn most digital transformation projects there is a moment when a decision is made to either build or buy a new solution. This can often be a real dilemma. Most banks have a lot of IT staff who could work on a digital banking project, but the project would take longer to complete due to the lack of experience. A commercial digital banking software solution is usually much faster to implement. Not only do most capabilities come ready made, the vendors employ domain specialists who can deliver compelling solutions faster.
Let’s consider what the value of on-time project delivery is, from the perspective of customer acquisition. Leaving cost aside for a moment, what extra revenue could you make in a medium-sized retail bank by realizing an improvement in onboarding conversion? Earlier we showed that for our calculation example a 1% improvement in conversion would yield 1,600 new customers a year. Let’s assume an increase of 10% is realised and that 16,000 new customers are onboarded yearly as the result of a successful project. When each customer yields $890 a year in net interest income and
fee income, this would represent over $14M in revenue. As these customers are brought in gradually over the year however, the value is actually only half that, or over $7M in revenue. This is shown in the diagram below where the surface area of the whole triangle represents the revenue of on-time delivery. e
Now consider a delay of 6 months. In this case only half the customers are onboarded for the year because in the first half of the year the project has not been completed yet. On top of that new customers do not generate the previously mentioned $890. Only half the revenue per customer is realized as lending starts later and fee income for the first 6 months is lost. In the diagram below the dark area shows the revenue made when project delivery is delayed by 6 months. The orange area shows the revenue made in case of on-time delivery. In this case on time delivery is worth an additional $5.4M. The tables on page 25 show the calculation of time-to-market, for the example below and for our prototype banks.r
Customers
0
10,000
5,000
15,000
126 Months
$7.2M
$1.8M
*Revenue per customer $890/year
Gain 16k customers in year 1
6 months delay
e_The value of a 6-month delay in deployment of the example bank results in a loss of $5.4M in revenue.
Onboarding is a rate-limiting factor
Unless your digital onboarding is designed to be omni-channel and completely frictionless from the ground
up, it is likely that you will experience 50% leakage. Onboarding customers is crucial to grow and maintain
deposits. Moreover, it’s a precursor to the steps customers take in purchasing additional products, which
make them more valuable to the bank. In short: you cannot grow share-of-wallet with people who are not
your customers.
Improvements in onboarding, therefore, also improve origination downstream. Onboarding is one of the key
activities a bank must perform well to sustain itself in a digital world.
Don’t allow digital onboarding to be rate limiting to growth
e.g. Mortgage
OriginationHigh value products
Customers
e.g. Personal loan
OriginationLow value products
CustomersCustomers
OnboardingFor accounts
CustomersCustomers

/ 25/ 24
Project delivery on time, at the start of the year
A Number of customers gained due to 10% onboarding improvement 16,293 Value of conservation
B Customer value for 12 months
(A x B) / 2
A / 2
B / 2
(D x E) / 2
C - F
890 Value of customer
C Revenue gained starting on time (surface area triangle) 7,249,565 –
Project delivery delayed by 6 months
D Number of customers gained due to 10% onboarding improvement 8,147 –
E Customer value for 6 months 445 –
F Revenue gained at 6 month delay (surface area triangle) 1,812,391 –
G Revenue lost due to 6 month delay 5,437,174 –
Item Calculation Example Bank Source
111,064
876
48,670,638
55,532
438
12,167,660
36,502,979
305
23,940
3,652,701
153
11,970
913,175
2,739,526
12,629
68
430,473
6,315
34
107,618
322,855
12,816
350
2,242,887
6,408
175
560,722
1,682,165
Project delivery on time, at the start of the year
Number of customers gained due to 10% onboarding improvement
Customer value for 12 months
Revenue gained starting on time (surface area triangle)
Project delivery delayed by 6 months
Number of customers gained due to 10% onboarding improvement
Customer value for 6 months
Revenue gained at 6 month delay (surface area triangle)
Revenue lost due to 6 month delay
Item NE S&H EZ GS
r_Calculation table for value of speed
t_Calculation table for value of speed for prototype banks
When you can make a similar calculation for your own bank, it is likely that you will arrive at a similarly impressive number. Project delays have a big impact not just on cost, but also on revenue. In a lot of internal
business cases the value of time-to-market is not taken into account. This is a real shame, because a lot of value is lost because of it.t
/ 27/ 26
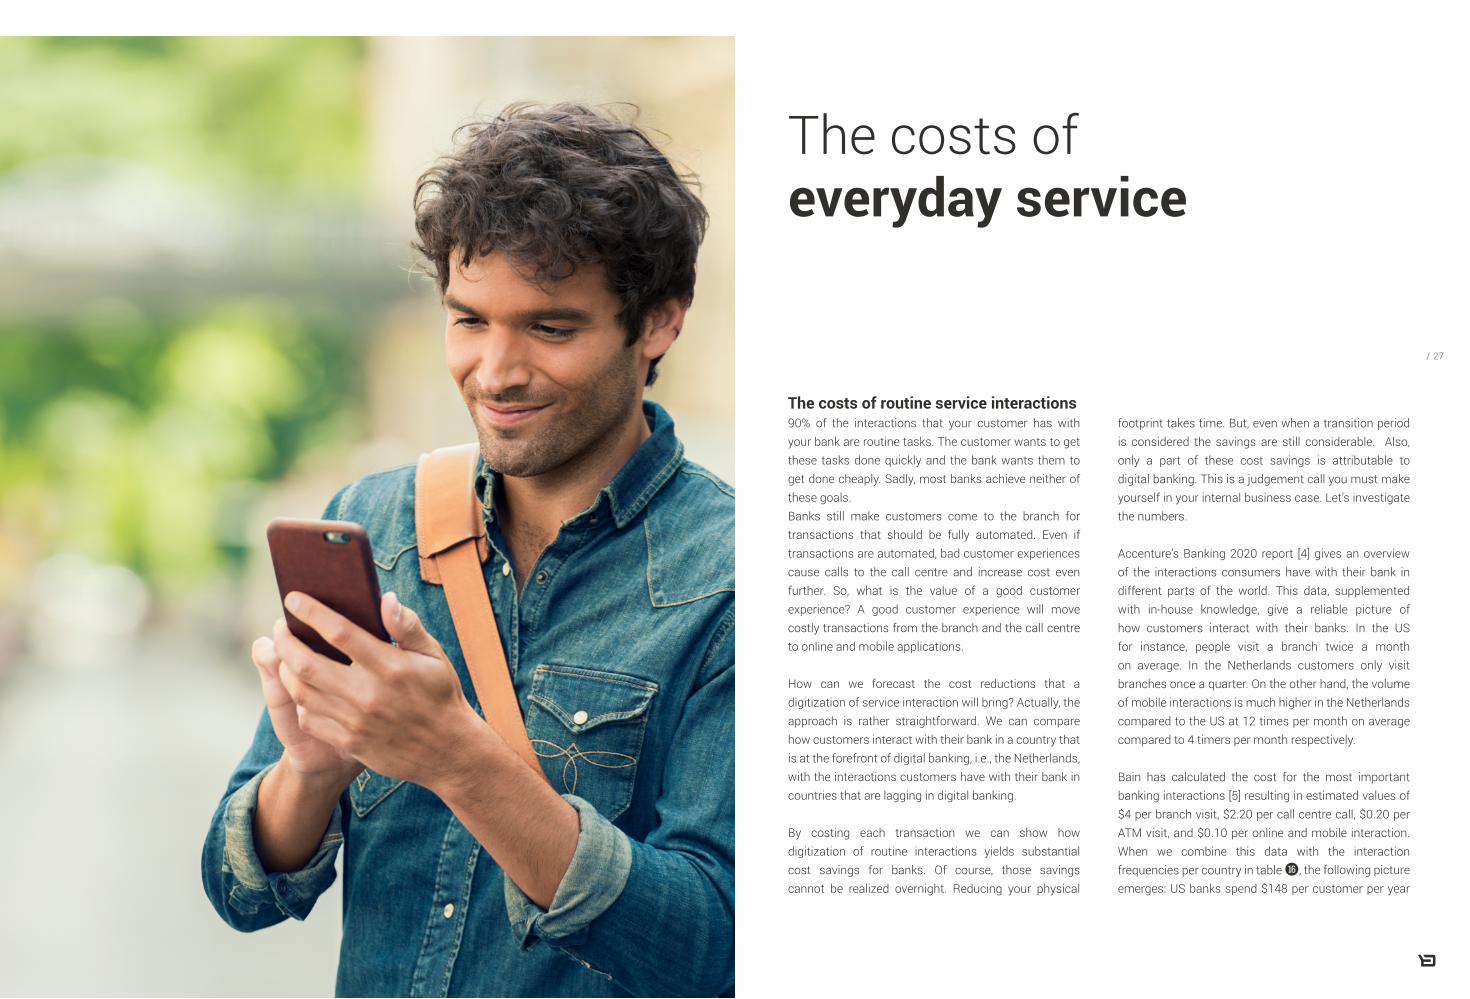
The costs of everyday service
The costs of routine service interactions90% of the interactions that your customer has with your bank are routine tasks. The customer wants to get these tasks done quickly and the bank wants them to get done cheaply. Sadly, most banks achieve neither of these goals. Banks still make customers come to the branch for transactions that should be fully automated. Even if transactions are automated, bad customer experiences cause calls to the call centre and increase cost even further. So, what is the value of a good customer experience? A good customer experience will move costly transactions from the branch and the call centre to online and mobile applications.
How can we forecast the cost reductions that a digitization of service interaction will bring? Actually, the approach is rather straightforward. We can compare how customers interact with their bank in a country that is at the forefront of digital banking, i.e., the Netherlands, with the interactions customers have with their bank in countries that are lagging in digital banking.
By costing each transaction we can show how digitization of routine interactions yields substantial cost savings for banks. Of course, those savings cannot be realized overnight. Reducing your physical
footprint takes time. But, even when a transition period is considered the savings are still considerable. Also, only a part of these cost savings is attributable to digital banking. This is a judgement call you must make yourself in your internal business case. Let’s investigate the numbers.
Accenture’s Banking 2020 report [4] gives an overview of the interactions consumers have with their bank in different parts of the world. This data, supplemented with in-house knowledge, give a reliable picture of how customers interact with their banks. In the US for instance, people visit a branch twice a month on average. In the Netherlands customers only visit branches once a quarter. On the other hand, the volume of mobile interactions is much higher in the Netherlands compared to the US at 12 times per month on average compared to 4 timers per month respectively.
Bain has calculated the cost for the most important banking interactions [5] resulting in estimated values of $4 per branch visit, $2.20 per call centre call, $0.20 per ATM visit, and $0.10 per online and mobile interaction. When we combine this data with the interaction frequencies per country in table u, the following picture emerges: US banks spend $148 per customer per year

/ 29/ 28
for service interactions. This is $98 more than Dutch banks, that spend $49 per customer per year. The largest part of these cost savings is explained by reductions in branch visits and call center calls.yu
For our example bank with 650,000 customers, a $98 cost saving per customer represents a cost saving
y_Frequency, cost and calculation of customer interactions in the US and the Netherlands
Branch $ 4.00 24 – $ 80.00
ATM $ 0.20 60 – $ 7.20
Mobile $ 0.10 48 + $ 9.60
Online $ 0.10 84 + $ 1.20
Interaction Cost US frequency/year
4
Call Center $ 2.20 12 – $ 22.00
– $ 98.40
2
24
144
96
NL frequency/year Cost Difference
Item
A Number of customers
B – C
A x D
E / F
650,000 Customer
B Total cost to serve US customers 148 Accenture, Bb analysis
C Total cost to serve NL customers 49
D Cost savings potential per customer 98 –
E Total cost savings potential 63,960,000 –
F Time to transition (years) 10 Estimate
G Year 1 cost savings 6,396,000 –
G x H
H Attribution to digital banking platform 30% Estimate
I Year 1 attributable savings 1,918,800
Accenture, Bb analysis
Calculation Example Bank Source
potential of $64M. Even if this would take 10 years to materialize, there is still a potential cumulative cost saving of $6.4M per year for the next 10 years, and these are recurring costs! The tables y and i illustrate the model used and the impact for our various prototype banks.
NLCustomercost/ year
USACustomercost/ year
Improved Online +$1.20
ImprovedMobile+$9.60
Fewer uses of ATM– $7.20
ReducedBranchvisits
– $80.00
Reduced Call center
calls– $22.00
$49.60
$148.00
u_Total cost (USD) of the transactions of 1 customer per yearWhen US consumers adopt the usage pattern of Dutch consumers costs drop dramatically.
i_Calculation of customer interactions in the US and the Netherlands for prototype banks
4,500,000
148
49
98
442,800,000
7
63,257,143
30%
18,977,143
20,000
125
42
84
1,672,800
5
334,560
30%
–
–
–
–
–
–
–
–
100,368 n.a.
700,000
148
49
98
68,880,000
10
6,888,000
30%
2,066,400
Number of customers
Total cost to serve US customer
Total cost to serve NL customer
Cost savings potential per customer
Total cost savings potential
Time to transition (years)
Year 1 cost savings
Attribution to digital banking platform
Year 1 attributable savings
Item NE S&H EZ GS

/ 31/ 30
The costs of codebase maintenanceSo far, many of the value drivers for digital banking have focused on creating value at the customer facing side of the business. There are however, large gains to be made in the IT department too.
Many banks find themselves hostage to a highly complex IT landscape that is difficult to control. As a result, the costs of IT staff are ballooning. Even though banks have a lot of IT staff, most of their effort goes into keeping current systems running, rather than innovating. Often, a skill gap prevents banks from making in-house improvements. The largest contributor to the increasing maintenance costs, however, is complexity.
As a result of the gradual introduction of new channels in banking, banks have acquired independent disconnected channels, each with its own equally disconnected code. A typical retail bank easily operates up to 8 separate channels. For instance: Branch, Call Center, Advisory, ATM, Internet Banking, Mobile Banking, Public Website, and one or more product or segment based online platforms. All these channels require access to customer
information and (largely) need to facilitate the same functionalities across a bank’s products. An example of such necessary information would be the products a customer has bought, the accounts they have, or their balances and transaction histories. In addition, most channels need to know the bank’s contact history with a client, alongside other information.
Whenever a change to the front-end is needed, for example to respond to new regulations, all channels need to be updated. This is inefficient in many ways. Code duplication leads to higher development costs, highly complex testing scenarios, and it lengthens the release cycle significantly. All of this reduces the resources available for innovation and slows banks down: most IT staff are tied up in projects that simply ‘keep the lights on’.
Changes that have an impact on the channels are not as rare as one might think either. The list o summarizes some recent or upcoming banking trends and events, all of which warrant changes.
— Brexit— New or reinstated sanctions
— GDPR— PSD2
— Channel migration— Introduction of APIs— Security threats online— Move to cloud computing— New AI features such as chatbots— Blockchain
— New payment forms such as Zelle or Paypal.— New lending products.
Technical
Regulatory
— Prevent attrition and improve onboarding in response to digital challenger banks.
Product introductions
Competitive pressure
— Stricter lending criteria to reduce NPLs.Economical climate
Political
What can be done to reduce this expenditure? This is where the digital banking platform comes in. Instead of updating each channel separately, it’s possible to just update the platform. This removes the need to constantly
rewrite the relevant code for each channel. On top of that, the platform reuses code across channels and connects each channel to create a single omni-channel experience. [See page 27: Platforms are paramount]
Branch1 channel0 paths
+Call centre2 channels1 paths
+ATM +Internet4 channels6 paths
+Mobile5 channels10 paths
Platforms are paramount
Just consider the number of possible connections the IT department must build between disconnected
channels. The number of paths between channels shows geometric growth as the number of channels rises.
If you have ever wondered why the IT department has a hard time keeping up, this is a key reason. Platforms
are needed to reduce complexity and enable consistent customer journeys.
In order to offer customers a seamless omni-channel
experience, switching between different channels
should be easy and fully functional. This is almost
impossible to achieve without the use of a platform to
centralize customers’ data and shared functionalities.
Omni-channel platform
Any given number of channels0 paths | 1 platform
o_List of recent or upcoming banking trends and events that warrant changes in banking

/ 33/ 32
When it comes to maintenance costs, rather than updating a multitude of channels, only one platform is updated, cutting costs in our example by 88% or $1.68M. See the calculation example and calculation tables p
and a for reference.
A simple calculation shows the high costs of replacing back-end systems. Consider that most banks, even simple ones, have at least 8 separate channels. Assuming at least 2 impactful changes to the front end are needed yearly, the IT department must update 16 channels a year. If it takes a squad of 6 people 8 weeks to code, test and release a single channel update, that adds up to 240 man-days per channel update. At a blended day rate of $500 this translates into a cost of $120,000 per update, or $1.9M in total. Now consider the platform approach: rather than 16 channel updates, only 2 platform updates are needed, saving an impressive $1.7M. Add to this that 3,360 man-days could also be applied to different projects.
p_Calculation table for cost savings on system maintenance on implementation of omni-channel banking platform
A Number of front-end channels 8 Customer
B Number of front-end updates per year 2 Customer
C Number of channel updates per year A x B
C x D
B x D x F
E x F
G - H
16 –
D Man-days per channel update 240 Customer
E Total man-days 3,840
F Daily (blended) rate 500 Estimate
G Total current cost 1,920,000 Industry Average
H Platform cost 240,000 –
I Cost savings 1,680,000
–
Item Calculation Example Bank Source
a_Calculation table for cost savings on system maintenance on implementation of omni-channel banking platform for prototype banks
13
4
52
1,200
62,400
600
37,440,000
2,880,000
9
2
18
240
4,320
510
2,203,200
244,800
4
2
8
180
1,440
750
1,080,000
270,000
8
3
24
320
7,680
600
4,608,000
576,000
34,560,000 1,958,400 810,000 4,032,000
Number of front-end channels
Number of front-end updates per year
Number of channel updates per year
Man-days per channel update
Total man-days
Daily (blended) rate
Total current cost
Platform cost
Cost savings
Item NE S&H EZ GS

/ 35/ 34
s_The components of the Digital-first Banking Platform
The Digital-First Banking Platform
Tailored Advice
Real-timeSupport
Digital Sales
Financial Insight
Front-officeEmpowerment
01. User Experience Management
02. Digital Banking Capabilities
05. Cloud Deployment
04. Process Digitization Capabilities
03. Identity & Access Management / Entitlements
The digital-first banking platform: Making it happen
Getting set for the new industry Google owns information, Amazon owns ecommerce, Facebook owns communication - these players dominate in their areas. Now it’s time for banks to own finance. They must reinvent themselves and go beyond a digital transformation to achieving a business transformation. Banks that work the digital-first banking platform properly will empower themselves to do things 10 times better. That’s how they will hold onto their customers at a time when the threat of attrition is bigger than ever.
A robust, agile digital-first banking platform will connect and empower all parts of the organization to optimize omni-channel customer journeys. It works alongside legacy systems, connecting, aligning and informing to support staff and customers.
s_ strong digital banking platform is a function of well-managed user experiences, backed by digital capabilities, security, smart processes and cloud deployment. Source: Backbase
When all systems talk to each other, tailored advice and real-time support are instantly available to customers. Frontline staff are freed from slow, paper-based processes and empowered to deliver excellent service, with the right information at their fingertips. The user experience works, from onboarding to upselling, and this drives digital sales. Enhanced financial insights help customers to manage their financial lives and banks to strategize. The digital banking platform connects all the dots to deliver for the end customer and ensure the bank can compete into the future.
01. User experience management. Behind every great user experience is a smooth integration with back-end services. When customer data can be quickly sourced, frontline staff are empowered with real-time, accurate data, and customers enjoy superior self-service capabilities.
Digital marketing professionals should be able to tailor the end-user’s experience, without the need to call on IT for every change. Backbase offers a range of user-friendly tools that empower digital marketers to edit content and navigation, add widgets, update the mobile app, run digital marketing campaigns across multiple channels, and more.

/ 37/ 36
A modular, flexible orchestration layer will connect and streamline existing core banking and back-end systems for frictionless, personalized, omni-channel experiences. This empowers banks to deliver optimal, relevant customer journeys, reduce time to market, and ease the burden on the IT department.
02. Digital banking capabilities. To compete in a digital world, banks must offer smart digital products and services that are easily accessible over every device. Banks need a platform that supports their efforts to stay competitive by providing innovative digital excellence.
Backbase is the digital banking platform that empowers banks with superior Banking-as-a-Platform capabilities. Built on a state-of-the-art microservices architecture and with API-based banking capabilities, Backbase complements existing core banking systems. Modular architecture enables easy customization, while both classic and cloud deployment are facilitated.
This leading omni-channel digital banking platform helps financial institutions create, manage, and optimize superior customer journeys, on any device and over multiple channels. Functionality can be tailored for seamless, omni-channel customer experiences that normally would not be available directly from the core banking or back-end systems.
03. Identity and access management. Identity and access management is key to ensuring access security in today’s open banking marketplace. A sophisticated entitlements solution makes this easy, by automating and managing the process of granting access rights to trusted users.
Backbase offers a sophisticated entitlements solution that lets a bank integrate the existing entitlements system, or leverage Backbase Entitlements to tailor access levels and permissions to view, create or approve transactions. Various password combinations, tokens, Integrated Multi-Factor-Authentication (MFA) and alerts strengthen and simplify access control.
Access to permitted functions and data can be limited and authentication can be stepped-up in high-risk situations. Users can fully customize to create their own views, and select preferred accounts or business performance metrics. Payments can be authorized on-the-go and mobile alerts and access to outstanding approval requests are also available.
04. Process digitization capabilities. Smart online forms and logical processes are key to efficient customer journeys. When they don’t work properly, abandonment increases, impacting the success of online initiatives. Smart forms and dynamic process management increase efficiency and remove manual, paper-based tasks - making life easier for both customers and employees.
Backbase Digital Forms simplify and streamline all customer dialogs across multiple channels, while onboarding or self-service dialogs integrate with internal systems for straight-through processing (STP). Banks can actively streamline their online customer dialogs and manage their self-service and customer enrolment processes.
Backbase automates daily tasks, connecting people and information to handle each case quickly and accurately. Built-in mobile and social capabilities simplify collaboration via any device or channel, and communication with legacy systems is also possible via configurable connectors.
05. Cloud deployment. Cloud deployment powers constant feature or functionality updates, without any impact on day-to-day business. New code can be deployed thousands of times per month, and fast. Development teams can bring new capabilities to market via a highly automated platform that scales with the business. Security can also be automated, making it easier to keep pace with industry regulations and compliance standards.
The Backbase platform supports both traditional app servers and new native cloud deployment models, enabling banks to safely make the transition from a classic deployment to a native cloud deployment, without re-engineering. Backbase has done the hard work of abstracting the platform capabilities from the various cloud deployment models, The Backbase Cloud is supported by an ecosystem of certified technology and infrastructure providers that facilitate service provision across multiple countries, all with a proven track record in financial services.
The Backbase Open Banking MarketplaceOne organization could not be all things to everyone before - but that’s changing, banks can add to their products and services by connecting to the open banking ecosystem. By adding incremental value from the open marketplace, they can put all of the pieces together seamless solutions that have magnetism, something customers want to be a part of.
The Backbase Open Banking Marketplace is the perfect platform to establish mutually beneficial partnerships that drive innovation. It enables financial institutions and fintechs to connect to the Backbase Digital Banking Platform. The Backbase Digital Banking Platform is an open API-based platform, which allows for any third-party fintech capability to be easily integrated and leveraged into seamless digital customer journeys across all channels.
Backbase Open Banking Marketplace offers the perfect fintech solution to significantly boost speed and efficiency in any go-to-market strategy.
Driving value with the digital banking platformWith the right platform in place, a bank can create superb customer experiences, react swiftly to market changes and capitalize on unexpected marketing opportunities. All of this begins with noting the pain points for the customer and solving these with the digital banking platform. A keen focus on each of the platform’s four pillars and a strong digital-first approach will move banks from the role of follower to formidable competitor and sustain their business into the future.

/ 39/ 38
[1] McKinsey McKinseyGlobal Banking Annual Review (2016) https://www.mckinsey.com/industries/financial-services/our-insights/a-brave-new-world-for-global-banking
[2] The Financial Brand How Retail Banks Can Snag More Wallet Share (2016) https://thefinancialbrand.com/56424/cross-selling-banking-products/
[3] Mckinsey The Future of Face-to-Face (2012) https://www.mckinsey.com/~/media/mckinsey/dotcom/client_service/financial%20services/latest%20thinking/consumer%20and%20small%20business%20banking/the_future_of_face_to_face_how_to_make_the_transformation_a_reality.ashx
[4] Accenture Banking Customer 2020 (2015) https://bankingblog.accenture.com/wp-content/uploads/2015/08/P1200614_Infografik_Banking_Customer.pdf
[5] Bain Customer Loyalty in Retail Banking – Global Edition https://www.bain.com/insights/customer-loyalty-in-retail-banking-2012/ 2012 (2012)https://bit.ly/2nsPiou
Notes

/ 41/ 40
Market presence
EdgeVerve
Temenos
TCS
Finastra
Intellect Design Arena
Tagit
NETinfo
IntelligentEnvironments
Sopra Banking Software
CR2
“Backbase offers broad business capabilities, rich support of customer experience, and very solid technology and architecture. With Backbase being a pure-play vendor, it is not a surprise that its commitment to its omni-channel banking solution is high.”
Backbase was among a group of select vendors that Forrester included in its most recent Wave for Omni-Channel Digital Banking software. The Backbase Digital Banking Platform is listed as leader and received the highest score in the Current Offering category. Being named a leader in the Forrester Wave provides the market with further validation of Backbase being at the forefront of digital innovation. We are very happy with this recognition and are energized to help our customers accelerate their digital transformation. Our software is used by leading banks around the world, and we are 100% committed to enabling them to create superior digital customer experiences, any time, any place, and on any device.
Backbase Named a Leader in the Forrester Wave™ for Omni-Channel Digital Banking
Backbase Named a Leader in the Ovum Decision Matrix for digital channel banking platforms
Leader Challenger FollowerBubble size represents market impactNote: Scale has been adjusted to improve legibility
Overall technology assessment score (scale 1-10)
4 5 6 7 8 9 10
4
5
6
7
8
9
10
Ove
rall
exec
utio
n as
sess
men
t sco
re (
scal
e 1-
10)
Corillian
CR2
Intellect Design Arena
Oracle
SAP
Sopra BankingSoftware
Misys
Temenos
EdgeVerveSystems
Backbase
“Backbase hits the most important aspects of digital channels, which are in demand for banks looking for a very modern, agile, and neat solution. Backbase allows a rapid time-to-market with its responsive design approach to the digital channels. With this solution banks are getting a number of features that are well aligned with current trends in the digital economy, not only allowing for efficient servicing but also effective sales and marketing actions.”
Ovum Decision Matrix is emphasizing the importance of developing an effective omni-channel banking strategy, selecting a future proof digital banking platform and taking into account the emergence of new technologies - all in order to empower Banks to stay relevant to their customers, improve their customer banking experience and not lose out to digital challengers. The evaluation criteria for the Ovum Decision Matrix includes market impact, business functionality, and product execution - across which Backbase scored exceptionally high. This is the second time in a row that Backbase is nominated within the Matrix as Market Leader.
About BackbaseBackbase is a fast growing fintech software provider that empowers financial institutions to accelerate their digital transformation and effectively compete in a digital-first world.
We are the creators of the Backbase Omni-Channel Banking Platform, a state-of-the-art digital banking software solution that unifies data and functionality from traditional core systems and new fintech players into a seamless digital customer experience.
We give financials the speed and flexibility to create and manage seamless customer experiences across any device, and deliver measurable business results. We believe that superior digital experiences are essential to stay relevant, and our software enables financials to rapidly grow their digital business.
More than 100 large financials around the world have standardized on the Backbase platform to streamline their digital self-service and online sales operations across all digital touchpoints. Our customer base includes HSBC, ABN AMRO,CheBanca!, Credit Suisse, Fidelity, HDFC, Hiscox, ING, KeyBank, Legal & General, NBAD, OTP, PZU, PostFinance, Navy Federal CU and Westpac.
Industry analysts Gartner, Forrester and Ovum recognize Backbase as an industry leader in terms of omni-channel banking platform capabilities, and award the company high marks for its deep focus on customer experience management and unparalleled speed of implementation. Forrester named us a leader in the Forrester Wave for Omni-Channel Banking and Ovum nominates Backbase as the market leading provider of next-generation digital channel banking platforms.
Americas HQ10 10th Street, Suite 325Atlanta, GA 30309, United StatesToll-Free Number: +1 866 800 8996Office Number: +1 470 881 [email protected]
European HQJacob Bontiusplaats 91018 LL Amsterdam, The NetherlandsPhone: +31 20 465 [email protected]
Regional Office London81 Farringdon StreetLondon, EC4A 4BLUnited KingdomPhone: +44 20 3735 8437Email: [email protected]
Regional Office Singapore3 Church StreetLevel 25 Samsung HubSingapore 049483Email: [email protected]
Regional Office CardiffGround Floor, The Bounded WarehouseAtlantic Wharf, Cardiff, CF10 4HEUnited KingdomEmail: [email protected]
Regional Office New York1460 Broadway Suite 110005New York - NY 10036United StatesEmail: [email protected]