Lessons from Remarkable FinTech Companies for the ... - MDPI
46
Citation: Velazquez, Patricia Vilcanqui, Vito Bobek, Romana Korez Vide, and Tatjana Horvat. 2022. Lessons from Remarkable FinTech Companies for the Financial Inclusion in Peru. Journal of Risk and Financial Management 15: 62. https://doi.org/10.3390/jrfm 15020062 Academic Editor: Anica Hunjet Received: 6 December 2021 Accepted: 25 January 2022 Published: 30 January 2022 Publisher’s Note: MDPI stays neutral with regard to jurisdictional claims in published maps and institutional affil- iations. Copyright: © 2022 by the authors. Licensee MDPI, Basel, Switzerland. This article is an open access article distributed under the terms and conditions of the Creative Commons Attribution (CC BY) license (https:// creativecommons.org/licenses/by/ 4.0/). Journal of Risk and Financial Management Article Lessons from Remarkable FinTech Companies for the Financial Inclusion in Peru Patricia Vilcanqui Velazquez 1 , Vito Bobek 1, * , Romana Korez Vide 2 and Tatjana Horvat 3 1 Institute of International Management, University of Applied Sciences FH Joanneum, 8020 Graz, Austria; [email protected] 2 Faculty of Economics and Business, University of Maribor, 2000 Maribor, Slovenia; [email protected] 3 Faculty of Management, University of Primorska, 6101 Koper, Slovenia; [email protected] * Correspondence: [email protected]; Tel.: +43-316-5453-6829 Abstract: Financial inclusion, defined as the adequate access and usage of formal financial services to improve people’s lives, is a crucial area for the economic development of a country through its various angles. This paper analyzes the impact of selected FinTech companies on financial inclusion in their respective countries to obtain lessons of their business models and country environments that can help Peruvian financial inclusion. The selected FinTechs are M-PESA in Kenya, Nubank in Brazil, GCASH in the Philippines, and Easypaisa in Pakistan, which revolutionized the financial sector in their respective countries. However, a comparative study of their impact on financial inclusion in their respective country has not been conducted yet; therefore, the lessons obtained are helpful for the Peruvian situation due to their practical implications and because they raise possible areas for further and deeper research. The approach of this study considered a qualitative and quantitative method (to find a Pearson correlation between the percentage of the population of Country (A) that are users of FinTech (a) and the six selected demand-side indicators per country retrieved from the Global Findex Database) analysis to understand the results obtained. The results obtained indicate that M-PESA and GCASH, companies specialized in providing basic mobile money transactions such as remittances and withdrawals, did not impact the provision of other financial services such as savings or credit cards. In Easypaisa’s case, this company positively impacts the studied indicators, probably due to its original partnership with a microfinance institution. Regarding Nubank, despite its remarkable growth in the last years, the company does not affect financial inclusion in Brazil yet. Nonetheless, after its recent expansion to provide more financial services, future research could assess the impact of this company on Brazilian financial inclusion. Keywords: FinTech’s; Nubank; M-PESA; GCASH; Easypaisa; financial inclusion; mobile money; remittances emerging markets; international business; business economics 1. Introduction This paper aims to study selected indicators of remarkable Fintech companies in Kenya, Brazil, Pakistan, and the Philippines to gain valuable lessons for financial inclusion in Peru. This goal will be achieved through a deep but summarized understanding of the definition, importance, and determinants of financial inclusion and the causes of financial exclusion. Despite the importance of financial inclusion, there is no consensus about its definition and measurement (Nguyen 2020). Therefore, a straightforward approach in this study cannot be made without first understanding the primary and minimum concepts regarding financial inclusion. After a basic literature review, this study aims to provide solid and consistent evidence of the benefits of financial inclusion for people and many reasons people are financially excluded. Among these reasons include geographical difficulties or physical access, the J. Risk Financial Manag. 2022, 15, 62. https://doi.org/10.3390/jrfm15020062 https://www.mdpi.com/journal/jrfm
-
Upload
khangminh22 -
Category
Documents
-
view
0 -
download
0
Transcript of Lessons from Remarkable FinTech Companies for the ... - MDPI

Citation: Velazquez, Patricia
Vilcanqui, Vito Bobek, Romana Korez
Vide, and Tatjana Horvat. 2022.
Lessons from Remarkable FinTech
Companies for the Financial
Inclusion in Peru. Journal of Risk and
Financial Management 15: 62.
https://doi.org/10.3390/jrfm
15020062
Academic Editor: Anica Hunjet
Received: 6 December 2021
Accepted: 25 January 2022
Published: 30 January 2022
Publisher’s Note: MDPI stays neutral
with regard to jurisdictional claims in
published maps and institutional affil-
iations.
Copyright: © 2022 by the authors.
Licensee MDPI, Basel, Switzerland.
This article is an open access article
distributed under the terms and
conditions of the Creative Commons
Attribution (CC BY) license (https://
creativecommons.org/licenses/by/
4.0/).
Journal of
Risk and FinancialManagement
Article
Lessons from Remarkable FinTech Companies for the FinancialInclusion in PeruPatricia Vilcanqui Velazquez 1, Vito Bobek 1,* , Romana Korez Vide 2 and Tatjana Horvat 3
1 Institute of International Management, University of Applied Sciences FH Joanneum, 8020 Graz, Austria;[email protected]
2 Faculty of Economics and Business, University of Maribor, 2000 Maribor, Slovenia; [email protected] Faculty of Management, University of Primorska, 6101 Koper, Slovenia; [email protected]* Correspondence: [email protected]; Tel.: +43-316-5453-6829
Abstract: Financial inclusion, defined as the adequate access and usage of formal financial servicesto improve people’s lives, is a crucial area for the economic development of a country through itsvarious angles. This paper analyzes the impact of selected FinTech companies on financial inclusionin their respective countries to obtain lessons of their business models and country environments thatcan help Peruvian financial inclusion. The selected FinTechs are M-PESA in Kenya, Nubank in Brazil,GCASH in the Philippines, and Easypaisa in Pakistan, which revolutionized the financial sector intheir respective countries. However, a comparative study of their impact on financial inclusion intheir respective country has not been conducted yet; therefore, the lessons obtained are helpful for thePeruvian situation due to their practical implications and because they raise possible areas for furtherand deeper research. The approach of this study considered a qualitative and quantitative method (tofind a Pearson correlation between the percentage of the population of Country (A) that are users ofFinTech (a) and the six selected demand-side indicators per country retrieved from the Global FindexDatabase) analysis to understand the results obtained. The results obtained indicate that M-PESA andGCASH, companies specialized in providing basic mobile money transactions such as remittancesand withdrawals, did not impact the provision of other financial services such as savings or creditcards. In Easypaisa’s case, this company positively impacts the studied indicators, probably due toits original partnership with a microfinance institution. Regarding Nubank, despite its remarkablegrowth in the last years, the company does not affect financial inclusion in Brazil yet. Nonetheless,after its recent expansion to provide more financial services, future research could assess the impactof this company on Brazilian financial inclusion.
Keywords: FinTech’s; Nubank; M-PESA; GCASH; Easypaisa; financial inclusion; mobile money;remittances emerging markets; international business; business economics
1. Introduction
This paper aims to study selected indicators of remarkable Fintech companies inKenya, Brazil, Pakistan, and the Philippines to gain valuable lessons for financial inclusionin Peru. This goal will be achieved through a deep but summarized understanding of thedefinition, importance, and determinants of financial inclusion and the causes of financialexclusion.
Despite the importance of financial inclusion, there is no consensus about its definitionand measurement (Nguyen 2020). Therefore, a straightforward approach in this studycannot be made without first understanding the primary and minimum concepts regardingfinancial inclusion.
After a basic literature review, this study aims to provide solid and consistent evidenceof the benefits of financial inclusion for people and many reasons people are financiallyexcluded. Among these reasons include geographical difficulties or physical access, the
J. Risk Financial Manag. 2022, 15, 62. https://doi.org/10.3390/jrfm15020062 https://www.mdpi.com/journal/jrfm
J. Risk Financial Manag. 2022, 15, 62 2 of 46
lack of proper documentation such as, for example, identification purposes, and the highprices or fees of financial services, which discourage low-income people from access tofinancial services (Stein et al. 2011).
The reasons and causes of financial exclusion are essential for this study becausethe problem can be understood, addressed, and treated as a market failure that requiresconsidering supply and demand factors. From the demand side, there is a broad consensusthat people from less developed countries are less financially included, whereas people fromdeveloped countries are more financially included (Atkinson and Messy 2013; Rojas-Suarezand Gonzales 2010).
From the supply side, recent evidence proves that mobile money accounts providedmainly by Fintechs have been gaining users in developing countries, facilitating financialtransactions, expanding to other financial services, and improving financial education(Nguyen 2020; Damodaran 2013).
The following step in this research includes analyzing the environmental context ofPeru and comparing it to countries that have started early in mobile money accounts andhave designed and applied financial inclusion strategies at the national or subnationallevels (Pearce and Ortega 2012). This section will gather data regarding each country’senvironment, demand, and supply sides, and on the supply side, the remarkable FinTechswill be presented. FinTech is a new concept referred to as a technology-enabler innovationin financial services, rapidly expanding in developing countries and improving financialinclusion indicators (Nguyen 2020; Pearce and Ortega 2012). The selected FinTechs areM-PESA from Kenya, Nubank from Brazil, G-Cash from the Philippines, and Easypaisafrom Pakistan.
Problem Statement
In June 2021, BBC News (2021), The Guardian (2021), BMJ (2021), and many othermedia published that Peru has the highest COVID-19 death rate globally according to thegovernment’s review and update of the information related to COVID-19-related deaths.According to this updated information, more than 0.5% of Peruvians died from this disease.A dramatic toll was worse than that recorded by the UK during the Spanish influenzapandemic in 1918–20 (BMJ 2021).
The question is why Peru was so severely hit during this pandemic, despite theimposition of one of the earliest and strictest lockdowns, faster testing, and personal libertyrights restrictions in Latin America. The press explained that the main reasons for thissevere impact of the pandemic in Peru were the widespread poverty, largely informaleconomy, crowded houses, only 38% of Peruvians having bank accounts, the fragile andunprepared health system, and the slower vaccination process (BBC News 2021; BMJ2021). However, a fact that is not related to the disease—government social aids directedto help people who lost their jobs or the most vulnerable and poorer population—is thatindividuals could not receive economic support from the government because most adultPeruvians do not own a bank account, making digital payments impossible (BBC News2021). CGAP briefing guides those designing and deploying social assistance payments tohelp them work with financial sector regulators and implement social assistance paymentsthat facilitate rapid, remote account opening in compliance with anti-money launderingand counter-financing of terrorism (AML/CFT) rules (Economist Intelligence Unit 2020).The Peruvian government adopted a financial inclusion strategy. However, it was alsofound that this country has a weak adherence to the law. Therefore, from a regulatoryperspective, the incentives to the supply and demand side are probably not optimal. Forexample, it could be the case that the regulation to acquire the respective permissions is toostrict. This topic could be further analyzed from a specific legal perspective.
The natural consequence of this situation is that many people were forced to agglomer-ate at bank offices, lining up to receive their emergency government aid in cash, facilitatingthe virus transmission, chaos, and distrust among the population. Afterward, in October of2020, an important bank in Peru and the government recognized that the containment of the

J. Risk Financial Manag. 2022, 15, 62 3 of 46
virus would have been more efficient if this country had higher rates of financial inclusionand financial education. Therefore, in the Peruvian case, financial inclusion does not onlyhelp people to improve their lifestyle, but it also may save lives when the government aimsto provide social aid or distribute wealth.
In recent years, researchers and international organizations recognized several remark-able FinTechs disrupting the banking sector by taking a leading role in many financialservices such as mobile money and mobile banking. For this reason, it is worthy of ana-lyzing these companies in their respective country to learn lessons that can contribute tofinancial inclusion in Peru.
This analysis will be made by considering that these companies are part of a financialsystem that requires close contact with the government to prevent the collapse of thesecompanies that promote financial inclusion (Omar and Inaba 2020). Therefore, a broadcomprehension of the context of each country will guide the solution of the problemstatement.
This paper aims to analyze the overall situation of financial inclusion in five differentcountries that have implemented a successful financial inclusion strategy that improved theaccess and usage of financial services among their population. After collecting data fromthe environment, demand, and supply side, the empirical analysis will be conducted withqualitative and quantitative analysis. The qualitative part consists of benchmarking thatcompares business-related qualitative information of the selected FinTechs to understandeach company’s business model. The quantitative part consists of a multivariable corre-lation analysis between demand and supply-side indicators. The information gatheredabout the environmental side will explain the results. The empirical research will provideinsights into determining events, business strategy, and the overall environment requiredby Peru to improve financial inclusion.
There is abundant literature regarding methods of measuring financial inclusion.Among these studies, the World Bank, IMF, the BBVA Bank, and many other institutionstried to measure financial inclusion per country and consider various indicators. All studiesconclude the significant relationship between lower financial inclusion rates with povertyand income inequality in emerging countries (Barajas et al. 2020). During the COVID-19 crisis, a survey of the trends and drivers of financial inclusion was also developed,considering the current context to guide policymakers seeking to design strategies for theirrespective countries (Sotomayor et al. 2018). However, this research did not include a casestudy analysis of FinTechs nor a country study analysis.
There is no comparative study on remarkable FinTechs disrupting or improvingfinancial inclusion in their respective countries that offers lessons for financial inclusion in aspecific country. Therefore, this study would be constructive for understanding remarkableFinTechs’ business models and learning lessons for financial inclusion in Peru, a countrywith lower financial inclusion indicators. A summarized overview of Peru is presented inTable 1.
The definition of financial inclusion adopted by the Peruvian government is the accessto and use of financial services with quality for all population segments. The accessdimension is understood as the possibility of contracting products and services offered bythe financial sector. The use dimension refers to the practical, frequent, and sustainableacquisition and use of financial products or services (Sotomayor et al. 2018).
A synthesized diagnosis of the Peruvian context of financial inclusion can be madeby considering demand-side indicators provided by the Global Findex Database for 2011,2014, and 2017 (Demirgüç-Kunt et al. 2018). It is shown in Table 2.
There are many reasons why financial inclusion in Peru is very low. Accordingto Sotomayor et al. (Sotomayor et al. 2018), the proximity of the access points to thepopulation shows that it affects the usage of bank accounts and credits because of the timeof transportation to the access point for making transactions. Therefore, the probability ofobtaining informal credits is higher.

J. Risk Financial Manag. 2022, 15, 62 4 of 46
Table 1. Country overview—Peru.
Characteristic Situation
Geographical conditions andpopulation distribution
Peru has a western coastal plain (costa), high and rugged Andesin the center (Sierra), eastern lowland jungle of Amazon Basin(Jungle). Area: 496,225 sq. miles. Approximately one-third of thepopulation lives along the desert coastal, focusing on Lima’scapital city. The remote cities in the Andean highlands, therainforests, and the jungle are sparsely populated (CIA.gov2021d).
Population
The adult population in Peru (ages 15 to 64) in 2020 was roughly10.9 million.In 2011, 2014, and 2017 the population was 9.2, 9.6, and 10.3million inhabitants, respectively (World Bank 2020b).
Mobile phone penetration By 2019, the subscriptions per 100 inhabitants were 123.76(CIA.gov 2021d).
The rule of law
According to the Rule of Law index, Peru is ranked in the 80thposition out of 128 countries, and its score is 0.5, which means lawenforcement and institutions are weak and there are corruptionproblems in the government (The World Justice Project 2020).
Financial literacy In 2015, a survey found that 28% of the Peruvian population wasfinancially literate (The World Justice Project 2020).
Banking concentration In 2017, 72% of the market was concentrated in a few banks(World Bank 2021b).
Multiculturality
Ethnic groups: mixed Amerindian and white (60.2%),Amerindians (25.8%), White (5.9%), African descent (3.6%),Chinese and Japanese descent (1.2%), and unspecified (3.3%)(CIA.gov 2021d).Official Languages: Spanish (82.9%), Quechua (13.6%), Aymara(1.6%), Ashaninka 0.3%, and others (CIA.gov 2021d).
Employment to populationratio
In 2019, the pre-pandemic year, the employment rate in Peru was75.5% (World Bank 2021b).
Gross National Income percapita In 2020, the GNI per capita was USD 6010 (World Bank 2021b).
Source: own illustration based on specific information about Peru.
Table 2. Selected indicators regarding financial inclusion in Peru.
Indicator 2011 2014 2017
Account ownership (% age 15+): 20% 29% 43%Mobile money account (% age 15+) - 0% 3%
Sent or received domestic remittances through amobile phone (% age 15+) - 0% 2%
Credit card ownership (% age 15+) 10% 12% 12%Debit card ownership (% age 15+) 14% 21% 28%
Saved at a Financial Institution (% age 15+) 9% 12% 8%Source: Own illustration based on the Global Findex Database (Demirgüç-Kunt et al. 2018).
Regarding mobile money accounts, the increase from 0 in 2014 to 3% in 2017 couldbe attributed to the launch of BIM in 2016, a mobile wallet service created by Asbanc(Association of Peruvian banks—Asociación de Bancos del Peru) and Ericson with thepurpose to connect unbanked individuals to the formal financial system. Therefore, after2016 it was foreseen that FinTech companies play an increasing role in financial inclusionin this country (Economist Intelligence Unit 2019).
According to the analysis of the Global Microscope (Economist Intelligence Unit2019), with an overall financial score after assessing the enabling environment for financial

J. Risk Financial Manag. 2022, 15, 62 5 of 46
inclusion, Peru achieves a high overall financial inclusion score (82/100), surpassing peercountries in Latin America and the Caribbean and upper-middle-income countries due togovernment support, market stability and integrity, excellent products and outlets, andbetter quality consumer protection rules and infrastructure.
2. Literature Review
This section will develop a deep but summarized presentation of fundamental conceptson Financial inclusion. These basic concepts include an updated definition of Financialinclusion; the causes why people are excluded from the financial sector; and the importance,dimensions, and determinants of financial inclusion. After having a clear idea about thesemain concepts, it will be understood that financial exclusion is a problem that surges frommarket failure. Therefore, demand and supply forces will help comprehend how the issueis addressed globally.
The following important topic includes a detailed analysis of the Peruvian financialinclusion environment and the selected emerging countries: Brazil, Kenya, the Philippines,and Pakistan. This analysis will address the environment in each country and select demandand supply-side indicators. On the supply side are FinTechs. Therefore, the sub-section“3.2. Remarkable FinTechs in Selected Emerging Markets“ will analyze types of FinTechs,paying particular attention to mobile money operators and neo banks. Afterward, theanalysis involves the selected companies and their most essential characteristics, valueproposition, business model, revenue model, and more.
Over the last 18 years, Financial inclusion is a topic that has become relevant fordeveloping countries because, according to empirical research, it contributes to reducingthe poverty gap and reducing inequalities. Therefore, it is expected that resources could beobjectively distributed, resulting in the rise of income levels, and as a result, there will beeconomic growth (CIA.gov 2021b).
This topic has emerged on the global agenda for sustainable long-term economicgrowth. Central Banks have addressed it; multinational organizations such as the WorldBank, the International Finance Corporation, the United Nations, and more have startedmany initiatives to achieve financial inclusion in emerging and developed countries. How-ever, there is no consensus about its definition and how it should be measured through thedifferent studies (Amidžic et al. 2014).
One of the reasons this topic raised the attention of governments and Central Banks isthe well-documented evidence of the strong relationship between financial developmentand economic growth. Therefore, financial exclusion is a barrier to economic develop-ment. Building inclusive financial systems became a need for governments due to theevidence that access to essential financial services such as savings, payments, and creditcan substantially improve poor people’s lives (Pinar Ardic et al. 2011).
Nevertheless, financial exclusion is not a simple problem because people could vol-untarily be self-excluded and decide not to use financial services because of cultural orreligious reasons. On the other hand, people are involuntarily excluded because they do nothave enough money or access credits. Likewise, people are excluded due to governmentfailures or market imperfections (Amidžic et al. 2014).
Suppose financial inclusion is acknowledged as a behavioral side issue. In that case,it will be understood that people need to decide and choose to participate in the formalfinancial system, given the right and appropriate information, the right policies, and thesupply of services that meet their needs (Cámara and Tuesta 2014).
In 2006, the World Bank identified that the access to formal financial services and theavailability of a supply of financial services at reasonable costs and reasonable quality wasan objective standard for financial institutions and governments. User refers to the currentconsumers of financial services. At this time, the World Bank identified the need to intersectdemand and supply forces to achieve financial access (Claessens 2006). In 2010, the UnitedNation-UNSGSA, on its first Annual Report to the Secretary-General, defined financialinclusion as the “universal access, at a reasonable cost, to a wide range of financial services

J. Risk Financial Manag. 2022, 15, 62 6 of 46
provided by a variety of sound and sustainable institutions” (United Nations—UNSGSA2010). This report addressed the positive impacts of reducing poverty and improving socialand economic development.
The Consultative Group to Assist the Poor—CGAP—in 2011 defined financial inclu-sion as the state where all working-age adults have adequate access to financial servicesprovided by formal institutions, such as credits, savings, payments, and insurance. Con-sequently, the demand side corresponds to all working-age adults, and the supply sidecorresponds to “formal institutions.” These institutions are financial services providerscapable of satisfying customers’ needs and offering a better value proposition than informalproviders (CGAP 2011a).
OECD and the International Network on Financial Education-INFE in 2013 definedfinancial inclusion relative to the affordable, timely, and adequate access to a range ofregulated financial products and services and broadening their use to all segments of thepopulation through the implementation of tailored existing and innovative perspectivesincluding financial awareness and education to promote financial, economic, and socialinclusion (Atkinson and Messy 2013).
Barajas et al. (2020) defined this concept as the population’s access to financial services,the extent of the use of these services, and their quality and cost. Additionally, it recognizesno consensus about the definition of financial inclusion due to the multiple factors requiredto be measured, whether for policymakers or supply-side institutions.
In general terms, these definitions point out the need for all people to access financialservices to improve their lives. This statement is not just rhetoric, and evidence supportsthat financial inclusion can augment economic growth. According to Ghosh (2016), first,consumers that can access the formal financial system are likely to increase savings, whichwill impact the long-term period of their lives; second, with adequate financial inclusion,firms and people will improve their access to credit, and this situation will improve alleconomic activity.
Nevertheless, it must be observed that high usage levels of formal financial servicesor broadly spread access points (ATMs) do not necessarily mean an inclusive system.According to Cámara and Tuesta (2014), financial services can be conditioned by socio-economic factors such as GDP per capita, human capital, legal framework, cultural habits,or development status that make people use these services in a particular manner. Therefore,the usage and access to financial services are considered an output of financial inclusionand not the inclusiveness of the financial system itself. In other words, both dimensions arenecessary but not sufficient to measure financial inclusion.
Regarding dormancy among existing accounts, Findex shows there is still a lot ofwork on usage: 25 percent of account holders in the developing world have not used theiraccounts for a single deposit or withdrawal in 2016. However, the challenge in Findex datais that backsliding or slow progress in a few big markets is drowning out progress in the restof the world. The primary reason is India, which is skewing the account dormancy figuressignificantly because of its large population and extraordinarily high levels of inactivity—at48 percent of account holders in 2017. If we take India out of the equation, the percentageof inactive account holders in the developing world comes down from 25 to 16 percent(Bull 2018).
Additionally, it must be pointed out that financial inclusion improves poor people’slives and the entire economy in developing countries. For example, according to theUNSGSA (United Nations—UNSGSA 2017), small and medium-sized enterprises (SMEs)represent half of total employment and a third of the GDP in emerging markets. However,their potential is limited due to inequalities in accessing credits and financing (UnitedNations—UNSGSA 2017). Consistent evidence found that financial inclusion is beneficialfor economic growth and the fight against poverty (Bank for International Settlements2020).
Many benefits of financial inclusion could be synthesized in two key advantages:enhancing innovation and the better use of existing assets. In other words, entrepreneurs

J. Risk Financial Manag. 2022, 15, 62 7 of 46
have incentives to make innovations and create business opportunities when they canaccess credit and other financial services, unlocking growth and development opportunities.Furthermore, with proper access to the financial system, people can possess multiple usesto their existing assets, transforming them from “dead assets” to liquid assets (Stein et al.2011).
Given the benefits and awareness of its importance, financial inclusion has receivedattention from the public and private sectors in recent years because they recognize thepotential of including people in the financial system in emerging countries where incomelevels are growing and the population is increasing (Moreno et al. 2015). In addition, thereis proven evidence suggesting that financial inclusion contributes to a more stable bankingsystem, when deposits mainly fund banks, display low marginal costs, and operate withina robust institutional environment (Barajas et al. 2020).
At this point, it must be observed that recent literature does not connect the importanceof financial inclusion to traditional financial institutions because banks did not attend toan unprofitable demand that was expensive to provide. Therefore, economic agents suchas government agencies, non-government organizations (NGOs), and the informal sectorhave attended this underserved market. However, market drivers have developed newopportunities, enabled by digital technologies that create business models that make thecosts and profits in serving the unbanked more attractive. Accenture estimated in 2015 thatbringing excluded adults and businesses into the formal banking sector could generateabout USD 380 billion in new revenue for banks (Amidžic et al. 2014). In other words, theurgent needs of consumers drove technology-related companies to innovate and createproducts for these people. They disrupted what in former timer was an exclusive bank’sterritory. These innovations are at some point so successful that even banks are nowattracted to reach the unbanked in emerging countries. Therefore, by understanding theimportance of the topic, it can be identified that many economic agents are interestedin obtaining financial inclusion due to the social benefits and its significant economicopportunities.
According to Atkinson and Messy (2013), financial exclusion signifies market failurethat implies demand and supply-side factors. Therefore, to find out the causes of thismarket failure, common themes on each side must be identified: demand and supply.
From the supply side, the following factors include reducing access to and the use offormal financial products and services (Atkinson and Messy 2013):
- Regulatory constraints: The national regulatory frameworks of states can disincentivethe ability of financial providers to attract new clients due to higher costs or extraefforts that are not recuperable in the short term. Moreover, risk-averse regulation andits application can deny financial services to some population segments—for example,people from remote rural areas, migrants, and youth. Based on its work in 10 countriesin Africa and Asia, CGAP has identified four building blocks for creating and enablingsafe DFS regulatory frameworks (CGAP n.d.). The World Bank explored why accountownership varies widely among economies with similar income levels. The studyfound that account ownership and use of formal savings are higher in economieswith more strict consumer protections. Formal saving is also correlated with policiesthat limit fees and tax incentives to foster financial inclusion (The World Bank 2021).Another research suggests that account owners’ use of savings is significantly relatedto consumer protection. At the same time, formal saving is also associated withregulations that cap account fees and tax incentives to promote financial inclusion(Klapper et al. 2021). Financial regulators can optimize linkages between four distinctpolicy objectives: financial inclusion (I), financial stability (S), financial integrity (I),and financial consumer protection (P) (or, collectively, “I-SIP”). The findings demon-strate that tradeoffs among the I-SIP objectives are not inevitable and that synergy isachievable. The study’s outcome (GPFI SSBs Conference 2021) suggests the need toconsider the four I-SIP objectives collectively rather than independently, as is mostlythe case so that linkages among them can be optimized. Based on the findings of

J. Risk Financial Manag. 2022, 15, 62 8 of 46
the study in South Africa, the paper puts forth seven guidance statements to opti-mize the I-SIP linkage that may be helpful for both national-level policymakers andstandard-setting bodies as they implement a financial inclusion plan that increases thechances of maximizing synergies and minimizing trade-offs (GPFI SSBs Conference2021). Additionally, the question of how to craft a regulatory regime that expandsaccess to financial services to the poor through the development of mobile phonefinancial services but is compliant with AML/CFT standards remains elusive for mostgovernments. Specific AML/CFT regulations related to mobile money have not beenissued in many jurisdictions, mainly due to the lack of awareness of the risks theseservices can pose if the proper controls are not in place. Due to the internationalstandards for AML/CFT, the Financial Action Task Force’s 40 + 9 Recommendationswere designed and issued well before mobile money technology and business modelsbecame prevalent; even developed countries have begun to face challenges with theirregulation (Chatain et al. 2013).
- Risks of mobile money: The abuse of mobile money could arise from four primaryrisk categories—anonymity, elusiveness, rapidity, and poor oversight. Poor oversightis an external risk factor potentially creating conditions that increase the likelihood ofabuse stemming from the other three major risk categories. National authorities haveprime responsibility for the quality of oversight. Low amounts of money, traceability,and the monitoring features of mobile money programs could make mobile moneyfar less risky than other payment methods, particularly cash. Increasing evidencesuggests that certain jurisdictions are implementing overly stringent risk mitigationtechniques for money laundering and financing of terrorism, potentially increasing reg-ulatory compliance costs among money providers and constraining financial inclusionobjectives (Chatain et al. 2013).
- Inclusion and integrity alignment: There is a noticeable trend of mandatory registra-tion of users of prepaid SIM cards in Sub-Saharan Africa. More than 30 countrieshave started or are planning to register users of prepaid SIM cards. One immediateeffect of registration is that the number of active cellular subscriptions drops due todisconnections. Moreover, penetration growth, measured as year-to-year changesin mobile cellular subscriptions per 100 inhabitants, is depressed due to increasedpaperwork. Customer identification can become, in particular, a constraint in coun-tries with an insufficient identification infrastructure if no alternative methods foridentification are allowed. The share of prepaid subscriptions out of total subscriptionsis, on average, around 97 percent for the sampled countries. Therefore, the sheer sizeof the markets merits a preliminary analysis of the potential effects of mandatoryregistration (Jentzsch 2012).
- Weak financial consumer protection: Financial services suppliers can attract customersand keep them in a cycle of credit that is too large to manage or too hard to repay.
- Prohibitive market factors: Providers exclude sections of the population with someactions such as denying access to credit to those without credit records, charging highfees for basic transactions, designing terms and conditions to exclude, for example, theinformal sector, and promoting marketing in favor to specific groups. These actionstend to exclude unprofitable or high-risk populations.
- Geographical/physical barriers: Normally, people access financial services throughphysical locations. However, geographical and physical barriers such as remoterural and isolated areas and poor infrastructure make it impractical to provide branchservices. This situation is that many potential customers are not served or underserved.
- Infrastructure and connectivity barriers: The barriers are currently being reduced dueto easy access to information technologies such as mobile telephones and computers.However, parts of the population are still excluded where electricity is unavailableand technology requires compatible products.
The demand-side factors are the following (Atkinson and Messy 2013):

J. Risk Financial Manag. 2022, 15, 62 9 of 46
- The financial vulnerability caused by personal circumstances: This includes issuessuch as lack of money or resources, no credit history, unemployment, lower-income orintermittent income, and others that discourage people from accessing financial prod-ucts from the formal sector and giving a chance to informal moneylenders to operate,which increases the vulnerability of poor households and reduces the possibility ofbeing involved in the traditional financial system.
- Low levels of financial literacy: Studies show a relationship between financial literacyand financial inclusion. A lack of awareness, low confidence and trust, and insufficientknowledge create barriers and discourage people from accessing financial products.
- Reduced social-technological inclusion: Some sectors of the population in some coun-tries are isolated through different causes such as geographical barriers or inadequateinfrastructure. However, despite mobile phones’ advantages, such as fast and easyaccess to a mobile bank account, these people may lack knowledge or familiarity withsome technologies, such as the internet and mobile phone features. These issues areperceived as a barrier to financial inclusion.
- Cultural and psychological barriers: Some population sectors can consciously decideto self-isolate from financial services due to personal, cultural, and religious beliefs.Additionally, barriers can be considered a lack of trust in the financial sector and the“outsiders.”
- Linguistic or educational barriers: Attached to the lack of financial literacy, there aresituations in which people speak a different language than the supplier’s language.Therefore, they are not familiar with the vocabulary used by the financial sector.Moreover, these communicational barriers can be exacerbated if these populationsectors have lower general education levels, such as limited literacy and numeracy.
After reviewing supply and demand-side causes of financial inclusion, it can be saidthat from the supply side, both banks and FinTechs are called to adjust their priorities,business models, goals, products, and services to reach population financially excludeddue to many benefits that will be explained in the next section. From the demand side,there are countless methods for measuring financial inclusion. Nevertheless, the demand-side indicators chosen are used commonly in the literature, such as the ownership of abank account, mobile money account, credit and debit card, the ability to make savingsor borrowings in a financial institution, and making remittances (Sotomayor et al. 2018;United Nations—UNSGSA 2010).
Financial inclusion is a multidimensional topic. However, the terminology variesdepending on the purpose of the research project. In addition to this, the studies reviewedhave in common that the problem underneath is a market failure. Therefore, supply anddemand forces are the basis for every survey, and the dimensions serve to classify andmeasure specific indicators.
According to Amidžic et al. (2014), there are three main dimensions: outreach, usage,and quality of financial services. The outreach dimension refers to the physical possibilityto reach a point of service. The usage dimension refers to the use of financial services, andthe quality dimension refers to the extent to which financial services address consumers’needs.
Cámara and Tuesta (2014) analyzed the dimensions of usage, barriers, and accessto financial services. The first measures the extent of usage of formal financial services;the second refers to the unbanked obstacles that discourage them from using traditionalfinancial services. The third refers to the possibility of using legal financial services whenthey meet the population’s needs.
According to Pearce and Ortega (2012), the dimensions are access, usage, and quality.With the access is measured the extent of costumers who will adopt new financial servicesand products from formal institutions; the use measures the regularity and frequency ofthe adoption of financial services and products and the quality, the degree to which con-sumers are benefitted from financial services. This study includes the consumer protectionframework and the promotion of financial literacy.

J. Risk Financial Manag. 2022, 15, 62 10 of 46
Another exciting approach made by Sotomayor et al. (2018) explains that the determi-nants for financial inclusion are the environment in which the Financial Sector operates: thesupply side, which in the literature is referred to the access to financial services and prod-ucts; and the demand-side, referred to the usage of those products and services and theirconsumption. The author affirms that supply and demand forces alone will hardly achievea situation where the population can access financial services and use them. Therefore, it isessential to consider the country’s environmental factors.
Financial inclusion is positioned prominently as an enabler of other developmentalgoals in the 2030 Sustainable Development Goals, where it is featured as a target in eightof the seventeen goals. These include SDG 1, on eradicating poverty; SDG 2 on endinghunger, achieving food security, and promoting sustainable agriculture; SDG 3 on profitinghealth and wellbeing; SDG 5 on achieving gender equality and economic empowermentof women; SDG 8 on fostering economic growth and jobs; SDG 9 on supporting industry,innovation, and infrastructure; and SDG 10 on reducing inequality. Additionally, in SDG 17,on strengthening the means of implementation, there is an implicit role for greater financialinclusion through more significant savings mobilization for investment and consumptionthat can spur growth (UNCDF n.d.).
In consequence, according to Sotomayor, there are three main groups of indicators.The first group is related to the financial sector’s environment; the second calls the supplyforces controlled by the financial service providers; and finally, the third group refersto demand-side characteristics. Similar to any other market, these factors interact andinfluence financial inclusion in a country (Sotomayor et al. 2018).
This study analyzes carefully each dimension provided by the authors. However, notall of them can be taken or further developed since those classifications are not suitable forthis research project. Furthermore, the research project thesis aims to present in this studya simple approach that has into consideration state-side indicators as well. Therefore, theapproach considered by Sotomayor et al. (2018) fits perfectly to solve the problem statementand research questions. For this reason, it is essential to explain the understanding of thesemain dimensions (Sotomayor et al. 2018):
- The environmental side refers to the macroeconomic context, geographical character-istics, vial and telecommunications infrastructure, and public policy.
- The supply side refers to financial institutions’ objectives, priorities, characteristics,business models, products, and services offered.
- The demand side refers to the access and use of financial services and macroeconomicindicators such as income level, employment rate, financial education, and similarfactors.
The acknowledgment of these three dimensions is relevant because of its clear, direct,and straightforward approach and a practical method for understanding financial inclusionas a market failure problem. In this country’s regulation, supply and demand-side forcesmust be considered.
The recognition of the multidimensional aspects of this topic confirms its complexity;therefore, it is essential to limit the extent of a group of indicators to analyze. By analyzingsupply and demand indicators, abundant literature can be found; however, since it is partof this study to analyze FinTechs based in different countries worldwide, the environmentindicator has equal importance.
3. Empirical Research
This section contains the description of the methodology in Section 3.1, which explainsthe research design applied, the research questions, and the hypotheses. Moreover, thetype of data analyzed and from where it was collected will be presented.
Sections 3.2 and 3.3 conduct a qualitative analysis of the data collected from remarkableFintechs in the selected emerging countries (supply side) and the relevant information ofthe respective country (environment and demand-side). After each section, a summarizedbenchmarking collects data about countries and FinTechs.

J. Risk Financial Manag. 2022, 15, 62 11 of 46
Section 3.4 will conduct a quantitative analysis to understand if the studied companieshave a role in the financial inclusion of their respective country. Most of the companiesanalyzed indicate their essential part in expanding financial services among their targets.However, the results alone require the context of the respective country and a clear expla-nation of the company’s business model to understand why there is a lower or negativecorrelation in each case.
3.1. Methodology
The researchers conducted an exploratory and descriptive research design, followingthe approach of Malhotra (2010): (1) the information needed for this study, (2) define theresearch type, (3) specify measurement procedures, (4) the collection of data, (5) specify theprocess of data collection, and (6 plan of data analysis.
The primary purpose of this research is to search for lessons that could be learnedfrom great FinTech companies in Kenya, Brazil, the Philippines, and Pakistan to helpfinancial inclusion in Peru. These companies were selected after preliminary literaturereview research in which researchers developed case studies on specific FinTech companiesbased in those countries (Damodaran 2013; McKay and Pickens 2010; CGAP 2011b; Maureeand Kohli 2013).
The most suitable research design to solve this problem statement and research ques-tions are to conduct a mixed approach combining qualitative and quantitative methods tocomplement and understand the outcome of this study with insights from both qualitativeand quantitative approaches correctly (Malhotra 2010).
The strength of this approach will provide a pragmatic point of view of the problemstatement because the data to be analyzed will help answer the research questions andtheir circumstances (Johnson and Christensen 2004).
The following section will formulate the research questions (RQ) to solve the problemstatement by considering a quantitative and qualitative approach:
- RQ1: Does FinTech (a) have a role in financial inclusion in Country (A)?- RQ2: Which characteristics of the business model of FinTech (a) could be applied to
the Peruvian context?
Where:
- FinTech (a) can be either: M-PESA, Nubank, GCASH, or Easypaisa;- Country (A) can be either: Kenya, Brazil, the Philippines, or Pakistan.
The FinTechs selected for this research project is M-PESA in Kenya, Nubank in Brazil,GCASH in the Philippines, and Easypaisa in Pakistan. Several researchers studied thesecompanies, indicating their participation in financial inclusion in their respective countries.However, there is no clear evidence about the relationship between each FinTech and thefinancial inclusion indicators in the respective country, except for M-PESA, a companywidely known due to its positive impact on financial inclusion in Kenya.
Therefore, the purpose of the RQ1 is to perform a case per case analysis to determineeach company’s role in financial inclusion in its country. Thus, the researchers conducteda quantitative approach to find a Pearson correlation between the percentage of the pop-ulation of Country (A) that are users of the FinTech (a) and the six selected demand-sideindicators per country retrieved from the Global Findex Database (Jentzsch 2012). Thisanalysis provided insightful data regarding the impact of the selected FinTech on financialinclusion in the respective country.
After solving RQ1, the following hypotheses should be confirmed or rejected.
Hypothesis 1a (H1aCountry [A]). FinTech (a) has a role in financial inclusion in Country (A).
Hypothesis 1b (H1bCountry [A]). FinTech (a) has had o role in financial inclusion in Country (A).

J. Risk Financial Manag. 2022, 15, 62 12 of 46
If the H1a is confirmed, lessons are learned from its business model and environment.However, if the H1b is approved, it is possible to identify specific factors that impede thesuccessful performance of a Fintech in its respective country.
This quantitative approach provides essential information regarding the performanceof each company in the financial inclusion in the respective country. However, to under-stand the results, it is necessary to consider the context of each company and the respectivecountry. Thus, the purpose of the RQ2 is to gather qualitative data by benchmarking the se-lected FinTechs’ business models after understanding each company and country’s context.For this reason, first, qualitative information is collected and analyzed to understand whichlessons can be learned in each to complement and understand the quantitative analysisresults properly.
For the quantitative part of this research, the principal source of information is publicdata provided by the Global Findex Data, Statista, Annual Reports, and specific informationfrom the World Bank database. For the qualitative part of this research, secondary datawere gathered from annual reports, previous research studies, and the respective websiteof the respective FinTech. Likewise, when the information needed was not available, theinformation was collected from Central Banks, Statista, or similar types of institutions.
In Figure 1, the research design is presented with problem statements, research ques-tions, and approaches used to solve them.
J. Risk Financial Manag. 2022, 15, x FOR PEER REVIEW 12 of 49
population of Country (A) that are users of the FinTech (a) and the six selected demand-side indicators per country retrieved from the Global Findex Database (Jentzsch 2012). This analysis provided insightful data regarding the impact of the selected FinTech on financial inclusion in the respective country.
After solving RQ1, the following hypotheses should be confirmed or rejected.
Hypothesis 1a (H1aCountry [A]). FinTech (a) has a role in financial inclusion in Country (A).
Hypothesis 1b (H1bCountry [A]). FinTech (a) has had o role in financial inclusion in Country (A).
If the H1a is confirmed, lessons are learned from its business model and environ-ment. However, if the H1b is approved, it is possible to identify specific factors that im-pede the successful performance of a Fintech in its respective country.
This quantitative approach provides essential information regarding the perfor-mance of each company in the financial inclusion in the respective country. However, to understand the results, it is necessary to consider the context of each company and the respective country. Thus, the purpose of the RQ2 is to gather qualitative data by bench-marking the selected FinTechs’ business models after understanding each company and country’s context. For this reason, first, qualitative information is collected and analyzed to understand which lessons can be learned in each to complement and understand the quantitative analysis results properly.
For the quantitative part of this research, the principal source of information is public data provided by the Global Findex Data, Statista, Annual Reports, and specific infor-mation from the World Bank database. For the qualitative part of this research, secondary data were gathered from annual reports, previous research studies, and the respective website of the respective FinTech. Likewise, when the information needed was not avail-able, the information was collected from Central Banks, Statista, or similar types of insti-tutions.
In Figure 1, the research design is presented with problem statements, research ques-tions, and approaches used to solve them.
Figure 1. Research design. Source: own construction of the authors.
3.2. Remarkable FinTechs in Selected Emerging Markets This section analyzes the supply side of financial inclusion by researching remarka-
ble examples of FinTechs, studied previously by different researchers and international organizations due to their innovative financial products in emerging markets. Searching for successful or outstanding FinTechs playing a role in the financial inclusion in their respective home countries was very challenging since enthusiastic researchers analyze
Figure 1. Research design. Source: own construction of the authors.
3.2. Remarkable FinTechs in Selected Emerging Markets
This section analyzes the supply side of financial inclusion by researching remark-able examples of FinTechs, studied previously by different researchers and internationalorganizations due to their innovative financial products in emerging markets. Searchingfor successful or outstanding FinTechs playing a role in the financial inclusion in theirrespective home countries was very challenging since enthusiastic researchers analyzecases of certain FinTechs. Nevertheless, after some years, the companies’ performanceinformation was discontinued; therefore, no updated knowledge can help diagnose thesecompanies through the years. Some examples are Oi Paggo in Brazil and Wizzit in SouthAfrica. Another reason why some companies were excluded from this study is that theenvironment in which they operate is not comparable to the Peruvian territory. For exam-ple, Alipay in China and Eko in India are often studied as successful case studies (McKayand Pickens 2010; Scharwatt et al. 2014). The Indian and Chinese cases were excluded forreasons related to the environment in which they flourished.
The environmental factors are exogenous conditions under which the financial sectoroperates. Its importance must be taken into consideration because they influence the devel-opment and performance of the entire system. These factors are mainly macroeconomiccontext, geographical characteristics, public policies, infrastructure, and others that impactthe supply and demand forces (Sotomayor et al. 2018). According to Rojas-Suarez and

J. Risk Financial Manag. 2022, 15, 62 13 of 46
Gonzales (2010), a precise comparison regarding financial inclusion should be betweencountries at a similar stage of development. This is due to the specific country charac-teristics and because companies adapt their services and deliver a value proposition thatsuits people’s needs (Braga et al. 2013). Therefore, the authors excluded highly developedcountries and long-term outperforming emerging countries, such as China and India. Thelatter had a high dynamic economy, a pro-growth agenda, large competitive companies,and deep connections to the global economy, adapting its international macroeconomicpractices to their local contexts over the last three decades (McKinsey Global Institute 2018).
Peruvian context is not the same since the economic performance of this countrywas improving over the last two decades thanks to this country’s outstanding financialperformance. However, due to the political instability, economic constraints, and the worstrecession in the region due to the COVID-19 pandemic, this nation cannot outperformemerging countries for this study.
The chosen companies for this study are M-PESA from Kenya, Nubank from Brazil,G-Cash from the Philippines, and Easypaisa from Pakistan due to their participation in thefinancial inclusion in their respective countries and because of the existence of previousstudy cases in which value proposition and business models that could have an impact andcontribution to financial inclusion in their respective countries were found (Damodaran2013; McKay and Pickens 2010; CGAP 2011b).
These companies are remarkable due to their important achievements, value proposi-tion, and problems they solve, and because all of them currently target the unbanked. Inthe following paragraphs, the business models of each of the previously mentioned compa-nies will be analyzed, considering some elements used by the IFC (International FinanceCorporation 2011), which are the business’ objective, strategy, target market, marketingstrategy, revenue streams, costs, transactions, users, pipeline, and model and partners.
3.2.1. M-PESA
In Kenya, the most remarkable example of a FinTech that improved financial inclusionin this country is the case of M-PESA, the first product of its kind introduced in Kenyaviewed as a successful implementation of a mobile money service that can serve as a modelin developing countries (UNCDF n.d.). In general, it was proven that poor people improvedtheir lifestyles significantly thanks to M-PESA (Barajas et al. 2020). The business model ofthis company is shown in Table 3.
Table 3. M-PESA’s business model.
Key Characteristics Analysis
Business objective
According to the IFC, M-PESA delivers a simple, fast, safe, and easymethod to move money across the country. Their main message was thesimple phrase “send money home,” which immediately engagedKenyans (International Finance Corporation 2009).
Strategy
M-PESA carefully planned several agents according to customers andtransactions to achieve its value proposition. In the beginning, registeredcustomers were enabled to send money to non-registered users with anextra fee paid by the first ones. This entire strategy created viralregistration and active and committed agent networking.However, M-PESA had to sign up a deal with the Kenyan CommercialBank (KCB) to keep money flowing in agent-to-agent transactions. Thisimprovement improved the availability of M-PESA in the market(International Finance Corporation 2009).
Target market
The early tactic of M-PESA to gain customers was targeting the poorthrough a bottom of pyramid approach and taking advantage ofSafaricom’s market share and their large customers base for rapid growthin the country (Ngugi et al. 2010).

J. Risk Financial Manag. 2022, 15, 62 14 of 46
Table 3. Cont.
Key Characteristics Analysis
Marketing strategy
The marketing strategy focused on customer education and aggressiveadvertisement of their products and services by television, radio, andsocial media.The strategy also engages local culture through a catchy advertising jingleand nationalistic branding (International Finance Corporation 2009).
Revenue streams
According to the Annual Report of Safaricom 2020, the revenue stream ofM-PESA consists basically of mobile money transfers and paymentservices. This daughter company contributes 33.6% of Safaricom’srevenue (McKay and Pickens 2010). In the previous years before thepandemic, M-PESA’s revenue is continuously growing despite theCOVID-19 crisis. The revenue in 2020 was EUR 655.32 million (84,438million Kenyan Shillings) (Safaricom PLC 2020).
Transactions
M-PESA has increased its number of transactions in recent years. Whenthe product was launched, the transactions were deposit cash, withdrawcash (registered or non-registered users), and commission per M-PESAcustomer registration (International Finance Corporation 2009).Currently, according to Safaricom (Safaricom PLC 2020), the transactionswith a charged fee are withdrawal from M-PESA agent, transfer tounregistered users, transfer to other M-PESA users, and transfer to othermobile money users. Other free-of-charge transactions are deposits,M-PESA registration, buying airtime through M-PESA, M-PESA balanceinquiry, and change of M-PESA PIN (Safaricom 2021). As an example ofone transaction cost of this company, a withdrawal from an M-PESAagent is free of charge when the amount is between (in Kshs) 1 and 49(0.0078–EUR 0.38). Nonetheless, when the amount is between 100 to 500(0.77–EUR 3.87), the charges to M-PESA are 27 (EUR 0.21). Then the costsfor this company increase accordingly to the withdrawn amount. Thehighest possible withdrawal is between 50,001 and 150,000 (EUR388.2–1164.57), and the charge is 300 (EUR 2.33) (CGAP 2011b).
Main products
Safaricom’s financial products through M-PESA offers are all based onmobile money solutions for wealth management, banking, credit, andinsurance products. These products are as follows (Safaricom PLC 2021):
- M-PESA for transfers and payments;- M-Shwari and KCB M-PESA for micro-savings and credits;- Lipa Na-MPesa allows cashless payments for goods and services;- M-PESA Global makes merchant interoperability, e-commerce, and
cross-border payments possible. This product has partnershipswith PayPal, Google Playstore, Western Union, Visa, AliExpress,and over 28 other international partners.
Users
According to the Annual Report of 2021 of Safaricom, M-PESA has 28.21million customers (Safaricom PLC 2021). In 2011, 2014, and 2017, theregistered users of this company were 13.8 million, 19.3 million, and 27million (Safaricom 2011, 2014, 2017).
Technology applied
Safaricom chose the SIM Toolkit (STK) technology with SMS delivery fordelivering mobile money transactions. With STK, the user has anapplication on the mobile phone’s SIM card accessed from the phone’smenu. This technology offers high levels of security and usability butdoes need the SIM card to be changed. Therefore, Safaricom provideshelp for users in this process International Finance Corporation (2009).
Competitors
M-PESA was a pioneer mobile money service that began withoutcompetitors, and due to its dynamic services and products approach, it isthe leading mobile money provider. By 2020 the main competitors wereAirtel Money and T-Cash.
Source: own illustration based on the guidelines for business model analysis in Mobile Money Study (InternationalFinance Corporation 2011) and specific M-PESA information gathered from different sources.
J. Risk Financial Manag. 2022, 15, 62 15 of 46
The analysis of M-PESA’s business model presents a very successful company thatbegan targeting the poorest, enabling them to realize safe and straightforward transactionscommitted with financial inclusion in Kenya. Furthermore, the company evolved sinceits beginnings because it provides more services than transfer money solutions, includingbanking, insurance services, and expansion possibilities through e-commerce and cross-border payments.
Controversially, the regulation in Kenya also allowed a mobile network operatorto play a leading role in providing bank services, despite not holding a bank license.Notwithstanding these concerns, the Central Bank of Kenya agreed to issue a letter of noobjection to allow mobile money to observe in the marketplace to inform later regulation.M-PESA has proved spectacularly successful, transforming the Kenyan economy andturning Kenya into a global trendsetter in mobile money (de Koker et al. 2020). M-PESAis not regulated under a full banking license; thus, it is essentially operating outside ofthe traditional banking regulatory environment. Still, it has been audited by the CentralBank and has received its approval for operation. This is by the European Mobile PaymentDirective, which establishes the role of payment service providers in the financial system.Banks in Kenya are aggressively lobbying the Central Bank to require M-PESA to adhere tocomplete banking regulations or halt the service. Safaricom is keen to see the Central Bankimplement the official regulatory policy that will open up the market for deposit-taking,clearing systems, and know-your-customer rules to incorporate the activities of mobileoperators. Safaricom and Vodafone have maintained a strong relationship with the CentralBank of Kenya. The Kenyan government owns 35% of Safaricom and may have made iteasier to approve the regulation (International Finance Corporation 2009). This approachalso resulted in its current market dominance, limiting space for competitors.
Regarding M-PESA’s future outlook, this company has a robust and coherent businessmodel targeting the needs of millions of unbanked in Africa. It is probably one of the bestcompanies in this sector. Therefore, their recent partnerships with Western Union, PayPal,Visa, and many others open a broader possibility to attend to other markets adapting theirbusiness model to the respective market.
3.2.2. Nubank
Nubank is a Brazilian start-up company that provides financial services, acting mainlyas a credit card operator in the domestic market. The business model of this company isshown in Table 4.
Table 4. Nubank’s business model.
Key Characteristics Analysis
Business objective
The principal value proposition of Nubank is to provide a credit cardservice, 100% digital, without annuities and fees from their clients, totallymanageable by the user on their mobile application, while providing apersonalized, friendly, and agile service. It has to be highlighted that oneof the essential points of this value proposition is the approach of a 100%digital bank feature of Nubank because it reduces the physical contactwith the company and also reduces enormous costs for the companysince it does not have personnel handling costumes (Sirota and Fratini2018). Nubank’s characteristics are their cheap, fast, and convenientproducts.
Strategy
Nubank proposes “end any complexity and return the financial control”to their users. By changing the relationship between people and howpeople treat their money, FinTech offers a different approach to banking.It aims to solve the most common problems that the Brazilian user haswhile dealing with banks and their finances, related to the complexity ofthe Financial Sector and the lack of transparency (Sirota and Fratini 2018).

J. Risk Financial Manag. 2022, 15, 62 16 of 46
Table 4. Cont.
Key Characteristics Analysis
Target market
The original target group that Nubank tried to reach was upper-class“millennials” and young professionals. People under 36 years old areborn in a digital era and are used to being in contact with technology andsophisticated smartphones (Macedo et al. 2017). However, after theservice became popular, the customer base expanded to different agesand lower-income classes with lower or no access to credit cards.Nubank presented a cheap option to facilitate access to credit cards(Nubank 2021).
Marketing strategy
Nubank employed considerable efforts in its marketing strategy becausethe main channel of marketing disclosure was through digital tools. Theyrapidly took advantage of every chance of spreading their services in afriendly, relaxed, personalized manner, providing quick and effectivesolutions. Therefore, this approach generated a positive marketing effect,reaching more customers, motivated by the network effect and marketingpromotions to “accelerate their friends” to join Nubank’s services. In thismanner, it could be said that Nubank’s marketing strategy relies on itsbrand awareness, digital marketing friendly approach, and the networkeffect of customers. Nubank also used traditional methods on specialBrazilian festive days by gifting souvenirs and encouraging them topresent them on social networks, spreading the brand using people’snetworks for that purpose (Nubank 2021).
Revenue streams
As previously explained, the main benefit of Nubank is the lack of fees.However, there are two primary revenue streams: the interchange fees onevery transaction made with the credit card and taxes over bills andinvoices, which are not pated when due. There are minor sources ofincome, such as the subscription from “Nubank Rewards.” At thebeginning of 2021, it is recently known that Nubank reported EUR 1.1million (6.8 million reals) of revenue for the first time (Banco Central doBrasil 2021).
Transactions
Nubank is today a digital bank and not only a credit card provider.Therefore, it will not be possible in this section to cover all transactions.However, the transactions that represent an essential revenue stream arethe interest on credit card debts that are not paid on time. For example, ifthe client is a good creditor, the rate could be 4%. If not, it could be up to13%.Nevertheless, the average practice by the company is 7.75%. Thecompetitors apply an average rate of 8%, which is relatively highcompared to other countries (Statista 2021). Furthermore, transactionspaid in US dollars will be changed in the domestic currency according tothe exchange rate fixed by the Brazilian Central Bank plus four percent ofeach transaction (Banco Central do Brasil 2021). Consequently, if apurchase of USD 100 is made, Nubank will gain four percent of theconversion rate, which by the 24th of August with an exchange rate ofBRL 5.3680 is BRL 21.47 (USD 3.9) (Banco Central do Brasil 2021).
Main products
In 2021, this digital bank expanded services for people and businesses,offering a digital bank account, instant payment solutions, remittancesservices, credit cards, personal loans, and insurances (Nubank 2021).Furthermore, due to this company’s rapid expansion, the partnershipwith Ripple, a blockchain company, has recently announced thecollaboration for their international remittance services.
Users
The growth of Nubank in terms of the customer base is continuouslyincreasing. In June of 2021, Nubank registered 40 million customers. In2014, the company did not have customers yet, but in 2017, Nubankreported 3 million customers (Statista 2021).
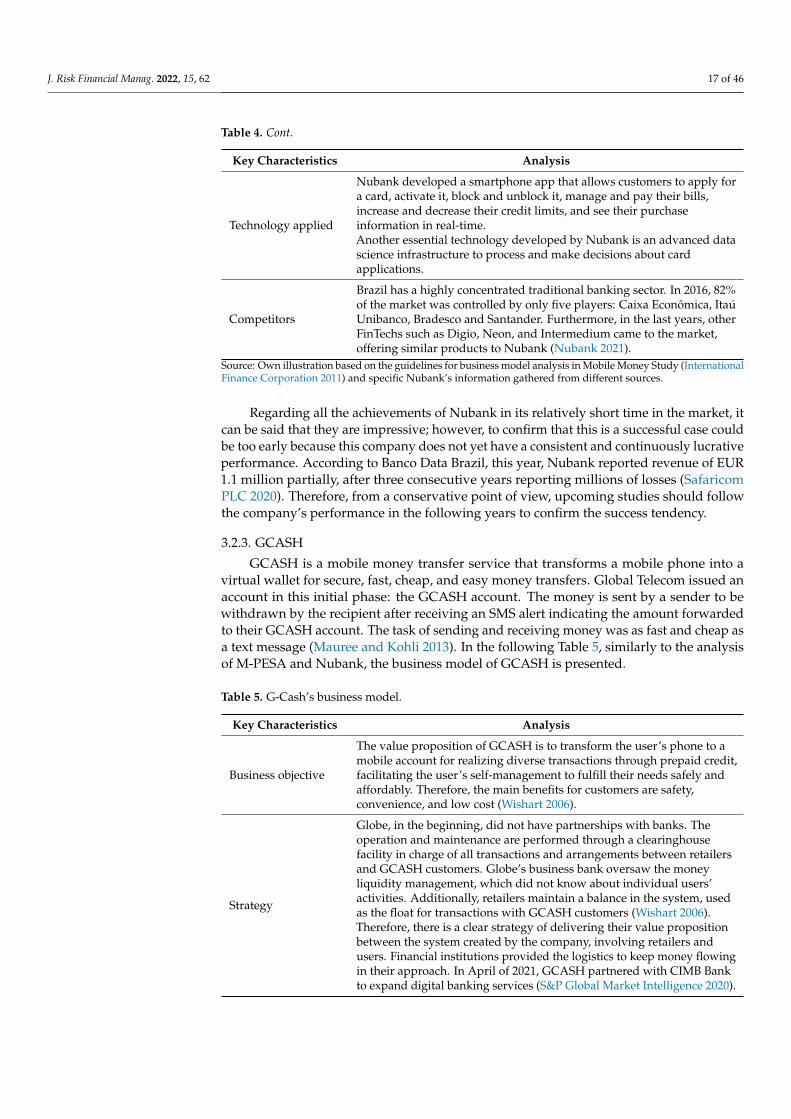
J. Risk Financial Manag. 2022, 15, 62 17 of 46
Table 4. Cont.
Key Characteristics Analysis
Technology applied
Nubank developed a smartphone app that allows customers to apply fora card, activate it, block and unblock it, manage and pay their bills,increase and decrease their credit limits, and see their purchaseinformation in real-time.Another essential technology developed by Nubank is an advanced datascience infrastructure to process and make decisions about cardapplications.
Competitors
Brazil has a highly concentrated traditional banking sector. In 2016, 82%of the market was controlled by only five players: Caixa Econômica, ItaúUnibanco, Bradesco and Santander. Furthermore, in the last years, otherFinTechs such as Digio, Neon, and Intermedium came to the market,offering similar products to Nubank (Nubank 2021).
Source: Own illustration based on the guidelines for business model analysis in Mobile Money Study (InternationalFinance Corporation 2011) and specific Nubank’s information gathered from different sources.
Regarding all the achievements of Nubank in its relatively short time in the market, itcan be said that they are impressive; however, to confirm that this is a successful case couldbe too early because this company does not yet have a consistent and continuously lucrativeperformance. According to Banco Data Brazil, this year, Nubank reported revenue of EUR1.1 million partially, after three consecutive years reporting millions of losses (SafaricomPLC 2020). Therefore, from a conservative point of view, upcoming studies should followthe company’s performance in the following years to confirm the success tendency.
3.2.3. GCASH
GCASH is a mobile money transfer service that transforms a mobile phone into avirtual wallet for secure, fast, cheap, and easy money transfers. Global Telecom issued anaccount in this initial phase: the GCASH account. The money is sent by a sender to bewithdrawn by the recipient after receiving an SMS alert indicating the amount forwardedto their GCASH account. The task of sending and receiving money was as fast and cheap asa text message (Mauree and Kohli 2013). In the following Table 5, similarly to the analysisof M-PESA and Nubank, the business model of GCASH is presented.
Table 5. G-Cash’s business model.
Key Characteristics Analysis
Business objective
The value proposition of GCASH is to transform the user’s phone to amobile account for realizing diverse transactions through prepaid credit,facilitating the user’s self-management to fulfill their needs safely andaffordably. Therefore, the main benefits for customers are safety,convenience, and low cost (Wishart 2006).
Strategy
Globe, in the beginning, did not have partnerships with banks. Theoperation and maintenance are performed through a clearinghousefacility in charge of all transactions and arrangements between retailersand GCASH customers. Globe’s business bank oversaw the moneyliquidity management, which did not know about individual users’activities. Additionally, retailers maintain a balance in the system, usedas the float for transactions with GCASH customers (Wishart 2006).Therefore, there is a clear strategy of delivering their value propositionbetween the system created by the company, involving retailers andusers. Financial institutions provided the logistics to keep money flowingin their approach. In April of 2021, GCASH partnered with CIMB Bankto expand digital banking services (S&P Global Market Intelligence 2020).

J. Risk Financial Manag. 2022, 15, 62 18 of 46
Table 5. Cont.
Key Characteristics Analysis
Target marketThe target market was to focus at the bottom of the pyramid, especiallyyoung urban consumers familiar with social media (GPFI SSBsConference 2021).
Marketing strategy
GCASH used different channels such as TV, internet, printed announces,and in-site campaigns to reach more customers. The message mainlyfocused on cheap, fast, and easy methods to send remittances.Furthermore, the company used humor, celebrities, colorful outfits, andcool ads to make the brand accessible to everyone (CGAP 2011b).
Revenue streams.
The company registers revenue streams from fees charged to many typesof transactions realized between registered users and retailers (Safaricom2014). According to Globe Telecom, GCASH in 2020 generated EUR 20.09million (1184.85 million Philippine peso) (GLOBE 2021).
Transactions.
GCASH, in the beginning, facilitated transactions such as all kinds ofpayments, transfers, withdrawals, buy load (prepaid credit), and mobilewallets (Safaricom 2011). Thanks to technological advancements, thecompany can realize more transactions such as bank transfers,investment in funds, booking movies, obtaining credits, shopping onlinefrom local and international online stores, in-store at GCASH merchants,saving money, planting trees, etc. insurance (GLOBE 2021). As anexample of a transaction using GCASH, the cost of taking cash-out is 2%of the transaction if it is made through an agent point. If someonewithdraws PHP 200 Phillippine pesos (EUR 3.39), the transaction costwill be PHP 4 (EUR 0.068). Whereas if the same transaction is made viaATM, the cost will be between PHP 10 to PHP 18 (EUR 0.17–0.31)(GLOBE 2021).
Main products
The main products are as follows (GLOBE 2021):
- GInvest: allows investing in different investment funds fromGCash’s reliable partner product providers;
- GCash wallet: allows realizing all types of electronic transactionsfrom the smartphone conveniently;
- GInsure: offers users access to various insurance products;- GCash app on the smartphone is the platform that supports all
GCASH products and transactions.
Users.
In June of 2021, Globe reported that GCASH has 33 million users andover 73,000 partner merchants in the Philippines (Safaricom 2017). In2012, 2014, and 2017, GCASH registered 1.3 million, 3 million, and 5.1million users (Dalberg 2012; GLOBE 2014; GLOBE 2017).
Technology applied
In the beginning, Globe launched GCASH with the technology known asSMS SKT (SIM Toolkit technology) because in the Philippines wasrecognized the high levels of SMS usage. Therefore, users could realizetransactions through SMS or SIM-based menus and encryption. With thisapproach, Globe emulated a banking network without having a bankingpartner (Wishart 2006). However, now GCASH conducts its otherproducts through a mobile app (Mauree and Kohli 2013).
Competitors
In the Philippines, there exist two leading mobile money providers:Smart Money, the very first company that launched mobile moneysolutions in 2001, and GCASH, which expanded better than thecompetition (Hasnain et al. 2016).
Source: own illustration based on the guidelines for business model analysis in Mobile Money Study (InternationalFinance Corporation 2011) and specific G-Cash information gathered from different sources.
After analyzing this company’s business model, similarities with M-PESA can beidentified, especially when both parent companies, Safaricom and Globe, launched eachproduct. The technology available was a SIM Toolkit, and people actively used SMS forcommunication purposes. Therefore, it is an intelligent approach to use a communication

J. Risk Financial Manag. 2022, 15, 62 19 of 46
means for making financial transactions. Another remarkable fact of this company is itsrapid expansion and continuous improvement. This company’s evolution has not been thesame since its beginnings. GCASH today’s approach proves this company is adapting tothe new times and technologies because it now offers more financial services enabled bythe latest technologies, such as the mobile app that supports all GCASH transactions.
3.2.4. Easypaisa
Tameer Microfinance Bank, the largest microfinance bank in Pakistan, and Telenorrealized a joint venture in 2008 to provide a branchless banking channel to serve existingunserved demand of financial services in Pakistan and generate a new income stream forboth companies since each company alone did not have the capabilities to fill the marketon their own. The product created by these companies was called Easypaisa, an agent andmobile-assisted payment service, and as a result, Telenor owned 51% of Tameer’s equitystructure (Mithe 2015). In Table 6, the business model of Easypaisa is presented.
Table 6. Easypaisa’s business model.
Key Characteristics Analysis
Business objective
This company was initially launched as a money transfer service, whichempowers underserved masses by providing convenience, trust, andfreedom to their lives by facilitating various mobile money services.Easypaisa operates as a branchless banking service facilitating theircustomers’ financial transactions through convenient and fast digitalizedfinancial services (Easypaisa 2021a).
Strategy
Easypaisa is a product created by the partnership of Telenor and TameerMicrofinance Bank. Each company oversaw the different tasks in thevalue chain of this product. Telenor operated the system in the agents’network, and Tameer was the core of the banking system, which washighly regulated. Easypaisa focuses on reaching low-cost deposits fromthe mass market to lower costs and increase profitability. Anotherstrategy is to expand their product portfolio by introducing moreinnovative and suitable savings products to address customer needswhile reducing capital costs—for example, insurances, credits, andenabling savings in gold (Mithe 2015).
Target market
The target market for the mobile wallet was urban users and people whoalready had bank accounts. However, the ads and promotionsconsidered a more comprehensive range of users in the initial OTC(over-the-counter) transactions (Easypaisa 2021b).
Marketing strategy
The company invested millions of dollars in marketing and producedhigh-quality advertisements. For the launch of Easypaisa, Telenorfocused on promoting and establishing the brand as a company thatwants to make people’s life easier. In the campaigns, they invested ineducation by explaining the functionality of the OTC products and thenmobile wallets. Easypaisa established awareness and trust in the newbrand through video and print ads with educative messages, explainingthat their services provide solutions to payments efficiently andconveniently (CGAP 2011a).
Revenue streamsRevenue is generated from different sources: customers (for transfertransactions), utility companies (bill payments), and corporate clients(mass disbursements) (Mithe 2015).

J. Risk Financial Manag. 2022, 15, 62 20 of 46
Table 6. Cont.
Key Characteristics Analysis
Transactions
In 2013, the principal transactions enabled by Easypaisa were as follows:diverse types of payments, P2P transfers, increased air time credits, andsaving money (Mauree and Kohli 2013). Nonetheless, by 2015, moretransactions were enabled, such as domestic and internationalremittances, salary disbursements, and savings products combined withinsurances (Mithe 2015). As an example of the costs of one type oftransaction, with withdrawal from an Easypaisa agent (in PKR) isbetween 1 and 200 (EUR 0.0052–1.04), the charge for the company will be7 (EUR 0.36). Nonetheless, when the amount is between 500 to 1000 (EUR2.56–5.12), the charges for Easypaisa are 20 (EUR 0.1). Then the chargesfor this company increase accordingly to the withdrawn amount. Thehighest possible withdrawal is between 40,001 and 50,000 (EUR207.32–259.15), and the charge is 690 (EUR 3.58) (Easypaisa 2021b).
Main products According to Easypaisa, the current products are mobile banking,various products, and insurances (Easypaisa 2021b).
Users
According to Easypaisa’s Annual Report, in 2019, the company registered30 million customers with a country-wide branch network and over 150thousand agents. Telenor continues to be a leader in FinTech in Pakistan(S&P Global Market Intelligence 2020). In 2012, 2014, and 2017, Easypaisaregistered 2 million, 6 million, and 19.9 million users (Dalberg 2012;GLOBE 2014; GLOBE 2017).
Technology applied
The technology used by Easypaisa at the beginning was the USSD mobilemoney option and at the agent transactions. Later, internet andsmartphone applications were enabled (Mithe 2015; Mauree and Kohli2013). For the smartphone applications, the leading technologies usedwere a private cloud, real-time screening for customers onboarding onEasypaisa mobile account, business intelligence analysis, cashless service,a DDoS functionality for protection against cyber-attacks, and others(Telenor Microfinance Bank 2017).
Competitors
The years after the launch of Easypaisa, other mobile money operatorsentered the market. These companies joined in alliance with differentbanks and provided various banking services. The principal competitorsare Omni and Mobicash Timepey (Mithe 2015).
Source: own illustration based on the guidelines for business model analysis in Mobile Money Study (InternationalFinance Corporation 2011) and specific Easypaisa’s information gathered from different sources.
The most noticeable fact of this company is its beginnings because it was createdwith a telecommunications company and a microfinance bank. This situation is differentfrom M-PESA and GCASH because a single company developed these examples from thebeginning. Easypaisa evolved rapidly despite the organizational and managerial issuesbetween Telenor and Tameer. According to the literature reviewed, this company continuesto lead the mobile money sector and has performed well during the COVID-19 crisis.The company recorded a 35% increase in new activations, the daily transactions went upby 17%, and the bank transfer via Easypaisa grew by 184%. Furthermore, the companyimplemented economic relief efforts for customers, free-of-cost disbursements of variousgovernment departments and private charities, facilitated donations, helped SMEs embracedigital payments, and many more (Telenor Microfinance Bank 2017).
The literature reviewed found that each company rapidly gained users improvingaccess to financial services in the respective country. In the case of Nubank, it could be saidthat it is too early to conclude that it is a successful case, but the company improved accessto credit cards in a country where the interest rates discouraged many people from accessto one.
It was analyzed and verified that each company strived to innovate and developnew, accessible, simple, cheap, and convenient new products in every case. Therefore, all

J. Risk Financial Manag. 2022, 15, 62 21 of 46
selected companies evolved since their initial development and transactions. They startedproviding specific mobile money services, and after some years, they are now providingmobile banking services without being each of their banks. In Nubank’s founder’s words,“this company is not a bank but a technology company that offers financial products thatmeet demand needs (Sirota and Fratini 2018).”
In this research, by comparing each company’s progressive growth, it can be confirmedthat mobile banking companies have enough incentives to attend to the unbanked financialneeds because all of the selected companies are profiting well enough from millions oftransactions realized by the adult population, which is continuously increasing in devel-oping economies. Furthermore, the competitiveness in this sector will foster innovationin offering other types of products for farming activities and education. All these positiveeffects of financial inclusion, according to Bill Gates, will help people to transform theirlives in emerging countries radically (Gates 2015).
The information gathered in this subsection will be analyzed after obtaining thePearson multivariable correlation analysis results in Section 3.4 to solve the second researchquestion through benchmarking, providing lessons for the Peruvian context.
3.3. The Situation of Financial Inclusion in Selected Emerging Markets
This section presents the environment-side factors in Kenya, Brazil, the Philippines,and the demand-side indicators, which will help analyze and understand the impact ofthe selected FinTechs on financial inclusion in each country. After realizing this holisticanalysis, it will be possible to find lessons for the Peruvian case.
This paper analyzes the impact of selected FinTech companies in financial inclusionin their respective countries to gain lessons of their business models and country environ-ments that can help Peruvian financial inclusion. The selected FinTechs are M-PESA inKenya, Nubank in Brazil, GCASH in the Philippines, and Easypaisa in Pakistan, whichrevolutionized the financial sector in their respective countries. However, a comparativestudy of their impact on financial inclusion in their respective country has not been per-formed yet; therefore, the lessons obtained are helpful for the Peruvian situation due totheir practical implications and because they raise possible areas for further and deeperresearch. Even though the financial markets of Kenya, Brazil, the Philippines, and Pakistananalyzed in the study show a great degree of diversity, these countries have been selectedprimarily because of successful FinTech companies operating there.
The environmental factors are exogenous conditions under which the financial sectoroperates. Its importance must be taken into consideration because they influence the devel-opment and performance of the entire system. These factors are mainly macroeconomiccontext, geographical characteristics, public policies, infrastructure, and others that impactthe supply and demand forces (Sotomayor et al. 2018). According to Rojas-Suarez andGonzales (2010), a precise comparison regarding financial inclusion should be betweencountries at a similar stage of development. This is due to the specific country characteris-tics and because companies adapt their services and deliver a value proposition that suitspeople’s needs (GLOBE 2021). Other topics considered when selecting these countries weresimilar barriers to financial inclusion, such as the geographical conditions, infrastructureavailable, and regulatory factors (Barajas et al. 2020; Braga et al. 2013).
In association with the environmental factors, demand-side elements will be presentedthat provide information regarding access and usage of financial products per country.These factors include socio-economic and demographic characteristics such as financialliteracy, multiculturality, employment status, and income levels (Sotomayor et al. 2018).
From the demand side in the selected countries, six out of more than two hundredindicators provided by the World Bank were chosen in a comprehensive dataset called “theGlobal Findex Database 2017,” which covers how adults save, borrow, make paymentsand manage risk. The last survey round was delivered in 2017, and it includes more than140 countries in the world (Demirgüç-Kunt et al. 2018).

J. Risk Financial Manag. 2022, 15, 62 22 of 46
The selected indicators for this research project were chosen considering the mostpreferred financial services in the literature review. These are accounts, mobile moneyaccounts, remittances, credit cards, debit cards, and savings (Stein et al. 2011; Barajas et al.2020). The Global Findex Database does not include insurance indicators in the dataset forthe selected countries. Therefore, the chosen indicators regarding payments, savings, andcredits are shown in Table 7.
Table 7. Selected indicators from Findex Dataset (Jentzsch 2012).
Indicator Definition
Account ownership (%age 15+):
It is defined as owning an account either at a formal financialinstitution or through a mobile money provider not linked to afinancial institution (Demirgüç-Kunt et al. 2018).
Mobile money account(% age 15+)
It is limited to services that can be used without an account at afinancial institution. This indicator measures the percentage of peoplewho used a mobile money service in the past 12 months(Demirgüç-Kunt et al. 2018).
Sent or receiveddomestic remittancesthrough a mobilephone (% age 15+)
Refers to the percentage of people who reported sending to or receivingmoney from a relative friend in the same country through a mobilephone in the past 12 months (Demirgüç-Kunt et al. 2018).
Credit card ownership(% age 15+)
Refers to the percentage of people who reported having a credit card.This is an important indicator because a credit card is a paymentinstrument and a source of credit. It is believed that the introduction ofcredit cards might have affected the demand for and use of short-termcredit (Demirgüç-Kunt et al. 2018).
Debit card ownership(% age 15+)
Debit cards are used to make direct payments and withdraw money.This definition refers to the percentage of people who reported havinga debit card (Demirgüç-Kunt et al. 2018).
Saved at a FinancialInstitution (% age 15+)
This concept refers to the percentage of people who reported saving orsetting aside money at a bank or another financial institution in the past12 months. This indicator is important to measure the savings becausehaving an account does not imply formal savings (Demirgüç-Kunt et al.2018).
Source: own illustration based on selected indicators of the Global Findex Database (Demirgüç-Kunt et al. 2018).
3.3.1. Kenya
A summarized overview of Kenya is presented in Table 8.
Table 8. Country overview—Kenya.
Characteristic Situation
Geographical conditions andpopulation distribution
Kenya has low plains rising to central highlands bisected by theGreat Rift Valley and a fertile plateau in the west. Area:224,961 sq. miles. The population in Kenya is very concentratedin the west along the shore of Lake Victoria, the capital of Nairobi,and along the Indian Ocean coast (CIA.gov 2021b).
Population
The population of Kenya between 15 and 64 years was, in theyears 2011, 2014, and 2017, 23.7, 26.1, and 28.8 million inhabitants,respectively. In 2020, the population was 31.7 million (World Bank2020c).
Infrastructure available(mobile phone penetration)
By 2019, the mobile phone subscriptions per 100 inhabitants were104.22 (CIA.gov 2021b).

J. Risk Financial Manag. 2022, 15, 62 23 of 46
Table 8. Cont.
Characteristic Situation
The rule of law
According to the Rule of Law index, Kenya is ranked in the 102ndposition out of 128 countries, and its score is 0.45, which meanslaw enforcement and the institutions are weak and that there arecorruption problems in this country (The World Justice Project2020).
Financial literacy In 2015, a survey found that 38% of the Kenyan population wasfinancially literate Klapper et al. 2015).
Banking concentration In 2017, 36.6% of the market was concentrated in a few banks(World Bank 2020c).
Multiculturality
The principal ethnic groups are Bantu, Nilo-Saharan, Afro-Asiatic,and others. The main languages spoken in this country areEnglish, Kiswahili, and numerous indigenous languages. InKenya, there is religious diversity (CIA.gov 2021b).
Employment to populationratio
In 2019, the pre-pandemic year, the employment rate in Kenyawas 72.31% (World Bank 2020c).
Gross National Income percapita In 2020 the GNI per capita was USD 1760 (World Bank 2020c).
Source: own illustration based on specific information about Kenya.
A synthesized diagnosis of the Kenyan context of financial inclusion is shown inTable 9.
Table 9. Selected indicators regarding financial inclusion in Kenya.
Indicator 2011 2014 2017
Account ownership (% age 15+): 42% 75% 82%Mobile money account (% age 15+) - 58% 73%
Sent or received domestic remittances through amobile phone (% age 15+) - 64% 63%
Credit card ownership (% age 15+) 6% 5% 6%Debit card ownership (% age 15+) 30% 35% 38%
Saved at a Financial Institution (% age 15+) 23% 30% 27%Source: own illustration based on the Global Findex Database (Demirgüç-Kunt et al. 2018).
For Kenyan’s case, it can be said that mobile money accounts, bank accounts, andremittances are more accessible and reliable products than debit or credit cards from thisinitial data. The low saving culture can be related to a lack of trust in financial institutions,poor financial literacy rates, and the economic constraints of households, considering thatKenya is a lower-middle-income country in Africa. One of the reasons why credit cardownership remains very low in this country can be related to the concurrence of predatorylending by FinTech companies. Due to this reason, the parliament of Kenya consideredregulating non-cash payments and establishing an authority called the Financial MarketConduct Authority to oversee FinTech companies. Moreover, a data protection law wasimplemented to protect personal financial information (Economist Intelligence Unit 2019).
The overall financial inclusion score is above the average (55/100) in the region andthe group of lower-middle-income peers. The government and policy support, marketstability and integrity, and consumer protection rules and infrastructure have an above-average score, indicating that this country’s financial inclusion environment is favorable.However, the dimension of products and outlets means challenges because the scoreobtained (33/100) locates Kenya far under average peer countries in Sub-Saharan Africaand lower-middle-income countries (Economist Intelligence Unit 2019).

J. Risk Financial Manag. 2022, 15, 62 24 of 46
3.3.2. Brazil
Table 10 presents a brief general overview of this country.
Table 10. Country overview—Brazil.
Characteristic Situation
Geographical conditionsand populationdistribution
The territory of Brazil is primarily flat, but there are some rollinglowlands in the north, some plains, hills, mountains, and a narrowcoastal belt. Area: 3 million sq. miles. Most of the population livesalong the Atlantic coast in the east, mainly in Sao Paolo, Brasilia, andRio de Janeiro (CIA.gov 2021a).
PopulationThe adult population in Brazil (ages 15 to 64) in 2020 was roughly148.1 million. In 2011, 2014, and 2017, the population was 135.6, 140.7,and 144.8 million inhabitants, respectively (World Bank 2016).
Infrastructure available(mobile phonepenetration)
By 2019, the subscriptions per 100 inhabitants were 123.76 (CIA.gov2021a).
The rule of law
According to the Rule of Law index, Brazil is ranked in the 67thposition out of 128 countries, and its score is 0.52, which means thelaw enforcement and the institutions are weak and that there arecorruption problems in the government (The World Justice Project2020).
Financial literacy In 2015, a survey found that 35% of the Brazilian population wasfinancially literate (World Bank 2016).
Banking concentration In 2017, 56.6% of the market was concentrated in a few banks (WorldBank 2020a).
Multiculturality
The ethnic groups living in Brazil are white 47.7%, mulatto 43.1%(mixed white and black), black 7.6%, Asian 1.1%, and indigenous0.4%.The most widely spoken language is Portuguese. However, there aremany minor Amerindian languages (CIA.gov 2021a).
Employment topopulation ratio
In 2019, the pre-pandemic year, the employment rate in Brazil was56.7% (World Bank 2020a).
Gross National Incomeper capita In 2020 the GNI per capita was USD 7850 (World Bank 2021a).
Source: Own illustration based on specific information about Brazil.
A synthesized diagnosis of the Brazilian context of financial inclusion is shown inTable 11.
Table 11. Selected indicators regarding financial inclusion in Brazil.
Indicator 2011 2014 2017
Account ownership (% age 15+): 56% 68% 70%Mobile money account (% age 15+) - 1% 5%
Sent or received domestic remittances through amobile phone (% age 15+) - 0% 1%
Credit card ownership (% age 15+) 29% 32% 27%Debit card ownership (% age 15+) 41% 59% 59%
Saved at a Financial Institution (% age 15+) 10% 12% 14%Source: Own illustration based on the Global Findex Database (Jentzsch 2012).
Brazil’s overall financial inclusion score is superior to the average in Latin Americanand Caribbean countries and the group of upper-middle-income countries. The supplyside of products and outlets has improved in presence and quality. It could be said that thispositive outcome in 2020 was due to the efforts of the government, the Central Bank, andthe financial sector of Brazil.

J. Risk Financial Manag. 2022, 15, 62 25 of 46
3.3.3. The Philippines
In Table 12, a brief general overview of this country is presented.
Table 12. Country Overview—The Philippines.
Characteristic Situation
Geographical conditions andpopulation distribution
The Philippines is an archipelagic country composed of islands,mountains, and extensive coastal lowlands. Area: 115,831 sq.miles. The population in this country is concentrated where goodfarmlands lie, principally in the north of the country (Luzon),some islands, and in the capital city, Manila, where one-eighth ofthe entire national population resides (CIA.gov 2021e).
Population
The adult population in the Philippines (ages 15 to 64) in 2020was roughly 70.6 million. In 2011, 2014, and 2017, the populationwas 59.3, 63.1, and 66.8 million inhabitants, respectively (WorldBank 2021a).
Infrastructure available(mobile phone penetration)
By 2019, the subscriptions per 100 inhabitants were 155.61(CIA.gov 2021e).
The rule of law
According to the Rule of Law index, the Philippines is ranked inthe 91st position out of 128 countries, and its score is 0.47, whichmeans that law enforcement and the institutions are weak andthat there are corruption problems in the government (The WorldJustice Project 2020).
Financial literacy In 2015, a survey found that 25% of the population was financiallyliterate (Klapper et al. 2015).
Banking concentration In 2017, 47.4% of the market was concentrated in a few banks(World Bank 2021a).
Multiculturality
This country is culturally very diverse. There are more than sevenethnic groups dispersed in its territories. Therefore, there aremany languages and dialects as well. Nevertheless, the officiallanguage is Filipino and English (CIA.gov 2021e).
Employment to populationratio
In 2019, the pre-pandemic year, the employment rate in thePhilippines was 58.79% (World Bank 2021a).
Gross National Income percapita In 2020, the GNI per capita was USD 3430 (World Bank 2021a).
Source: Own illustration based on specific information about the Philippines.
Before the COVID-19 crisis, the country had made progress in inclusive growth,declining poverty rates, and increasing real wages, which generated dynamic consumptionbehaviors. Table 13 presents a synthesized diagnosis of the Philippines’ context of financialinclusion.
Table 13. Selected indicators regarding financial inclusion in the Philippines.
Indicator 2011 2014 2017
Account ownership (% age 15+): 27% 31% 34%Mobile money account (% age 15+) - 4% 5%
Sent or received domestic remittances through amobile phone (% age 15+) - 6% 5%
Credit card ownership (% age 15+) 3% 3% 2%Debit card ownership (% age 15+) 13% 20% 21%
Saved at a Financial Institution (% age 15+) 15% 15% 12%Source: own illustration based on the Global Findex Database (Demirgüç-Kunt et al. 2018).
The indicators of financial inclusion in the Philippines are low. Account and debitcard ownership represents the higher percentage, showing progress through the years.

J. Risk Financial Manag. 2022, 15, 62 26 of 46
However, the other indicators remain low. These results indicate an essential gap to providesuitable financial products and services to the population’s needs.
This country, since 2016, has created a governmental institution that guides andoversees the implementation of the National Strategy for Financial Inclusion, which placesa particular focus on digital financial inclusion and financial and digital literacy. However,an important issue was ensuring interoperability in retail payments because of the limitednumber of operators and the high transaction costs (Economist Intelligence Unit 2019).
The present outlook of financial inclusion in the Philippines is promising. This countrywas recognized in 2016 as an ideal place for developing digital and financial products andservices due to its large young population, positive annual GDP growth, fast-growinginternet penetration, and mobile phones engagement. Therefore, Smart Money and GCASHapproached this market in new ways (Hasnain et al. 2016).
The overall financial inclusion score is higher than peers in East and South Asia andhigher than in lower-middle-income countries. This outcome is a positive sign that themeasures introduced by authorities since 2016 may have provided better governmental andpolicy support, stability to the financial system, and consumer protection rules. Therefore,the supply of products and services has increased, and this country’s overall financialinclusion situation has improved. However, there are still gaps to improve, especiallyregarding implementing adequate infrastructure to connect this country’s remote rural andlow populated areas.
3.3.4. Pakistan
In Table 14, a brief general overview of this country is presented.
Table 14. Country overview—Pakistan.
Characteristic Situation
Geographical conditions andpopulation distribution
The territory of this country is divided into three majorgeographic areas, the northern highlands, the Indus River plain inthe center and east, and the Balochistan Plateau in the south andwest. Area: 339,697 sq. miles. The population in this country isconcentrated in the largest cities, such as Karachi and Lahore(CIA.gov 2021c).
Population
The adult population in Pakistan (ages 15 to 64) in 2020 wasroughly 134.3 million.In 2011, 2014, and 2017, the population was 107.1, 116, and 125.1million inhabitants, respectively (World Bank 2020b).
Infrastructure available(mobile phone penetration)
By 2019, the subscriptions per 100 inhabitants were 72.33(CIA.gov 2021c).
The rule of law
According to the Rule of Law index, Pakistan is ranked in the120th position out of 128 countries. Its score is 0.39, which meanslaw enforcement and institutions are feeble, and this country hasserious corruption problems (The World Justice Project 2020).
Financial literacy In 2015, 26% of the Pakistani population was financially literate(World Bank 2020b).
Banking concentration In 2017, 44.1% of the market was concentrated in a few banks(World Bank 2020b).
MulticulturalityPakistan is a very diverse country. There are around sevendifferent ethnic groups and languages in the same region(CIA.gov 2021c).
Employment to populationratio
In 2019, the pre-pandemic year, the employment rate in Pakistanwas 50.42% (World Bank 2020b).
Gross National Income percapita In 2020, the GNI per capita was USD 1280 (World Bank 2020b).
Source: own illustration based on specific information about Pakistan.

J. Risk Financial Manag. 2022, 15, 62 27 of 46
Table 15 presents a synthesized diagnosis of the Pakistani context.
Table 15. Selected indicators regarding financial inclusion in Pakistan.
Indicator 2011 2014 2017
Account ownership (% age 15+): 10% 13% 21%Mobile money account (% age 15+) 6% 7%
Sent or received domestic remittances through amobile phone (% age 15+) 1% 5%
Credit card ownership (% age 15+) 1% 0% 1%Debit card ownership (% age 15+) 3% 3% 8%
Saved at a Financial Institution (% age 15+) 1% 3% 6%Source: own illustration based on the Global Findex Database (Demirgüç-Kunt et al. 2018).
In this country, the financial inclusion indicators are shallow. From 2011 to 2017, theimprovement of each indicator has increased but not inclusively. In 2017, only 21% ofadults had a bank account, 7% a mobile money account, and low other indicators.
The overall financial inclusion in Pakistan is above average among lower-middle-income countries and East and South Asia groups. According to this evaluation, thegovernmental policies and support and consumer protection environment have improved.The scores for the availability of products and outlets and the infrastructure that supportsfinancial services and products are above average, indicating an improvement compared tolower financial inclusion indicators of the Global Findex Database in 2017.
A summary of every country’s environment overview is presented in Appendix Ato comprehend the situation of the analyzed countries from a comparative and holisticperspective.
3.4. Pearson Multivariable Correlation Analyses
This subsection develops four Pearson multivariable correlation analyses to searchif the presence of the FinTech (a) in Country (A_—the percentage of the population ofCountry (A) that is a customer of FinTech (a)—has a linear relationship with the mostcommon and basic financial inclusion indicators studied in Sections 3.2 and 3.3. Table 16presents the independent and dependent variables.
Table 16. Independent and dependent variables.
Independent Variable The Population of Country (A) and User of FinTech (a)
Dependent variables
1. Account (% age 15+)2. Mobile money account (% age 15+)3. Sent or received domestic remittances: through a mobile
phone (% age 15+)4. Credit card ownership (% age 15+)5. Debit card ownership (% age 15+)6. Saved at a financial institution (% age 15+)
Source: own illustration based on data from Global Findex Database (Demirgüç-Kunt et al. 2018).
The purpose of conducting a Pearson correlation analysis is to find if the respectiveFinTech has a role in financial inclusion in the respective country.
3.4.1. M-PESA in Kenya
To analyze if M-PESA has a role in Kenya’s financial inclusion, the percentage of thepopulation in Kenya that is M-PESA registered users must have been known. Table 17illustrates this procedure.

J. Risk Financial Manag. 2022, 15, 62 28 of 46
Table 17. Calculation of population of Kenya that is M-PESA user (%).
Users of Fintech (a) in Country (A) 2011 2014 2017
M-PESA Customers (million) 13.8 19.3 27.0The population of Kenya above 15 years (million) 23.7 26.2 28.8
The population of Kenya as M-PESA users above 15 years (%) 58.23 73.66 93.75Source: own illustration based on World Bank database (Pinar Ardic et al. 2011) and Safaricom (2021).
After this first simple calculation, the corresponding step is to conduct a multivariablecorrelation analysis between the independent variable “population of Kenya that is M-PESAuser” and the six selected financial inclusion indicators shown in Table 18.
Table 18. Correlation analysis for M-PESA in Kenya.
The Population of Kenya as M-PESA Usersabove 15 Years
The population of Kenya as M-PESA usersabove 15 years 1.00
Account (% age 15+) 0.91Mobile money account (% age 15+) 0.92
Sent or received domestic remittances througha mobile phone (% age 15+) 0.82
Credit card ownership (% age 15+) −0.19Debit card ownership (% age 15+) 0.98
Saved at a financial institution (% age 15+) 0.44Source: own illustration.
This analysis indicates a very high correlation of the percentage of the population ofM-PESA’s customers in Kenya and the ownership of an account, mobile money account,and debit card ownership. Likewise, a high correlation between the independent variableand the percentage of people who sent or received domestic remittances through a mobilephone can be identified.
Considering that this company generates most of its revenue from mass transactionssuch as transferences and payments, these results make sense.
Regarding the technology applied (SIM toolkit), which initially required the change ofold SIM cards, it did not discourage people from registering with M-PESA. This result canindicate that the benefit of accessing financial services was more significant than the hassleand cost of changing a SIM card.
These results also identified a moderate correlation between the independent variableand the percentage of people who saved at a financial institution and a negative correlationwith credit card ownership.
This outcome can be explained considering that M-PESA’s value proposition, market-ing strategy, and revenue stream, in the beginning, were not focused on fostering a savingsculture or giving credits. This research found that M-PESA’s expansion to banking servicessuch as savings began in 2012 when this company partnered with the Commercial Bankof Africa (Safaricom 2014). Therefore, it will be interesting to analyze this indicator in theupcoming years.
From the demand side, a reason that could explain the low percentage of people whosaved at a financial institution remains basically on Kenya’s lower financial literacy rate(38%) and the low GNI per capita in this country.
Considering that most of the indicators present a positive high and very high cor-relation, the answer to RQ1M-PESA is that M-PESA effectively has a role in the financialinclusion in Kenya across many of its dimensions. Hence, H1aKenya can be confirmedbecause these results verify that M-PESA positively affects financial inclusion in Kenya,and there will be lessons to be learned from its business model.
After analyzing the results, RQ2M-PESA can be answered by describing the lessonslearned of the characteristics of M-PESA’s business model and country environment. There-

J. Risk Financial Manag. 2022, 15, 62 29 of 46
fore, one of the possible success factors is M-PESA’s strategy of focusing on specific essentialfinancial products and targeting masses with simple messages; educating people about thebenefits of accessing and using formal financial services; the planned and scaled installa-tion of the agents’ network; and engaging with local culture and active agent networking.Moreover, the scaled price structure of one of the services (withdrawals) indicates the lowercost of realizing transactions, which could have had a positive incentive on Kenyans tolearn multiple transactions due to the lower costs involved.
The lesson gained regarding the technology applied for M-PESA at the beginning(SMS Toolkit) is its simplicity in delivering essential financial services because it proved tohave higher benefits than banking sector services. After all, if installing a new mobile SIMcard is cheaper and easier than going to a bank access point, then it is likely that peoplewill decide to obtain a mobile SIM card to realize transactions even from home.
Finally, another characteristic to be observed from the Kenyan environment is thelower concentration of the financial sector, the fewer direct competitors of M-PESA, anda clear regulatory framework that probably fostered the first actions of this companyefficiently. However, it was noted that recently the government implemented regulationsfor lenders and customer protection, which can impact the indicator regarding savings inthe future.
3.4.2. Nubank in Brazil
Table 19 presents Brazil’s Nubank users (the independent variable).
Table 19. Calculation of population of Brazil that is Nubank user (%).
Users of Fintech (a) in Country (A) 2011 2014 2017
Nubank Customers (million) 0.0 0.0 3.0The population of Brazil above 15 years (million) 135.6 140.6 144.8
The population of Brazil as Nubank users above 15 years (%) 0.00 0.00 2.07Source: own illustration based on World Bank (World Bank 2016) database and Statista (2021).
In this case, a complete evaluation could not be performed due to the lack of data.However, it was possible to find the following with the available data shown in Table 20.
Table 20. Correlation analysis for Nubank in Brazil.
The Population of Brazil as Nubank Usersabove 15 Years
The population of Brazil as Nubank usersabove 15 years 1.00
Mobile money account (% age 15+) 0.99Credit card ownership (% age 15+) −0.83
Source: own illustration.
From these results, a high correlation between Brazil’s population, Nubank users, andthe percentage of people who own a mobile money account can be confirmed. However,there is a high negative correlation with the percentage of people who own a credit card.These results can be explained by the lower rate of mobile money accounts in Brazil in 2017and the increasing popularity and new subscriptions to Nubank in the same year.
Although these results indicate that Nubank has no role in financial inclusion inBrazil, it could be interesting to know the results from 2017 to 2021. Up to date, Nubankhas 40 million customers in Brazil (Statista 2021), which means that this year, 27% of thepopulation of Brazil older than 15 years is a customer of Nubank. The insufficient data forconducting this correlation analysis made it necessary to search for another similar indicatorfound in the Brazilian Central Bank database. After retrieving information regarding thechange of credit activity of households from 2015 to 2020 (The World Bank 2021), the reportwas complete for conducting correlation analysis, as shown in Table 21.

J. Risk Financial Manag. 2022, 15, 62 30 of 46
Table 21. Indicators to analyze Brazil (2015–2020).
Indicators 2015 2016 2017 2018 2019 2020
The population of Brazil asNubank users above 15 years (%) 0.3 0.9 2.0 4.0 7.0 17.0
Credit operations (12-month %)change households −10.6 −12.4 11.0 17.7 21.5 9.0
Source: own illustration based on information collected from the Brazilian Central Bank (World Bank 2020a) andNubank (Nubank 2021).
The independent variable remains the percentage of the Brazilian population ofNubank customers, and the dependent variable is credit operations (12-month % change inhouseholds). The proportion of Nubank’s customers was obtained from Statista, consider-ing the current clients of this company and the total population of Brazil from 2016 to 2020(Statista 2021). In Table 22, the correlation analysis between these mentioned variables ispresented.
Table 22. Correlation analysis for Nubank in Brazil.
The Population of Brazil as Nubank Usersabove 15 Years (%)
The population of Brazil as Nubank usersabove 15 years (%) 1.00
Credit operations (12-month %) changehouseholds 0.44
Source: own illustration.
This correlation analysis shows a non-significant correlation between customers ofNubank in Brazil and the credit operations in this country. Therefore, the answer toRQ1Nubank is that Nubank does not have a significant role in financial inclusion in Brazil.Hence, H1Brazil is confirmed because after conducting these correlation analyses, the resultsindicate that Nubank does not have a role in financial inclusion in Brazil.
After analyzing the results, RQ2Nubank can be answered by identifying factors thatimpeded the impact of Nubank on financial inclusion in Brazil. These factors could be thehigh banking concentration, lower employment rate despite a middle-high GNI per capita,and lower financial literacy rates. Additionally, Brazil’s extensive territory and populationare concentrated in large cities, and being culturally diverse, among other factors, couldhave harmed financial inclusion in this country, making it difficult for companies to providemobile money solutions to people living in remote areas who speak another language.
What is remarkable about Nubank is its ability to challenge a high concentrated marketby providing no fees, fast, easy, and convenient 100% digital financial services. The valueproposition and the revenue stream of this start-up ensured its rapid growth and its positiverevenue in the year 2020, during the COVID-19 crisis, indicates that Nubank is positioningin the Brazilian financial sector, and it will be interesting to analyze if in the upcomingyears this company will have an impact on financial inclusion in Brazil.
3.4.3. GCASH in the Philippines
Table 23 presents how the percentage of the population in the Philippines that isGCASH users was calculated.

J. Risk Financial Manag. 2022, 15, 62 31 of 46
Table 23. Calculation of population of the Philippines as GCASH user (%).
Users of Fintech (a) in Country (A) 2011 2014 2017
GCASHCustomers (million) 1.3 3.0 5.1The population of the Philippines above 15 years (million) 59.4 63.2 66.9
The population of the Philippines as GCASH users above 15 years (%) 2.19 4.75 7.62Source: own illustration based on World Bank database (World Bank 2020d) and Globe (GLOBE 2014; GLOBE2017).
Table 24 presents the multivariable correlation analysis for GCASH in the Philippinesto determine if this company has a role in financial inclusion in this country.
Table 24. Correlation analysis for GCASH in the Philippines.
The Population of the Philippines asGCASH Users above 15 Years
The population of the Philippines as GCASHusers above 15 years 1.00
Account (% age 15+) 0.99Mobile money account (% age 15+) 0.88
Sent or received domestic remittances througha mobile phone (% age 15+) 0.79
Credit card ownership (% age 15+) −0.87Debit card ownership (% age 15+) 0.88
Saved at a financial institution (% age 15+) −0.87Source: own illustration.
The results indicate a very high correlation of the independent variable (Populationof the Philippines and GCASH users) and the dependent variable account ownership.Likewise, a high correlation is visible with the following variables: mobile money account,sent or received domestic remittances, and debit card ownership. There are two highnegative correlations with the variables: credit card ownership and savings at a financialinstitution.
The high coefficient correlations obtained make sense because GCASH generates mostof its revenue from remittances, payments, deposits, withdrawals, purchases, and otherseasily realized through mobile money accounts, bank accounts, and debit cards.
The results obtained indicate that the strategy of this company to deliver its valueproposition was successful because it gained customers constantly in the studied period,and it has expanded its customer base even during the COVID-19 crisis (from 1.3 millioncustomers in 2011 to 33 million in 2021). Therefore, it is logical that GCASH impacts thesedimensions of financial inclusion in the Philippines.
From the demand side, the obtained results make sense because the constant growth ofthis country’s population, high mobile phone subscriptions, and increasingly middle-classpopulation (GNI per capita USD 3530 in 2017) facilitate consumption and encourage savinghabits there is a need to circulate money. This overall situation is optimal for a provider ofmobile money services, such as GCASH.
The Philippine environment contributes to the results because the complex geographyconditions of this archipelagic country and the weak institutions and law enforcement dis-courage the traditional banking sector from building branches or access points. Therefore,where traditional banks do not have incentives to expand, mobile money operators have alower risk of offering essential financial services.
The results present that GCASH has a high negative correlation coefficient withthe percentage of people who saved at a financial institution and credit card ownership.This outcome makes sense because, differently from M-PESA, G-CASH did not applyeducational content in its marketing campaigns nor a strategy that brings together thedifferent ethnic groups in this country. Furthermore, the lack of know-how of the banking

J. Risk Financial Manag. 2022, 15, 62 32 of 46
sector could influence this negative outcome. Again, from the environment side, thesenegative coefficient correlation results make sense because financial literacy in this countryis weaker than in Kenya, indicating the limited knowledge of fundamental financial aspectssuch as the benefits of saving, the calculation of interest rates, or how to avoid over-indebtedness.
After evaluating the results, and overall positive correlation was found with most de-pendent variables. The answer to RQ1GCASH is that GCASH has a role in financial inclusionin the Philippines across many dimensions. Hence, H1aPhilippines can be confirmed becausethese results verify that GCASH positively affects financial inclusion in the Philippines,and there will be lessons to be learned from its business model.
After analyzing the results, RQ2GCASH can be answered by describing the lessonslearned of the characteristics of the business model and country environment of GCASH.Therefore, one of the possible success factors is GCASH’s initial strategy by delivering itsvalue proposition—facilitate mobile money transactions through prepaid credit—via thesystem created by Globe telecom and the agent points, without the participation of banks.This initial approach could have given the company the flexibility to provide services thatthe traditional financial sector managed.
Regarding the lower correlations with credit cards and services, an important lesson tobe learned is the importance of alliances with banks to expand the provision to traditionalfinancial services such as savings accounts, credit cards, and others due to the exclusiveknow-how that banks possess, which could complement the innovative technologies that aFinTech provides. Nonetheless, the outcome of alliances with banks to offer other types offinancial services such as borrowings or investments should be analyzed in the upcomingyears after GCASH has adapted its business model and value proposition to the newproducts and services provided.
Likewise, in M-PESA’s case, an important lesson is to service technology easy toadapt and obtain. The SIM Toolkit technology requires changing the original SIM card.Still, when the benefits and conveniences to the users are more significant than accessingtraditional banking access points, people will likely decide to obtain a mobile SIM card tomake transactions from home.
3.4.4. Easypaisa in Pakistan
Table 25 presents the calculation of the percentage of the population in Pakistan asEasypaisa users, which is the independent variable.
Table 25. Calculation of population of Pakistan as Easypaisa user (%).
Users of Fintech (a) in Country (A) 2011 2014 2017
Easypaisa Customers (million) 2.0 6.0 19.9The population of Pakistan above 15 years (million) 107.1 116.1 125.2
The population of Pakistan as Easypaisa users above 15 years (%) 1.87 5.17 15.89Source: own illustration based on World Bank database (World Bank 2020d) and Globe (GLOBE 2014; GLOBE2017).
The obtained data are used to conduct the multivariable correlation analysis thataims to understand the relationship between the independent variable and the financialinclusion indicators for this country. In Table 26, the results are presented.
The results indicate a very high coefficient correlation of the independent variable andmost of the dependent variables, such as account ownership and the percentage of peoplewho sent or received domestic remittances through mobile phones, debit card ownership,and savings at a financial institution. There is a high coefficient correlation with the variablemobile money accounts and a moderate correlation with credit card ownership.
The overall outcome of the correlation analysis indicates that despite Easypaisa’sinfluence on financial inclusion in Pakistan, most of the Pakistani population in 2017did not have access to financial services. Nevertheless, the high and positive coefficient

J. Risk Financial Manag. 2022, 15, 62 33 of 46
correlations could indicate that Easypaisa strives to reach more customers. Still, the entireenvironment of the country and the demand side factor is not optimal.
Table 26. Correlation analysis for Easypaisa in Pakistan.
The Population of Pakistan as EasypaisaUsers above 15 Years
The population of Pakistan as Easypaisa usersabove 15 years 1.0000
Account (% age 15+) 0.9999Mobile money account (% age 15+) 0.7819
Sent or received domestic remittances througha mobile phone (% age 15+) 0.9981
Credit card ownership (% age 15+) 0.5695Debit card ownership (% age 15+) 0.9769
Saved at a financial institution (% age 15+) 0.9846Source: own illustration.
Back to the correlation analysis, it was found that Easypaisa, in contrast to M-PESA andGCASH, strongly influences the percentage of people who saved at a financial institutionand has a moderate influence on credit card ownership. This result is remarkably differentbecause M-PESA and GCASH did not influence those products.
Since the results indicate an overall positive high and very high correlations, theanswer to RQ1Easypaisa is that Easypaisa has an essential role in the financial inclusion inPakistan in many of its dimensions. Hence, H1aPakistan can be confirmed because theseresults verify that Easypaisa positively affects financial inclusion in Pakistan, and there willbe lessons from its business model.
After analyzing the results, RQ2Easypaisa can be answered by describing the lessonslearned of the characteristics of Easypaisa’s business model and country environment. Oneof the possible success factors of this company is the original partnership by Telenor andTameer Microfinance Bank because it provided this company’s value proposition enoughknow-how to design various financial products.
Therefore, the lesson to be learned from Easypaisa’s strategy is the critical valuethat financial institutions contribute to FinTech regarding the know-how of typical andtraditional financial services and products. This reason probably influences Easypaisa’shigher impact on credits and savings. Furthermore, the strategy applied by adapting theirproducts to people’s needs and investing in high-quality and educative advertisementsis probably some of the additional reasons for the high impact of Easypaisa on Pakistanifinancial inclusion.
Another success factor could have been the scaled price structure of one of Easypaisa’sservices. In the example of withdrawals, the cost involved in making this transaction ismeager. Like M-PESA and GCASH, the prices are affordable for all population sectors.Therefore, the access and usage of Easypaisa’s system increased over the years. Nonetheless,a large population sector is still excluded from these services.
The lesson gained regarding the technology applied for Easypaisa (USSD menu en-cryption) to deliver essential financial services requires learning the mobile’s menu optionsto send and receive money through agents. Unlike M-PESA and GCASH, this approachdid not require changing the SIM card. Indeed, it was a success factor because if learning amobile-based program is cheaper and easier than going to a bank access point, people willlikely decide to learn this program.
4. Discussion: Lessons for Peruvian Financial Inclusion
After analyzing the role of each studied company in financial inclusion in their re-spective countries, several lessons were learned for the Peruvian situation. The Peruviancontext in 2017 reported shallow indicators in financial inclusion, which can be explaineddue to the complicated geographical conditions that exclude remote areas in the Andes and

J. Risk Financial Manag. 2022, 15, 62 34 of 46
the jungle. Moreover, the population is highly concentrated in the big cities, which createsincentives for mobile operators and banks to attend to the demand in these big cities.
The demand side found that the GNI per capita is USD 6010, with higher employmentrates and high mobile phone subscriptions per 100 inhabitants (123.7). Therefore, it could besaid that any mobile money operator would have significantly impacted financial inclusionif the optimal conditions for this type of project were given.
Furthermore, it could be assumed that multiculturality, language diversity, and lowerfinancial literacy could not be determinant barriers to mobile money operators. In countriessuch as Kenya, the Philippines, and Pakistan, these factors did not impede the expansionof mobile money operators. This specific situation can be part of a deeper study, but thisexploratory research indicates that other companies had success despite similar unfavorableconditions.
From the supply side, the most crucial observation is the high banking concentrationin this country (72.7%). This indicator implies high barriers for competitors to enter thismarket.
Nevertheless, there are lessons that the studied cases have provided. Firstly, theneed for partnerships between banks and FinTechs because both companies complementtheir value proposition to be delivered properly. Bim’s approach and the existing mobilewallets can likely disrupt financial inclusion in Peru. A future study can confirm thishypothesis when there are enough public data. Nonetheless, regulation incentives mustorient companies to facilitate the access and usage of financial services and not fight formarket share.
Secondly, FinTechs and banks should conduct marketing strategies with a highlyeducational message that reaches all the population and engages with local culture. As ob-served in the case of M-PESA and Easypaisa, this strategy creates confidence and incentivesfor people to access and use financial services.
Thirdly, the low cost of the charges to each transaction is one of the most importantaspects because the benchmarking realized was compared three hypothetical transactionsand the respective charges. In Table 27, the details are presented.
Table 27. Comparison price structure of withdrawals.
M-PESA CASH EASYPAISA
Withdrawal amount (KES) 100–500(EUR) 0.77–3.87
(PHP) 200(EUR) 3.39
(PKR) 500–1000(EUR) 2.56–5.12
Charge (KES) 27(EUR) 0.21
(PHP) 4(EUR) 0.068
(PKR) 20(EUR) 0.1
Source: own illustration based on M-PESA (Safaricom 2021), Globe (GLOBE 2014; GLOBE 2017), and Easypaisa(Easypaisa 2021b).
The price of each transaction is considerably low compared to the amount withdrawn.In this case, Peruvian FinTechs can pursue a lower cost to gain users due to the highbanking concentration and high competition.
Finally, the technology to be applied must be easy to use and understand for all typesof users, whether poorer or wealthier. Therefore, the SIM Toolkit and USSD technologiesshould be available for all mobile operators because these technologies have proven tofacilitate mobile money transactions. Thus, smartphone applications can discourage thepoorer sectors of the population from accessing BIM or other mobile wallets since allpopulation segments cannot afford the cost associated with a smartphone.
5. Conclusions
This research began by questioning how Peru could improve its financial inclusionindicators to help its population access and use formal financial services to enhance theirlives prevent the COVID-19 or any other virus transmission, and efficiently provide fi-nancial help to vulnerable families unbanked. It was necessary to learn and comprehend

J. Risk Financial Manag. 2022, 15, 62 35 of 46
essential concepts such as financial inclusion and efficient methods to answer this problemstatement.
Financial inclusion understood as a market failure in which supply, demand, andcountry environment forces play a role, is the most accurate approach developed by theliterature because that is how the problem of financial exclusion can be addressed andmeasured by policymakers, financial institutions, and relevant stakeholders on this matter.Additionally, through this approach, it is possible to comprehend financial inclusion as amultidimensional topic that requires further and deeper studies that allow policymakersand Governments to formulate and apply adequate measures to achieve high access andusage of formal financial services in developing countries.
In 2004, 2008, 2009, 2013, respectively, GCASH, M-PESA, Easypaisa, and Nubank werelaunched. These FinTechs specialized in providing mobile money services disrupted thefinancial sector in their respective countries thanks to their business models and valuepropositions. Consequently, a comprehensive analysis of these companies and their re-spective governments could provide lessons for countries with lower financial inclusionindicators and started after these companies—for example, Peru.
The country analysis of Peru has shown a favorable environment for launching oneor many mobile money services because this country is expected to recover rapidly afterthe COVID crisis, increasing consumption and employment rates. Moreover, more than100 mobile subscriptions per 100 inhabitants indicate that the demand in Peru is readyto meet the supply of mobile money services. Nonetheless, the Global Findex Database(Demirgüç-Kunt et al. 2018) showed that Peruvian indicators of account ownership, savings,credit and debit cards, sending remittances, and mobile money account were very shallow.
There are many reasons why financial inclusion in Peru is very low. The proximity ofthe access points to the population affects the usage of bank accounts and credits becauseof the transportation time to the access point for making transactions. Therefore, theprobability of obtaining informal credits is higher. In addition, Peru is a middle high-income country with a GNI per capita of approximately USD 6010. However, peopleusually have an improved economic position in Lima and big cities in the capital city. Incontrast, the people who live in the remote areas in the Andes and the Jungle do not havethe same economic condition. Therefore, the lower ability to pay decreases the accessto formal credits. The usage of financial services in Peru depends on the value that thepopulations assign to it. If the population does not perceive the value of products, theyare not adequate to their needs and capacities or lack knowledge of the actual products.Therefore, the government and the financial sector must improve financial literacy andconfidence in the financial industry. An essential factor in Peru is that the financial industryprovides services in the majoritarian language in Peru without considering the country’slanguage and cultural diversity. It is difficult to access and use products and services thatare not provided in the native language of some sectors of the population, for example,Quechua and Aymara.
Global Microscope (Economist Intelligence Unit 2019) provides an overall financialscore after assessing the enabling environment for financial inclusion. In this study, Peruachieves a high overall financial inclusion score, surpassing peer countries in Latin Americaand the Caribbean and upper-middle-income countries due to government support, marketstability and integrity, excellent products and outlets, and better-quality consumer protec-tion rules and infrastructure. The recent better scores for Peru can also be influenced by thefast measures introduced by the government in response to the COVID-19 emergency byfacilitating e-money, ease of credit for microfinance institutions, emergency cash transferthrough a bank account or cellular account with the Bank of the government (Banco dela Nacion), or in cash at a designated agent. Moreover, the government launched specialfunds for entrepreneurs and farmers to develop micro insurances, factoring, and leasing toimprove financial inclusion for micro-enterprises and other small businesses.
Analysis of Kenya, Brazil, the Philippines, and Pakistan enables the following conclu-sions:

J. Risk Financial Manag. 2022, 15, 62 36 of 46
• The overall financial inclusion score of Kenya is above the average in the regionand the group of lower-middle-income peers. The government and policy support,market stability and integrity, and consumer protection rules and infrastructure havean above-average score, indicating that this country’s financial inclusion environmentis favorable. However, the dimension of products and outlets indicates challengesbecause the score obtained locates Kenya far under average peer countries in Sub-Saharan Africa and lower-middle-income countries. In 2020, during the COVID-19crisis, the Central Bank of Kenya applied liquidity measures to financial institutions tosupport borrowers affected by the pandemic. Financial institutions could also extendand restructure loans for incapable borrowers to pay due to the pandemic. The CentralBank of Kenya introduced measures to increase the use of mobile money by removingtransactions fees for transfers between mobile money accounts and bank accounts.The Kenyan government implemented money transfer programs through traditionalbank accounts and M-PESA to alleviate the needs of households. These programsprovided monthly financial help to around 1.1 million beneficiaries.
• Brazil has achieved an important number of account holders and debit cardholders.Nevertheless, the mobile money account, domestic remittances, and saving cultureremains in a meager percentage. The high rate of people who own bank accountsand debit cards can be due to the integrated efforts of the Brazilian government, theCentral Bank of Brazil, and stakeholders to promote financial inclusion in this country.These efforts were continued in 2019 by the Central Bank of Brazil, which launcheda work plan focused on technological evolution to resolve structural problems inthe financial system, competitiveness, transparency, and education. Mobile moneyaccounts, savings, and remittances are not popular in this country, probably becauseof the lack of trust in the financial sector, lack of money, or lower financial literacyrates. The financial sector’s main problems in Brazil are the lack of bank branchesand service points, especially in small rural areas, high documentation requirementsto open bank accounts, high costs associated with bank accounts, and high-interestrates for credits. The response of the Brazilian government regarding the COVID-19crisis was to increase liquidity in the financial system and a temporary relaxation ofprovisioning rules. The Central Bank opened a facility to provide loans to financialinstitutions, and the five largest banks in the country agreed to provide individualsand SMEs 60 day extension of debts. Likewise, the authorities offered temporaryincome support to vulnerable households, such as cash transfers to informal andlow-income people. Brazil’s overall financial inclusion score is superior to the averagein Latin American and Caribbean countries and the group of upper-middle-incomecountries. It could be said that this positive outcome in 2020 was due to efforts of thegovernment, the Central Bank, and the financial sector of Brazil.
• The Central Bank of the Philippines (BSP) and the government are significant playerscreating regulations regarding financial inclusion. In 2009, the BSP created an electronicmoney ecosystem and efficient retail payments platform to allow banks to developpartnerships with e-money service providers such as telecommunication companies orbecome e-money issuers, either directly or through partnerships. In 2010, BSP enableda regulatory environment to create a platform for electronic money and the expansionof financial access points through micro-banking offices, and in 2012 it was issued aregulation to ensure consumer protection. The indicators of financial inclusion in thePhilippines are low. Account and debit card ownerships represent a higher percentage,showing progress through the years. However, the other indicators remain low. Theseresults indicate an essential gap to provide suitable financial products and servicesto the population’s needs. Since 2016, a governmental institution has been createdthat guides and oversees the implementation of the National Strategy for FinancialInclusion, which places particular focus on digital financial inclusion and financialand digital literacy. However, an important issue was ensuring interoperability inretail payments because of the limited number of operators and the high transaction

J. Risk Financial Manag. 2022, 15, 62 37 of 46
costs. The outlook of financial inclusion in the Philippines is promising since thiscountry was recognized in 2016 as an ideal place for developing digital and financialproducts and services due to its large young population, positive annual GDP growth,fast-growing internet penetration, and mobile phone engagement. The creators SmartMoney and GCASH approached this market in new ways. The overall financialinclusion score is higher than peers in East and South Asia and higher than in lower-middle-income countries. This outcome is a positive sign that the measures introducedby authorities since 2016 may have provided better governmental and policy support,stability to the financial system, and consumer protection rules. Therefore, the supplyof products and services has increased, and this country’s overall financial inclusionsituation has improved. However, there are still gaps to improve, especially regardingimplementing adequate infrastructure to connect this country’s remote rural and lowpopulated areas.
• In Pakistan, the financial inclusion indicators are shallow. Mobile account penetrationremained extremely low despite the significant growth observed in mobile accountactivity. The challenge of expanding mobile money account users is linked to customereducation on financial services. This indicator increased only 1% from 2014 to 2017,which means that the regulation implemented by the State Bank of Pakistan was notenough to encourage the market of mobile money services to develop further. In2015, the Pakistani government established a National Financial Inclusion Strategy,which in 2018 was modified to place more emphasis on promoting digital paymentsto increase the number of digitized accounts. In addition, the State Bank of Pakistan(the Central Bank) implemented reforms in 2019 to allow non-banking entities to issuee-money directly. With this new regulation, mobile operators can provide furtherproduct innovations in digital finance. The COVID-19 pandemic hit this country’seconomy due to lockdown measures to contain the spread of the virus. Therefore,the State Bank of Pakistan launched relief and stimulus measures to ensure adequateliquidity in the financial system, allowing Banks to defer the repayment of loans,and stimulating banks to keep lending small and medium enterprises to supportthe businesses in the country. Other measures introduced were promoting digitalbanking by waiving all fees for online transfers. To alleviate the most vulnerablepopulation, the State Bank of Pakistan launched an emergency cash transfer programaccessible after an online application and a confirmation received via SMS. The fundswere targeted and delivered to female heads of households. The overall financialinclusion in Pakistan is above average among lower-middle-income countries and inthe East and South Asia groups. The governmental policies and support and consumerprotection environment have improved. The scores for the availability of products andoutlets and the infrastructure that supports financial services and products are aboveaverage, indicating an improvement in comparison to lower indicators of financialinclusion.
After analyzing each company in its respective country, the qualitative assessment didnot reveal information about its performance regarding financial inclusion in the respectiveregion because financial inclusion is a multidimensional study topic that requires deepand extensive study of diverse factors. Therefore, only after conducting multivariablecorrelation analysis was realized that all studies provided relevant information on eachcompany’s financial inclusion performance in the respective country.
Consequently, insightful and exciting results were found, proving that despite theremarkable stories of M-PESA and GCASH, these companies specialized in mobile moneytransfers and payments. Still, they could not provide financial services such as savings andcredit card ownership. Their recent partnerships with banks realized that expanding thesupply of various financial assistance due to the know-how of financial institutions canprove in the future if the influence of banks is determinant to achieve high rates of financialinclusion in a country.

J. Risk Financial Manag. 2022, 15, 62 38 of 46
The case of Easypaisa is from a business model perspective very similar to GCASH andM-PESA. However, the main difference is that this company began its activities influencedby a FinTech and a Microfinance Bank. Overall financial inclusion indicators for Pakistanare shallow. Nevertheless, the impact of Easypaisa on all the selected indicators is positive,which may indicate the importance of the participation of banks in these operations, despitethe downsides of managing two different business structures (bank and FinTech).
Comparatively, the costs of making withdrawals in M-PESA, GCASH, and Easypaisaare meager. Each company implements charges according to the withdrawal strategy thathelps to make a profit out of small millions of transactions. The case of Nubank is entirelydifferent since the original product is a credit card with no fees, which provides revenue tothe company through charges to exchange rates, charges for payment of bills, and penaltiesof overdue payments.
The case of Nubank is fascinating because the FinTech start-up challenges banks in acountry such as Brazil, which has produced a highly concentrated financial sector within afew years. Moreover, the company expanded to provide other financial services, such asmobile money accounts, remittances, and insurances. Future research regarding the impactof Nubank on financial inclusion in Brazil could be done by considering updated data after2017, the year in which the company scaled speedy upwards.
Appendix B summarizes and presents each company’s business model comparativelyto provide a holistic comprehension of each selected company.
The Peruvian context can learn from all the cases analyzed since its financial inclusionindicators are low and the geographical, cultural, and educational difficulties are barriersto reaching remote areas. However, after analyzing all presented cases, the main differenceis that Peru has the highest bank concentration among the studied countries. Therefore,it would be desirable that banks have incentives aligned to create a financially includedsystem before their interest in market share. A proper regulation that facilitates responsibleparticipation of FinTechs competing with banks can challenge the status quo. It could createa desired competitivity that expands financial services to the most remote areas.
Furthermore, regarding the technology applied, it must be considered that not allsectors of the Peruvian population can afford to have a smartphone. Therefore, efforts mustbe made to ensure the availability and feasibility of the SIM toolkit or USSD technology tofacilitate mobile money transactions. Additionally, the price structure must be the lowestpossible to compete with banks’ mobile wallets and BIM.
This study provided several insights about financial inclusion and how mobile moneysolutions impact financial inclusion. Therefore, the entire topic of mobile money productsand services offers the possibility to further research specific areas, such as assessing theimpact of technologies SIM Toolkit and USSD on financial inclusion, because, in this study,it was learned that both technologies are different (the second is more accessible than thefirst one) but had the same impact.
With recent data, it would be interesting to study the impact of the mobile wallet BIMon financial inclusion in Peru after 2017, analyzing whether banks’ mobile wallets or BIMsignificantly impact the Peruvian financial inclusion situation.
Likewise, future research can be conducted to analyze the impact of COVID-19 onfinancial inclusion in the selected countries for this study because, in the literature and datareview, the pandemic created a triggering effect that conducted people to mobile moneyservices. Additionally, it would be attractive to assess if the access and use of mobile moneyservices remain evenly after the pandemic.
Since banks played an essential role in most selected FinTechs, future research cananalyze and determine the optimal functions FinTechs and banks must perform to providefinancial services that address customers’ needs.
The practical implications of this research can help FinTech startups in Peru that havea primary purpose of reaching the unbanked. Based on the experience of other countries,it will be possible to understand how other companies faced, almost two decades ago,the same challenges in a similar environment. They strived to reach the unbanked by

J. Risk Financial Manag. 2022, 15, 62 39 of 46
generating profit. Therefore, it will be possible for new FinTechs to anticipate factors thathave already happened in other countries.
Additionally, banks can understand the risk of the entrance of new players that canplace their market share under stress. Therefore, a proper understanding of how othercompanies handled similar situations can open collaborations with FinTechs to reach theunbanked.
Policymakers understand that regulation plays a vital role as a barrier to new entrantsand as a tool for customer protection. Therefore, a proper balance must be analyzed toprovide adequate incentives for FinTechs, the financial sector, and customers.
Author Contributions: Conceptualization, V.B. and P.V.V.; methodology, V.B. and P.V.V.; software,T.H.; validation, R.K.V. and T.H.; formal analysis, P.V.V.; investigation, P.V.V.; resources, V.B.; datacuration, T.H.; writing—original draft preparation, P.V.V.; writing—review and editing, R.K.V.;visualization, T.H. and Romana Horvat Vode; supervision, V.B.; project administration, TatjanaHprvat; funding acquisition, R.K.V. All authors have read and agreed to the published version of themanuscript.
Funding: This research received no external funding.
Informed Consent Statement: Not applicable.
Data Availability Statement: Not applicable.
Conflicts of Interest: The authors declare no conflict of interest.

J. Risk Financial Manag. 2022, 15, 62 40 of 46
Appendix A
Table A1. Benchmarking of country’s environment for financial inclusion.
Peru Kenya Brazil The Philippines Pakistan
Geographical conditions andpopulation distribution
The coastal plain, high-ruggedAndes, and JungleArea: 496,225 sq miles1/3 of the population lives alongthe desert coastal, especially inthe capital city of Lima.The remote cities in the Andeanhighlands, the rainforests, andthe jungle are sparselypopulated.
Low plains rise to centralhighlands.Area: 224,961 sq milesThe population is veryconcentrated in the west, thecapital of Nairobi, and along theIndian Ocean coast.
The territory is mostly flat, butsome rolling lowlands in thenorth, some plains, hills,mountains, and a narrow coastalbelt.Area: 3 million sq milesThe population lives along theAtlantic coast in the east,especially in the big cities of SaoPaolo, Brasilia, and Rio deJaneiro.
Archipelagic country, composedof islands, mountains, andextensive coastal lowlandsArea: 115,831 sq milesThe population is concentratedwhere good farmlands lie,principally in the north of thecountry, some islands, andManila’s capital city.
The territory is divided into threemajor geographic areas, thenorthern highlands, the IndusRiver plain, and the BalochistanPlateau.Area: 339,697 sq milesThe population is concentrated inthe biggest cities, such as Karachiand Lahore.
Population(Ages 15 to 64 years)
2011: 9.2 million2014: 9.6 million2017: 10.3 million2020: 10.9 million
2011: 23.7 million2014: 26.1 million2017: 28.8 million2020: 31.7 million
2011: 135.6 million2014: 140.7 million2017: 144.8 million2020: 148.1 million
2011: 59.3 million2014: 63.1 million2017: 66.8 million2020: 70.6 million
2011: 107.1 million2014: 116 million2017: 125.1 million2020: 134.3 million
Mobile phone Subscriptions per100 inhabitants in 2019 123.76. 104.22 123.76 155.61 72.33
The Rule of Law Index 80th—0.5 score 102nd—0.45 score 67th—0.52 score 91st—0.47 score 120th—0.39 score
Financial literacy in 2015 28% of financial literacy. 38% of financial literacy. 35% of financial literacy. 25% of financial literacy. 26% of financial literacy.
Banking concentration in 2017(World Bank, 2017) 72.7% 36.6% 56.6% 47.4% 44.1%
Multiculturality
Mixed Amerindian, white,African descent, Chinese, andJapanese.Primary Languages: Spanish,Quechua, Aymara, Ashaninka,and others.
Bantu, Nilo-Saharan,Afro-Asiatic, and others.Main languages: English,Kiswahili, numerous indigenouslanguages
White, mulatto, black, Asian,indigenous.Main languages: Portuguese anda large number of minorAmerindian languages
More than seven ethnic groupsdispersed in its territories.Main languages: Filipino,English, and many otherlanguages.
Around seven different ethnicgroups and their respectivelanguages
The employment to populationratio is 2019 75.5% 72.31% 56.7% 58.79% 50.42%
Gross National Income per capitain 2020 USD 6010 USD 1760 USD 7850 USD 3430 USD 1280

J. Risk Financial Manag. 2022, 15, 62 41 of 46
Appendix B
Table A2. Benchmarking of Remarkable FinTechs’ business model.
M-PESA Nubank GCASH Easypaisa
Businessobjective
Deliver a simple, fast, safe, and easy methodto move money across the country.
Provide a credit card service, 100% digital,without annuities and fees (cheap), fast andconvenient.
Transform the user’s phone to a mobile account,safely, convenient, cheap
Empower people by providing timely, reliable,flexible, and easy methods of realizing mobilemoney transactions.
Strategy
Scaled installation of agentsM-PESA users and non-users can maketransactions.Active agents networking.Later partnership with the KenyanCommercial Bank (KCB)
Customer services are automatized througha smartphone app, providing 100%digitalized services.Nubank reduces the costs of the personnel incharge of customers and can afford to offerno annuities or fees.
The company created a system involving retailersand users and no partnerships with banks initially.Financial institutions provided the logistics to keepmoney flowing in their system.In April 2021, CIMB Bank and GCASH partneredto expand digital banking services.
The partnership of Telenor and TameerMicrofinance BankReach low-cost deposits from the mass marketto lower costs and increase profitability.Create innovative and suitable products tomeet customer needs.
Target marketBottom of pyramid approach.They are taking advantage of Safaricom’slarge customers base.
In the beginning, Nubank targeted“millennials” under 36 years old.After popularity, the target is people of allages and the unbanked.
Bottom of the pyramid, especially young urbanconsumers familiar with social media. Bottom of the pyramid and urban population.
Marketingstrategy
Customer education and aggressiveadvertisement through all channels andcreating engagement with local cultureMessage: “send money home.”
The network effect of engaged customers.Creation of brand awareness through digitalchannels and gifting souvenirs in eventsMessage: obtain financial control quickly.
Humor and colorful ads on TV, internet, andprinted announcesMessage: a cheap, fast, accessible, and easy methodto send remittances.
High-quality ads focus on customer educationabout the product.Message: reliable, easy, and convenientmethod to realize payments.
Revenuestreams
Principally, mobile money transfers andpayment services.The company had profit during COVID-19.
Interchange fees on every transaction madewith the credit card, taxes over bills, andinvoices not pated when due.
Fees are charged to deposits, withdraws, purchases,credit penalties, bill payments, bank accounts, anddormancy fees.
Transferences fees, bill payments, and massdisbursements.
TransactionsWithdrawals, Transferences,Deposits, registration, buying airtime,balance inquiry, and change of M-PESA PIN.
Purchases, transferences, bill payments,withdrawals, salary disbursements, onlineshopping, mobile credit recharges, and more.
Payments, transfers, withdrawals, mobile creditrecharge, investment on funds, book movies, shoponline, plant trees, and obtain insurance.
Payments, P2P transfers, mobile creditrecharge credits, savings, remittances, salarydisbursements, and savings productscombined with insurances.
Main products Wealth management, mobile banking,mobile wallet, credit, and insurances.
Digital bank, credit cards, personal loans,and insurances. Investment funds, mobile wallets, insurances. Mobile banking, various products, and
insurances.
Users
In 2021: 28.21 million customers.In 2017: 27 millionIn 2014: 19.3 millionIn 2011: 13.8 million
In 2021: 40 million customers.In 2017: 3 million
In 2021: 33 million customers.In 2017: 5.1 millionIn 2014: 3 millionIn 2012: 1.3 million
In 2021: 30 million customers.In 2017: 19.9 MillionIn 2014: 6 MillionIn 2012: 2 Million

J. Risk Financial Manag. 2022, 15, 62 42 of 46
Table A2. Cont.
M-PESA Nubank GCASH Easypaisa
Technologyapplied
SIM Toolkit (STK) with SMS delivery fordelivering mobile money transactions.Smartphone application.
Smartphone appOwn software program and data science.Partnership with Ripple Net (Blockchaininfrastructure)
SIM Toolkit with SMS usage.Smartphone app.
USSD mobile money option and at the agenttransactions. Smartphone application.
Competitors Airtel Money and T-Kash.Banks: Caixa Econômica, Itaú Unibanco,Bradesco, and Santander.FinTechs: Digio, Neon, and Intermedium
Smart Money, Paymaya, Coins PH, GrabPay, etc. Omni, Mobicash Timepey

J. Risk Financial Manag. 2022, 15, 62 43 of 46
ReferencesAmidžic, Goran, Andre Massara, and Alexander Mialon. 2014. Assessing Countries’ Financial Inclusion Is Standing—A New
Composite Index. International Monetary Fund. Working Paper. Available online: https://www.imf.org/external/pubs/ft/wp/2014/wp1436.pdf (accessed on 13 April 2021).
Atkinson, Adele, and Flore-Anne Messy. 2013. Promoting Financial Inclusion through Financial Education: Oecd/Info Evidence,Policies, and Practice. OECD Publishing. OECD Working Papers on Finance, Insurance, and Private Pensions. Availableonline: https://www.wsbi-esbg.org/SiteCollectionDocuments/OECD%20Promoting%20financial%20inclusion%20through%20financial%20education.pdf (accessed on 13 July 2021).
Banco Central do Brasil. 2021. Conglomerado prudencial e instituiçõnes independentes: Resumo. Banco Central do Brasil. Availableonline: https://www3.bcb.gov.br/ifdata/# (accessed on 28 July 2021).
Bank for International Settlements. 2020. Payment Aspects of Financial Inclusion in the Fintech Era. World Bank. Bank for InternationalSettlements. Committee on Payments and Market Infrastructures (CPMI). Available online: https://www.bis.org/cpmi/publ/d191.pdf (accessed on 28 July 2021).
Barajas, Adolfo, Thorsten Beck, Mohamed Belhaj, and Sami Ben Naceur. 2020. Financial Inclusion: What Have We Learned So Far?What Do We Have to Learn? International Monetary Fund. Working Paper. Available online: https://www.google.com/url?sa=t&rct=j&q=&esrc=s&source=web&cd=&ved=2ahUKEwiCyu6_yc7tAhUGNOwKHRjrCoMQFjASegQIIBAC&url=https%3A%2F%2Fwww.imf.org%2F~%2Fmedia%2FFiles%2FPublications%2FWP%2F2020%2FEnglish%2Fwpiea2020157-print-pdf.ashx&usg=AOvVaw3UcfdNtM0iibhAbH_ni3Ji (accessed on 11 November 2020).
BBC News. 2021. COVID: Why Has Peru Been So Badly Hit? [Press Release]. Available online: https://www.bbc.com/news/world-latin-america-53150808 (accessed on 11 June 2021).
BMJ. 2021. COVID-19: Peru’s Official Death Toll Triples to Become the World’s Highest BMJ [Press Release]. Available online:https://www.bmj.com/content/373/bmj.n1442 (accessed on 11 June 2021).
Braga, Carlos, Leif Sjöblom, and Howard Yu. 2013. Emerging Markets Perspectives. IMD Real-World Learning. Available online: https://www.imd.org/contentassets/0604e023b37a4193854b07a8fcb80c35/24.-emerging-markets-perspectives-27.06.13.pdf (accessedon 26 June 2021).
Bull, Greta. 2018. Financial Inclusion: Is the Glass Half Empty or Half Full? (Pt 2). Available online: https://www.cgap.org/blog/financial-inclusion-glass-half-empty-or-half-full-pt-2 (accessed on 3 January 2022).
Cámara, Noelia, and David Tuesta. 2014. Measuring Financial Inclusion: A Multidimensional Index: Working Paper. BBVAResearch. Working Paper. Available online: https://www.bbvaresearch.com/wp-content/uploads/2014/09/WP14-26_Financial-Inclusion2.pdf (accessed on 14 April 2021).
CGAP. 2011a. Global Standard-Setting Bodies and Financial Inclusion for the Poor: Proportionate Standards and Guidance. GPFI—Global Partnership for Financial Inclusion. Available online: https://www.cgap.org/sites/default/files/CGAP-White-Paper-Global-Standard-Setting-Bodies-Oct-2011.pdf (accessed on 1 May 2021).
CGAP. 2011b. Marketing Branchless Banking: Examples from Around the World. [PowerPoint Slides]. Available online:https://www.ifc.org/wps/wcm/connect/52fb5786-a45a-4caf-8b38-25a9a64a31a0/Tool%2B3.7e.%2BCGAP%2BMarketing%2BBranchless%2BBanking%2B%285.2011%29.pdf?MOD=AJPERES&CVID=jlzQM7O (accessed on 20 July 2021).
CGAP. n.d. Regulation for Inclusive Digital Finance. Available online: https://www.cgap.org/topics/collections/regulation-inclusive-digital-finance (accessed on 3 January 2022).
Chatain, Pierre-Laurent, Andrew Zerzan, Wameek Noor, Najah Dannaoui, and Louis de Koker. 2013. Protecting Mobile Money againstFinancial Crimes. Available online: https://elibrary.worldbank.org/doi/abs/10.1596/978-0-8213-8669-9 (accessed on 3 January2022).
CIA.gov. 2021a. The World Factbook: Brazil. Available online: https://www.cia.gov/the-world-factbook/countries/brazil/#geography (accessed on 29 July 2021).
CIA.gov. 2021b. The World Factbook: Kenya. Available online: https://www.cia.gov/the-world-factbook/countries/kenya/#geography (accessed on 29 July 2021).
CIA.gov. 2021c. The World Factbook: Pakistan. Available online: https://www.cia.gov/the-world-factbook/countries/pakistan/#government (accessed on 29 July 2021).
CIA.gov. 2021d. The World Factbook: Peru. Available online: https://www.cia.gov/the-world-factbook/countries/peru/#geography(accessed on 29 July 2021).
CIA.gov. 2021e. The World Factbook: Philippines. Available online: https://www.cia.gov/the-world-factbook/countries/philippines/#geography (accessed on 29 July 2021).
Claessens, Stijn. 2006. Access to Financial Services: A Review of the Issues and Public Policy Objectives. The World Bank ResearchObserver, Volume 21. Available online: https://www.researchgate.net/publication/5217978_Access_to_Financial_Services_A_Review_of_the_Issues_and_Public_Policy_Objectives (accessed on 1 May 2021).
Dalberg. 2012. CGAP Landscape Study on International Remittances through Mobile Money: Final Report. CGAP. [Power-Point Presentation]. Available online: https://www.gsma.com/mobilefordevelopment/wp-content/uploads/2012/06/2012landscapestudyoninternationalremittancesthroughmobilemoney.pdf (accessed on 13 June 2021).

J. Risk Financial Manag. 2022, 15, 62 44 of 46
Damodaran, Akhil. 2013. Financial Inclusion: Issues and Challenges. AKGEC International Journal of Technology 4: 54–59. Availableonline: https://www.researchgate.net/publication/309194840_Financial_Inclusion_Issues_and_Challenges (accessed on 19 April2021).
de Koker, Louis, Nicholas Morris, and Sue Jaffer. 2020. Regulating Financial Services in an Era of Technological Disruption. Availableonline: https://journals.latrobe.edu.au/index.php/law-in-context/article/view/98/169 (accessed on 4 January 2022).
Demirgüç-Kunt, Asli, Leora Klapper, Dorothe Singer, Saniya Ansar, and Jake Hess. 2018. The Global Findex Database 2017: MeasuringFinancial Inclusion and the Fintech Revolution. World Bank. Available online: https://openknowledge.worldbank.org/bitstream/handle/10986/29510/9781464812590.pdf (accessed on 25 June 2021).
Easypaisa. 2021a. About Us. Available online: https://easypaisa.com.pk/about-easypaisa/#about_us_sec (accessed on 29 July 2021).Easypaisa. 2021b. Easypaisa Is a One-Stop-Shop for All Your Payment Needs: Products. Available online: https://easypaisa.com.pk/
products-promotions/ (accessed on 29 July 2021).Economist Intelligence Unit. 2019. Global Microscope 2019: The Enabling Environment for Financial Inclusion. Avail-
able online: https://www.google.com/url?sa=t&rct=j&q=&esrc=s&source=web&cd=&ved=2ahUKEwjLxorSz5zwAhWh_rsIHVNsBM8QFjAGegQIBhAD&url=https%3A%2F%2Fidbinvest.org%2Fen%2Fdownload%2F8783&usg=AOvVaw17TjJmK2_kkIqvGmccJoEb (accessed on 26 April 2021).
Economist Intelligence Unit. 2020. Global Microscope 2020: The Role of Financial Inclusion in the COVID-19 Response. Availableonline: https://idbinvest.org/en/download/11712 (accessed on 26 April 2021).
Gates, Bill. 2015. 2015 Annual Letter: A Big Bet for 2030. [Blog]. Available online: https://www.gatesnotes.com/2015-annual-letter?page=3&lang=en&WT.mc_id=01_29_2015_AL2015-BG_FB_WorldBankingmap_Top_16&fbclid=IwAR0S3n2DFTWPKthi64lA93i66YJQsMKcoA0c6LWH1plLNeHQhL_pnjpvmFg (accessed on 20 July 2021).
Ghosh, Saibal. 2016. How Important Is Mobile Telephony for Economic Growth? Evidence from MENA Countries. Info 18: 58–79.[CrossRef]
GLOBE. 2014. 2014 Annual and Sustainability Report. Available online: https://www.globe.com.ph/content/dam/globe/brie/About-us/investor-relations/documents/Annual-and-Sustainability-Reports/GLO-2014-Annual-and-Sustainability-Report.pdf (ac-cessed on 10 June 2021).
GLOBE. 2017. Integrated Report 2017. Available online: https://www.globe.com.ph/content/dam/globe/brie/About-us/investor-relations/documents/Annual-and-Sustainability-Reports/GLO-2017-Integrated-Report.pdf (accessed on 10 June 2021).
GLOBE. 2021. GCASH: Everything You Need to Know to Make Life Easier [Press Release]. Available online: https://www.globe.com.ph/go/technology/article/gcash-everything-you-need-to-know.html#gref (accessed on 28 July 2021).
GPFI SSBs Conference. 2021. Financial Inclusion—A Pathway to Financial Stability? Understanding the Linkages. Available online:https://www.gpfi.org/publications/issues-paper-3-financial-inclusion-pathway-financial-stability-understanding-linkages (ac-cessed on 3 January 2022).
Hasnain, Sophia, Abigail Komu, and Christopher Blackburn. 2016. Mobile Money in the Philippines: Market ConditionsDrive Innovation with Smart Money and GCASH. GSMA Association. Available online: https://www.gsma.com/mobilefordevelopment/programme/mobile-money/mobile-money-philippines-market-conditions-drive-innovation-smart-money-gcash-philippines-becoming-mobile-money-innovation-hub/?utm_medium=social-media&utm_campaign=mm230616&utm_source=twitt (accessed on 23 June 2021).
International Finance Corporation. 2009. M-Money Channel Distribution Case—Kenya. Safaricom M-PESA. World Bank Group.Available online: https://www.ifc.org/wps/wcm/connect/e0d2a9bd-16b9-4a36-8498-0b2650b9af8b/Tool%2B6.7.%2BCase%2BStudy%2B-%2BM-PESA%2BKenya%2B.pdf?MOD=AJPERES&CVID=jkCVy-n (accessed on 9 December 2020).
International Finance Corporation. 2011. Mobile Money Study 2011: Summary Report. Working Paper. Available online:https://openknowledge.worldbank.org/bitstream/handle/10986/21743/947350WP0Box380eMoneyReport0Summary.pdf?sequence=1&isAllowed=y (accessed on 20 June 2021).
Jentzsch, Nicola. 2012. Implications of Mandatory Registration of Mobile Phone Users in Africa. DIW Discussion Papers, No. 1192. Berlin:Deutsches Institut für Wirtschaftsforschung (DIW).
Johnson, Burke, and Larry Christensen. 2004. Educational Research: Quantitative, Qualitative, and Mixed Approaches, 5th ed. ThousandOakes: Sage.
Klapper, Leora, Annamaria Lusardi, and Peter Van Oudheusden. 2015. Financial Literacy Worldwide: Insights from the Standard &Poor’s Rating Services Global Financial Literacy Survey. International Bank for Reconstruction and Development & World Bank.Available online: https://gflec.org/wp-content/uploads/2015/11/3313-Finlit_Report_FINAL-5.11.16.pdf?x66755 (accessed on28 July 2021).
Klapper, Leora, Saniya Ansar, Jake Hess, and Dorothe Singer. 2021. Financial Inclusion and Financial Regulation. Available online:https://globalfindex.worldbank.org/sites/globalfindex/files/referpdf/FindexNote8_17.pdf (accessed on 3 January 2022).
Macedo, Carlos, Marcelo Cintra, Steven Goncalves, and Nelson Catala. 2017. Future of Finance: Fintech’s Brazil Moment [Brazil’sOver-Branched Banking System Is Ripe for Disruption by New Entrants]. Goldman Sachs. Available online: https://www.gspublishing.com/content/research/en/reports/2017/05/12/f21e671e-dad0-4ef4-ba07-d694211b0c94.pdf (accessed on 28 July2021).
Malhotra, Naresh. 2010. Marketing Research: An Applied Orientation, 6th ed. Hoboken: Pearson/Prentice Hall.
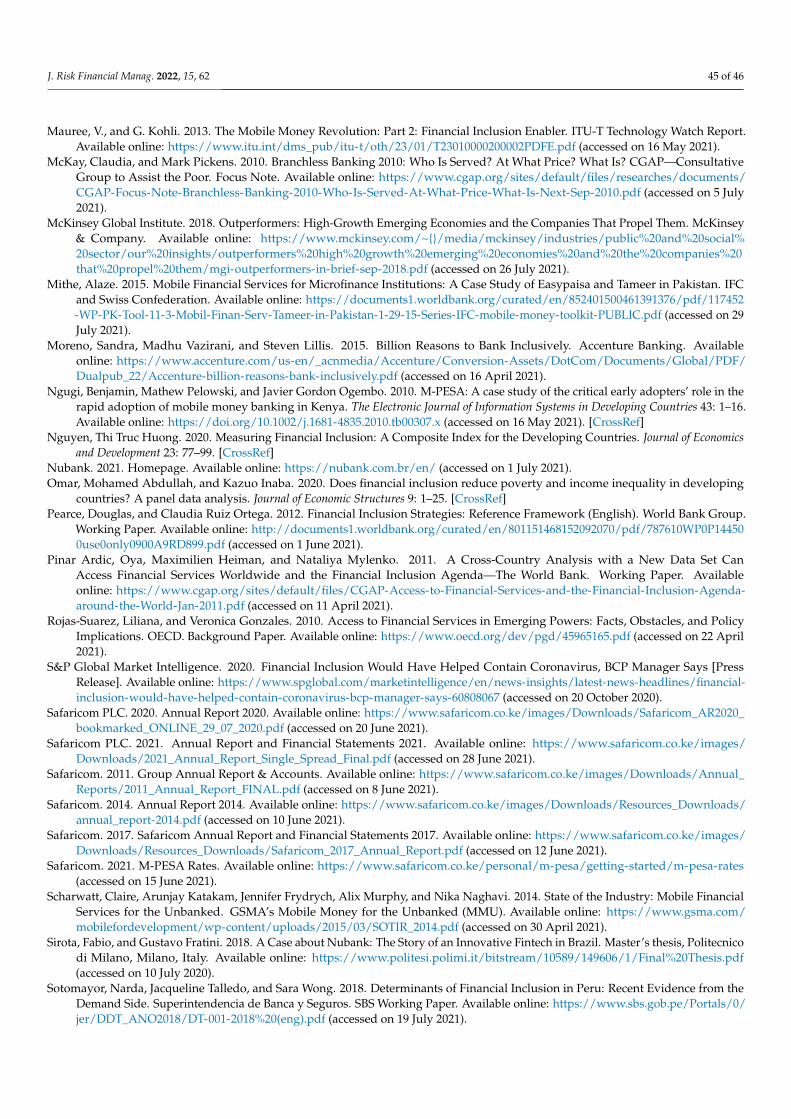
J. Risk Financial Manag. 2022, 15, 62 45 of 46
Mauree, V., and G. Kohli. 2013. The Mobile Money Revolution: Part 2: Financial Inclusion Enabler. ITU-T Technology Watch Report.Available online: https://www.itu.int/dms_pub/itu-t/oth/23/01/T23010000200002PDFE.pdf (accessed on 16 May 2021).
McKay, Claudia, and Mark Pickens. 2010. Branchless Banking 2010: Who Is Served? At What Price? What Is? CGAP—ConsultativeGroup to Assist the Poor. Focus Note. Available online: https://www.cgap.org/sites/default/files/researches/documents/CGAP-Focus-Note-Branchless-Banking-2010-Who-Is-Served-At-What-Price-What-Is-Next-Sep-2010.pdf (accessed on 5 July2021).
McKinsey Global Institute. 2018. Outperformers: High-Growth Emerging Economies and the Companies That Propel Them. McKinsey& Company. Available online: https://www.mckinsey.com/~/media/mckinsey/industries/public%20and%20social%20sector/our%20insights/outperformers%20high%20growth%20emerging%20economies%20and%20the%20companies%20that%20propel%20them/mgi-outperformers-in-brief-sep-2018.pdf (accessed on 26 July 2021).
Mithe, Alaze. 2015. Mobile Financial Services for Microfinance Institutions: A Case Study of Easypaisa and Tameer in Pakistan. IFCand Swiss Confederation. Available online: https://documents1.worldbank.org/curated/en/852401500461391376/pdf/117452-WP-PK-Tool-11-3-Mobil-Finan-Serv-Tameer-in-Pakistan-1-29-15-Series-IFC-mobile-money-toolkit-PUBLIC.pdf (accessed on 29July 2021).
Moreno, Sandra, Madhu Vazirani, and Steven Lillis. 2015. Billion Reasons to Bank Inclusively. Accenture Banking. Availableonline: https://www.accenture.com/us-en/_acnmedia/Accenture/Conversion-Assets/DotCom/Documents/Global/PDF/Dualpub_22/Accenture-billion-reasons-bank-inclusively.pdf (accessed on 16 April 2021).
Ngugi, Benjamin, Mathew Pelowski, and Javier Gordon Ogembo. 2010. M-PESA: A case study of the critical early adopters’ role in therapid adoption of mobile money banking in Kenya. The Electronic Journal of Information Systems in Developing Countries 43: 1–16.Available online: https://doi.org/10.1002/j.1681-4835.2010.tb00307.x (accessed on 16 May 2021). [CrossRef]
Nguyen, Thi Truc Huong. 2020. Measuring Financial Inclusion: A Composite Index for the Developing Countries. Journal of Economicsand Development 23: 77–99. [CrossRef]
Nubank. 2021. Homepage. Available online: https://nubank.com.br/en/ (accessed on 1 July 2021).Omar, Mohamed Abdullah, and Kazuo Inaba. 2020. Does financial inclusion reduce poverty and income inequality in developing
countries? A panel data analysis. Journal of Economic Structures 9: 1–25. [CrossRef]Pearce, Douglas, and Claudia Ruiz Ortega. 2012. Financial Inclusion Strategies: Reference Framework (English). World Bank Group.
Working Paper. Available online: http://documents1.worldbank.org/curated/en/801151468152092070/pdf/787610WP0P144500use0only0900A9RD899.pdf (accessed on 1 June 2021).
Pinar Ardic, Oya, Maximilien Heiman, and Nataliya Mylenko. 2011. A Cross-Country Analysis with a New Data Set CanAccess Financial Services Worldwide and the Financial Inclusion Agenda—The World Bank. Working Paper. Availableonline: https://www.cgap.org/sites/default/files/CGAP-Access-to-Financial-Services-and-the-Financial-Inclusion-Agenda-around-the-World-Jan-2011.pdf (accessed on 11 April 2021).
Rojas-Suarez, Liliana, and Veronica Gonzales. 2010. Access to Financial Services in Emerging Powers: Facts, Obstacles, and PolicyImplications. OECD. Background Paper. Available online: https://www.oecd.org/dev/pgd/45965165.pdf (accessed on 22 April2021).
S&P Global Market Intelligence. 2020. Financial Inclusion Would Have Helped Contain Coronavirus, BCP Manager Says [PressRelease]. Available online: https://www.spglobal.com/marketintelligence/en/news-insights/latest-news-headlines/financial-inclusion-would-have-helped-contain-coronavirus-bcp-manager-says-60808067 (accessed on 20 October 2020).
Safaricom PLC. 2020. Annual Report 2020. Available online: https://www.safaricom.co.ke/images/Downloads/Safaricom_AR2020_bookmarked_ONLINE_29_07_2020.pdf (accessed on 20 June 2021).
Safaricom PLC. 2021. Annual Report and Financial Statements 2021. Available online: https://www.safaricom.co.ke/images/Downloads/2021_Annual_Report_Single_Spread_Final.pdf (accessed on 28 June 2021).
Safaricom. 2011. Group Annual Report & Accounts. Available online: https://www.safaricom.co.ke/images/Downloads/Annual_Reports/2011_Annual_Report_FINAL.pdf (accessed on 8 June 2021).
Safaricom. 2014. Annual Report 2014. Available online: https://www.safaricom.co.ke/images/Downloads/Resources_Downloads/annual_report-2014.pdf (accessed on 10 June 2021).
Safaricom. 2017. Safaricom Annual Report and Financial Statements 2017. Available online: https://www.safaricom.co.ke/images/Downloads/Resources_Downloads/Safaricom_2017_Annual_Report.pdf (accessed on 12 June 2021).
Safaricom. 2021. M-PESA Rates. Available online: https://www.safaricom.co.ke/personal/m-pesa/getting-started/m-pesa-rates(accessed on 15 June 2021).
Scharwatt, Claire, Arunjay Katakam, Jennifer Frydrych, Alix Murphy, and Nika Naghavi. 2014. State of the Industry: Mobile FinancialServices for the Unbanked. GSMA’s Mobile Money for the Unbanked (MMU). Available online: https://www.gsma.com/mobilefordevelopment/wp-content/uploads/2015/03/SOTIR_2014.pdf (accessed on 30 April 2021).
Sirota, Fabio, and Gustavo Fratini. 2018. A Case about Nubank: The Story of an Innovative Fintech in Brazil. Master’s thesis, Politecnicodi Milano, Milano, Italy. Available online: https://www.politesi.polimi.it/bitstream/10589/149606/1/Final%20Thesis.pdf(accessed on 10 July 2020).
Sotomayor, Narda, Jacqueline Talledo, and Sara Wong. 2018. Determinants of Financial Inclusion in Peru: Recent Evidence from theDemand Side. Superintendencia de Banca y Seguros. SBS Working Paper. Available online: https://www.sbs.gob.pe/Portals/0/jer/DDT_ANO2018/DT-001-2018%20(eng).pdf (accessed on 19 July 2021).

J. Risk Financial Manag. 2022, 15, 62 46 of 46
Statista. 2021. Number of Customers of Fintech Company Nubank in Brazil from 2016 to 2021 (in Millions). Available online:https://www.statista.com/statistics/882274/brazil-number-customers-nubank/ (accessed on 29 July 2021).
Stein, Peer, Bikki Randhawa, and Nina Bilandzic. 2011. Toward Universal Access: Addressing the Global Challenge of FinancialInclusion. International Finance Corporation and World Bank. Working Paper. Available online: https://www.gpfi.org/sites/gpfi/files/documents/Toward%20Universal%20Access_0.pdf (accessed on 22 April 2021).
Telenor Microfinance Bank. 2017. 2017 Annual Report. Available online: https://telenorbank.pk/wp-content/uploads/2020/03/Annual_report_web_2017.pdf (accessed on 14 July 2021).
The Guardian. 2021. Peru Has the World’s Worst per Capita COVID Toll after Death Data Revised [Press Release]. Lima. Availableonline: https://www.theguardian.com/world/2021/jun/01/peru-has-worlds-worst-per-capita-covid-toll-after-death-data-revised (accessed on 11 June 2021).
The World Justice Project. 2020. Rule of Law Index. Available online: https://worldjusticeproject.org/rule-of-law-index/global/2020(accessed on 28 June 2021).
UNCDF. n.d. Financial Inclusion and the SDGs. Available online: https://www.uncdf.org/financial-inclusion-and-the-sdgs (accessedon 3 January 2022).
United Nations—UNSGSA. 2010. Annual Report to the Secretary-General. Available online: https://www.unsgsa.org/sites/default/files/resources-files/2020-09/UNSGSA_AR.pdf (accessed on 1 May 2021).
United Nations—UNSGSA. 2017. Financial Inclusion Transforming Lives: Annual Report to the Secretary-General. UnitedNations Secretary-General’s Special Advocate for Inclusive Finance Development (UNSGSA). Available online: https://responsiblefinanceforum.org/wp-content/uploads/2017/10/UNSGSA_report_2017-final.pdf (accessed on 15 May 2021).
Wishart, Neville. 2006. Micro-Payment Systems and Their Application to Mobile Networks. World Bank Group. Working Paper.Available online: https://documents1.worldbank.org/curated/en/886371468160779311/pdf/352950infoDev1m1Commerce01PUBLIC1.pdf (accessed on 15 July 2021).
World Bank. 2016. Brazil—Systematic Country Diagnostic. World Bank. Available online: https://documents.worldbank.org/en/publication/documents-reports/documentdetail/239741467991959045/brazil-systematic-country-diagnostic-retaking-the-path-to-inclusion-growth-and-sustainability (accessed on 1 August 2021).
World Bank. 2020a. Employment to Population Ratio, 15+, Total (%) (Modeled ILO Estimate)—Peru, Kenya, Philippines, Pakistan,Brazil. Available online: https://data.worldbank.org/indicator/SL.EMP.TOTL.SP.ZS?end=2020&locations=PE-KE-PH-PK-BR&start=2010 (accessed on 28 July 2021).
World Bank. 2020b. Islamic Republic of Pakistan: Leveling the Playing Field: Systematic Country Diagnostic. World Bank. Availableonline: https://openknowledge.worldbank.org/bitstream/handle/10986/34549/Pakistan-Systematic-Country-Diagnostic-Leveling-the-Playing-Field.pdf?sequence=4&isAllowed=y (accessed on 3 August 2021).
World Bank. 2020c. Kenya—Systematic Country Diagnostic. World Bank. Available online: https://documents.worldbank.org/en/publication/documents-reports/documentdetail/919181490109288624/peru-systematic-country-diagnostic (accessed on 4August 2021).
World Bank. 2020d. Population Ages 15–64, Total—Peru, Kenya, Brazil, Philippines, Pakistan. Available online: https://data.worldbank.org/indicator/SP.POP.1564.TO?end=2020&locations=PE-KE-BR-PH-PK&start=2006 (accessed on 29 July 2021).
World Bank. 2021a. Overview of the Philippines. World Bank. Available online: https://www.worldbank.org/en/country/philippines/overview (accessed on 6 August 2021).
World Bank. 2021b. The World Bank in Peru. Available online: https://www.worldbank.org/en/country/peru/overview (accessedon 7 August 2021).
The World Bank. 2021. Regulations Help Explain Variations in Financial Inclusion. Available online: https://blogs.worldbank.org/allaboutfinance/regulations-help-explain-variations-financial-inclusion (accessed on 3 January 2022).