411629-1.pdf - Eindhoven University of Technology research ...
Upload
khangminh22Category
view
1download
0
Eindhoven University of Technology
MASTER
Assessment of the circadian system & retinal illuminance exposureanalysis of current methods of measurement & proposition of multiple solutions
Gommans, K.
Award date:2008
Link to publication
DisclaimerThis document contains a student thesis (bachelor's or master's), as authored by a student at Eindhoven University of Technology. Studenttheses are made available in the TU/e repository upon obtaining the required degree. The grade received is not published on the documentas presented in the repository. The required complexity or quality of research of student theses may vary by program, and the requiredminimum study period may vary in duration.
General rightsCopyright and moral rights for the publications made accessible in the public portal are retained by the authors and/or other copyright ownersand it is a condition of accessing publications that users recognise and abide by the legal requirements associated with these rights.
• Users may download and print one copy of any publication from the public portal for the purpose of private study or research. • You may not further distribute the material or use it for any profit-making activity or commercial gain

ARR 2008 4165 BWK
Assessment of the Circadian System &
Reti11al Illuminance Exposure
Analysis of Current Methods of Measurement &
Proposition of Multiple Solutions
Koen Gommans

'" ~ J..t vJ ll ( 0 gl 0 3
Assessment Circadian System & Retinalllluminance Exposure
Master's Thesis
Assessment of the Circadian System &
Retinal Illunlinance Exposure
Analysis of Current Methods of Measurement &
Proposition of Multiple Solutions
Master's Thesis
Koen Gorrunans
Eindhoven lTniversity of Technology Department of Architecture Building and Planning
Unit Building Physics and Systems
August 2008
Supervisors ir. M.P.J. Aarts
prof. dr. ir. M.H. de Wit ing. J.F.L. Diepens
dr. ir. M. Knoop
2

Assessment Circadian System & Retinal Illuminance Exposure
Table of contents
Summary ................................................................................................................................ 6
Samenvatting ......................................................................................................................... 8
1 Introduetion .................................................................................................................. 10 J .1 Objectives of the research ................................................................................................................. 11
1. 1.1 Development of a protocolto register potent modulators of circadian system ... .......... ... .. ...... ..... ...... ..... 11 I. 1.2 Assessment & modification of currentlight registration methods .. .... .......... ........ ........ ...... .................. ... 12
1.2 Report structure ... ............................................................. ..... .......... .. ... ............................................ 12 1.3 Topical subjects ...... ......... ...................................................... ... .. ..... ..... ......... ................................... 13
2 The circadian system: markers & registration ........................................................... 14 2.1 Circadian clock mechanism ......... ... .................................... .................. .. ... ....................................... 14 2.2 Markers of the circadian system ...... ................................................................................................. 15 2.3 Assessment & regi stration of relevant circadian markers ......... ....................................................... 16
2.3.1 Assessment of .sleep-wake rhythm ....... ............................. ... ... ........ .... ...... .... ... ...... .. ......... .. .......... .......... 16 2.3.2 Assessment of melatonin rhythm .... .... ... .. ... ...... .... .. ..... .................... ... ..... ... .......... ... ............................... 17 2.3.3 Asse.ssment of body temperafure rhythm .... .... .. ... .. ........... ........ .... ........ ... ... .. .... ...... ... .... .... .. ................... 17
2.4 Conclusions & recommendations .............. ...................... ..................... .. .... ...................................... 18
3 The hu man eye & its conneetion to the circadian system ........................................... 19 3.1 Physiology of the eye ........................................ ....... ............. ...... ... .... .................. ..... .... .................... 19 3.2 The relevanee of wavelengths in regard to measurement of light exposure ............................. ... ..... 20
4 Light characteristics ..................................................................................................... 21 4.1 Spectrum ........................................................................................................................................... 21 4.2 lntensity .......... .......... .... .. ........................................... ....... ...... .. ......................... ............ ...... .. ... ...... .. 22 4 .3 Retina! illuminance ........................................................................................................................... 23
5 Devices to record illuminance: requirements, possibilities & restrictions ................. 25 5.1 Current light regi stration methods ................................................ ..... ............................................... 25
5. 1.1 The Daysüneter .. ... ....... .......... ..... .... ...... .................. ... ... .. ... ........... .... ....... .. ...... ................ ............. .. ...... 25 5.1.2 The actiwatch. ................... .. .. ..... ... .... ...... ........ .... .... ... .. ... ... ........... .... .............................. .............. .. ...... 26 5. 1.3 Conclusions .............. .. .. .... .. ... ... ... ... ......... ... ....... .. .. ... .... ... .. .... ...... ...................... .... .... .................... ....... 27
5.2 Objectives & specifications light registration ............ ............. ........ ...... ............................................ 27 5.3 Equipment: calibration & measurement scbeme ....... ...... ....... ..... ........ ... .......... ... ............................. 28
6 Results & relations between illuminance at wrist- and eye level ................................ 29 6.1 Objective 1: the statistica] re lation between i I luminanee eye and wrist ..... ...................................... 29
6. 1.1 Simpte linear regression model ........................ ..... .. ....... ...... ....... ... ... ....... ... .... .. .. ...... ... ... ........... ... ..... ... 30 6.2 Objective 2: determination of the statistica! relation's reliability .... ............. .. ..... .. ... ... ..... ...... ...... .. . 31
6.2.1 Upper- and lower boundaries added to the model .... .. ... ... ... ......... ..... ...... ....... .... .... .... .. .. ...... ..... ... ......... 31 6.2.2 Model divided into d!fferenf illuminance intervals ..... .... ........ ............ .. .. ......... ... ..... .. ... ....... ..... ... ... .. .... .. 33
6.3 Conclusions on the reliability of the statistica! relation between wrist and eye ............... ......... ....... 35
Master's Thesis 3

Assessment Circadian System & Retinal llluminance Exposure
7 New light recording equ.ipment .................................................................................... 36 7.1 Sensor placing on patients with Alzheimer's di sease ...... ... ........................ ... ... ............. .. ...... .. .. ..... .. 36 7.2 The statistica! relation between illuminance eye and chest ............................ .... .......... ... ... .. ............ 37 7. 3 Determination of the statistica! relation's reliability ........................................ ..... .. .. ... .. .................. 39
7.3. 1 Upper- and lower boundaries added to the model ...... .. ...... ............................ .. .. .. .. .. .. .... .. .. .. .. .. ............. 39 7.3.2 Model divided info different intervals ...... .. .... .. .. ........ .. ...... .............................. ........ .. ...... .. ...... .. ............ 41
7.4 Conc1usions on the reliability of the statistkal rel ation between chest and eye .. ........ ..................... 42
8 Comparison wrist-eye relation & chest-eye relation ................................................... 43 8.1 Discussion ... ................................................. .. ...... ... .. ....... .......... .. .... .. .... .. .... .... .. .. .... ..... ...... ... ... ...... .. 45
9 Assessment retinal illuminance & speetral distribution using simulation ................. 47 9.1 Data acqui sition through Radiance and the Lightwareher ...................... .... .. ...... .. .. .... .... .................. 47
9.1.1 Modeling skies in Radiance .......................... .. .... ........ .............. .. ............ .. ...... ........... .... .. .. ...... .... .......... 48 9.2 Objectives & points of attention .............. .............. ...................................... .......... ........................... 48
9.2. 1 Assigned testcases f or simu/ation & measurements .... .......................... .. .... .... .. .. .. ...... .. .. ....................... 49
10 Testcase I: Staffroom V ertigo ...................................................................................... 50 I 0.1 Validation of the staffroom simulation .. .... .... .... .. .... .. ...... .......... ............ .. ........ .. .. .. .. .................... .. .. . 51
JO././ General illuminance level .......... .. .. ....... .. ... ...... .. ... .. ... .... .. ...... .. ............ .. ... ... .... ..... ..... ... .......... .... .... .... .. 51 10.1.2 llluminance level ofwork stations .... .. .. .. ... .... .... .... .... ...... .... ...... ...... ........ .. .. .... ........ .. .......................... .. 52
I 0.2 Speetral di stribution of light .................................................... .... .. .. .. .. .. .... .......... .. .......... .. ...... .. ...... . 53 I 0.2.1 Shortwa velength light in re lation to vertical illuminance .................... .. .... ........ .. .. .. ..... .................. .. .. .... 54
I 0.3 Conclusions .... ... .................................. .... .... ... .. ................................................... .... .................... ... ... 56
11 Testcase 11: Nursing home St. Franciscos ................................................................... 57 11 .1 Validation of the communal living room simulation .......................... ........ .. .. .. .. .............................. 58 11.2 Speetral distri bution of light .... ..... .......... .... ............ .. ........................ .. .. .... .... .... ................................ 59
11. 2. 1 Shortwavelength light in relation to vertical illuminance .. ...... .............. .. .. ........ .. ...... ............................ . 59 11.3 Conclusions ... .. .. .. .... ............ .. .... .... .. .... .. ........... .. .......... ............. ... ... ... .. ... ... ............. ... .................. .... . 62
12 Testcase 111: Testroom .................................................................................................. 63 12.1 Validati on of the testroom simulation .. .......... .. ...................... .. ...... ............ .. .... .. .... ........ ........ .. ........ 64
/2./.l General illuminance level ............ ........ .......... .... .. ................... .. ... ........ ......... ............ .. ................. ......... 64 12.1.2 lllumina nce level ofwork stations .. .... .. .. ...... ...... .. ........................ ........ .. ...... ............................ .. .. .. .. ..... 65
12.2 Speetral distri bution of light .................................................................... .. .................................. .. ... 66 12.2. 1 Shortwavelength light in re lation to vertical illuminance ...... .. ...... ...... .. .. ........ .... ...................... .. ...... .. .. . 67
12.3 Conclusions ... ......... ........... .... ... ...... .. ............. ................................... .. ... ... ......................................... 69
13 Vertical illuminance generated by Radiance ............................................................... 70 13.1 Illuminance registration inthetestroom .. ...... .... ............ .... .. .. ................ ...... .. ............ .. .. .. .... .. .......... . 70 13.2 Generating vertical illuminance in Radiance .............. .. ............ .... .. .. .......... .... ........ ...... .. .. ...... .. ...... .. 72 13.3 Conclusions ........................... .. .... .. ........... ... .............................. ... ... .. .......... ... ........... .... ... ... ... .... ....... 73
Master 's Thesis 4

Assessment Circadian System & Retinal Illuminance Exposure
14 Conclusions, discussion & recommendations .............................................................. 74 14. 1 14.2 14.3
Conclusions ................ ..................... .... .. ... ....................... .... .. ............................................................ 74 Discussion ................................... ... ..................... .... .. .... ....... .... ......................................................... 75 Reco1nmendations ............ ... ................................ ............. ... ... ... .............. ............ .............................. 76
15 Refe1·ences ..................................................................................................................... 77
16 Symbols, abbreviations & formulas ............................................................................. 80 16.1 16.2
Symbols & abbreviations ............................................................................... .. ................................. 80 Formulas & composed algorithms ..... ..................... ... ........... ....................... ..................................... 81
Appendix A: Figures & Tables ........................................................................................... 83
Appendix B: documentation on used equipment & photodiodes ...................................... 94
Dank\\'oord ........................................................................................................................ 101
Master's Thesis 5

Assessment Circadian System & Retinal Illuminance Exposure
Summary The biologica! clock of elderly, especially of patients with Alzheimer's di sease, is often disturbed. The hypothalamic suprachiasmatic nucleus functions as the brain's central clock and any form of stimulation received by the human hypothalamic suprachiasmatic nucleus decreases as age increases. Modulators of the human circadian system are bright light, melatonin, body temperature and physicaJ activity. All of these markers cause considerable impravement of sleep-wake rhythms in elderly without any side effects. Quality of life, through impravement of mood, pelformanee and day-time energy also increase.
The primary objective of the research is the development of a protocol to register potent modulators of the circadian system. Because the protocol will be used in a field situation, and not a conditioned laboratory situation, all kind of possible influences should betaken into account. T he second objective is investigating the possibility of a new methad to register light exposure (retina! illuminance) on theeyes of subjects. Various current methods and devices used for the registration of light are applied in several fieldsof investigation, all are used to delermine the amount of light that is received by the human eye. An ideal situation would be determination of received light without disturbing subjects at all.
Literary study doneon the first objective resulted in several conclusions and recommendations to campose the intended protocol. The second part of the project resulted in multiple measurements aod tests regarding a suitable metbod to record light exposure. Useful information is subtracted from looking closer to the restrictions and flaws current devices have. At the present time the most accurate device to record illuminance levels at eye level is the Daysimeter, because it holds two diodes. Two sensors with peak wavelengtbs around the photobiological peak (short wavelength) and photopic luminous efficiency function. The actiwatch is considered most su itable for the researched target group. The statistica! relation between the i I luminanee level of the wrist and the eye is analyzed. Two diodes worn fora significant period of time, one around the wrist and the other one strapped on to the frame of a pair of glasses provided necessary data. A proposal for new equipment is a broche containing two diodes, the relation between illuminaoce at eye- and chest .level is also analyzed. A metbod of assessing ve1tical illuminance and speetral distribution through simulation is researched in three testcases. The simulation program used is Radiance and to get data on the speetral distribution of the light the Lightwareher is used.
Actigraphy in combination with questionnaires provides reliable data to assess a s leep-wake rhythm, providing the algorithm used to analyze the obtained data is adjusted to the target group. Meaning sealing factor and scoring factors used to assess previous and following minutes are appropriate for Alzheimer patients. The questionnaire used must be a combination of existing and validated questionnaires, different algorithms must be used to score in-bed sleep recordings and daily 24h recordings. Samples for the quantitative determination of melatonin, cao be obtained from serum, plasma, urine or other biologica! specimen. Buhlmann Laboratories has developed several tooikits that cao be used for extracting samples from the human body. The infrared ear thermometer measures core body temperature through the tympanie membrane and is considered applicable in case of Alzheimer patients.
Results for the first objective show the reliability and applicability of the algorithm predicting illuminance values at eye level from data obtained by wearing an actiwatch around the wrist are insufficient. The alternative unit placed on the chest of the subject proved of higher statistica! power compared to the statistica) power between eye and wrist. lts statistica) power is considered strong. Dividing obtained data into different categories clearly shows the derived stati stica] model underestimates the true illuminance level, more so when illuminance levels are higher. All categories show sim ilar differences camparing tme values with calculated values, however these differences are much smalle r than seen in the wrist-eye relation.
Master's Thesis 6

Assessment Circadian System & Retinalllluminance Exposure
Results for the second objective show Radiance is capable of producing reliable results generating vertical illuminance levels. As the distance between the subject and the souree of daylight (usually a window) decreases, the contri bution of shortwavelength light (À465 nm) increases. The contri bution of shortwavelength light is largerincase of measurements directed straight at the souree of daylight and the distri bution of longwavelength light is less dependant of position and viewing direction in comparison to shmtwavelength light.
Both statistica] models analyzed in this research are based on data contammg mostly samples of relatively Jow i I luminanee va lues. In case of light therapy i! luminanee levels often are at least I 000 I x, indicating the relations should be seperately determined forthese higher i! luminanee levels. The difficulty in converting recorded vertical illuminance to retina! illuminance complicates accurate measurements as retina! illuminance depends on the distance and the size of the light source.
Master's Thesis 7

Assessment Circadian System & Retinalllluminance Exposure
San1envatting De biologische klok van ouderen , met name patiënten met de ziekte van Alzheimer, is vaak verstoord . De centrale klok van de hersenen wordt steeds minder gestimuleerd als gevolg van veroudering. Stimuli van het menselijk circadiane systeem zijn helder licht, melatonine, lichaamstemperatuur en fysieke activiteit. Deze stimuli veroorzaken aanzienlijke verbetering van slaap-waak ritmen in ouderen zonder enige bijwerkingen . Algehele kwaliteit van leven als gevolg van verbeterde stemming, prestaties en energie nemen ook toe.
De primaire doelstelling van het onderzoek is de ontwikkeling van een protocol om genoemde stimuli van het circadiane systeem te registreren. Het protocol moet in een praktijksituatie toepasbaar zijn, vandaar dat alle mogelijke invloeden in acht genomen dienen te worden. De secundaire doelstelling is het onderzoeken van een methode om de ve1ticale verlichtingssterkte (retinale verlichtingssterkte) op de ogen van patiënten te registreren. Diverse huidige methodes en toepassingen voor registratie van licht worden geanalyseerd en onderzocht. In een ideale situatie kan ve1ticale verlichtingssterkte op het oog geregisteerd worden zonder de patiënten te storen in hun dagelijkse routine.
Een literatuur studie heeft geresulteerd in conclusies en aanbevelingen betreffende het samenstellen van het protocol. Metingen en tests betreffende methodes om licht blootstelling te registreren zijn uitgevoerd. Nuttige informatie is gehaald uit de beperkingen van huidige methoden. De Daysi meter is op dit moment het meest nauwkeurige apparaat dat verlichtingsniveaus op oogniveau registreerd , omdat deze gebruik maakt van twee sensoren (een voor de biologische respons) . De actiwatch wordt beschouwd als het meest geschikt voor patiënten met de ziekte van Alzheimer. De statistische relatie tussen de verlichtingssterkte op pols- en oogniveau is geanalyseerd door het dragen van twee sensoren, een om de pols en een bevestigd op het frame van een bril. Een voorstel voor een nieuwe meetunit (een broche met twee sensoren) is geanalyseerd, de statistische relatie tussen verlichtingssterkte op oog- en borstniveau is vastgesteld. Een methode om verticale verlichting en spectrale verdeling door simulatie vast te stellen is onderzocht door middel van drie testcases. Het toegepaste simulatieprogramma is Radiance, de Lightwatcher is gebruikt om informatie over de spectrale verdeling van het licht te verkrijgen.
Actigrafie in combinatie met vragenlijsten resulteerd in betrouwbare gegevens om een slaap-waak ritme vast te stellen, op voorwaarde dat het toegepaste algoritme aan de doelgroep is aangepast. Dit betekent een aangepaste schalingsfactor en factoren om voorgaande en nakomende minuten te beoordelen dienen voor Alzheimer patienten toepasselijk te zijn. De gebruikte vragenlijst moet een combinatie zijn van gevalideerde, bestaande en nieuw ontwikkelde vragenlijsten. De monsters voor een kwantitatieve bepaling van melatonine gehalte kunnen uit serum, plasma, urine of andere biologische specimen worden verkregen. Hiervoor kan een tooikit ontwikkeld door Buhlmann Laboratories worden gebruikt. Een oorthermometer kan het beste toegepast worden in het geval van Alzheimer patienten, hierdoor worden betrouwbare resultaten verkregen.
De betrouwbaarheid van het algoritme dat verlichtingssterkte op oogniveau voorspelt op basis van verlichtingssterkte gemeten op polsniveau is ontoereikend. De alternatieve unit, geplaatst op de borst van de patient, is statistisch gezien superieur in vergelijking met de relatie tussen oog en pols. De resultaten geven duidelijk aan dat het alternatief van een meetunit op de borst een betere is in vergelijk met de actiwatch. Verdeling van data in verschillende categorieën qua verlichtingssterkte toont duidelijk aan dat het statistische model het ware verlichtingsniveau onderschat. Zeker in het geval van hogere verlichtingsniveaus. Alle categorieën tonen gelijkwaardige verschillen, de verschillen bij de borst-oog relatie zijn aanzienlijk kleiner vergeleken met de pols-oog relatie.
Master's Thesis 8

Assessment Circadian System & Retina I Illuminance Exposure
Resultaten tonen dat Radiance uitermate geschikt is voor het bepalen van verticale verlichtingsniveaus. Metingen tonen bovendien dat wanneer de afstand tussen de patiënt en de bron van het daglicht (meestal een raam) afneemt, de bijdrage van licht met een korte golflengte (À465 nm) toeneemt. De bijdrage van licht met een korte golflengte is groter in het geval van metingen richting de bron van daglicht. De verdeling van licht met een lange golflengte is minder afhankelijk van positie en kijkrichting in vergelijk met Jicht met een korte golflengte.
Beide statistische modellen (oog-pols en oog-borst) zijn gebaseerd op data met voornamelijk lage verlichtingssterkten, in het geval van lichte therapieverlichting zijn de niveaus vaak minimaal J 000 lux. Aparte algoritmen voor hogere verlichtingsniveaus moeten worden bepaald. Het vertalen van geregistreerde verticale verlichting naar retinale verlichtingssterkte compliceert de analyse, vanwege haar afhankelijkheid van de afstand tot- en de grootte van de lichtbron.
Master's Thesis 9

Assessment Circadian System & Retina! Illuminance Exposure
1 Introduetion The biologica! clock of elderly, especially of patients with Alzheimer's disease, is aften disturbed. The hypothalamic suprachiasmatic nucleus (SCN) functions as the brain' s central clock, generating 24h cycles in firing cell patterns. These cycles are referred to as circadian rhythms and most of them occur with a period of approximately 24h, even when isolated from cues in the environment (light and dar·kness). Circadian rhythms exposed to normal environmental patterns, synchronize to these 24h cycles due to the SCN's capability to understand environmental clues. Body temperature, hormones like melatonin and cortisol and regulation of arousal are controlled by different brain structures [Van Someren et al. 2000].
With aging the circadian regulation changes. lts period, amplitude, synchronization with the environment and sensitivity to environmental clues of Zeitgeber [Dijk et al. 2000] work according the 24h cycle and have shown changes with aging. A decrease in neuronal activity, the amount and synthesis of vasopressin (a peptide in the SCN) are seen in the SCN of elderly. One of the main reasans for sleep disturbances in Alzheimer patients might be an extreme low vasopressin expression [Van Someren et al. 2000].
Complaints in case of sleep disturbances are multiple, one of the most common is nocturnal awakenings. Difficulties falling asleep and waking up very early in the morning are well-known issues as well [Uchimura et al. 1998]. Sleep disturbances are aften associated with:
• Cardiovascular problems (hypertension; angina pectoris; cardiac insufficiency) [Jensen et al. 1998];
• Perturbation of endocrine function [Van Cauter et al. 1998]; • A decline of immune functions (natura! killer cell activity) [Irwin et al. 1998];
Any form of stimulation received by the human SCN decreases as age increases. A reduced pupil diameter and yellowing of the lens [Teresi et al. I 994] cause less light transmission through the eye. Because elderly aften are Jess agile they are also exposed to less bright light and engage in less physical activity. Therefore feedback from the pineal hormone melatonin is reduced [Van Someren et al. 1997]. A person with dementia is no Jonger able to adapt, thus the living environment must be adapted to the person's specific needs. Such adaptations are believed to be effective in improving health, behavior, and well-being.
Modulators of the human circadian system are bright light, melatonin, body temperature and physical activity. AU of these Zeitgebers cause considerable impravement of sleep-wake rhythms in elderly without any side effects. Quality of Jife, through impravement of mood, performance and day-time energy also increase. Further optimization of the circadian stimulation method, and investigations on the mechanisms, are prerequisites for general clinical applicability [Van Someren et al. 2000].
Master's Thesis 10

Assessment Circadian System & Retinal Illuminance Exposure
1.1 Objectives of the research Although it's generally understood light positively influences the human circadian rhythm, its exact role is unknown . How to register possible effects of light and other markers of the circadian system is the main objective during this research. To the first objecti ve of the research, development of a protocol to register potent modulators of the circadian system, a second objective is added during research. This second objective is investigating the possibility of a new method to register light exposure (retina! illuminance) on theeyes of subjects.
1.1.1 Development of a protocol to register potent modulators of circadian system The first objective of this research is the development of a protocol to register a number of potent modulators of the circadian rhythm. Sleep disturbances are the main cause for this investigation, impravement of the sleep-wake rhythm can possibly lead to impravement of mood and well-being of the subjects. The intended protocol shows which equipment is necessary for the measurements and how to use this equipment. Subjects ideally should not be aware of the presence of any measuring devices. Because the protocol wilt be used in a field situation, and not a conditioned Iabaratory situation, all kinds of possible influences should betaken into account.
Fif?ure I. 1: markers of the circadiwt system and the influence of light exposure.
Because the protocol must be applicable for people suffering from Alzheimer disease, some of the differences between dementia and Alzheimer are explained. The definition of dementia: 'dementia is an impairment of thinking and memory that inteiferes with a person's ability to do things which he or she previously was able to do'. The definition of Alzheimer according to Alzheimer Nederland: 'Alzheimer's disease is the common cause of dementia, and is particularly common in elderly. Because it is the most common cause of dementia, Alzheimer's disease is commonly equated with the general term dementia. Alzheimer's disease is a specific form of dementia having very specific microscopie brain abnormalities ' . Alzheimer's disease is typically a slowly progressive disorder that involves memory for recent information (short-term memory) and one or more other abilities, such as speech and Janguage, personality, decision-making and judgment or awareness and ability to interact with the environment. At the most, it can be determined post-mortem after brain tissue research.
Master's Thesis 11

Assessment Circadian System & Retinalllluminance Exposure
1.1.2 Assessment & modification of current light registration methods Various current methods and devices used for the registration of light are applied in several fields of investigation, all used to determine the amount of light that is received by the human eye. The devices that have proven accurate are however not applicable in the case of patients with Alzheimer's disease [Bierman et al. 2005], because of the mental state of the subjects. Any head-mounted devices or devices including cables or wires are not accepted by the patients, therefore another solution is necessary. This, and analyzing application possibilities of CUtTent registration methods, is the main objective of the research.
All conditions required to develop a new registration device are discussed and researched. The only available device applicable in case of Alzheimer patients known at this point is actigraphy, the actiwatch is wellknown. This wrist-worn device measuring activity is equipped with a photodiode to record illuminance levels as well. lnvestigations have shown that Alzheimer patients are non-resistant of these watches and measurements are not significantly influenced by any behavior of the patients [Kushida et al. 2001 ]. Generating an algorithm that prediets illuminance levels at eye level from wrist level illuminance is possible through analysis of retrieved data. Several statistica! relations between illuminance levels between wrist- and eye level are analyzed. Experts (Project leader Lectoraat Vraaggestuurde Zorg; experience expert nursing home; Netherlands Institute for Neuroscience) on this topic are consulted and opinionated on possible placement of a new device (on clothing or otherwise). They are also asked whether patients wil! reject or accept this device on that particular position. The new device must be thoroughly tested and analyzed for applicability and accuracy.
Alzheimer's disease knows several degrees of severity, in an early stadium of the illness patients can still be instructed to wear a device. The patients are in a state of mind where they can accept this and measurements wil! not be intluenced by touching, or complete removal of the device by the subjects. However as the severity of the disease increases patients prove less willing to wear any device. An ideal situation would be to record received light without disturbing the subjects at all. In order to achieve that rooms subjects live in have to be simulated and the movement of the patients has to be recorded. The assumption data acquired by the si mulation (linked to the position of the subject in the room) provides reliable data regarding the amount of light (retina! illuminance) received by the subject is investigated.
1.2 Report structure Chapter 2 will elaborate on the first objective, an introduetion to the circadian system and its relevant markers are given. Based on a previous literary study recommendations and imperative adjustments regarding current assessment are provided. Chapter 3 concentrates on the physiology of the eye, information essential while analyzing current devices for light registration and researching the possibility of new equipment. Specific qualities of light en other relevant information about the light spectrum are also essential for this research, therefore they are elaborated on in chapter 4. The restrictions of current recording devices and the possibilities for any new devices are reported on in chapters 5 to 8, where statistica! relations are tested on their reliability. The second option, registration without any device placed on the subject, is researched and reported on in chapters 9 to 13. Finally conclusions, discussion and recommendations are gi ven in chapter 14.
Master's Thesis 12

Assessment Circadian System & Retina! Illuminance Exposure
1.3 Topical subjects The relevanee of the research topic is demonstrateel on a daily basi s, articles often appear in newspapers and almost everybody knows someone with problems in this area. Just recently an artiele appeared in the Dutch newspaper 'De Volkskrant' and the subject is also used by cartoonists.
de Voll.sl.:rant 11 JUni 2008 . pag 1 .._
- I
1:1
Onderzoek in twaalf tehuizen: tl-verlicl1ting remt acl1teruitgang en verbetert humeur
Licht helpt demente bejaarde • Licht \Nerkt net zo goed als medicijnen, zegt onderzoeker. • 'Klinische relevantie groot.' Van onze verslaggever Broer Scholtens
AMSllöRDAM D~mente bejaarden dte lanv;durig in goed verlichte ruiiOLl'O z'nen, hebben minder lasc van depre-s.,; leve buien en een slecht humeur. V<-ellirht remrook
de cognitiL"Vt' <K hlc·ruitga ng. Dit blijkt uil onderzoek in twaalf Nederlandse verzorgingsteh1.1izen. Ih1·joumal oflhe Americnn ~\1t•dical Associalion (/;\.\IA) pu.bliü'<'fl de rosuhalen eJVan vand.1ag.
Bij mensi.'n met denu.•nüt~ raakt de biolol:ische klok~:oleiddijk VJn -;l~1g: zt• siap~n 's nachts sk•chler t.•n gJanvaak dolen. Overda~ h.1len ze her sladpLckon in. ·
Onderzoekers van het Nederlandse lns:rirumvoor Neurowett:n· schappon (NIN) in Amsterdam
hchlx·ngeprobccrd met t~xtra licht die al\\'ijkonde klok in hetgoreolto krijgen. Ze voorden her onderzoek uit in verzorRi.ngstehuizen in Friesland en Noord-Holland.
Kijna rw..,honderd derneme beΕlJ.rde n, voor~ll vrouw{'n, deden da.uaan mee. De gemiddelde leefrijd w.1~ 86 ja.u. ln een dt""elvan de daAverblijvC"n in de tehuizen hing('n dC' ondt"'rzoc-kt:"rs t"Xrra veeltibuizen op. LOl een lichtste-rkte van 1.000 Iu.•. In een ander deel van de ruimren werd <k' verlichting op
een laag pitje gehouden, 101 300 lux. l)c buizen brandden van neg<'n nur 's morgens tot zes uur 's .lVonds.
llejaarden en personed wisten nier hoe bij hen deverlichring w,1s goregeld.Aan do hand vJn vragt•nlijsten. zools cogniri t'- en depr<<siett•qen, \\' erdt~n wrschillen in kaan gobrachr.
Overmatig licht remt do cogniliC'Vt achteruirga.ng(van hel orientJ!ievermogen en de geheugenfunoie) met zo'n s procenl. De-
prtssii"Yt•r~chijns{'l i:."n JIJmen mel 19 proctont af. Lcrwijl dC' demème tx·/·Jardt:·n Sl 1procen1 inet<rding~n ze f kunden doen, zo~1ls brood SO\t>fl'n.
IJe klinische- relt"va-mie i\ groot, vindL de vf"rantwoordelijke ondcrzot- kt•r Eus: van Someren v~1n het NIN. 'Demt•nte bejaarden klijgen nu med_kijnen mee alll'rlt'i bijwl'rkingen zo,1ls mio;;sl'lijkhL•ict, duizeligheld en maagcdamlklachren. Mot veellichr is het >elfde re bereikt· n zonderdie bijwt•rkingen.'
Fi[!.ure 1.2: recelll artical abour the research topic in a dutch newspaper (in dutch) [de Volkskrant}.
FOKKE & SOI<I<E PAs;..s;:I!N L..tC.H"1"'"t"HQ_R..AP'~ TOE ~ ~-IV\..é.NlTE e.e.JA.AROe.N
(A)
r:>c;..n-
HOE H!TfN JE f<.INPEREN .'
;: .... ~ "' ~ •
(B)
r:>c;..n-
FOKKE & SOKI<E Applying Lighttherap)' On Demented Elderly
~Up, ~~~
\ V(bat.Are Your
Cbi\dnll'• Naaaart
Fi[!.ure /. 3: cartoon about the topic in dutch (A) and en[!,lish (B){foksuk. nJ}.
Master's Thesis
-" ~
" .... "' ~-
• ~
13

Assessment Circadian System & Retinalllluminance Exposure
2 The circadian system: markers & registration Knowledge of certain different brain regions and hormones involved in the regulation of circadian rhythms is necessary in order to understand the circadian clock mechanism and other relevant aspects. Markers of the circadian system are identified and ways of assessing and recording those markers are discussed.
2.1 Circadian doek mechanism In order to basically understand the biologica! clock and some of its actions relevant definitions regarding this research are given and explained:
• 'Hypothalamus: reguiales various metabolic and autonomie processes, it is a structure in the brain located below the tlwlamus [ Purves et al. 2001]. Hypothalamus consistsof various nuclei '.
• 'Suprachiasmatic nuclei ( plural form of nucleus): nuclei in the hypothalamus situated immediately above !he optie chiasm on either side of the third ventricle in anterior hrpothalamus. The SCN is one offour nuclei that receive nerve signa/s directly from the retina through retinohypothalamic tract (RHT); the others are lateral geniculate nucleus (LGN), the superior colliculus and the preteeturn · [ Purves et al. 2001 ].
(B)
Figure 2. I: schematic summary of targets in.fluenced by photosensitive retina/ ganglion cells (A). Projections to the SCN from the retinohypothalamic tract (RHT). The hypothalamus, showing the location of the suprachiasmatic nucleus (SCN), which in mammals is the primary 'biologica/ clock' (B). [Purves et al. 200I].
'SCN provides three major output pathways. The main pathway, which comains the largest portion of the SCN efferent flow, runs mainly to vSPZ and dSPZ with smaller proportion terminating to the DMH. An other pathway runs info the media/ preoptie region (MPO) and then up info paraventricular nucleus ofthalamtts. The third pathway runs to the retrochiasmatic area and the capsule of the ventromedial nucleus. A lso smal/ numbers of SCN axons innervale directly the are as that are involved in feeding, wake-sleep cveles and secrelion of hormones such as melatonin and corticotrophin-releasing hormone (CRH) [Saper et al. 2005]. Cells in the SCN core oscil/ate in response to light stimulus. Although light induces clock gene expression in the SCN only during the night, it is found that light exposure always increases firing rat es in SCN neurons I Meijer et al. 1992]'.
Master's Thesis 14

Assessment Circadian System & Retina! Illuminance Exposure
2.2 Markers of the circadian system The markers most aften used to assess the human circadian system are melatonin, sleep-wake rhythm and body temperature. lts assumed changes in these markers can cause significant alterations in the regulation of the biologica! clock. Temperature and melatonin are in versely related and tend to change in unison [Cagnacci et al. 1992], it' s understood that both al so influence the sleep-wake rhythm .
Circadian markers are usually defined as the phase at which peaks of the concerned rhythms occur. Although body temperature must be carefully measured it provides a reli able assessment of the circadian system. The temperature rhythm is stabie within an individual across multiple nights .
3000 :lOOD
(A) 380 38.0
2500 37.5 2500
37.5
"' "' <= 200~ ë 2000 37 .0 "' 37.0
"' 0 0 u u ~ 1500 36.5 ~ i';> 1500 36.5 ~ :?:
·:;
ü D ü !i -< 1000 36.0 -< 1000 38.0
50:l 35,5 500 35.5
0 35.0 0 15:00 23:00 07:00 15:00 23:00 07:00 15:00 23 :00 07:00 15:00 15:00 23:00 07:00 15:00 23:00 07.00 15:00 23:00 07:00 15:00
Figure 2.2: Representative core-body temperafure (red) recordings with a !wo-harmonie cosinor model (blue) of the core-body tempera/ure rhythm superimposed over the raw data. Th e recordings are fr om a normal control subject (A) and a patient with Alzheimer 's disease (B) [ Harper et al. 2004].
Melatonin is al so recognized as marker of the circadian system [Lewy et al. 1989]. 'Melatonin is synthesized and released in the pineal gland primarily during the nighttime hours (whether the subject is a wake or as leep) in a prominent on/off pattemfollowing a parabalie curve'. The phase at which me laton in level s exceed a predefined point under dim light is typically used as a circadian marker. Melatonin is also stabie within an individual across multiple nights. In older humans nighttime melatonin levels are reduced, in comparison with younger humans, at least 50% while daytime levels are unchanged .
: . ! I 6 (pglml)
·~ 60 (B)
"' . ' I
o+---r-~~~--~--r-~--~---0 6 12 18 24 6 12 18 24
Time of Day (hr)
Figure 2.3: Raw data plots of daily variation of serum melatonin concentra/i ons in Alzheimer' s patients (A) and healthy elderly (B) [Mishima et al. 1994).
Master's Thesis 15

Assessment Circadian System & Retinalllluminance Exposure
The third circadian marker elaborated on in this research is the sleep-wakefulness rhythm in humans, which persistsin constant conditions. The phase of the sleep-wakefulness rhythm used as circadian marker is usually the onset of sleep or of wakefulness.
Activities such as food intake and physical activity possibly influence measurements concerning the assessment of the circadian system. These factors are referred as masking effects and can cause a circadian marker to transient increase or decrease. Therefore the assessed rhythm is possibly not representative of the true endogenous rhythm. In order to accurately assess the human circadian system these masking must be controlled, which is done by utilizing a constant routine. Statistica) elimination of masking effects can be accomplished by utilizing regression models to separate circadian and masking components.
2.3 Assessment & registration of relevant circadian markers In order to provide a reliable view on the human circadian system, the markers discussed above need to be registered and analyzed. Various current methods are suitable for most humans, however the category of patients with Alzheimer disease is group that needs a different approach.
2.3.1 Assessment of sleep-wake rhythm Current methods of recording sleep-wake rhythms are multiple, most commonly used are polysomnography (PSG) and the actiwatch. 'Polysomnography is a comprehensive recording of the biophysiological changes that occur during sleep'. lt is a sleep study, where the sleep-wake cycle is being recorded through brainwaves (EEG), electric activity of muscles (EMG), eye-movement (EOG), blood pressure, blood oxygen saturation en heart rhythm (ECG) [Life Sciences Data Archive]. In the literature study concerning existing methods of detecting sleep it is understood that polysomnography is the 'golden' standard forsleep detection, all other methods are compared to PSG.
Fi?,ure 2.4: Polysomno?,raphy in prof!, re ss [Life Sciences Data Archive].
'Accelerometer actigraph ( actiwatch) is a wrist-worn monitoring device housing a linear accelerometer, recording activity. Actiwatches are small actigraphy-based data loggers that record a digitally integrated measure of gross motor activity'. Each model of actiwatch actigraph is equipped with a highly sensitive accelerometer as well as the ability to record data from a second input or sensor. This second input makes them very useful for a wide variety of research or clinical applications. A digitally integrated recording of wrist activity is a reliable indicator of sleep-wake state. When optimized algorithms are used adequate agreement with simultaneous PSG measurement is high. Different types of actiwatch yield accurate and va lid data relative to PSG recordings [Kripke et al. 2001]. Significant correlations were found for estimates of total sleep time and of sleep efficiency derived from all movement quantification rnadalities when compared to PSG. Sleep estimated with calibrated scoring algorithms reflecting the particularities of each motion-quantifying modality is comparable. However, sealing-factors may have to be calibrated for optima] sleep-wake detection among other age groups [Girardin et al. 2001].
Master's Thesis 16

Assessment Circadian System & Retinalllluminance Exposure
Questionnaires are used to distinguish between sleep disorders (including no sleep disorder), to be a reliable sleep disorder screener and serve as a practical, user-friendly screening tooi for primary care and sleep centers. Another form of registration is a sleep diary in which daily activities wiJl be recorded as well as bed- and get-up times. The metbod used to combine subjective data with actigraphic data is further investigated [Baumel et al. 1997] in using the questionnaire Circadian Sleep lnventory for Normal and Pathological States (CSINAPS) simultaneously with actigraphic measurement. Good correlations were found between questionnaire items about habitual timing of sleep and wakefulness and their actigraphic counterparts.
Activity monitors have the ability to provide useful data on individuals' sleep- wake patterns without laboratory confinement [Girardin et al. 2001]. Significant correlations were found for estimates of total sleep time and of sleep efficiency derived from several movement quantification modalities when compared to PSG. It's recommended that clinicians should use subjective data as an adjunct to actigraphic data when evaluating total sleep time and sleep efficiency, which is especially important for people with sleep disorders. The metbod used to combine subjective data with actigraphic data in demented elderly has proved to increase the reliability of the results. lt is indicated that both sleep and 24h activity rhythm variables obtained with actigraphy in demented elderly can improve considerably with extended recording duration. The statistica] power of actigraphic sleep studies can be enhanced by extending the recording duration, for which two weeks is recommended.
2.3.2 Assessment of melatonin rhythm Samples for the quantitative determination of melatonin can be obtained from serum, plasma, urine or other biologica] specimen. Buhlmann Laboratories bas developed several tooikits for extracting samples from the human body. During nighttime samples have to be taken under dim light. Taking samples during nighttime may cause sleep disturbances and influence the circadian rhythms in the subjects. However, as mentioned above, the daily rhythm of serum melatonin level was hardly affected by the masking effect of sleep. Therefore, the procedure of sampling used has little, jf any, influence on the daily rhythm of serum melatonin [Uchida et al. 1996].
2.3.3 Assessment of body temperature rhythm Body temperature is often measured using the mercury-in-glass thermometer (MIGT) at the oral, rectal, or axillary site. However its accuracy is found questionable [Severine et al. 1997]. The electronic predictive thermometer (EPT) uses a heat-sensing device known as a thermistor to sense temperature. This thermometer can be used to obtain quick oral or reetal temperatures within 20 to 40 seconds. The infrared ear thermometer (IET) measures core body temperature through the tympanie membrane.
In case of patients with Alzheimer's disease the infrared ear the1mometer is preferred, because of its applicability in this group. The variability in operator technique in the use of ear thermometers produces wide variations in ear temperature measurements. Handedness of the operator, position of the patient, and the ear in which the measurement was taken had minimal effects on temperature readings. Ear temperature measurement is operator dependent Training and monitoring of technique are essential. Perioctic reevaluation may improve consistent use of proper measurement technique. Clinicians in multioperator environments may find oral and reetal temperature measurement methods preferabie until ear thermometer technology improves.
Master's Thesis 17

Assessment Circadian System & Retina! Illuminance Exposure
2.4 Conclusions & recommendations Actigraphy in combination with questionnaires provides reliable data to assess a sleep-wake rhythm, providing:
• The algorithm used to analyze the obtained data must be adjusted to the target group: sealing factor and scoring factors used to assess previous and following minutes must be appropriate for Alzheimer patients;
• The questionnaire used has to be a combination of existing and validated questionnaires; • Different algorithms must be used to score in-bed sleep recordings and 24h recordings; • Duration and sampling of actigraphic recordings must be examined and determined;
Recommendations regarding further investigation jn the field of melatonin level registration are:
• Determine whether tooikits currently available are applicable in case of patients with Alzheimer, if this is not the case another methad todetermine melatonin levels has to be developed;
Recommendations regarding further research in the field of determination of ear temperature are:
• Determine if ear temperature measurements are really not reliable for application, and in that case findan alternative for body temperature measurements on patients with Alzheimer;
The assessment of the circadian markers discussed above is imperative todetermine the circadian rhythm of humans. Impravement of this rhythm, for healthy as wel! as demented elderly people, has been demonstrared by application of a variety of potent modulators of the circadian timing system, like bright light. In regard to circadian markers discussed above recommendations are final. To complete the protocol, retina! illuminance exposure of the subject must be registered, the main objective of the research. To understand the complexity of problems regarding the recording of retina! illuminance, the physiology of the eye andrelevant characteristics of light are elaborated on in the following chapters.
Master's Thesis 18

Assessment Circadian System & Retinalllluminance Exposure
3 The human eye & its conneetion to the circadian system Registration of vertical illuminance at eye level is the ma in ob jee ti ve of this research. In order to provide a suitable method it is essential to onderstand the conneetion between the human eye and the circadian system. Relevant knowledge about the human eye is reported on and important information regarding photobiological responses is provided .
3.1 Physiology of the eye Light enters the eye through the pupil which is surrounded by the iris, a circular muscle controlling the amount of light allowed toenter the eye. The most powerful lens of the optical system is the cornea, an external surface covering both the pupil as well as the iris. Tagether with the crystalline Jens the cornea allows production of a sharp image at the retinal photoreceptor leveL lts purpose is to focus light onto the back of the eye, tagether with the sclera it forms the external layer of the eye.
(A) (B)
Clllary body
Figure 3.1: vertical (A)- and horizontal (B) sagiual section of the adult human eye [ Kolbet al. 2006].
Responsible for any photobiological responses is light that reaches the retina (at the back of the eye), which is patt of the human central nerve system. The fovea is considered to be at the centre of the retina and its surrounding area is defined as retina. Fovea is primary responsible for sharp and detailed vision. Ganglion cel Is are Jocated in the retina and !ie in the innermost part ciosest to the Jens and front of the eye, where rods and cones (classica] photoreceptors) !ie outermost in the retina [Kolb et al. 2006].
(A) .~P~~~fi~i&~~iii[<~~~~~~ rodll co nes
00~~~~~~~~~~~~~~~~~ ~·:.._• -----fo· ·~~ne"-'-----1
~~r:~~~W~'9
cell
Figure 3.2: simple diagram of the organization of the retina (A), 3-D blockof a portion of human retina (B) [Kolb et al. 2006].
Master's Thesis 19

Assessment Circadian System & Retinalllluminance Exposure
Rods and cones are considered traditional photoreceptors. Vision at very low light levels is provided by the rod system, scotopic vision means only rods are activated which makes it impossible to sense color differences. Photopic vision occurs when only cones are activated, a situation occurring only in case of very high light levels. Photopic vision allows color sensing abilities at the expense of poor light sensitivity. A contribution of both rods and cones is referred to as mesopic vision. Speetral sensitivities for photopic, mesopic and scotopic vision are presented in figure 3.3.
I I
I I
I 1." '· I ;
:· 1: I
/'v1u~j: /.' I
I . 1 ,..-:
400 500 600 70 ~
Wavelengtil !nrni
Figure 3.3: Speetral sensitivilv Junelions of the eye. In photopic vtswn, when cones are active, the sensitivity follows the function V(/) with a peak wavelength of 555nm. At very low light levels only rods are active, and speetral sensitivity Jollows V'(l)-function with a peak wavelengtiJ of 505nm. The V111,s(/) is one example of the possible mesopic speetral sensitivity as noconsensus exists on it yet. The V10(l) is is the photopic speetral sensitivity for centrally fixaled large target [Eloholma 2005].
The discovery of a new photoreceptor placed close to the human eye showed the presence of ganglion ceffs, which are primarily responsible for the non-image forming (NIF) effects (figure 5.1). The novel photoreceptor is abbreviated as ipRGC (intrinsicaffy photosensitive retina! ganglion ceffs), or as mRGC (melanopsin-containing retinal ganglion cells). The two main differences of ipRGCs compared to cones and rods, are:
• light depolarizes with ipRGC while the opposite happens with rods and cones; • ipRGCs are more inert compared to rod and cones, response latencies being as long as a minute.
3.2 The relevanee of wavelengtbs in regard to measurement of light exposure The ipRGCs exhibit physiological light responses in the absence of rod/cone activity and in complete isolation from other retinal cells. Light detected by the eyes and falling on the human retina is transmitted to the SCN by a neural pathway, causing photobiological responses. These responses appear simultaneously with photic entrainment and melatonin suppression, confirming the assumption these ganglion cells are involved in circadian regulation [Lucas et al. 2004].
'In genera!, characterization of light exposures for photobiological responses should include radiometric quantification of intensity and spectrum. Direct measurement is commonly determined as a function of wavelength in the form of irradiance or photon density. Photobiological responses vary significantly in their sensitivity to different wavelengths and when the speetral bandwidth ofthe light stimulus increases this bec01nes a less than adequate measure. Therefore it's important to record using both photodiodes which are most sensitive ar01md the two different wave!engths · [Brainard et al. 2004].
Master's Thesis 20

Assessment Circadian System & Retina] Illuminance Exposure
4 Light characteristics In this chapter the light characteristics linked to the novel photoreceptor are reviewed in regard to human circadian rhythms. The basic understanding of this chapter is essential in understanding- and development of (new) measurement equipment for light exposure.
4.1 Spectrum The peak wavelength of circadian responses is shifted towards the blue end of the spectrum compared to the traditional visual speetral sensitivities for pbotopic (V(À), Àmax=555nm), mesopic O"max between photopic and scotopic peak wavelengths) and scotopic (V'(À), Àmax=508nm) vision. A series of action spectra are presented in table 4.1 concurrent with the discovery of ipRGCs [Berson et al. 2002]. The first circadian phototransduction model to incorporate the suggested speetral opponency is presented in figure 4.1.
T bi 41 A I . a e .. na yttc actwn spectra or c1rca 1an, 1p1 ,an f d. . RGC d d.fi d f ocu ar responses mo 1 1e rom B . d 2006) ramar ,
Species Biologica] responses Stimuli tested Peak À [nm] Human (homo sapiens) Plasma melatonin suppression 8 fluence-response curves Est. Àmax = 464
[Brainard 200 1] (hbw J 0-15nm) (446-477) Human (homo sapiens) Plasma melatonin suppression 6 fluence-response curves Est. Àmax = 480
[Thapan 200 I] (hbw 5-13nm) (457-462) Human (homo sapiens) Cone cell ERG-wave 7 fluence-response curves Est. Àmax = 479
[Hankins 2002] (hbw :5 I Onm)
Wa\'elenQih. M1
Figure 4.1: Predictions of the modelto the constant criterion speetral sensitivity data of Brainard et al. (2001) and ofThapan et al. (2001). Graph bv Rea et al. (2005).
Due to aging human eyes undergo changes on several relevant aspects regarding this research. Pupil diameter alters under both light-adapted and dark-adapted conditions [Weale 1982], the wavelength-dependent transmittance also changes both influencing the impact on photobiological responses. The relative pupil area has its maximum value at the age of about 15 years and is reduced throughout adult [Charman 2003], and it this factor alone reduces the retina] illuminance to half in the eye of a 70-year-old.
Master's Thesis 21

Assessment Circadian System & Retina lilluminanee Exposure
Equation I is used to calculate the relative efficiency of light for suppression of melatonin with regard to the age:
{I}
with R= E),(À) = Tc(),) = T1(À) = A=
effective irradiance at the retina speetral irradiance of the souree at the cornea transmission of the cornea (near-axial path) transmission of the lens (near-axial path) pupil diameter (near-axial path)
[W/m2/nm] [W/m2/nm] [ -] [ -] [~m]
S(),) = melatonin action spectrum [ -]
4.2 Intensity In genera], results obtained by Zeitzer are the most commonly used as a reference for the light intensity required for melatonin phase shift (figure 4.2A) and melatonin suppression (figure 4.2B). As Jittle as -100 Jx of (cornea!) light could produce half of the maximal phase delay shift found at I 0000 I x and that 90% of the asymptotic maximum response could be achieved with 550 lx. This would indicate that human circadian pacemaker is highly sensitive to ordinary room light and that minor changes in room light intensity could have a major impact on entraioment of the human circadian pacemaker [Zeitzer et al. 2000]. Brainard also explained that although it was initially understood only high illuminance levels (>2500 Jx) could induce photobiological responses, lower iJluminances ( <200 I x) can suppress melatonin and cause melatonin phase shifts [Brainard et al. I 997].
1.2
(A) .. (B)
t.o ·t· ·-·~ ~ 5., (i; c: ,s · ~ o..a
"' ;E !!' 1/ • .c ~ 0.6 "' .
~) .,.,
" "' . i "' "' ·2 0.4 .<: 0.
·~ -1 _;·~ * ~ ~ 02
Qj ---:::;: 0 . . 0.0 .. "'·'
10 100 11100 10000 10 too 1000 101100
lllumlnance (lux) lllumlnance (lux)
Figure 4.2: I/ luminanee-response curve of the lwman circadian pacemaker. The shift in the phase of the melatonin rhythm (A), as assessed onthe dayfollowing exposuretoa 6 x 5h experimenta/light stimulus, has beenfitled with a four parameter Jo gistic model using a nonlinear least squares analysis. Acute suppression of plasma melatonin ( B) during the light exposure a lso has been fitled with a four parameter logistic model using a nonlinear least squares analysis. The logistic models predief an inflection point of the curve (the sensitivity of the system) at 120 lx. Saturation of the phaseshift response is predieled lo occur with 550 lx and saturation of the melatoninsuppression response is predieled to occur with 200 lx. fndividual subjects are represented by •. the model by the continuous fine, and the 95% confidence intervals by the dotled fin es [Zeitzer et al. 2000].
Phipps-Nelson showed a biological stimulation in a healthy subject exposed to 1000 lx at eye level. It's assumed this value has to be multiplied with a factor three due toaging effects of the eye, therefore needing a illuminance level of 3000 lx [Phipps-Nelson et al. 2003] .
The accurate measurement of retina! illuminance is more diftïcult than measuring horizontal task illuminance as retina] illuminance depends on the angle of gaze, position of the head, pupil size [Gaddy et al. 1993], Jens transmission [Charman 2003], and possible photophobic response such as squinting [Sheedy et al. 2005].
Master's Thesis 22

Assessment Circadian System & Retinalllluminance Exposure
4.3 Retinal illuminance Retina! illuminance is the amount of light falling on the retina [Wyszecki et al. 1982]. According to research by Wyszecki et al. retina I illuminance produced by external stimulus cannot be determined directly. Definition of retina! illuminance of a particular retina! area is the product of the photopic luminanee L [cd/m2
], in the corresponding direction of extern al field, and the apparent areaAp of the pupil seen from that direction [Ariës 2005]. This unit is called 'Troland' in practice situation and is useful to measure the internal stimulus from which the main effects of pupil variations are eliminated. A Troland is defined as: the (conventional) retina[ illuminance when a surface wirh luminanee of one candela per square meter is viewed through a pupil at the eye with an area ofone square millimeter:
er = L scene • Ap
with e,= L~\.:l'llC =
Troland value scene luminanee pupil area
Troland values are related to illuminance at the retina by the following function [Nillson I 983]:
with E rctinal = retina! i! luminanee e, = Troland value dcyc = diameter of the hu man eye (=22.6mm)
{2}
[td] [cd/m2]
[mm2]
{3}
[lx] (td] [mm]
This research concentrates on recording vertical illuminance which is defined as: illuminance measured in front of the eye and is not restricted by the human anatomy (Even [I x]).
e, [td]
E,.1NJ (lux]
1 j ------__ .... , .... " "'
-;.::_Trm.n'r----------- --. ·. !. . L""" ( cdlm
2]
d.,..=22,6mm
Figure 4.3: Schematic overview of different variables which are necessary to calculate !he light in the eye with resard to the traland value {td] and the retina! illuminance [/x] [Aries 2005].
Aries used a tailor-made measuring instrument: the Retina! Exposure Detector (RED; for measurements in environments with luminances between 200 and 750cd/m2) . Under homogeneaus conditions, the RED reduced the ordinary vertical illuminance withafactor 0.24 [Ariës 2005].
Therefore it must be noted that vertical illuminance referred to in this report is not equal to the desired retina! illuminance relevant to photobiological responses in humans. lf recording of vertical illuminance is mentioned, this paragraph is referred to as significant component of the research. However, this investigation focuses on recording of vertical illuminance.
Master's Thesis 23

Assessment Circadian System & Retina! Illuminance Exposure
: r-r'"' ' '
•!
recording exposure retina! illuminance using a re gistration device
Master's Thesis 24

Assessment Circadian System & Retina! llluminance Exposure
5 Devices to record illuminance: requirements, possibilities & restrictions Current methods and devices to record vertical i I luminanee (paragraph 4.3: retina! illuminance [Aries 2005]) are broadly analyzed and evaluated. However the application of these devices in case of Al zheimer patients has not been investigated thoroughly. Useful information can be subtracted from looking closer to the restrictions and flaws these devices have. At the present time the most accurate device to record illuminance levels at eye level is the Daysimeter, which is discussed below. Because this light registration methad is unsuited for application with Alzheimer patients, a possibJe salution is application of the actiwatch. This device is a lso discussed below.
5.1 Current light registration methods As stated in paragraph 4. I the peak wavelength of circadian responses is shifted towards the blue end of the spectrum compared to the traditional visual speetral sensitivities for photopic, mesopic and scotopic vision. It's broadly understood the photobiological wavelength varies between 440-480 nm. Non-image-forming effects are shortwavelength sensible, therefore characterization of light exposure should include radiometric quantification of spectrum as we.ll as intensity [Brainard et al. 2004]. lt is understood that measurement should take place using two sensors: one sensor with photopic speetral sensitivity and the other with circadian speetral sensitivity. This means that one sensor is most sensitive around the photobiological wavelength (À465 nm) and the other sensor considers the entire spectrum.
NIF Effects
400 450 500 550 600 650 700
wavelength (nm)
Figure 5.1: In humans a range of non-imagejorming ( NJF) light responses (melatonin suppression, phase shifting an.d a/ertness) are shortwavelength sensitive (440-480 nm) [ Action spectrum- Brainard et al 2001; Thapan et al 2001 ].
5.1.1 The Daysimeter The Daysimeter is a head-mounted device usi ng two sensors with peak wavelengths around the photobiological peak and photopic luminous efficiency function. In addition to photopic, scotopic and mesopic lighting conditions it also registers relevant qualities as spectrum distri bution of light exposure. 'The name Daysimeter cornesfrom its ability to record circadian optica/ radialion in the sense of quantity and duration for 24h. The key functionalities include photopic and estimated circadian radiraion exposure measuremems. /wad angle and activity measurements an.d data logging [ Bierman et al. 2005]'.
Master's Thesis 25

Assessment Circadian System & Retinalllluminance Exposure
Figure 5.2: schematic and photo of the prototype Daysimeter [ Bierman et al. 2005].
Two photo sensors separately measure photopic light and speetral distribution to estimate the circadian radiation exposure. Figure 5.3 illustrates the instrument ' s photopic and blue speetral response curves (characterized using a grating monochromator) along with the photopic luminous efficiency function [Y(/c)] and a circadian speetral response function. Additional information on the Daysimeter is provided in appendix A_FI.
~ 2.5 r----;:::==========1 c: 0 0.
~ 2.0
~ '.:I
~ 1.5
~1\0 0! O\ O
: 0 '
f ' ! ~
• Daysimeler. Jholopic;
-'F,. 0 Daysimeler ~~w
.. -·- Rea et at 2002 oj '-·-·. . o\
\ 0 \
\
o'.
Figure 5.3: shown as solid and dashed lüws are the photopic luminous efficiency function (VÀ) and a speetral response of the human circadian system [Rea et a/2005].
5.1.2 The actiwatch A second device to measure illuminance is the actiwatch, a wrist-worn device that also detects and Jogs movement It can therefore be used to measure activity or the absence of it over time. It also measures and stores external light intensity therefore enabling the effect of light intensity on circadian rhythms to be studied (appendix B3). This device records illuminance with only one diode and therefore ignores the impact of the shortwavelength light. Conducted research where Alzheimer patients had to wear these actiwatches has shown that these are suitable and results are not significantly influenced by the subjects [Kushida et al. 2001 ].
'-""""
'----1 ~=:=I :::·~-~~~~ ~ ~ ~
-- =11 ~_.~·
Figure 5.4: The actiwatch, a wrist-wom device to record movement wui illuminance and output of recorded data.
Because the recorded level of illuminance at wrist level differs from the actual illuminance level received by the eye, an algorithm was developed to transfarm wrist values to eye values (Jwata 2005]. A sensor of illuminance meter was attached to a pair of glasses to measure the vertical illuminance at eye level , while at the same time a wrist monitor with a photometer was worn. With duration of one week both devices were carried from wake-up till bedtime, sampling every one minute. By camparing data retrieved from both devices a regression equation was developed, that should be able to generate illuminance level at eye level from the given illuminance level at wrist level:
Master's Thesis 26

Assessment Circadian System & Retina) Illuminanee Exposure
logEe = 0.658 + 0.6854 .Jog Ew
with Ec =
E"= r= n=
i I luminanee at eye level illuminance at wrist level coefficient of detcrmination number of samples
= 0.82 = 28055
[I x] [I x] 1-J [-)
{4}
The r-value represents the coefficient of determination, which is interpreted as the proportion of variability in the observed response variabie that is explained by the Iinear regression model. A large r-value suggests that the model has been successful in explaining the variability in the response, a small r-value indicates that an alternative model would be more reliable. As illustrated in table 5.1 the r-value of 0.82 indicates astrong model.
T bi 51 a e . : eoe ffi" 1e1ents o fd etermmatwn an d mate mg power o mterpretatwn h" f. [E . n~meerm~ s tahstics; M ontgomery
r r2 (rounded) explained varianee power of interpretation model < 0.3 < 0.1 < 10% very weak
0.3 - 0.5 0.1-0.25 I 0-25% weak 0.5 - 0.7 0.25-0.5 25-50% moderate 0.7-0.85 0.5-0.75 50-75% strong
0.85-0.95 0.75-0.9 75-90% very strong > 0.95 > 0.9 >90% exceptional strong
5.1.3 Conclusions The Daysimeter records illuminance levels using two sensors taking into account both the speetral compound of perceived light as well as the general illuminance level. However since this is a head-mounted device it is not applicable in case of patients with Alzheimer's disease. The actiwatch has proven to be suitable for research with Alzheimer patients, this device houses only one sensor recording the illuminance level and therefore disregards the speetral composition of received light. The statistica) relation between illuminance levels of wrist and eye is further investigated in order to analyze this relation on various relevant aspects.
5.2 Objectives & specifications light registration One of the objectives of tbe research is analyzing the statistica! relation between the illuminance leve] of the wrist and the eye. In order to achieve this two diodes are worn for a significant period of time by undersigned, one around the wrist and the other one strapped on to the frame of a pair of glasses. Although this relation is already established [Iwata 2005] it's desired to acquire the necessary data to further analyze the statistica] power of the algoritbm. Methods to determine vertical illuminance (paragraph 4.3: vertical illuminance [Aries 2005]) are often applied when the subject is undergoing some sort of light therapy. When undergoing light therapy subjects remain in a controlled environment, where illuminance levels are geared on to the specific medica] needs of the subject. Usually this means higher illuminance levels around -1000 I x or more. In analyzing the statistica) re lation between the two variables distinguishing different intervals concerning iJ luminanee levels is considered imperative. The retrieved data is analyzed taking in consideration that as little as -100 I x of (cornea!) light could produce half of the maximal pbase delay shift found at I 0000 I x and that 90% of the asymptotic maximum response could be achieved with 550 Jx [Zeitzer et al. 2000]. Figure 4.2 shows an acute suppression of plasma melatonin during the light exposure with an inflection point of the curve (the sensitivity of the system) at 120 Jx [Zeitzer et al. 2000]. Brainard also explained that although it was initially understood only high illuminance levels (>2500 lx) could induce photobiological responses, lower illuminances (<200 lx) can suppress melatonin and cause melatonin phase shifts [Brainard et al. 1997]. The following objectives are set for data analysis:
[1] determine the statistica[ relation between iJ luminanee at eye- and wrist level; [2] detern1ine the reliability of the statistica) relation:
(A) an area of inaccuracy is created by introducing upper- and Jower boundaries regarding the regression equation. The reliability of the model is tested for several degrees of inaccuracy;
(B) the reliabi lity of the model is tested for different intervals of illuminance intervals;
Master's Thesis 27

Assessment Circadian System & Retina IJlluminanee Exposure
Table 5.2: objectives for the analysis of data acquired by wearing sensors on wrist and eye level Number Objective
I derermine the statistica! relation between iJ luminanee ar eye- and wrist level 2A testing the reliability of the model for several degrees of inaccuracy 2B testing the reliability of the model for different illuminance intervals
5.3 Equipment: calibration & measurement scheme In order to establish the relation between illuminance at eye level Ec (paragraph 4.3: retina] illuminance [Aries 2005]) and wrist level Ew a number of measurements are executed. Two actiwatches are used, one worn around the wrist and one strapped on to the frame of the glasses of undersigned. Actiwatches and computer software (appendix A_F2) used to retrieve data from the actiwatch and analyzing measurements are manufactured by Cambridge Neurotechnology Ltd. The used photodiodes are calibrated using the Ulbricht sphere (appendix A_F3) and calibration algorithms are used in analyzing the data.
Figure 5.5: a schematic overview of the illuminance recorded by the actiwatch jixed on the frame of the glasses in comparison to the vertical illuminance and retina/ illuminance.
Figure 4.2 shows an acute suppression of plasma melatonin duringa given light exposure. It prediets an inflection point of the curve (the sensitivity of the system) at 120 lx. Because of the relevanee of this sensitivity in regard to this research, calibration is highly accurate around this particular illuminance level. The regression equations derived from the regression models (appendix A_F4) analyzed through software application SPSS 15.0 for windows, respectively actiwatch 314 and actiwatch 313:
log .Ecat = -0.602 + 1.138 ·log Ea;:l14
logEcal =- 0.535 + 1.093 ·log Ea::ll:l
with Ecal = calibrated illuminance Ea::; 14 = illuminance actiwatch number 314 Ea;m = illuminance actiwatch number 313
[I x] [I x] [I x]
{ 5}
{ 6}
With r-values of 0.999 { formula 5} and 0.997 { formula 6} respectively, these models are considered exceptionally strong ( table 5 .I).
(A~
Figure 5.6: equipment used to estab/ish re/ation between illuminance levels eye and wrist. An actiwatch strapped on the frame of a pair of glasses (A) on the left, compared to the photodiode (B) !wata used [!wata 2005]; an actiwatch worn around the lefthand wrist (C).
Master's Thesis 28

Assessment Circadian System & Retina] Illuminance Exposure
6 Results & relations between illuminance at wrist- and eye level As stated in the previous chapter there are several possibilities regarding the interpretation of the provided data. Objectives are listed below and their results are analyzed and interpreted.
[I] determine the statistica! relation between illuminance at eye- (paragraph 4.3: retina I illuminance [Aries 2005]) and wrist level;
[2] determine the reliability of the statistical relation: (A) an area of inaccuracy is created by introducing upper- and lower boundaries regarding the regression
equation. The reliability of the model is tested for several degrees of inaccuracy; (B) the reliability of the model is tested for different illuminance intervals;
6.1 Objective 1: the statistica} relation between illuminance eye and wrist The first and main objective of this research is to establish the relation between the illuminance recorded at wrist- and eyelevel, and totest its statistica! power. In order to acquire data both actiwatches are worn around the wrist and at the frame of the glasses, as mentioned in the previous chapter. They were both worn for a total period of ten days, from 9.00h in the morning til I 17.00h in the late afternoon. However to provide a nice and clear image measurements of the first day are enlarged and used for illustrations . Exact locations and weather conditions kept in the log are presented in appendix A_ T3, si mi lar logs are kept all days measurements took place.
(A)
~4 - logEe 10
w - logEw
~ (B)
3
2
0 9.00 10.00 I 1.00 12.00 13.00 14.00 15.00 16.00 17.00
Time of Day [h]
Figure 6.1: data obtained by wearing two aetiwatehes for a period of /0 days (A). Data obtained by both aetiwatehes, worn fora period of I day from 9.00 hours in the morning to 17.00 hours in the evening (B). The blue fine represents the logaritmie value of the illuminance level at the wrist and the pink fine represents the logaritmie value ofthe i/ luminanee at eye level.
Master's Thesis 29

Assessment Circadian System & Retina! Illuminance Exposure
According to the specifications of the actiwatch (appendix B3) it has a range of I - 32000 lx. Therefore all samples smaller than one lux and larger than 32000 lx are removed from the data-set. As a result of the calibration of the actiwatches all samples smaller than 20 I x arealso removed from the data-set. The lower boundary of samples provides minimum logarithmic values of respectively 0.879 and 0.887 for the wrist and eye level. The upper boundary of 32000 lx means logarithmic values of respectively 4.525 and 4.389 for the wrist and eye level. These values explain the break-off points in tigure 6.1. Because figure 6.1 does notshow any clear form or line an average trendline is added to provide a clear image of both levels (figure 6.2).
Table 6.1: upper- and lower boundaries data-set
3
2
0
Boundaries actiwatch [lx]
logEe
logEw
20 32000
- JO per. Mov. Avg. (logEe)
- JO per. Mov. Avg. (log Ew)
clouded
9.00 10.00
Boundaries log wrist level [-] 0.879 4.525
11.00 12.00 13.00
Figure 6.2: trendfinesjor both wrist level (blue) and eye level (pink).
Boundaries log eye level [-] 0.887 4.389
clear
14.00 15.00 16.00 17.00 Time of Day [h]
To explain some of the irregularities seen in figure 6.2, appendix A_ T3 is referred to. While wearing the actiwatches on wrist and glasses, a log was kept with information on several relevant conditions and activities. Around 11.30h the difference between eye- and wrist value suddenly increases, around the sametime the weather conditions changed from a cloudeel to a clear sky. Around 12.00h the position of the actiwatches, position of the subject, got a lot closer to the window. Due to improved weather conditions illuminance at eye level increased significantly, illuminance at wrist level remained approximately the same. This could be explained by the position of the wrist in comparison to the eye, the wrist being continuously close to other objects blocking off daylight. Two peaks can clearly be distinguished, indicating the time spend outside.
6.1.1 Simple linear regression model Two variables, illuminance at eye- and wrist level, are related and the mechanistic model relating these variables is unknown. Therefore it is necessary to build a model relating the variables based on the observed data obtained by wearing both actiwatches, an empirica] model. In order to visualize the relation between the two variables a scatter diagram is drawn, with the logarithmic illuminance at eye level on the y-axis and the illuminance at wrist level on the x-axis.
Master's Thesis 30

Assessment Circadian System & Retina! Illuminance Exposure
(A)
~--~----~----~--------~. ! ...,_.:~lH I
(B)
lvg c ... "...,I ·J Figure 6.3: scaller diagram of the illuminance at wrist level on the x-axis and the illuminance at eye level on the y-a.xis (A). The regression fine describes the relation between the two variables. The black fin e represems th.e regression basedon data gat he red in this research, the red fine represents the regression equation found by !wat a [!wat a 2005]. The green dashed fine represents the polynomal re/at ion between illuminance at wristand eye level. The r-value of this model is unsignificantly higher in comparison to the linear regression model. 95% Confidence intervals and means of illuminance intervals show a non linear relation between the two variables (B).
Appendix A_F5 provides relevant parameters and output generated by software application SPSS 15.0 for windows. The suggested polynomal relation between the two variables proved to be insignificantly higher in comparison to the determined linear regression line (0.65 vs. 0.64). Therefore analysis basedon the linear relation is performed. Basedon this output the relation between illuminance at wrist- and eye level is best described as:
logEe = 0.813 + 0.614 ·log Ew
with Ec = E,,. = r= n=
illuminance at eye level illuminance at wrist level coefficient of determination number of samples
= 0.64 = 19456
[I x] [I x] [ -) [-)
{7}
In comparison to I wata's formula the statistica! power of this model is substantially weaker (lwata r = 0.82). A lso there are less samples used in this analysis (lwata n = 28055), which could be part of the explanation for the difference in statistica! power. A large amount of samples used in this research were low illuminance values, however there is no insight on the exact data used by lwata. Further comparison between both regression modelsis therefore not possible.
6.2 Objective 2: determination of the statistical relation's reliability The statistica! rel at ion between illuminance at wrist- and eye level { formula 7} previously established describes a linear conneetion between two variables. lts statistica! power can be interpreled as moderate and therefore this model is considered unsuitable when high accuracy is required. Several other aspects of the statistica! model are analyzed in order to assess their reliability.
6.2.1 Upper- and lower boundaries added to the model Calculated illuminance levels by the established algorithm deviate from the true i! luminanee levels recorded by the eye sensor. Zeitzer showed that as little as -100 Jx of (cornea!) light could produce half of the maximal phase delay shift found at 10000 !x [Zeitzer et al. 2000], and Brainard also explained Jower illuminances (<200 lx; figure 4.2) can suppress melatonin and cause melatonin phase shifts [Brainard et al. 1997]. It's relevant to assess the deviation of the calculated data in comparison to true values. Adding upper- and lower boundaries to the statistica! model shows the percentage of calculated values by the model in between those boundaries. The obtained data from the actiwatch worn around the wrist is used as input for the statistica! model , the output is the illuminance at eye level.
Master's Thesis 31

Assessment Circadimt System & Retinal llluminance Exposure
~4
3
2
0
log Ec according to model
logEe
- JO per. Mov. Avg. (logEe)
- JO per. Mov. A'·g. (logEe according lo Jnodel)
clouded clear
9.00 10.00 11.00 12.00 13.00 14.00 15.00 16.00 17.00 Time of'Day [hl
Figure 6.4: trendlines for bath true eyelevel and calculated eyelevel. Data obtained by the actiwatch worn around the wrist (pink) and data obtained by using this data as input for the statistica! model derived through regression mwlysis (green).
Figure 6.4 shows trendlines for both true illuminance at eye level, obtained by wearing the actiwatch strapped on to the frame of a pair of glasses, as well as the calculated illuminance at eye level. Clearly the algorithm evens out the extreme differences between wrist- and eye level. In clouded conditions both values differ slightly more in comparison with data obtained from the wrist compared to eye level (figure 6.2). In clear sky conditions the great differences seen in figure 6.2 are decreased. This indicates the algorithm underestimates high illuminance levels, which is obvious due to the large amount of relatively low i I luminanee values in the data-set.
It's relevant to explore inaccuracy boundaries to find out the percentage of calculated values in between these boundaries, which are set on ± 10%, ±15%, ±20% and ±30%. Figure 6.5 shows calculated va lues compared to true values decreased and increased with I 0%, figure 6.6 shows the same calculated values compared to true values decreased and increased with 30%.
3
2
0
log Ee according lo model logEe+ 10% logEe -10%
- 25 per. Mov. Avg. (logEe according to model) -25 per. Mov. Avg. (logEe+ JO%) -25 per. Mov. Avg. (logEe- 10%)
9.00 10.00 11.00 12.00 13.00 14.00 15.00 16.00 17.00 Time of Day [h]
Figure 6.5: trendlines for calculated eyelevel and upper- and lower boundaries of 10%. Data obtained through regression analysis (green) and upper- (black) and lower (grey) boundaries of 10c1c regarding the true illuminance at eve level measured by the actiwatch strapped to the frame ofthe glasses.
Master's Thesis 32

Assessment Circadian System & Retinalllluminance Exposure
4
3
2
0 9.00
Jog Ee according to model logEe +30% logEe -30%
- 25 per. Mov. Avg. (logEe according to model) -25 per. Mov. Avg. (logEe+ 30%) - 25 per. Mov. A''.!(· (l_?g Ee- 30%)
10.00 11 .00 12.00 13.00 14.00 15.00 1600 17.00 Îime of Day [h)
Figure 6.6: trendlines for calculated eyelevel and upper- and lower boundaries of 30%. Data obtained through regren·ion analysis (green) and upper- (black) and lower (grey) boundaries of 30% regarding the true illuminance at eye level measured by the actiwatch strapped to theframe ofthe glasses.
Figure 6.5 shows a great part of the data outside I 0% inaccuracy boundaries. In practice this means that low illuminance levels (- 200 I x) recorded could range from 180 - 220 I x, but higher illuminance levels (- I 000 I x) can range from 900 - 1000 I x. But even then, Jess then 50% the samples are considered reliable (table 6.2) . Figure 6.6 shows better results for the inaccuracy boundaries of 30%, resulting in low illuminance ranging from 140-260 lx and high illuminance ranging from 700 - 1300 lx. Depending on the applied light therapy during measurements , application of the actiwatch could be considered reliable. The number of calculated values in between the different inaccuracy boundaries are determined and results are given in table 6.2:
T bi 6 2 a e . : applle r d upper- an dI ower b d . oun anes an d correspon mg percentages o correct va ues d' f Boundaries [%] Total values [-] Va lues in between boundaries [ -] Correct percentage [%]
± 10 19546 8812 45 ± 15 19546 11459 59 ±20 19546 13320 68 ± 30 19546 16160 83
6.2.2 Model divided into different illuminance intervals 'lmprovement of the sleep-wake rhythm of healthy and demented elderly people has been demonstraled by application of a variety of potent modulators of the circadian timing system, like bright light' [Van Someren et al. 1997]. The impravement of sleep following these treatments is without adverse effects and even results in an impravement of mood, performance, day-time energy and quality of life [Van Someren et al. 2000]. In case of these treatments the illuminance levels in rooms subjects remain are controlled and easily manipulated. Measurements regarding circadian rhythms are aften carried out during light therapy, when levels of illuminance remain within certain boundaries. Lower illuminances (<200 lx ; figure 4.2) can suppress melatonin and cause melatonin phase shifts as well [Brainard et al. 1997]. Therefore it's interesting to explore the regression model on its reliability on certain illuminance intervals. The percentage of calculated values in accordance with true values of illurninance at eye level is determined within certain intervals.
Figure 6.7 clearly shows the algorithm underestimates the true values (recorded by wearing the actiwatch on the frame of the glasses). On the x-axis data is divided in logarithmical categories corresponding with equally sized illuminance intervals, on the y-axis the number of samples in these intervals is presented. In the first category (0-2.30 I) the regression model generates more values compared to realüy. Al I the other categories (categories of higher illuminance levels) are numerically underestimated by the regression model.
Master's Thesis 33

Assessment Circadian System & Retinal Illuminance Exposure
] Q.
E ~ ..... 0 .... "" "E
20000
15000
~ 10000
5000
0
• lrue valurs Ee
• calculalcd va lues Ee
0- 2.301 2.301 - 2.602 2.602- 2.778 ' 2.778- 2.903 2.903- 3
15579
16870
1547
1524
562
405
437
340
379
190
• I me values Ee
• calculalcd valucs Ee
log Ulwninance [-]
3 - 3.079 3.079 . 3.146
267
86
152
49
Figure 6.7: Data devided into different smaller intervals of illuminance levels spread out 011 the x-axis. For each area the amou111 of calculated va/u es (red) compatible with true va/u es ( blue) is determined.
The categories 2.301-2.602; 2.602-2.778; 2.778-2.903 are underestimated by an average of 70%. The underestimation of the algorithm has little effect on low illuminance levels, indicating this algorithm is applicable for low illuminance levels. Figure 6.8 shows illuminance intervals based on figure 4.2 showing a saturation of the phaseshift response predicted to occur with 550 lx and saturation of the melatonin suppression response predicted to occur with 200 lx. These relevant markers in illuminance levels are input for analysis of these intervals.
4000
-"' <J
0.. c 3000 ; "' ..... 0 .... " .a
2000 E " c
1000
0
• lme values Ee
• calculalrd values Ee
2- 2.176 2.176. 2.301 2.699. 2.740 2.740- 2.778
2724
3246
1399
888
120
104
98
118
• lrue va lues Ee
• calculaled va lues Ee
log Illuminance [ -]
Figure 6.8: Data devided relevant intervals of il/uminance levels spread out 011 the x-axis. For each area the amount of calculated values (red) compatible with true vaft,tes (blue) is determined. These intervals are derivedfromfigure 4.2: The logistic moelels of me/atonin phaseshift response and me/atoninsuppression response predief an i11jlectio11 point of the curve (the se11sitivity of the system) at 120 /x. Saturation of the phaseshift response is predieled to occur with 550 /x and saturation of the melatoninsuvoression restJon se is vredicted to occur with 200 /x.
Focusing on relevant markers according to figure 4.2 (saturation of phaseshift response predicted with 550 lx and saturation of melatonin suppression response predicted with 200 lx), figure 6.8 and table 6.3 show acceptable results. 95% Confidence intervals match with their intended intervals indicating this algorithm is applicable in these relevant regions. However in case of light therapy high illuminance levels are generated in rooms' subjects stay in. The results presented in figure 6.7 clearly show the insufficiency of the calculated algorithm.
Master's Thesis 34

Assessment Circadian System & Retina! Illuminance Exposure
T bi 6 3 d"ff a e .. I erent mterva s o 1 f"ll ummance eve s an d accompan)'lng o con 1 ence mten'a s 95~ fd Intervals [lx] log Intervals [-] log Mean [-] 95% Confidence Interval [I x] 95% log Confidence Interval[-]
0-200 0-2.301 1.813 27- 160 1.437- 2.204 200 - 400 2.30 I - 2.602 2.318 172-256 2.235- 2.409 400-600 2.602- 2.778 2.462 263-329 2.420-2.517 600-800 2.778 - 2.903 2.565 336-393 2.526- 2.594 800- 1000 2.903-3 2.624 400-446 2.602- 2.649 1000- 1200 3- 3.079 2.682 454-504 2.657- 2.702 1200- 1400 3.079- 3.146 2.726 512-555 2.709- 2.744 100- 150 2-2.176 2.082 104- 148 2.017-2 .172 150-200 2.176-2.301 2.234 154- 195 2.188- 2.290 500-550 2.699- 2.740 2.720 504-545 2.702-2.737 550-600 2.740- 2.778 2.765 555-600 2.744- 2.778
6.3 Conclusions on the reliability of the statistica! relation between wrist and eye Considering all data obtained by wearing both actiwatches, one around the wrist and the other one strapped on to the frame of the glasses, the following relation between illuminance at eye- (paragraph 4.3: retina! illuminance [Aries 2005]) and wrist level is determined:
logEe= 0.813 + 0.614 .Jog Ew
with Eo = Ew = r= n=
illuminance at eye level illuminance at wrist level coefficient of determination number of samples
=0.64 = 19456
[I x] [I x] [-] [-]
{ 7}
The established regressionmodel is judged on its reliability and compared to the model lwata [Iwata 2005] established { formula 4}. There are significant differences, indicating any doubts regarding this model must not be taken lightly. Because the exact conditions and the used equipment during research by Iwata are unknown, explanations for deviations found can not be clearly given. lt's obvious however Iwata used a different photodiode to record illuminance at eye leve.! (figure 5.6), a possible explanation for found differences. The statistica! power of the established relation during this research must be interprered as moderate. This indicates an altemative couJd be more accurate and that different lighting conditions require different algorithms to determine vertical illuminance at eye level.
Results regarding the complete dataset show, taken into account inaccuracy margins of ±30%, the percentage of calculated values in between these margins is 83%. This margin of inaccuracy is not acceptable in field studies where subjects are undergoing light therapy. However when subjects are monitored during their normal daily routines, this algorithm provides results close to reality. An inaccuracy interval of ±10% is accepted in research concerning subjects undergoing light therapy. Only 45% of the algorithm's calculated data is considered reliable taken into account these demands .
Dividing obtained data into different categories clearly shows the derived statistica! model underestimates the true illuminance level in generaL Most categories show significant differences comparing true values with calculated values. The interval containing samples between 0 and 200 lux shows acceptable correlation between true and generated values, confirming the algorithm's sufficiency in this area. The underestimation is clearly shown in increasing intervals, an average of 70% of generated values is in accordance with true values. Relevant markers of melatonin suppression response and melatonin phaseshift response (200 I x; 550 I x) are separately analyzed showing the algorithm' s ability to generate highly reliable results concerning these partienlar levels.
Analysis of retrieved data shows separate algorithms for different illuminance intervals should provide more reliable results compared to the established algorithm concerning all illuminance levels. Subjects remaining in conditioned rooms are exposed to controlled illuminance levels, a situation which allows an algorithm for that particular interval to be used in analysis.
Master' s Thesis 35

Assessment Circadian System & Retina! Illuminance Exposure
7 New light recording equipn1ent The relation between illuminance levels recorded at eye- and wrist level is questionable, mainly in case of higher levels of illuminance (>1000 lx). Recording illuminance levels should ideally take place as close to the eye as possible. Using devices as the Daisymeter or other head-mounted equipment is not possible in case of patients with Alzheimer's disease because of their mental state. New equipment developed for this purpose has to meet a couple demands which are laid down below:
• The normal day-pattern of the subject must not be influenced by the equipment used to record illuminance levels. The subject therefore has to be u na ware of the recording device;
• The device should be very small so that it can be placed on the subjects clothes. In order to achieve this, no wires or other cables should be included in the development of the device;
• The recording device has to be equipped with two sensors: one sensor with photopic speetral sensitivity and the other with circadian speetral sensitivity.
The ideal position of the sensors would be as close to theeyes of the subject as possible. However, seen in the case of patients with Alzheimer's disease, placing a recording unit on the frame of the glasses or using a head mmmted device is not possible. Therefore a position that approaches the eye level the most would be ideal for application in this target group, provided that it doesn 't alternate or influence the daily rhythm of the subjects.
7.1 Sensor placing on patients with Alzheimer's disease In order to develop a new registration device that is placed on dothes or body of a subject, specialists were consulted about the subject. Considering the guidelines described above, a questionnaire regarding possibilities of placing a unit on the dothes or body of the Alzheimer patient was formulated. The questionnaire was send out to several concerned authorities to make an inventory of the possibilities for the new device. Ir. Joost van Hoof (Projectleader Lectoraat Vraaggestuurde Zorg- Utrecht Hogeschool), Pim van Bekkum (experience expert nursinghome Elzenhorst Horst) and drs. Els M0st (Netherlands Institute for Neuroscience - VU Medica] Centre) responded and completed the questionnaire. Both questions and answers are admitted in appendix A_T4, conclusions are summed up in table 7.1:
Table 7.1: conclusions drawn from questionnaire
Questions Judgment applicability actiwatch patients with Alzheimer's ++ applicability necklace containing photodiode applicability broche containing photodiode ++ applicability other object containing photodiode other suggestions
Relying on the expertise of these specialists and interpretation of their answers, a recording device placed on the chest seems to be the best option. Measuring vertical illuminance and positioned close to the eyes of the subject a possible relation between eye and chest seems more plausible than the relation between wrist and eye. Another advantage over the actiwatch is placement on the clothes with a minimal chance of covering the sensor, which is a regularity with a device positioned on the wrist.
Master's Thesis 36

Assessment Circadian System & Retinalllluminance Exposure
7.2 The statistica I relation between illuminance eye and eh est The mathematica! relation between illuminance at wrist- and eye level is considered of moderate statistica! power, however new equipment placed on the chest of the subject is only useful if the relation between chest and eye proves to be more reliable. This relation is tested and analyzed pursuing the same objectives earlier established:
[I] establishing the statistica! relation between illuminance at eye- (paragraph 4.3: retina! illuminance [Aries 2005]) and chest level;
[2] determine the reliability of the statistica) relation:
(A) an area of inaccuracy is created by introducing upper- and lower bounda.·ies regarding the regression equation. The reliability of the model is tested for several degrees of inaccuracy;
(B) the reliability of the model is tested for different illuminance intervals;
The first and main objective of this investigation is to establish the statistica! relation between the illuminance recorded at chest- and eyelevel, and totest its statistica! power. In order to acquire the data both actiwatches are worn, one on the chest and the other strapped at the frame of the glasses. They were both worn fora total period of lO days, from 9.00h in the morning till 17.00h in the late afternoon. However to provide a nice and clear image measurements of the first day are enlarged and used for illustrations. Exact Jocations and weather conditions kept in the log are presenled 111
appendix A_TS, similar Iogs are kept all days measurements took place.
(A)
- logEe
-logEe
0 9.00 10.00 11.00 12.00 13.00 14.00 15.00 16.00 17 .00
Time of Day [h)
Figure 7.1: A shows all data obtained by wearing two actiwatches fora period of JO days. B shows data obtained by both actiwatches, worn fora period of 1 day from 9.00 hours in the morning to 17.00 hours in the evening. The blue line represents the logaritmie value of the il/uminanee level at the wrist and the pink line represents the logaritmie value of the il/uminanee at eve level. Table 6.1 is referred to.
To explain some of the irregularities seen in figure 7.2 appendix A_TS is referred to. While wearing the actiwatches on chest and glasses, a similar log as earlier discussed was kept which holds information on several relevant conditions and activities. In general the illuminance level recorded at chest level is higher than the illumjnance at eye level during the whoJe day. Day I shows no strange irregularities concerning the relation between chest and eye. The only peak seen around 12.30h is explained in the log, undersigned moved outside to walk the dog and therefore recording high illuminance levels.
Master's Thesis 37

Assessment Circadian System & Retina! Illuminance Exposure
~4
3
2
1
logEe logEe
- JO per. Mov. A'·g. (log Ec)
- JO per. Mov. A'·g. (logEe)
+----------------- Semi-clouded ------------------+
0 9.00 10.00 11.00 12.00 13.00 14.00 15 .00 16.00 17.00
Time or Day [h]
Figure 7.2: trendlines for both chestlevel (blue) mul eye level (pink).
In order to visualize the relation between the two variables a scatter diagram is drawn, with the logarithmic illuminance at eye level on the y-axis and the illuminance at chest level on the x-axis .
Appendix A_F6 provides the output generated by statistica! analysis through SPSS 15.0 for windows. Based on this output the relation between illuminance at wrist- and eye level is best described as:
logEe = 0.821 + 0.511-log Ec
with Ec = Ec = r= n=
illuminance at eye level illuminance at chest level coefficient of determination number of samples
:;:: • ~
;_,
.2 ' .J
(B)
. ~----~-------~ êi i ' .
loo•ld.oll-)
= 0.76 = 20523
[!x] [I x] [ -] [ -]
Figure 7.3: scatter diagram of the illuminance at chest level on the x-axis and the il!uminance al eye level on the yaxis (A). The regression fin e describes the relation between the two variables. The green dashed line represents the polynomal rela/ion between illuminance at chest- and eye level. The r-val1.te of this model is unsignificantly higher in comparison to the linear regression model. 95% Confidence intervals and mecms of illuminance intervals show a non linear rel at ion between the two variables ( B).
I 8}
The suggested polynomal relation between the two variables proved to be insignificantly higher in comparison to the linear regression line determined (0. 77 vs. 0. 76). Therefore a na lysis based on the linear relation is perfonned.
Master's Thesis 38

Assessment Circadian System & Retina! Illuminance Exposure
In comparison with the algorithm descrihing the relation between wrist- and eye level this one has a larger r-value that indicates a stronger model (table 5.1 ). Therefore i t's relevant to fUI1her investigate this relation. Other aspects of this relation arealso researched in the following paragraphs.
7.3 Determination of the statistica) relation's reliability Stated earlierresearch on illuminance levels in nursing homes and speetral composition of light received by subjects at eye level does not require data to be I 00% accurate. Several other aspectsof the statistica] model are analyzed in order to assess their reliability and to compare it with the reliability of the relation between wrist- and eye illuminance.
7.3.1 Upper- and lower boundaries added to the model As stated in paragraph 6.2.1 it's relevant to assess the deviation of the calculated data in comparison to true values. The obtained data from the actiwatch worn on the chest is input for the statistica] model, the output is the illuminance at eye level.
3
2
0
logEe according to model
logEe
- 10 per. Mov. Avg. (logEe)
- JO per. Mov. Avg. (logEe according to model)
9.00 10.00 I 1.00 12.00 13.00 14.00 15.00 16.00 17.00 Time or Day [h]
Figure 7.4: trend/i nes for borh true eyeleve/ and atleuiared eyelevel. Data obrained by rhe actiwarch worn on the chesr (pink) and data obrained by using rhis data as input for the statistica/ model derived rhrough regression analysis (green).
Figure 7.4 shows trendlines for both true illuminance at eye level as well as the calculated illuminance at eye level. Data obtained by wearing the actiwatch on the chest, is used as input for the statistica] model, generating computed values for illuminance at eye level. Ideally both lines should show exactly the same course, indicating the regression model in 100% accurate. The calculated r-value of 0 .76 already proved this is not the case. The found algorithm to determine illuminance at eye level from illuminance at chest level also evens out extreme differences between chestand eye level. This indicates tbe algorithm is successful in generating values close to reality in comparison to the wrist algorithm { formula 7}. It' s relevant to explore inaccuracy boundaries to find out the percentage of calculated va lues inside these boundaries, which are set on± I 0%, ± 15%, ±20% and ±30%. Figure 7.5 shows calculated values compared to true values decreased and increased with I 0%, figure 7.6 shows the sa me calculated va lues compared to true va lues decreased and increased with 30%.
Master's Thesis 39
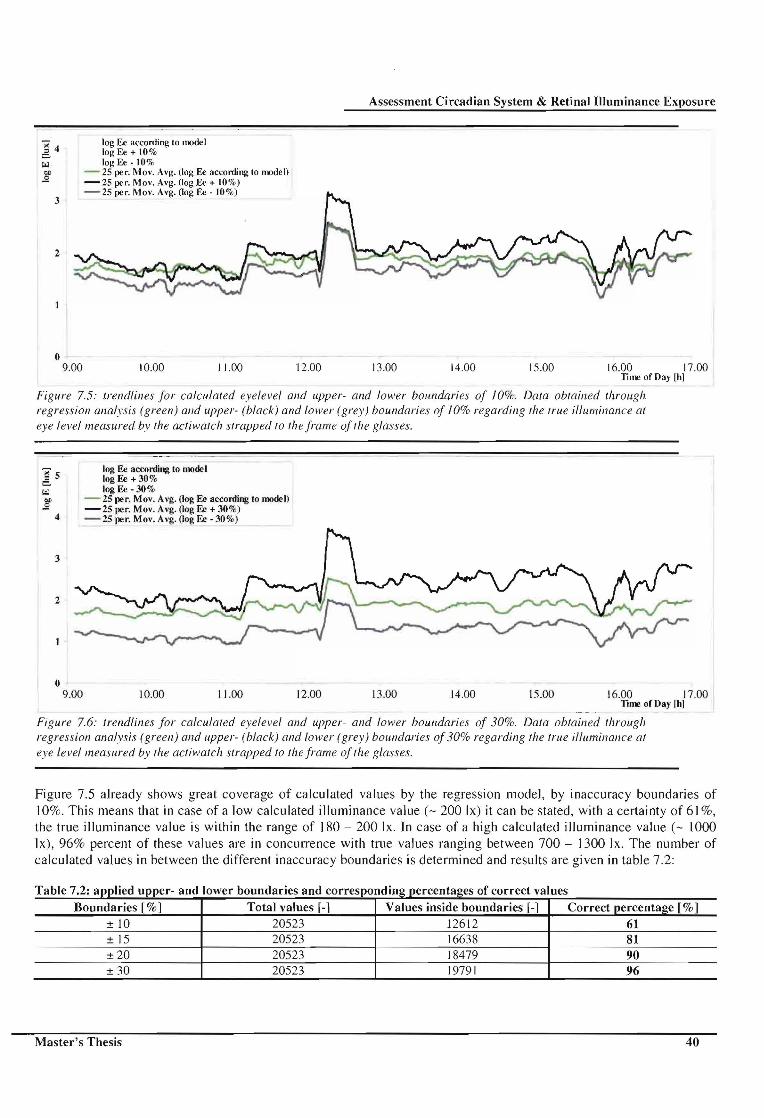
Assessment Circadian System & Retinalllluminance Exposure
3
2
0
log Ee acconling to mode I logEe+ 10% logEe- 10%
- 25 per. Mov. Avg. (logEe acconling to model) -25 per. Mov. Avg. (logEe+ 10%) - 25 per. Mov. Avg. (logEe- 10%)
9.00 10.00 I J.OO 12.00 13.00 14.00 15.00 16.00 17.00 Time of Day [hl
Figure 7.5: trendlines for calculated eyelevel and upper- and lower boundaries of /0%. Data obtained through regression analysis (green) and upper- (black) and lower (grey) boundaries of JO% regarding the true illuminance at eye level measured by rhe actiwatch strapped ro theframe ofthe glasses.
4
3
2
0
log Ee according to model logEe+ 30% logEe -30%
- 25 per. Mov. Avg. (logEe acconling to model) -25 per. Mov. Avg. (logEe+ 30%) - 25 per. Mov. Avg. (logEe- 30%)
9.00 10.00 11.00 12.00 13.00 14.00 15.00 16.00 17.00 Time ofDay [h]
Figure 7.6: trendlines for calculated eyelevel and upper- and lower boundaries of 30%. Data obtained through regression analysis (green) and up per- ( black) and lower ( grey) boundaries of 30% regarding the true illumincmce at eye level measured by the actiwatch strapped 10 the frame of the glasses.
Figure 7.5 already shows great coverage of calculated values by the regression model, by inaccuracy boundaries of I 0%. Th is means that in case of a low calculated illuminance value (- 200 I x) it can be stated, with a certainty of 61 %, the true illuminance value is within the range of 180- 200 I x. In case of a high calculated illuminance value (- I 000 lx), 96% percent of these values are in concurrence with true values ranging between 700- 1300 Jx. The number of calculated values in between the different inaccuracy boundaries is determined and results are given in table 7.2:
T bi 7 2 r d a e . : appne upper- an dI ower b d . oun anes an d d' t f correspon mg pereen ages o correct va ues Boundaries [%] Total values [-] Values inside boundaries [-] Correct percentage [%]
±10 20523 12612 61 ±15 20523 16638 81 ±20 20523 18479 90 ± 30 20523 19791 96
Master's Thesis 40

Assessment Circadian System & Retinal Illuminance Exposure
7.3.2 Model divided into different intervals Measurements regarding circadian rhythms are often carried out during light therapy (>I 000 I x), where levels of illuminance remaio within eertaio boundaries. Lower illuminances (<200 lx; figure 4.2) can suppress melatonin and cause melatonin phase shifts [Brainard et al. 1997] as wel I. Therefore it's interesting to explore the regressionmodel on its reliability within eertaio intervals of illuminance level, checking the percentage of calculated values in accordance with true values of illuminance at eye level.
12000
~
"' "' ë. E 9000 ~ '-0 ,_ "' ..Q
E 6000 " c:
3000
0 0. 2.301 1 2.30 I - 2.602
• lrue values Ee 10996 6R06
• calculate.d values Ee ' 12140 6291
.. 2.602- 2.778
1313
982
2.778- 2.903
558
42R
2.903-3
217
186
• I me values Et•
• calculated values Ee
log IIIWTinance [-]
3-3.079
131
110 1
3.079 - 3.146
107
91
Figure 7. 7: Data devided info different bigger intervals of illuminance levels spread out on the x-axis. For each area the amount o[calculated values (red) compatible with true values (blue) is determined.
6000 ~
"' ..!:i 0.. E " "' '- 4000 0 ,_ " ..Q
E = c::
2000
0
• lrue values Ee
• cakulaled values Ee
--2-2.176 2.176-2.301 2.699-2.740 2.740-2.778
5365
5425
2786
2552
1201
1089
521
502
• lrue values Ee
• calculaled ,·alues Ee
log IUWTlinaoce l-1
Figure 7.8: Data devided relevant intervals of illuminance levels spread out on the x-axis. For each area the amount of calculated values (red) compatible with true values (blue) is determined. These intervals are derived fromfigure 4.2: The logistic models of melatonin plwseshift response and melatoninsuppression response prediefan inflection point ofthe curve (the sensitivity ofthe system) at 120 lx. Saturation ofthe phaseshift response is predieled to occur with 550 lx and saturation of the melatoninsuppression response is predicted to occur with 200 I x.
Master's Thesis 41

Assessment Circadian System & Retina! Illuminance Exposure
Figures 7.7 and 7.8 clearly show the algorithm underestimating the real values at eye level. The same phenomenon seen in the eye-wrist relation occurs however less pronounced. All categories are slightly underestimated except the 0-2.301 lx category, but only by a fraction. Especially compared to the underestimation that was found with the algorithm for the eye-wrist relation this algorithm shows better results. Also the 95 % confidence intervals predicting the range of values linked to certain illuminance intervals proved to be better (table 7.3). Focusing on relevant markers regarding melatonin pilaseshift and suppression, figure 7.8 and table 7.3 show acceptable results. 95% Confidence interval s match at a high level with their intended intervals indicating this algorithm is applicable in these relevant regions. Different intervals of illuminance levels and their accompanying 95% confidence intervals are given in table 7.3:
Table 7.3: different intervals of illuminance levels and accompanying 95% confidence intervals Intervals [lx) log Intervals [-) log Mean [-) 95% Confidence Interval [lx) 95 % log Confidence Interval[-)
0-200 0-2.301 2.009 27- 183 I .431 - 2.262 200-400 2.30 I - 2.602 2.389 195-301 2.290- 2.478 400-600 2.602- 2.778 2.569 315-483 2.498- 2.684 600-800 2.778 - 2.903 2.739 506-654 2.704-2.8 15 800- 1000 2.903- 3 2.871 678-826 2.831-2.917 1000- 1200 3- 3.079 2.982 878-989 2.943- 3.037 1200- 1400 3.079-3.146 3.090 1061-1195 3.053 - 3.122 100- 150 2-2.176 2.091 102-149 2.008 - 2.173 150-200 2.176- 2.301 2.240 152 - 197 2.182- 2.294 500-550 2.699- 2.740 2.721 503-548 2.702- 2.738 550-600 2.740- 2.778 2.768 552-600 2.742- 2.778
7.4 Conclusions on the reliability of the statistica} relation between eh est and eye Considering all data obtained by wearing both actiwatches, one on the chest and the other one strapped on to the frame of the glasses, the following statistica] relation between iJ luminanee at eye- and chest level is determined:
logEe= 0.821 + 0.511-log Ec
with E, = E, = r= n=
illuminance at eye level illuminance at chest level coefficient of determination number of samples
= 0.76 = 20523
[lx) [I x) [-) [-)
{ 8}
Interpreting the generated r-value of 0.76 in termsof statistica! power, the model is considered strong. Comparing this algorithm to the algorithm found in chapter 6 indicates a new device, possibly formed as a broche, is statistically superior to the actiwatch.
Results show when taken into account inaccuracy margins of± 30%, the percentage of calculated values in between these margins is 96%. This is a lot higher in comparison to the wrist-eye relation, emphasizing the superiority over the eye-wrist relation . With inaccuracy margins of ±I 0% the percentage of coneet values is 61 %, a percentage not acceptable in case of subjects undergoing light therapy. These results also indicate different algorithms for different illuminance intervals are preferred over one algorithm concerning all illuminance levels.
Di viding obtained data into different categories clearly shows the derived statistica) model underestimates the true iJlominanee level. All categories show similar differences comparing true values with calculated values, averaging at 85%. Although this percentage is acceptable is some cases, the algorithms reliability is improved by generating different algorithms for different iJlominanee intervals. Relevant markers of melatonin suppression response and melatonin phaseshift response (200 Jx ; 550 lx) are separately analyzed showing the algorithm's ability to generate highly reliable results concerning these patticular levels.
Master's Thesis 42

Assessment Circadian System & Retina] Illuminance Exposure
8 Con1parison wrist-eye relation & chest-eye relation Because the reliability and applicability of the algorithm predicting illuminance values at eye level from data obtained by wearing an actiwatch around the wrist were insufficient, an alternative was tested and analyzed. This alternative is a unit placed on the chest of the subject. The statistica] power of a relation between eye and chest proved greater compared to the statistica] power between eye and wrist. 95% Confidence intervals for illuminance levels up to lOOO lx are shown in ftgure 8.1. Set aside the medica] expectations and reliability demands, both relations are compared on the points they are statistically analyzed on. Results are shown in figure 8.2 and numerically given in table 8.1.
" 0 u
" ~ <=
j
1000
900 /
~00
700
600
500
400
300
200
- Truc illuminancc level 100 - 95% Confidcnr..c interval cyc-chcst rclarion
- 95% Confidcncc interval c-yl'-wrist rclation
0~~------------------------------Figure 8.1: Numerical results presenled in table 8.1 visualized. 95% Confidence intervals of bath the eye-wrist and the eye-chest relation as a function of increasing illuminance levels.
%
Figure 8.2: Numerical results presenled in table 8.2 visualized. Calculated percentages and 95% confidence intervals. Rendis of calculated percentages shown above indicate the re/at ion between illuminance level at eye- and chest level is superior to the relation between eye- mul wrist level. A green block indicrlles a beller score on that particu/ar point of analysis between bath relations. A red block indicates inferiority. 95% Confidence imervals also show better restdis for the eye-chest re lation compared to the eye-wrist relation.
Master's Thesis 43

Assessment Circadian System & Retinalllluminance Exposure
T bi 81 a e o : companson b t e ween th 0 t oth ' e wns -eye a.gon m s- an d th h t oth ' t f f I e c es -eye atgon m s s a ts tea power
Analysis Wrist- eye Chest- eye I. Number of samples in analysis 19546 20523 2. Statistica] power of regressionmodel 0,64 0,76 3. Percentage of samples within inaccuracy boundaries JO% 45% 61%
15% 59Cfo 81% 20% 68% 90% 30% 83% 96%
4. Correct percentage in different illuminance intervals 0-200 108% 110% 200-400 99% 92% 400-600 72% 75% 600-800 78% 77%
800-1000 50% 86% 1000-1200 32% 84% 1200-1400 32% 85%
100-150 119% 101% 150-200 63% 92% 500-550 87% 91% 550-600 120% 96%
5. 95% confidence intervals different illuminance intervals 0-200 27- 160 27 -183 200-400 172-256 195-301 400-600 263-329 315-483 600-800 336-393 506-654
800-1000 400-446 678-826 1000-1200 454-504 878-989 1200-1400 512-555 1061-1195
100-150 104- 148 102- 149 150-200 154-195 152-197 500-550 504-545 503-548 550-600 555-600 552-600
The results clearly show the alternative of a measuring-unit worn on the chest, is a far better one than the actiwatch worn around the wrist. On practically all analyzed topics the algorithm for the chest-eye relation scores better in comparison to the algorithm describing the relation between wrist and eye.
Master's Thesis 44

Assessment Circadian System & Retina! Illuminance Exposure
8.1 Discussion Reasonable explanations for the failure of establishing a strong model describing the statistica! relation between illuminance at wrist- and eye level compared to the eye-chest relation are:
• Illuminance at eye level is practically always a vertical illuminance, wrist positions can just as eas ily cause horizontal illuminance measurements. The chest virtually always remains in a vertical pos ition comparable to the eye;
• The wrist is a completely different body part than the head, in the sense of movement and use. There is a significant chance that, not only vertically and horizontally speaking, also the direction in which the sensor is pointing differs a great deal of time. Regarding sense of movement and use the chest often sbows similarities to the human head. There is a significant chance tbat the direction in which the sensor is pointing does not differ from the eye most of the time;
• The possibility of covering the sensorwornon the wrist, by clothing or other obstacles, is always present. Placing a sensor on the chest slightly decreases this possibility, however it is still present;
• Inaccuracy of used equipment (both relations);
• Inaccuracy of calibration of equipment (both relations).
Certain relevant aspects regarding the measurement of vertical illuminance at eye level were left out of this research. However they are critically important for the correct determination of retina) illuminance and therefore should be further investigated:
• Both determined algorithms are based on a data-set concerning all recorded samples causing the algorithms to underestimate the vertical illuminance at eye level. Analysis shows that data divided into illuminance intervals, and determination of algorithms concurring with these intervals, should provide more reliable statistica) relations. Due to insufficient sampling of high illuminance levels (>I 000 I x) this assumption is not confirmed in this research but should be further investigated;
• Light only reaches the retina of subjects providing the eyes of the subject are open. Subjects sleepingor nodding off are exposed to less or no lighting at all. Both the actiwatch as wellas the broche are unable to sense whether tbe eyes of the subject are open or closed. Some type of observation by the nursing staffis essential in order to provide reliable results;
• The applicability of broche sensors in case of Alzheimer patients is highly recommended. Engineering and development of a unit small enough to be manufactured into a esthetica! acceptable broche, and big enough to house all necessary photodiodes, filters and accessories is imperative in order to successfully apply the unit.
Master's Thesis 45

Assessment Circadian System & Retinal Illuminance Exposure
recording exposure retinal illuminance through simulation
Master's Thesis 46

Assessment Circadian System & Retinal Illuminance Exposure
9 Assessment retina) illuminance & speetral distribution using simulation A light recording device placed on the chest of the subject is considered to produce more reliable results than the wellknown actiwatch, which proved applicable in research regarding patients with Alzheimer's disease [Kushida et al. 200 I] . Ho wever the i deal method should not intertere at all in the dai ly routine of the subjects. Therefore this research also focu ses on a method of assessing vertical illuminance (paragraph 4.3: retina] illuminance [Aries 2005]) and speetral distri bution through simulation, possibly in combination with determination of the whereabouts of the subject. The simulation program used is Radiance. To get information about the speetral distribution of the light the Lightwareher is used. The Lightwareher is a measurement device which measures speetral irradiance for 5 different wavelengths, movementand temperature. It is recently developed by Sowoon Technologies (Switzerland) as part of the 6th framework Program EUCLOCK. The device was provided by the University of Groningen, the department of chronobiology and is still in its testing phase. The Lightwareher was only available in a later stadium of the research and only for a sho11 period of time. Due to these restrictions and late availability, analysis of data retrieved by the Lightwareher is limited in some occasions. Data acquired by the simulation, measurements and the Lightwareher linked to the position of the subject in the room could provide useful information regarding the irradiance received on the subjeet' s eye . All software and measurement equipment used are briefly introduced in the following paragraph .
9.1 Data acquisition through Radiance and the Lightwatcher Radiance is a non-commerciallight si mulation tooi intended to aid lighting designers and architects by simulating the light levels, light distri bution and appearance of a space prior to construction. The package includes programs for rnadeling and translating scene geometry, luminary data and material properties, all of which are needed as input to the simulation . The lighting simul ation itself uses ray tracing techniques to compute radiance values (the quantity of light passing through a specific point in a specific direction) , which can be arranged to form a photographic quality image. The resulting image may be analyzed , displayed and manipulated within the package and converted toother popular image file formats for exporttoother packages. In regard to this investigation relevant qualities of Radiance are its ability to simulate considering different weather conditions and its validated accuracy [Larson et al. J 997] . Radiance is able to provide infonnation about the speetral distribution , materials are defined including colarvalues assigned to the red, green and blue component of the materiaL Output of Radiance can be transformed to the speetral distribution, using those definitions of materials. To accurately define these colarvalues measurements regarding these values of materials must be petformed , increasing the complexity of such a simulation indicating supplementary tools are necessary. Appendix B4 elaborates on the possibilities and restrictions Radiance holds.
Figure 9.1: the Lightwatcher, sensor unit with housing.
Master's Thesis 47

Assessment Circadian System & Retina! Illuminance Exposure
Table 9.1: variables recorded by the Lightwatcher:
Nr Variabie Unit Photosensitive area [mm2] Photo sensitivity at peak
J IR Light Irr. 860 nm mW/mL.nm 0.15 Smax = 0.5 A.w· at 875 nm 2 Red Light Irr. 620 nm mW/mL.nm 1.0 Smax = 0.16 A.W- at 620 nm 1 Green Light Irr. 540 nm mW/m-.nm 1.0 Smax = 0.21 A.W- 1 at 540 nm 4 Blue Light Irr. 465 nm mW/m".nm 1.0 Smax=0.18A.W- 1 at460nm 5 UV Light Irr. 150 nm mW/m".nm 0.076 Smax = 0.16 A.W- at 350 nm
The Lightwatcher (figure 9.1) is a portable data acquisition system that measures and records environmental variables that are important in the study of human alertness, performance integrity and circadian rhythm. The unit used (still in a testing phase) is the prototype ES_v3.3 (18 x 50mm), using five photodiodes: one IR photodiode (Agilent HDSL-5400), one color sensor (Hamamatsu S9032-2) that includes three photodiodes with filters, and one UV photodiode (Roithner GUY A-S 1 OGD). A PTFE window with a thickness of l mm covers the photo diodes. On request of the University of Groningen, the department of chronobiology, additional technica) specifications are excluded from this rapport.
9.1.1 Modeling skies in Radiance Distribution of daylight throughout a room is relevant in establishing speetral distribution and illuminance levels, especially in regard to this investigation. Basically there are two different approaches for rnadeling skies in Radiance, the gensky cammand and the gendaylit program. Gensky creates a scene description for the CIE standard sky distri bution at the given month, day and time. Input of latitude and longitude specifies the global position of the scene. The output sky distribution is given as a brightness function, skyfunc. lts value is in watts/steradian/m2
. The x-axis points east, the y-axis points north and the z-axis corresponds to the zenith. The actual material and surface(s) used for the sky arebasedon standard skies [Kittler et al. 1998]. Gendaylit creates a luminanee distri bution based on the Perez 'Ali-Weather' model [Perez et al. 1993]. Marda~evic showed better results predicting intemal illuminance levels from sky distribution based on Perez compared to standard CIE skies, which also proved adequate [Mardaljevic 2000]. Gensky is used in this research for sky definitions.
9.2 Objectives & points of attention An ideal situation is a situation in which the subjects are totally unaware they are being monitored or observed. It guarantees their daily routine is not influenced, noteven subconsciously and therefore reliability of data is guaranteed. A methad that is able to determine vertical illuminance, without the use of a unit that requires to be placed onto the subject is desirable. Possibilities of simulation, in combination with the determination of the subjeet's whereabouts in function of time must be ex plored to understand its possible scientific value.
To make a reliable assessment of vertical illuminance (paragraph 4.3: retina! illuminance [Aries 2005]) subjects are exposed to, simulations have to be accurate (as Iittle as -I 00 lx of light could produce half of the maximal phase delay shift found at I 0000 I x and that 90% of the asymptotic maximum response could be achieved with 550 I x [Zeitzer et al. 2000]) and must be accurate continuously when simulations are run for a langer period of time. Because Alzheimer patients are less agile they often remaio seated for larger parts of the day. The accuracy of the simulation should be very specific and thoroughly validated in respect to those points. lts reliability to predict specific vertical i! luminanee near eertaio relevant positions is tested using input directly retrieved from vertical measurements on windows.
Speetral distribution of light is essential in relation to the human circadian system, the Lightwatcher provides information on this distribution. Radiance provides this specific speetral information based on the manual input of material data, because of the complexity of simulated light sourees the Lightwatcher is used in this research. Data retrieved from the Lightwatcher is included in the analysis to understand the present speetral distribution, possibly draw general conclusions from the data, point out pitfalls and provide recommendations. Objectives researched in this part of the investigation are listed below:
• Radiance reliability to predict vertical illuminance (paragraph 4.3: retina! illuminance [Aries 2005]) basedon input from measurements conducted directly at the window;
• Determination of speetral distribution through si mulation or with any other aid, except devices to be placed on the subject.
Master's Thesis 48

Assessment Circadian System & Retina! Illuminance Exposure
9.2.1 Assigned testcases for simulation & measurements Three different rooms, on different location and with different functions, are included in the research and simulated in Radiance (Staffroom in Vertigo; Communal living room in nursing home St. Franciscus; Room in private home). All three simulations are validated through measurements on location. Measurements with the Lightwareher took place in all three rooms gatbering speetral information to include in the analysis.
Appendixs A_F7, A_F8, A_F9 and A_ T6 provide information a bout the weather conditions, number of days measured and positions chosen to record desired variables of the measurements. Because notall conditions during measurements could be conditioned and controlled some relevant aspects regarding speetral distribution are difficult to interpret Electrical Jighting in the staffroom of Vertigo influences data regarding speetral distribution due to its specific qualities. During measurements of testcase 11 and testcase III no electrical lighting was present, which is taken into account camparing all three cases.
Master's Thesis 49

Assessment Circadian System & Retinal Illuminance Exposure
10 Testcase 1: Staffroom Vertigo The first project is the staffroom of the laboratory in Vertigo, the faculty building of Architecture, Building and Planning of the Eindhoven University. It ' s a relatively simple room, but the interior design is somewhat complex. A lot of tables and chairs, cabinets, papers and computers on every table. Electrical lighting is provided by a raster of Fagerhult Jndulux Narrow Beam fittings.
(B) = =
=
(A)
Figure 10.1: ft oor plan a11d orientation of the simuialed room in Vertigo (A), two cross-sections of the staffroom (B).
=
Two work stations are simulated more specific to imitate a situation where subjects are seated fora long period of time. The light sourees are simulated through conversion of JES files downloaded from the manufacturer's website. Sky conditions during measurements were logged and used as input for the model in Radiance. A CIE clouded sky, coordinates for Eindhoven (site latitude 51.3 degrees; 5.3 degrees east longitude) and the time and date at which measurements took place were input for this model (appendix A_T6).
Fif!,Ure /0.2: input offurniture and room structure ( B), renderinf? of th e scene attwo diflerent viewpoints (A & C).
Camparing results obtained by measurements with illuminance levels generated by Radiance determines the reliability of the simulation. Considering the complexity of the room, which is far more complex compared to most communal living rooms in nursing homes, validation is judged in the appropriate context.
Master's Thesis 50

Assessment Circadian System & Retina I Illuminance Exposure
10.1 Validation of the staffroom simulation
10.1.1 General illuminance level A raster to determine the general horizontal illuminance level is laid out over the room, the distance between measurement points is two meters. Eye level of a seated person is considered 1.2m from ground level , eye level of a standing person is considered 1.6m from ground level (appendix A_F7). Measurements were conducted at those particular heights and availability of sensors allowed measuri ng at four points simultaneously. Appendix A_ T6 provides all information regarding the date, time and the circumstances concerning the measurements.
Fine-tuning the simulation model increased the reliability of the simulation. Horizontal illuminance and vertical illuminance in window direction are considered most relevant, tigure 10.3 and tigure 10.4 show graphs camparing illuminance levels obtained by measurements to illuminance levels generated by Radiance.
(A) Measurements general hori"l'.ontnl illuminance le,·e l (lux)
. bii0-700 .
a s:oo.MXt • -11.)..500
Q .\Q0-.4()(1
0 200.:\c.M)
. • 100.:200
QO...JOO
700
wo 500 ~ 400 i
!
I I
(B) Rndia.nee ge nerat horizontaljlluminance Je,·e l (lux]
700
600
8 MA)..7UO
S S{lf).M)U
.400.5»1.)
o .I,(I0.4i.N)
0 200..\0o
• 100.200
• 0- 1110
~00 ~
400 .i ~
I I Oistmu:c :\.-uxis
Figure 10.3: horizontal illuminance levels for bath measurements conducted on location (A) and Radiance output (B).
Both horizontal illuminance levels, measurements and Radiance, show the same form and matching values throughout the entire room. Measurement data shows a slightly higher peak close to the outer wall, in general two separate islands are distinguished separated because of the concrete column in the middle of the room. This also explains the extreme Jow value seen in both graphs.
1\'leasurcments vertical illuminance Je,·el [lux] . MI0-71J11
• !'00-6UI.I
• .a00-:'00 (A)
o :'ti0-400
0 100-:lOO
. 1(10..200
1!1 0.100
7tl0
wo :;oo ' , 400
J
I 1 Oislanct.' x--:nis
Rnd.iaucc vcrticn.l illuminance Je\:el (lu.xJ
(B)
I I
700
600
. (,()()..700
0500-WO
.-100.501)
0 .l00--.100
0 200-JOO
.I00.10h
fi ().J(Ml
500 ~
j
Ois lanet· x-axis
Figure 10.4: vertical il/uminance levels for both measurements conducted on location (A) and Radiance output ( B ), vertical i/I u minanee level in window direction ( east).
Master's Thesis 51

Assessment Circadian System & Retina) Illuminance Exposure
Changes in weather conditions, clouded or sunny, influence internal illuminance levels. When artificial light sourees inside are not altered, weather conditions are considered to explain fluctuations in illuminance level. Looking directly at this lightsource, vertical illuminance in eastern direction , determines the simulation's accuracy in this department Figure 10.4 shows high vertical illuminance levels perpendietdar to the windows in the outer wal!, and shows significant decrease of illuminance level in the areas between these windows. Both measurements as wel! as Radiance output show four islands, explained by the positions of the windows in the outer wal I.
Figure J 0.3 and figure 10.4 clearly show great resemblance between both horizontal and vertical illuminance levels, generated by Radiance and the measurements. The complexity of the staffroom causes simulation to generate values ranging within 85% to I 20% of tme va lues.
10.1.2 Illuminance level of work stations Research considering patients with Alzheimer disease requires si mulation of specific places, in this case work stations, to be very accurate also given the fact subjects are less agile and remain seated for Jonger periods of time. Two work stations are measured separately, with a J.Oxl.5m raster (appendix A_F7). Figure 10.5 shows a comparison of results generated by Radiance and measurements.
(A)
Dishtnct• y-axis
Mcaçurements Horizonlal Jllwninance Work Sintion I tJuxl
Dislanc~ x-as
0.5
Measurements Horiwntalllluminancc Work Stalion 2 (lu.x]
800
700
.... M :I
;oo ~
" u 400 c .. .1110 " "ë zoo ~ 100
0 7110-81..10
. 600-700:
• ~00.600
... oo.SOft o.\00.400
0200-.'l)C)
• 100..200
_111 0-lOO
800
700
.... ;;-
5<10 oS
~ " ,.. Ë
lOO ~ 1110
0700-Ki)fl
· t>00-701.1 12 500-6M
0.5 Dis1ance x-axis • 400-~Hl
O:.llH'I-&(H"t
0 200-3011
• IU0-200 IJD.JIIO
(B) Radiance Horizonlal Uluminance Work Stalion I [lux]
.... 700
MJOK' :I
$00 '; u
400 c .. .KNJ · ~ 200 ~ 100
Q.:'4)()..t0411
0 200-3011
• 100-200
D ().IOO
Radiance HorizonlaJ lUuroinance \Vork Stalion 2 (lux]
0,5
800
700
600 ;;, ;oo =-.... ~
~ ;100 Ë 200 g 100
071)9.HOU
.lltW)..700
C 5t»-N''tl
Oisliult.·r- x-:txis • -1110·~•
CJ;\I)I)..j(MI
021'10 •• \00 .!I)().2(MI
EI0- 100
Figure 10.5: horizontal illuminance levels for both measurements conducred on locarion (A) and Radiance output ( B), for both work stations.
Master's Thesis 52

Assessment Circadian System & Retina! Illuminance Exposure
Work station 1 (close to the outer wall containing windows) shows, despite the irregular level of illuminance, great similarity between measurements and simulation. Work station 2 shows a very flat illuminance level for both measurements as wel! as the Radiance output. Clearly even very specific positions in a relatively complex setting can be accurately simulated. Figure I 0 .5 shows a very accurate horizontal illuminance level , ho wever the vertical illuminance in four different directions is more difficult to simulate according to Radiance output. Horizontal values stay within inaccuracy boundaries from 90% to 110%, while vertical values range from 50% to 200% with an occasional peak of al most 300%.
10.2 Speetral distribution of light Two workstations are chosen to set up the Lightwatcher, measurements in several different direc tions are carried out. To evaluate the influence of various viewing directions of subjects and the influence of daylight on the spee tral distri bution of the retina! illuminance measurements given in table I 0.1 are executed .
T bi 101 a e . : measurements wtt t e tgl twatc . h h L' h h er m t h ff e sta room Number Position Height [mm]
OOI A 002 A 003 A 004 A 005 A 006 A 007 B 008 B 009 B 010 B Oll B 012 B
MOOI M002 M003
M007 M008 M009 Figure 10.8: viewpoints rendered by Radiance. The row above showing measuremenls ex eculed from point A, the row below showing views from measurements executed from point B. The angles -45° and +45° imitate a subject looking down and looking up. On the right positions A and Bare pointed out in the groun.dplan.
Master's Thesis
1200 1200 1200 1200 1200 1200 1200 1200 1200 1200 1200 1200
Direction [-] Angle [0]
E 0 w 0 s 0 N 0 E -45
NE 0 E 0 s 0 N 0 w 0 s -45 s +45
M004 MOOS M006
MOJO MOJJ M012
e'JI-------e'J
53

Assessment Circadian System & Retina! llluminance Exposure
Position A is defined on the same position as workstation 2, position B is defined close to the outer wall in order to analyze the possible influence of daylight on the speetral distribution of the recorded illuminance. The angles of -45 and +45 degrees are introduced to imitate a subject looking up or down. Subjects reading, eating or playing a game look down in a 25 degrees angle [Aries et al. 2005]. Ho wever patients suffering from Alzheimer' soften nod, creating a larger angle (- 45 degrees).
10.2.1 Shortwavelength light in relation to vertical illuminance '/rradiance, radiant emittance, and radiant exitance are radiometry termsfor the power of electromagnetic radialion at a swface, per unit area. lrradiance is used when the electromagnetic radialion is incident on the sutface. Radiant exitance or radiant emittance is used when the radialion is emerging from the sutface '. All of these quantities characterize the total amount of radiation present, at all frequencies. It is also common to consider each frequency in the spectrum separately. The Lightwatcher produces data dividing the entire spectrum and visualizes five frequencies and their irradiance (ft gure I 0 .9).
JO
IS
10
1.-lttht_lk ~75nm
- l.iclu_ Rc-d 62&nno
- IJ;tll _ (;run ~-'Onnt
- U~ lti_Dtue JMnm
- U~hl lf\' .l~(lm•~
Spc<:lr.tl Dislrihulion Sl<~f'fn10m 4SO
.100
2!<0
200
ISO
100
so
Figure 10.9: output of Lightwatcher for all measurements. On the left y-axis the irradiance values for jive wavelengtliS of the light spectrum. On the right y-axis the average illuminance level registrated at eye level.
Figure 10.9 presentsaverages of samples taken for 20 minutes for each measurement, providing an instant view of the differences between positions A and B, as well as different directions. Looking at the relevant wavelength regarding the human circadian system, the shortwavelength light (M65 nm), it is clear that its contri bution in comparison toother visible wavelengths, the red- (/...620 nm) and green (/...540 nm) light is minimaL Results of measurement 007 at position B show the largest contribution of all wavelengths, positioned close to the windows and the Lightwatcher (eyes of the subject) directed straight at the windows. All measurements executed on position B show greater contributions of shortwavelength light in comparison to measurements executed on position A. This indicates that the contribution of the shortwavelength light frequency increases as the distance to the window, the souree of daylight, decreases. The contribution of the shortwavelength light frequency also increases as a result of directing the Lightwatcher towards the windows. Figure 10.9 shows a speetral distribution for each measurement close to the speetral sensitivity curve of the human eye, with a peak around 540 nm.
The spatial distribution of all five frequencies contributions is similar to the course of the recorded illuminance level throughout the room, as the illuminance increases the irradiance of all five frequencies increases simultaneously. Figure 10.9 clearly shows Jarger varianee in irradiance of the shortwavelength light in comparison to longwavelength light, disregarding position or direction. This indicates the great dependenee of shortwavelength contribution on viewing direction and position compared to contributions of longwavelength light, which are more equally distributed over the room and all viewing directions. Tab Je I 0.2 shows means and ranges of irradiance of all five wavelengths.
Master's Thesis 54
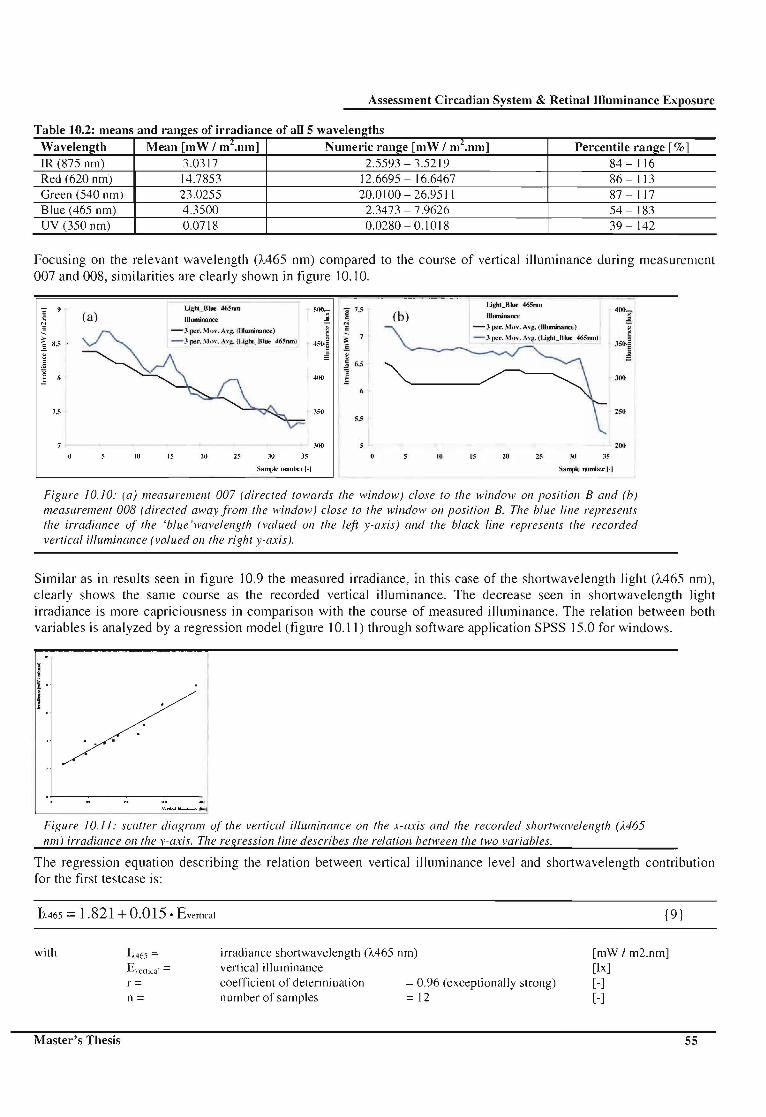
Assessment Circadian System & Retina! Illuminance Exposure
T bi 10 2 a e . : means an d ranges o Irra Jance o a r· d' f 11 5 h wave engt s Wavelength Mean [m W I mL.nm] Numeric range [mW I mL.nm] Percentile range [%] IR (875 nm) 3.0317 2.5593 - 3.5219 84- 116 Red (620 nm) 14.7853 12.6695 - 16.6467 86- 113 Green (540 nm) 23.0255 20.0100-26.9511 87- 117 Blue (465 nm) 4.3500 2.3473 -7.9626 54- 183 UV (350 nm) 0.0718 0.0280-0.1018 39- 142
Focusing on the relevant wavelength 0A65 nm) compared to the course of vertical illuminance during measurement 007 and 008, similarities are clearly shown in tigure I 0.1 0.
(a) JUnminanee
-3 pt=r. Mm·. A,·~. Ollwninance)
- 3 pn. J\lm·. fh)!. (U)!hi.)Jiue 46~om)
400
7.5 350
10 15 20 JO
Sample numbc r 1-1
I 1,s ,.; ë ; 7
Ë. ~ .~ 6,5
"E .:
5.5
(b)
10
IJJ:}11_Riue 465nm
-3pcr. :\lo,·. A'~· (Uiw:ninaocc)
- 3 J>l.~l". Mu\ . . h~ (l.ighi_Uiuc 46:=-nml
JOO
250
2(Hl
20 25 JO
Sample numhcr 1-1
Figure 10.10: (a) measurement 007 (directed towards the window) close to the window on positio11 Band (b) measureme111 008 ( directed away from the window) close to the window 011 position B. The blue fine represems the irradia11ce of the 'blue'wavele11gth (valued 011 the !efi y-axis) and the black fine represents the recorded vertical illuminance (valued onthe right y-axis).
Similar as in results seen in tigure I 0.9 the measured irradiance, in this case of the shortwavelength light OA65 nm), clearly shows the same course as the recorded vertical illuminance. The decrease seen in shortwavelength light irradiance is more capriciousness in comparison with the course of measured illuminance. The relation between both variables is analyzed by a regressionmodel ( tigure 10.11) through software application SPSS 15.0 for windows.
Figure I 0.11: sealt er diagram of the vertical illuminance on !he x-axis and the recorded shortwavelength (M65 nm) irradiance on the v-axis. The regressionfine describes the relati011 between/he two variables.
The regression equation describing the relation between vertical illuminance level and shortwavelength contribution for the first testcase is:
U465 = 1.821 + 0.015 • Evenical
with
Master's Thesis
h465 = Evcnical = r=
n=
irradiance shortwavelength (À465 nm) vertical illuminance coefficient of determination number of samples
= 0.96 (exceptionally strong) = 12
{9}
[mW I m2.nm] [lx] [ -] [-]
55

Assessment Circadian System & Retinal Illuminance Exposure
Based on the established statistica! relation {formula 9} an estimation of the shortwavelength light distribution throughout the entire room is shown in figure I 0.12. Based on Radiance output the course of the vertical illuminance on the axis shown in tigure 10.12 is presented. Figure 10.12a shows values measured directed toward s the window, tigure 10. 12b shows results of viewing direction away from the window.
ê 10 .... ! 9
1 x ~ 7 .!i
ê - 5
-Sill•r1 mt \ c k> n~otlh lj).:.ht liA6.:'nml
- VcrtkHIIIIumin:ux:,·
(a)
liOO =
500 ; 400 ~ JO()
200
100
-sJ,.,r1,.,.a,·dcn~th J.ig.htli.4Mru:nl
M - Vutkal lllumintmfc
~ .. s.o .§. ~ 4.0 .~ ] :.\,0 150
2,0 100
1.0
0,0
L>istunc.: frnrn \\induw lm1
Figure 10.12: (a) shows irradiance values directed towards the window where (b) shows values measured directed away from the window. The con tribution of 'shortwavelength light ' is simi/ar to the course of the vertical i/lumina nee level. On the x-axis: the distance from point of measurementto window.
10.3 Conclusions Predictions for general horizontal illuminance levels are highly accurate using simulation through Radiance, with generaled values within a range of 85% - 120% in a complex situation. Accuracy regarding defined workstations is even higher, with values ranging from 90% to IJ 0 %. Results show a 95 % confidence intervals [%] of 0.89- J .15 for general horizontal illuminance and of 0.96 - 1.07 and 0.96 - 1.06 for horizontal illuminance at respectively workstation I and workstation 2. Validation of this testcase should be focused on vertical illuminance, because of its relation to retina] illuminance (paragraph 4.3 [Aries 2005]). General vertical illuminance levels generated by Radiance range from 85%- 120%, with 95% a confidence interval[%] of 0.87- 1.16. This is similar to the inaccuracy seen in general horizontal iJ luminanee levels.
Results indicate Radiance is sufficiently accurate in case of low illuminance levels. In case of high illuminance levels, conditions for light therapy, this particular simulation is inadequate. Simulation is a simplified model of reality prediering future or present variables. Considering the complexity of the scene to simulate, decisions on how accurate to do this are critica!. It's clear that increasing the accuracy of model building also increases the accuracy of simulation results.
Daylight and its exposure in the room is relevant to distribution and contribution of all 5 measured wavelengths. The recorded irradiance of shortwavelengths depends significantly on the distance of the measurement position to the souree of the incoming daylight. When the distance between objective and daylight souree increases, the irradiance and the con tribution of the relevant shortwavelength light (À465 nm) both decrease.
The contribution of the relevant sh01twavelength light (À465 nm) is proportionately the same as the recorded vertical illuminance level. This means that contribution of this relevant wavelength can be determined through analysis of vertical illuminance levels . A linear relation between vertical illuminance and shortwavelength contribution is established with great correlation. This means the distribution of shortwavelength light throughout the room can be diverted from vertical illuminance levels generated by Radiance. Due to restrictions regarding measurements with the Lightwatcher, causing a low amount of samples to be analyzed, this statement is further researched in the next testcases.
Master's Thesis 56

Assessment Circadian System & Retina! Illuminance Exposure
11 Testcase 11: Nursing home St. Franciscus The second testcase involves the communal living room at nursing home St. Franciscus, a room where patients with Alzheimer disease stay all day under staff supervision. This day nursery contains two large tables were all the subjects are seated for the largest part of the day. There is also a television present with a sofa and a couch creating a third spot subjectscan be seated fora Jonger period of time. During measurement no artificial lighting was used. Appendix A_T6 provides allinformation regarding the date, time and the circumstances conceming the measurements.
(A) 10300 (B) 8200 2100
N L- CJ ~ ~ / v 11 I
L- -,--- -- - ~ - ' j ~
IQ Ql ~ ..;..,..__ ______
-~ L_ L __ I - "'T"" :zl
~ I
~ s ~;;; I
Ir _ _l - -r
Figure I 1.1: floor plan and orientation of the simuiared room (A), a cross-sec/ion of the communa!!iving room of the nursin home(B).
A CIE hemispherical blue sky with an added souree description for the sun, coordinates for Gilze (site latitude 51.3 degrees; 4.5 degrees east longitude) and the time and date at which measurements took place were input for this model (appendix A_T6).
Figure 11.2: (B) input offurniture mui room structure and (A & C) rendering of the scene at two different view oints.
Measurements in the communal living room had to be executed duringa normal day in the nursing home, with subjects staying in the room. Because of the restrictions and little possibilities, specific measurements regarding certain places subjects are seated for a Jonger period could not be executed. Therefore only general measurements to validate the simulation were done.
Master's Thesis 57

Assessment Circadian System & Retina! Illuminance Exposure
11.1 Validation of the communalliving room simulation A raster todetermine the general horizontal illuminance level is laid out over the room, distance between measurement points is two meters. lts assumed subjects remain seated for the part of the time, therefore measurements took place at 1.2m (appendix A_F8). Fine-tuning the simulation model provided data regarding the reliability of the simulation. Figure 11.3 and figure 11.4 show graphs camparing levels obtained by measurements to levels generated by Radiance.
Measurcmenl.s general horizontal iliumionnee lenl (Iu,\.]
(A) (B)
6,75 0 CJ-200 • 100-100
0 400-600 0 60U-HOO
• HI)0-1000 0 1000-llfJU
Radiance ~encr.d hori1.onhlJ illuminance le,·el (lux]
9.15 6.75
llOIJ
1000
!100 =
0 0-2.00 • 100-100
~ ~·
!
0 400-600 0 600-1100
•xuo-tooo • •uo0-1200
Figure 11.3: horizontal illuminance levelsjor both measurements conducted on location (A) and Radiance output (B).
Va1idation regarding general horizontal illuminance level provides an inaccuracy from 90% to 115%, with a peak of 300%. Th is is due to an inaccuracy in the measurement at point A 1, which is slightly different from the si mulation point A 1 (close to the television). Aside from that error the simulation is sufficiently validated as far as horizontal illuminance levels are concerned.
(A) MeosurenlCnls general ' 'e rtical illwninance le\'elllux]
9,15 6.7~
uoo
"""' ~
1600 ,g_
llOO ~ ~ "ë ~
• 0-400 • 4U0-8UU
0 KIJ0-1200 0 1100-16011
• I 611U-100Q • 2000-24011
(B) RHdlance general \'U1ical illuminance level !lux]
9.1~
6.75
2000
' 1600 6
~ u
1200 c g
l!J 0-400 • 400-800
'E E
D H00-1200 01200-1600
• llioo-2uno • zooo-2400
Figure 11.4: vertical illumincmce levels for both measurements conducted on location (A) and Radiance output ( B ), illuminance level in window direction ( easl).
The complex simulation of the staffroom in Vertigo learned that vertical illuminance is much harder to validate. Figure l 1.4 shows a very accurate resemblance between measurements and simulation. This accuracy is subscribed to the less complex design of the communal living room at the nursing home, resulting in a range of 80% to 120% with a few peaks of about 130%.
Master's Thesis 58

Assessment Circadian System & Retina! llluminance Exposure
11.2 Speetral distribution of light Two places were subjects could remain for Jonger periods of time are chosen to set up the Lightwatcher, measurements in several different directions are carried out. Measurements given in table 11 .1 are executed.
Table I 1.1: measurements with the Lightwatcher in the communalliving room Number Position Height [mm] Direction [-] Angle [0
]
OOI A 1200 0 0 002 A 1200 w 0 003 A 1200 z 0 004 A 1200 N 0 005 A 1200 0 -45 006 B 1200 0 0 007 B 1200 w 0
Position A is defined on achair position at the left table (figure 11.5), position B is defined at the couch in front of the television in order to analyze the possible influence of dayl ight on the speetral distri bution of the recorded illuminance.
MOOI M002 M003 M004
M007 M008 Figure 1!.5: viewpoints rendered by Radiance. The row above showing measurements executed from point A, the row below showing views from measurements executed from point B. The angle -45° imilates a subject looking down.
11.2.1 Shortwavelength light in relation to vertical illuminance
MOOS
The same phenomena seen in the results of the staffroom are illustrated in figure 11 .6, where an increase in illuminance level means an increase in irradiance for all five frequencies . The only measurement showing a relatively great contri bution of the shortwavelength light frequencies is M006, ciosest to the window and directed towards the window. This confirms the statement that the contri bution of the shortwavelength light frequency increases as the di stance to the window, the souree of daylight, decreases. The contribution of the shortwavelength light frequency also increases as a result of directing the Lightwatcher (the eyes of the subject) towards the windows.
Master's Thesis 59

Assessment Circadian System & Retina! Illuminance Exposure
A larger varianee in irradiance ofthe shOitwavelength light in comparison to longwavelength light is also seen in figure 11.6. This indicates great dependenee of shortwavelength contri bution on viewing direction and position compared to contributions of longwavelength light. Opposite to the first testcase those are also unevenly distributed over both positions and all viewing directions, but notasstrong as the shortwavelength light. Table 11.2 shows means and ranges of irradiance of all five wavelengths:
' - r\0 SJX>rlml Dislrii)Uiion Cnn•••maiJ.J,·in!! H•Hml 2500
- · :e.hJ_k«< 62tlnm
§ -IJ;: hl _(;n-o·II~Ûnm
~ - IJ~hi_Rhw .lb~nm
- IJJthl_ll\ .\.!t1Jnn1
. 1500
IOIJH
20
500 10
OOI 002 OOJ 004 00~ OOI> 007
Figure 11.6: outpul of Lightwatcher for all measurements. On the left y-axis !he irradiance values for 5 frequencies o[lhe lisht spectrum. On the right )'-axis the average i/luminance level regis/raled by !he actiwatch.
T bi 112 a e . : means an d f. d" f 11 5 ranges o 1rra 1ance o a wave engt IS
Wavelength Mean [mW I m'.nm] Numeric range [mW I m'.nm] Percentile range [%] IR (875 nm) 9.5289 3.8416- 25.8786 40-272 Red (620 nm) I 9.5753 13.1718-43.9695 67-225 Green (540 nm) 26.7643 20.1782-52.9848 75- 198 Blue (465 nm) 8.4284 2.5403 - 32.3999 30-384 UV (350 nm) 0.2156 0.0424- 1.0439 20-484
The statement that the contribution of different wavelengths is in accordance with the course of the recorded vertical illuminance level, is confirmed by the resutts shown in figure 1 1.7.
~ 34
~.u 1 g 32
~ E 31
JO
29
UJ,!ht_Bh • .k' 46!\um
lllumin.tOl"t"
-2 pt>r.l\o·lo,·. A,·~- (llluninarv.:(')
- 2 pl•r, Mu,., Av)!. (Li!!,hi _Diut' 46Snm)
10 15 10 25 JO .15
Sample numberl-1
2200~
t 2100~
"ë ~
1000-
1900
1800
1700
4,5
3.5
2.5
Li~hi_Dh.K.' 465nm
llluniMn&..~
-2 (k"r. Mo,-. A''l:· (lllwrinanl."c)
- .Z. _Jl" ... M ó, , A'·J!. (LiJ,.:.hi_Uiur 46!\nm)
10 15 20 25 JO
Sample nwJ~'Jt'r (-]
Figure 11.7: (a) measuremenl 006 (directed towards the window) close /o the window on posi/ion B and (b) measuremenl 007 (di reeled away from the window) close to the window on posi/ion B. The blue fine represenls the irradiance of the 'blue'wavelength (valued on !he /eft y-axis) and !he black fine represenls !he recorded verlical illuminance (valued on the right y-axis).
Master's Thesis
100
60

Assessment Circadian System & Retinal llluminance Exposure
Figure 11.7 firmly confirms the assumption the contribution of the shortwavelength light (A465 nm) is propot1ionately the same as the recorded vertical illuminance level. This strong1y suggests the distribution of the shortwave1ength light (A465 nm) throughout the room can be traeed back, and therefore also predicted, to the course of the vertical illuminance level. The relation between both variables is analyzed by a regressionmodel (figure 11.8) through software application SPSS 15.0 for windows.
Figure 11.8: sca/ler diagram of the verticctl il/uminance on the x-axis and the recorded shortwavelength (À465 nm) irradiance on the v-axis. The resression line describes the relation between the two variables.
The regression equation describing the relation between vertical iJ luminanee leveland shortwavelength contribution is:
U465 = 2.025 + 0.015 • Evcrtical { 1 0}
with IM6:> = E\'cnical = r= n=
irradiance shortwavelength (IA65 nm) vertical illuminance coefficient of determination number of samples
= 0,99 (exceptionally strong) =7
[mW I m2.nm] [I x] [-] [-]
Based on the established statistica] rel at ion { fom1ula 10} an estimation of the shortwavelength light distribution throughout the entire room is shown in figure 11.9. Based on Radiance output the course of the vertical iJ luminanee on the axis shown in figure J 1.9 is presented, it shows results of a viewing direction towards the window .
E ...... -10
1 ~ 30
i 20
10
.. ~o ; I J500 -~
J(H)O .~ E
2500 ~
2000
1500
""'" 5CHJ
/ r;::=::a; ctJ
- - 1------rÇ> ,_
Figure 11.9: output of Lightwatcher: irradiance values airected towards the window. The contribution of 'shortwavelength light' is determined based on the vertical illuminance level. On the x-axis: the distance from point ofmeasurement to window.
Master's Thesis 61

Assessment Circadian System & Retina] Illuminance Exposure
11.3 Conclusions Simulation of the communalliving room in a nursing home is considered sufficiently accurate. Horizontal illuminance levels range between 90- I 15% of true measured values and vertical illuminance levels range between 80- 120%. Horizontal- and vertical level show 95% confidence intervals [%] of respectively 0.93 - I. I 5 and 0.93 - 1.18. In accordance with the simulation of the staffroom horizontal illuminance levels are wel I predicted by the software and in addition, relevant vertical illuminance is also accurately simulated in the communal living room.
The assumption that daylight and its exposure in the room is relevant to distribution and contribution of relevant wavelengths is confirmed. This testcase also confirmed that the distance between objective and daylight souree is opposite to the irradiance leveland the contri bution of the relevant shortwavelength light (M65 nm). Subjects closer to the window receive relatively more shortwavelength light on their eyes in comparison to subjects further away from the window. Subjects looking towards the window also receive more shortwavelength light on their eyes in comparison to subjects looking away from the window.
Measurements in the nursing home confirm the statement that the contribution of the relevant shortwavelength light (M65 nm) is proportionately the same as the recorded vertical illuminance level. This means that the contribution of this relevant wavelength can be determined through analysis of vertical illuminance levels. Due to previous discussed restrictions regarding measurements with the Lightwareher this statement is also researched in a third testcase.
Master's Thesis 62

Assessment Circadian System & Retinal Illuminance Exposure
12 Testcase 111: Testroon1 The third and final testcase is a room in a private home, a very simple and less complex room. lts layout is shown in figure 12.1 and its rendering in Radiance is shown in figure 12.2. Appendix A_T6 provides allinformation regarding the date, time and the circumstances concerning the measurements.
2550 . 340 1570
r I I
1-
l·
900mm +P
2200mm +P
2200mm +P
2950mm +P
Figure 12.1: floor plan and orientation of the simuiared room.
One workstation is defined, obviously the only present desk is suitable for validation on a specific level. Validation of this testcase, geometry- and design wise the most simple of the three , should have a very high accuracy level.
Figure 12.2: In the middle: input offumiture and room structure, on the leftand right rendering of the scene at two different viewpoints.
A CIE hemispherical blue sky with an added souree description for the sun, coordinates for Eindhoven (site latitude 51.2 degrees; 6.0 degrees east longitude) and the time and date at which measurements took place were input for this model (appendix A_T6).
Master's Thesis 63

Assessment Circadian System & Retina! Illuminance Exposure
12.1 Validation of the testroom simulation
12.1.1 General illuminance level A raster to determine the general horizontal illuminance level is layer out over the room, distance between measurement points is 500mm. lts assumed subjects remain seated for the part of the time, therefore measurements took place at 1.2m (appendix A_F9). Fine-tuning the simulation model provided data regarding the rel i a bi lity of the simulation. Horizontal illuminance and vertical illuminance in window direction are considered most relevant, figure 12.3 and figure 12.4 show graphs camparing levels obtained by measurements to levels generated by Radiance.
1\-fea.surl'ml'nl.s ~t"nt-ral horh:onlfll illuminant·c I('H·I [lux] Radianu· ~t'll('ral horiï'.onl~l illumi_nanl"t' l('\'l'l(luxl
(A) 0-:"IJIJ • 500-1000 (B) 0-."INJ •-"Oli ... ]O()ll
0 J 000-1500 0 1.500-2000 0 IOOO..ISfiO OJ501J-2-000
• 2000-25011 IB 2500-3000 • 2000-2500 D 2::00.3000
oJS00-4000
4000 4000
J500 J500
~000 . ~
2500
i 2000
.\000 . ::S
2!'110 " 2000 ~
1500
~ 1000
1500
~ 1000
11.6 Dislann· x-ax.is
0.5 0.5
Figure 12.3: horizontal illuminance levels for both measurements conducted on location (A) and Radiance output (B).
Horizontal illuminance level is validated extremely well, figure 12.3 shows great similarity between measurements and simulation. Values generated by Radiance stay within a range of 95- 105% of the true measured values, indicating this simulation is highly accurate.
l\-lcasurcmenls \'ertical illumintWlY lenlllux]
(A) 0-1000 • I 000·2000 (B) 0 2000-JOOO D J000-41)00 • 4000-5000 r!l 5000-60C)O • (i.(l 00-7000 0 7000-81)(10
~000
7000
6000 ;[ 5000
~ 4000 ~
~000 'E ~
1 Distance ~--axis 2'1
I 0,6 Disrance x-axis
0,.:"
Radh~ntt 't•rtical illuminant~e level (lux]
o,r. 0.5
• 0-10011 • Hl00-2000
0 2000-.\000 0 J{M)I).41)1){)
0 ."000-6000
0 701)1).S000
80(10
7000
6(100 . 6
5000 ~
4000 ~
.lOOn 'E 201JO ~ 1000
Distancc x-axis
Figure 12.4: vertical illuminance levels for both measurements conducted on location (A) and Radiance output ( B), illuminance level in window direction ( east).
Master's Thesis 64

Assessment Circadian System & Retina! Illuminance Exposure
The same conclusions drawn for horizontal illuminance levels can be drawn in case of vertical illuminance levels according to figure 12.4, illustrating comparisons between measurements and simulation regarding ve11ical illuminance levels. The most relevant direction in which the ve11ical illuminance must be accurate is represented, measurements directed towards the window. Values generaled by Radiance remain within a range of 85 - 115% of the true measured values, indicating this si mulation is sufficiently accurate.
12.1.2 Illuminance level of work stations Research considering subjects with Alzheimer disease requires simulation of specific places, in this case one workstation (appendix A_F9), to be very accurate also given the fact subjects are less agile and on the same place for Jonger periods of time. Figure 12.5 shows a comparison of results generated by Radiance to measurements. The simulation of third testcase, where design and interior are simple in comparison to the first two testcases, also proves to be highly accurate considering the specific horizontal and vertical illuminance levels at the defined work station. Horizontal values ranging in between 95- I 05% of the true values and vertical values ranging in between 85 -115% of the true values indicate the high accuracy of the simulation. Figure 12.5 clearly shows strong similarities between the Radiance output and measurements.
I Oistance x-n:·ds
Mca.'iun-mtnls Hori7.ontalllluminltnc«- Workshtlion (Iu).] RatlÎann· Hori:~JJn t sl JlluminauCf Worksl.ulion (lux)
0.2:1'
• rooo-2uoo •l01J0-.~ 0 .~-oi(~JU 0 -'000·!'000
• 500C)..(t000
:1'000 . 4000 ~
,..)() ~ 'E ~
"' 2000
Distanec )'-axis
(B) g IOOU-2000 • 2000-... lOOtl
6000
"""' . ~
4000
~ .\000
ê "ë ~
0.25 Dishmcc y-axis
l\-1easu!"f'mrnls \'trticalllluminanl'E' \Vo rks tution [lux] Radianct V~rtit~a lllluminan~ Workstutinn (lux]
• J()(I0..400U • 4000-5000 • 3U(.MJ....Miil0 • -'(Hii)...54l410
o.~ ot>000-7000 OS(I()I)..6(M.IO o6000-7fNM(
• 7000-8000 8000-9000 • 7000-8000 El 8(1(1().~
..... ?000
11000 11U00
7000 g . 7000 "
6000 ~ ~ """"
~ .. c c
;ooo "ë ~
51100 "ë ~
<<MlO 4000
O.lS Dis rance y-ax.i.s 0.15 0,.!5
0,25 Distance y-axis
Figure /2.5: horizontal- and vertica/ illuminance levels for both measurement,s conducted on location (A) and Radiance output (B).
Master's Thesis 65

Assessment Circadian System & Retinalllluminance Exposure
12.2 Speetral distri bution of light Two pi aces were subjects could remain for Jonger periods of time are chosen to set up the Lightwatcher, measurements in several different directions are carried out. Measurements given in table I 2.1 are executed.
Table 12 1: measurements with the Lightwatcher in the testroom Number Position Height [mm] Direction [-] Angle [0
]
OOI A 1200 z 0 002 A 1200 N 0 003 A 1200 z -45 004 A 1200 z +45 005 A 1200 N -45 006 B 1200 z 0 007 B 1200 N 0 008 B 1200 0 0 009 B 1200 \V 0 OIO B 1200 z -45 OJ I B 1600 z 0
Position A is defined on the chair position near the desk (figure 1 2.6), position Bis defined in the centre of the room in order to analyze the possibJe influence of daylight on the speetral distri bution of the recorded illuminance.
M001 M002 M003 M004
M006 M007 M008 M009 Figure 12.6: viewpoints rendered by Radiance. The row above showing measurements executed from point A, !he row below showing views from measurements executed from point 8 . The angles -45° and +45° i milale a subjectlooking down and looking up.
Master's Thesis
M005
MOIO MOl I
66

Assessment Circadian System & Retina! Illuminance Exposure
12.2.1 Shortwavelength light in relation to vertical illuminance Figure 12.7 strongly confim1s the earlier assumption that vertical illuminance level is proportionately the same as the recorded shortwavelength light irradiance. It also confim1s the importance of daylight in the contribution of the relevant shortwavelength light (M65 nm), measurements 001 and 004 clearly show the highest irradiance regarding the shortwavelength light. Measurement 004, imitating a subject looking up, provides the hi ghest vertical illuminance level and in accordance with the previous assumption also provides the highest contri bution of the shortwavelength light.
1211
60
40
20
IJ~hi_IR ~Hnm
- IJJ:hi_Krd f;lOnut
-l.i~hl_( ;,-,.t-n ~"""' -IJ~III_ B iut 46~nm
-IJ~lll_l'Y .'~Oom
-Uh.u"'"'""-.,
Spt'tl m l Distribution Te~lnliiRl
Measurc.n:.nl
MOOO
~ 71Ml0 ~
~ (~!
;4M)()
oi(HJO
2UOO
1000
· 0
Figure 12.7: output of Lightwatcher f or all measurements. On the left y-axis the irradiance val u es f or 5 frequencies of the lis ht spectrum. On rhe ris ht v-axis the averase illuminance level registrated by the actiwarch.
A larger varianee in irradiance of the shortwavelength light in comparison to longwavelength light is also seen in figure 12.7. This indicates the great dependenee of shortwavelength contri bution on viewing direction and position compared to contributions of longwavelength light. In comparison to the second testcase those are also unevenly distributed over both positions and all viewing directions, but not as strong as the shortwavelength light. Table 12.2 shows means and ranges of irradiance of all five wavelengths:
T bi 12 2 a e . : means an d ranges o 1rra 1ance o a f. d" f 115 h wave engt s Wavelength Mean [mW I m".nm] Numeric range [mW I m".nm] Percentile range [% ] IR (875 nm) I 5.9951 6.1897-41 .8824 39 - 262 Red (620 nm) 31.7740 15.3711- 83.2316 48-262 Green (540 nm) 41.0136 22.0653- I OJ .9652 54- 249 Blue (465 nm) 2 1.3514 4.3900 - 57.5833 21-270 UV (350 nm) 0.4772 0.0679- J .5600 14-327
Occurring in all three testcases, the phenomenon of tracing back different wavelength contri bution to the course of the vertica l illuminance throughout the room is assumed to be reli able. Th is is further demonstrated in figure I 2.8 showing the course of vertical illuminance in comparison to the course of the shortwavelength light contribution.
Master's Thesis 67

Assessment Circadian System & Retina] Illuminance Exposure
ê 70
~
J.ighi_Oiut~ 465nm (,()I)Oá
~
ê 5,!'
~
l..i j.!hl_lHLW 41i5ooa
-2 ptr. Mu\', Al'J:· (JihillÏrtinct• ) -2pt-r.Mn\·.A,·~.(IIIunimr1Ct")
Jllumill'diiC,.'(' (a)
- l prr. Mu\·, A\'.(: . H.iJ:hi_Diuc 465nm) !'!'OOJ
- 2 pt·r. Mn\. A'·J:. tl.i~hl_.llh.r 465um~
45110
!'0 4000 3,5
JO I!' 20 25 JO 10 15 20 JO 35
San~c Jur1i>e r 1-l Sample nun~lt"r 1·1
Figure 12.8: (a) measurement OOI (directed towards the window) close to the window on position A and (b) measurement 002 (directed awav from th e window) close to the wiruiow on position A. The blue fine represents the irradiance of th e 'blue 'wavefength (vafued on the feft y-axis) a11d the bfack fine represe11ts the recorded verticaf illumi11ance (vafued 011 the right y-axis).
201)~
140
120
1110
The relation between both variables is analyzed by a regression model (figure 12.9) through software application SPSS 15.0 for windows.
Figure 12.9: sealt er diagram of the verticaf illuminance on the x-axis and the recorded shortwavefength ( J-465 nm) irradiance 011 the v-axis. The resression fine describes the relation between the two variabfes.
The regression equation describing the relation between vertical illuminance leveland shortwavelength contribution is:
ll465 = 3.828 + 0.011• E venical
with h46) = E ""nical = r= n=
irradiance shonwavelength (À465 nm) vertical illuminance coefficient of determination number of samples
= 0.99 (exceptionally strong) = 11
{ I 1 }
[mW I m2.nm] [I x] [-] [-]
Based on the established statistica] relation { formula 11} an es ti mation of the shortwavelength light distri bution throughout the en ti re room is shown in figure 12. I 0. Based on Radiance output the course of the vertical illuminance on the a x is shown in figure 12.10 is presented . Figure 12.1 Oa shows va lues measured directed towards the window, figure 12. JOb shows results of viewing direction away from the window.
Master's Thesis 68

Assessment Circadian System & Retina! Illuminance Exposure
IIJO -Shur1";"·c~n,e.1h UdJI(iAóSnml
- Vl·r1k:alllluniMtkëC'
BO
60
40
20
9000-;;
HOOO :ê,
~ 7000 .5 6000 ~
4\KIO
:lOUO
2000
1000
6.0 - Shur1'm,·dcttAih IJ~hi(I . .:Ui$mul
-\'(•r1iul.llllumlnaOL'l'
S.f> (b)
S.l
4.4
4,0
200 -
IKO ~ 160 ~
ë 140 ·g 120 s: 100
"" 60
.... 211
Figure 12.10: (a) shows irradiance va lues directed towards the wiruiow where ( b) shows va/u es measurt!d directed away from the window. The con tribution of 'shortwavelength light' is i11 concurrence with the course of the vertical illuminance level. On the x-axis: the di stance from point of measurement to window.
12.3 Conclusions Even more than the first two testcases the third simulation proved to be highly accurate, both regarding horizontal as wel I as vertical illuminance levels. This is subscribed to the simple design of the room as well as the simple interior. Both general levels as well as specific levels at the work station generated by Radiance proved to be greatly similar with the measured levels. All values, horizontal as well as vertical, range within boundaries of 85 - 115 % of the true values, indicating this simulation is suitable to predict values at any given point and in any given direction. 95% Confidence intervals [%] for respectively general horizon tal- and vertical level are determined at 0.94- 1.08 and 0.93-1.07. Regarding the workstation the 95% confidence intervals [%] are determined at 0.97 - 1.05 for the horizontal illuminance level and at 0.96 - 1.03 for the vertical illuminance levels. This simulation is considered to be highly accurate.
The assumption that daylight and its exposure in the room is relevant to distribution and contribution of relevant wavelengtbs is strongly confirmed, all three testcases show similar results. This testcase also confirmed that the distance between objective and daylight souree is opposite to the irradiance level and the contribution of the relevant shortwavelength light (M65 nm). Measurements in the testroom also confirm the statement the contribution of the relevant shortwavelength light (M65 nm) is proportionately the same as the recorded vertical illuminance level. It's reasanabie to conclude that the contribution of this relevant wavelength can be determined through analysis of vertical ill.uminance levels. Due to previous discussed restrictions regarding measurements with the Lightwatcher this statement should however betaken with caution.
The ability of Radiance to predict illuminance at eye level during the day is tested through illuminance measurements in the testroom combined with data obtained by photodiodes strapped to the glasses of a subject compared to Radiance output.
Master's Thesis 69

Assessment Circadian System & Retinal Illuminance Exposure
13 Vertical illuminance generated by Radiance Radiance is able to simulate a complete day and generate illuminance levels at any given time of the day (figure 13. I). Providing the simulating is validated and found reliable, the whereabouts of the subjects linked to the illuminance at that point at that specific time, could provide relevant information about the possible retina! illuminance the subject is exposed to. Researched is the ability of Radiance to provide reliable information regarding retina] illuminance based on data acquired from illuminance measurements directly at the window (source of daylight). Photodiodes at the window, and photodiodes inside the room recorded illuminance levels fora period of two days. Mimicking a subject staying in the room (wearing an actiwatch strapped to a pair of gJasses) an actiwatch was set up in the room. The position of the actiwatch (subject) was constantly monitored and noted. Radiance si mulation ran a daily sequence (figure 13.1) to determine, at any given moment at any given position and direction, the present illuminance level.
Figure 13. I: fisheye view rendering of a daily sequence of the testroom in Radiance.
13.1 Illuminance registration inthetestroom During the measurements with the actiwatch (strapped to the frame of the glasses), sensors were placed in the testroom todetermine relevant illuminance levels. The data acqujred from photodiodes nr. 364 and nr. 925 (figure 13.2) is used as input in Radiance. Appendix A_FI 0 provides a visual of the places sensors in the testroom:
+
Figure 13.2: Set up measurements in test room, determination of illuminance levels.
Master's Thesis 70

Assessment Circadian System & Retina! Illuminance Exposure
To imitate a subject seated at the desk and looking around, the actiwatches were directed in different angles and positioned on the same positions used with the Lightwatcher. Table 13.1 shows the set up and duration of the different measurements.
Table 13 1 measurements testroom Day Number Time Position Height [mm] Direction [ -] Angle [0
]
OOI 9.30- 14.30 A 1200 s 0 002 14.30- 15.00 A 1200 SE 0 003 15.00- 15.30 A 1200 SW 0 004 15.30- 16.00 A 1200 s 0 005 16.00- 16.30 A 1200 s -45 006 16.30- l7 .00 A 1200 s +45
1 007 17.00- 17.30 A 1200 s -45 008 17.30-18.00 A 1200 s 0 009 18.00- 18.30 B 1200 s 0 OIO 18.30- 19.00 B 1200 N 0 011 19.00- 19.30 B 1200 w 0 012 19.30- 20.00 B 1200 E 0 013 20.00- 20.30 B 1200 s 0 014 9.00- 13.00 A 1200 s 0
2 015 13.00- 14.00 A 1200 SE 0 016 14.00- 15.00 A 1200 SW 0 017 15.00- 18.00 B 1200 s 0
Figure 13.3 shows the recorded illuminance and globally the positions and directions concurring with the daytime seen on the x-axis. The purple Jine represents the average of two actiwatches (313 and 314) placed on the window to record incoming daylight. In the testroom no a1tificial lighting is used, therefore daylight is the only provider of light in this room.
The window is orientated to the south (southwest) meaning the sun turns from the left side of the room over to the window side and sets on the right side of the room. The sun wiJl penetrate the room fully in the late afternoon when it stands straight across the window. Figure 13.3 clearly shows the same course in function of the time for all recorded illuminance levels. The recorded illuminance level on the window shows the most extreme peaks and valleys because it completely depends on the weather conditions, which in this case vary from semi-clouded to extremely sunny. Because the photodiodes imitating theeyes of the subject and the sensors recording illuminance on the right and left wallof the room, are placed further away from the window these effects are less extreme, but still clearly shown.
Figure I 3.3 clearly shows the first peak just before 14.30h when the sun hits the window from the south-east side, penetrating the room for the first time. Measurement 002 which starts at 14.30h showsaslight decreasein illuminance level, even though the photodiodes (eyes of the subject) are directed to the south-east side, straight into the sun. This is caused by the semi-clouded weather conditions these measurements were taken under. At 15.00h the illuminance level drops even more due to the photodiodes being directed to the south-west side, away from the sun. Measurement 004 required the eyes of the subject being directed towards the window (south direction) which explains the sudden increase in illuminance level. Due to the semi-clouded, sunny weather conditions the sun disappeared on a regular basis behind the clouds, explaining the multiple peaks and valleys in the course of al recorded illuminance levels. The decrease seen around 17.00h is due to the photodiodes directed 45 degrees down, imitating the subject looking down. At this point the sun stands perpendicular to the window, meaning the suns penetration into the room is maximaL Due to the clouded conditions this effect is greatly diminished. At 18.00h the position of the subject changed into position B, which results in a decreasing illuminance level. With the photodiodes directed away from the window the illuminance level on the window decreases with a peak around 19.00h. This means the sun broke through while setting, the last increase in seen around 20.00h with the eyes of the subject directed towards the window again (measurement 013).
Master's Thesis 71

Assessment Circadian System & Retina] Illuminance Exposure
llO"U
11)01111
-
li"IU
-p:Ad:S-
--Photodiode 924 Photodiode 1300
--Window illuminance --lllumimlnce subject
I I
I
:r:A
• ._ p:B _.
d:S/E/W -p:Ad:S_.
• •r:A+ • d:SEp:A
d:SW
._ p:B
d:S -
-~-----~---- --------- 0
15.'0 1730 19 . .\0 11J..l1J 12..10 16..111
Day 1 Day2
Figure I 3.3: /1/uminance levels registrated by photodiodes dw·ing day I and 2 of the measurements. The yellow and orange line representing the values recorded by two photodiodes on the left and right side of the desk. The purple line represents the average of both values measured by photodiode 925 and 364, the vertical illuminance on the window. The black line represen.ts the average of photodiode 313 and 314, imitating a subject seated at the desk looking in different directions. Above infornwtion about the posi/ion (p) where the subject was seated and which direction (S/EIN/W) the subject was looking.
Tin .. ordu~ I hl 183U
Figure 13.3 also shows recorded illuminance levels on day 2. Similar to the recordings of the first day all recorded illuminance levels show the same course, guaranteeing the high reliability of the measurements. The black line, representing the illuminance level at eye level clearly shows higher levels during the measurements with photodiodes directed towards the window, and higher levels with photodiodes closer to the window. Weather conditions during day 2 were slightly more consistent in comparison to day J, a semi-clouded sky results in generally smaller illuminance values recorded by the photodiodes.
13.2 Generating vertical illuminance in Radiance Windows in the Radiance simulation are defined as light sources, imitating a normal window that distributes daylight. Possible information regarding speetral distribution is ignored, the only variabie of interest is the vertical illuminance at any gi ven position. Data retrieved form the photodiodes on the window is used as input for the model. !I luminanee levels measured at the window are averaged over ten minutes intervals and used as manual input in Radiance, creating an accurate representation of the sky conditions.
Fine tuning the generated daylight souree in Radiance by decreasing sample times should provide even more accurate results. Analyzing the data generated with ten minute intervals, dividing the data into different intervals provides 95% confidence intervals presented in table 13.2.
Master's Thesis 72

Assessment Circadian System & Retina! Illuminance Exposure
701)0
~{I()IJ
.'000
, ...
1000
0 ~30
--Truc vcrtical illuminance --Radiance vertical illuminancc
I !.JO 13:1Q IS.:IQ 19.30 10.30 1430
Day I Day 2
Figure 13.4: True vertical illuminance at eye level of the imitated subject (black) en the vertica/ illuminance generaled by Radiance (blu e) in ten minute intervals.
Table 13.2: different intervals of illuminance levels and accompanying 95% confidence intervals Intervals [lx] True values Radiance values
IH.:\11
Mean [lx] 95% Confidence Interval [lx] Mean [lx] 95% Confidence Interval [lx] 0-1000 637 144-980 692 167- 1981
1000-2000 1550 1035- 1990 1575 872-2594 2000-3000 2419 2011-2958 2365 1621- 362 1 3000-4000 3427 3026-3937 3438 2594-4226 4000-5000 4409 4054-5878 4150 3414-5939 5000-6000 5593 5258-5878 4710 3675-6652
>6000 7394 6051- 10758 5786 3621-6652
13.3 Conclusions Figure 13.4 shows high accuracy in results comparing true vertical illuminance at the subjeet's eye with the values generated by Radiance. Working with ten minute intervals decreases the correlation between the two Iines, but is still acceptable according to table 13.2. 95% Confidence intervals are relatively similar to the intervals determined from the true measured values up to an illuminance level of 4000 lx. Increasing intervals contain fewer samples and therefore are more Iiable to show deviations in results.
Using all samples retrieved by the photodiodes as input in radiance should provide more accurate results, leav ing only the model's inaccuracy as decrease in the reliability of the generated results. This test is conducted with a subject imitation whose position and viewing direction was controlled at all times, simplifying reality . In reality subjects will constantly change position and viewing direction complicating accurate results on vertical illuminance at subjeet's eye level.
Master's Thesis 73

Assessment Circadian System & Retinalllluminance Exposure
14 Conclusions, discussion & recommendations
14.1 Conclusions Research concerning methad J focused on measuring units placed on a subject, camparing applicability on Alzheimer patients, scientific relevanee regarding assessment of the circadian system and several statistica] interpretations. The wrist-worn actiwatch, thoroughly validated (appendix B3) and proven suitable for research on patients with Alzheimer's disease, is analyzed and compared toa proposition for new recording equipment. This new measurement unit is placed on the chest of a subject, houses two photodiodes (a pbotopic and circadian sensor) and is designed as a broche. lts applicability is not tested, but experts in the field of Alzheimer patients are consulted on the possibilities of a recording device placed on the chest of a subject. Statistica! interpretations researched are: the reliability of the regression models describing the statistica! relations between respectively wrist-eye and chest-eye, inaccuracy of the regression models and the reliability of several illuminance intervals. Results are presented in table 14.1:
T bi 141 a e . : resu tso f companson ac 1wa c 1 versus new reg1s ra wn ev1ce f t I . t f d .
Ground of comparison Actiwatch (wrist- eye) Broche (chest- eye) Applicability Alzheimer patients very strong strong Scientific relevanee circadian system strong very strong Statistica! interpretation weak st rong
Overall reliabilitv regressionmodel moderate st rong Level of inaccuracy regression model weak strong
Reliabilitv different intervals (){ il/uminance moderate st rong
Research clearly shows the advantages of a new registration device (a broche) over the current used device (the actiwatch). Experts believe it wil I succeed in recording data without interference of subjects. lts scientific value is significant because it houses a circadian sensor with speetral sensitivity around the shortwavelength light. The actiwatch with only one photodiode is inferior to a device housing two photodiodes. The statistica! relation between illuminance at eye- and chest level proved to be superior to the statistica! relation between eye- and wrist level in 90% of the analyzed interpretations.
A substantial difference in statistica! power interpretation between the two established relations (wrist-eye r=0,64; chest-eye r=0,76) clearly indicates a device placed on the chest of a subject guarantees more accurate results. The regression model descrihing the relation between illuminance at eye- and chest level generates 95% confidence intervals of calculated values within -25% inaccuracy boundaries, compared to -40% incase of the eye-wrist model (figure 8. 1). Both statistica! relations underestimate high illuminance values (>1000 lx) due toa large amount of Jow illuminance samples included in the analysis. 95% Confidence intervals concerning most of the illuminance intervals are also better suited in case of the eye-chest algorithm compared to the eye-wrist algorithm. However both relations provide accurate results concerning relevant illuminance intervals of 100-200 Jx and 500-600 Jx (figure 4.2).
Research on methad 1I focused on determination of vertical illuminance (paragraph 4.3: retina! iJiuminance [Aries 2005]) without the use of any device placed on a subject, but through simulation. Radiance simulated three different testcases, measurements of speetral distribution were conducted using the Lightwatcher. Radiance reliability to simulate vertical illuminance and determination of speetral distribution through simulation were analyzed.
Master's Thesis 74

Assessment Circadian S_ystem & Retinalllluminance Exposure
Radiance simulations generated vertical illuminance levels with an accuracy of 90% - IJ 0 % and specific vertic al i lluminance levels on workstations with an inaccuracy of 85% - I I 5%. Accompanyi ng 95% confidence intervals are 93%- I 07 % for general vertical illuminance and 96%- I 03% for the specific vertical illuminance levels . Simulating a daily sequence in Radiance provided a 95% confidence interval regarding vertical illuminance levels of 6 I% - 135%. These results were obtained by simulating the windows as souree of daylight, using recorded illuminance levels at the window as input. Fine tuning the simulated scene regarding this input optimizes results and increases the reliability of the simulation. However these findings confirm earlierresearch validating Radiance [Larsson et al. 1997]. Conclusions regarding speetral distri bution based on data retrieved by the Lightwatcher are:
• As the distance between the subject and the souree of daylight (usually a window) decreases, the contribution of shortwavelength light (M65 nm) increases;
• The contribution of shortwavelength light is larger in case of measurements directed straight at the souree of daylight;
• The distribution of longwavelength light is 1ess dependant of position and viewing direction in comparison to shortwavelength light;
In all three testcases distribution of shortwavelengtb light (À465 nm) is related to the vertical illuminance level. These statistica! relations are interpreted as exceptional strong, with r-values of respectively 0.96; 0.99 and 0.99 the linear relation between both variables is strongly confirmed. This indicates that shortwavelength light contribution at any given point can be calculated based on vertical illuminance levels. Data on speetral distribution at a certain position is necessary however.
14.2 Discussion A statistica) relation between illuminance level at eye- and wrist level is previously established by Iwata [Jwata 2005]. Iwata interpreted the statistica! power of the relation between these two variables as strong. Conditions under which this relation is established are unknown therefore fUither analysis is not possible. However the differences between the previously established relation and the relation established in this research lead to considerate doubts. Both statistica! models analyzed in this research are based on data containing mostly samples of relatively Jow illuminance values. Relations between eye- and wrist and eye- and chest therefore can be applied in case of measurements under low illuminance levels (<200 lx). In case of light therapy illuminance levels often are at least 1000 lx , indicating the relations should be researched seperately forthese higher illuminance levels.
Certain relevant aspects regarding the measurement of vertical i I luminanee at eye level areleftout of this research. Both determined algorithms are basedon a data-set concerning all recorded samples causing the algorithms to underestimate the vertical illuminance at eye level. Analysis shows that data divided into i! luminanee intervals, and determination of algorithms concurring with these intervals, should provide more reliable statistica! relations. Further more light only reaches the retina of subjects providing theeyes of the subject are open. Subjects sleepingor nodding off are exposed to less or no lighting at alL Both the actiwatch as wel! as the broche are unable to sense whether the eyes of the subject are open or closed. Some type of observation by the nursing staff is essential in order to provide reliable results. The difficulty in conve11ing recorded vertical illuminance to retina] iJiuminance (paragraph 4.3: retina! illuminance [Aries 2005]) also complicates accurate measurements as retina! illuminance depends on the distance and the size of the light source. A lso the poor control of environmental variables (temperature, noise, food and sleep) in field studies makes it practically impossible to accurately study the possible biologica] effects of light with the actiwatch or the proposed broche.
Radiance is a validated simulation tooi [Larson et al. 1997] generating reliable results regarding vertical illuminance levels. Data obtained by two days of measurements is used todetermine the reliability of Radiance regarding the simulation of vertical illuminance at eye level. Results show 95% confidence intervals of low i! luminanee similar to intervals of true values, however due to low high iJ luminanee sampling these confidence interval s are less reliable. Due to restrictions bound to the measurements conducted with the Lightwatcher results are based on little data. The analysis of the relations between vertical iJ luminanee levels and contributions of shortwavelength light provided exceptionally correlations. These must be taken with caution due to the low sample count. Weather conditions at times of measurements in all three testcases were equal, however only in the first testcase electrical lighting was used. Thi s possibly influenced the retrieved data.
Master's Thesis 75

Assessment Circadian System & Retinalllluminance Exposure
14.3 Recommendations Based on the conclusions and discussion the following recommendations are gi ven:
• FUJther investigation on the relation between eye- and chest level, including more samples of high illuminance levels, to establish a separate algorithm applicable in case of light therapy. It is highly advized to generale separate algorithms for different illuminance intervals, especially in measurements under controlled conditions;
• Further research on the applicability of broche sensors in case of Alzheimer patients is considered necesarry. At this moment it is unknown whether the broches are accepted by the subjects and whether data can be retrieved without interference of the subjects. Testing with pi acebos placed on the chest of monitored subjects could provide useful information. Engineering and development of a unit smal! enough to be manufactured into a esthetica! acceptable broche, and big enough to house all necessary photodiodes, filters and accessories is imperative in order to successfully apply the unit;
• Although all three testcases provided exceptionally strong correlations between vertical illuminance levels and shmtwavelength light distribution, fu1iher investigation is necessary to confirm these findings due to the smal! amount of samples this assumption is based on;
• Radiance is tested on its ability to generate vertical illuminance at eye levelbasedon data input retrieved from photodiodes positioned at the windows. Results are highly accurate upto a certain level, but is only one testcase is analyzed during this research. Further investigation on this particular simulation technique is recommended.
• Ignored in this research is tracking and recording the whereabouts of the subject. Technology is capable of achieving this without disturbing the subjects' daily routine, however research in relation to this particular task must be further investigated. Observation is also a critica! part in this study. Technology is, to the knowledge of undersigned, unable to provide information about the eyes of the subject, whether they are open or cJosed. Therefore observation techniques and necessities regarding research on the circadian system should be further investigated;
Master's Thesis 76

15
Assessment Circadian System & Retina! Illuminance Exposure
References
Aries M.B.C.; Human Lighting Demands, Healthy Lighting in an offïce Environment; Technische Universiteit Eindhoven; (2005).
2 Baumel M.J., Maislin G., Pack A.I.; Population and occupational screening for obstructive sleep apnea: are we there yet?; Am J Respir Crit Care Med 155( 1997), 9-14.
3 Berson D.M., Dunn F.A., Takao M.; Phototransduction by retina] ganglion cells that set the circadian doek. Science 295(2002); I 0.
4 Bierman A, Klein T.R., Rea M.S.; The Daysimeter: a device for measuring optica] radiation as a stimulus for the human circadian system; Meas. Sci. Techno!. (2005)16, 2292-2299.
5 Brainard G.C., Rollag M.D., Hanifïn J.P.; Photic regulation of melatonin in humans: Ocular and neural signa! transduction; Joumal of Biologica] Rhythms, 12( 1997); 537-546.
6 Brainard G.C., Hanifin J.P., Greeson J.M., Byrne B., Glickman G., Gerner E., Rollag M.D.; Action spectrum tor melatonin regulation in hu mans: evidence fora novel circadian photoreceptor. J. Neurosci. 21 (200 l ); 6405-6412.
7 Brainard G.C., Hanifin J .P.; The effects of light on human health and behavior: relevanee to architecturallighting; CIE Symposium '04 (2004 ), 2-16.
8 Cagnacci A., Elliott J.A., Yen S.S.C.; Melatonin: a major regulator of the circadian rhythm of core temperature in hu mans; J. Cl in. Endocrinol. Metabol. 75(1 992)2, 75-77.
9 Charman W.N.; Age, Jens transmittance, and the possible effects of light on melatonin suppression. Ophthal. Physiol. Opt., 23(2003); 181-187.
I 0 Dijk D.-J ., Duffy J .F., Czeisler C.A.; Con tribution of circadian physiology and sleep homeostas is to agerelated changes in human sleep; Chronobiol. Int. 17(2000), 285-311.
ll Eloholma M., Ketomäki J., Halonen L.; Luminances and visibility in road lighting- conditions, measurements and analysis. Report 30. Helsinki University of Technology, Lighting Laboratory; (2004); 27 p.
12 Gaddy J.R., Rollag M.D., Brainard G.C.; Pupil size regulation of threshold of light-induced melatonin suppression. J Clin Endocrinol Metab 77(1993); 1398-1401.
13 Girardin J., D.F. Kripke, R.J. Cole, J.D. Assmus, R.D. Langer; Sleep deLeetion with an accelerometer actigraph: comparisons with polysomnography; Psysiology & Behaviour 72(200 l )1/2, 21-28.
14 Harper D.G., Stopa E.G., McKee A.C., Satlin A., Fish D., Volicer L.; Dementia severity and Lewy bodies affect circadian rhythms in Alzheimer disease; Neurobiology of Aging 25(2004), 771-781.
15 lrwin M., GilJin J.C.; The neuroimmunology of normal and disturbed sleep; J. Sleep Res. 7( 1998) (S2), 126.
Master's Thesis 77

Assessment Circadimt System & Retinalllluminance Exposure
16 I wat aT.; The regression equation descrihing the rel at ion between illuminance at wrist and eye level; Dept. Of Architecture, Tokai University Japan; (2005).
17 Jensen E., Dehlin 0 .. Hagberg B., Samuelsson G., Svensson T.; lnsomnia in an 80-year-old population: relationship to medica!, psychological and social factors; J. Sleep Res. 7( J 998), J 83± 189.
J 8 Kittier R., Darula S., Perez R.; A set of standard skies; Polygrafia SAV Bratislava (J 998).
19 Kolb H., Fernandez E., Nelson R.; Webvision. Gross Anatomy of the Eye. (2006).
20 Kripke D.F., J. Girardin, W.J. Mason, J.A. Ellioll, S.D. Youngstedt; Sleep estimation from wrist movement quantified by different actigraphic modalities; Journal of Neuroscience Methods I 05(200 I )2 , 185-191.
21 Kushida C.A., Chang A., Gadkary C., Guilleminault C., Carrillo 0., Dement W.C.; Comparsion of actigraphic, polysomnorgraphy, and subjeelive assessment of sleep parameters in sleep-disordered patients; Sleep Medicine 2(2001); 389-396.
22 Larson G.W., Shakespeare R.; Rendering with Radiance: the art and science of lighting visualisation; Morgan Kaufmann Publishers, San Francisco; ( 1997).
23 Lewy A.J ., Sack R.L.; The dim light melatonin onset as a marker for circadian phase position; Chronobiol. Int. 6(1989)1, 93-102.
24 Lucas R.J ., Foster R.G., Hankins M.W., Barnard A.R.; Melanopsin, photosensitive retina! ganglion cells and nonimage forming responses to light; CIE Symposium '04 (2004), 21-26.
25 MardaUevic J .; Sky Models for Lighting Simulation, PhD Thesis; (2000).
26 Meijer J .H., Rusak B., Ganshirt G.; The relation between light-induced discharge in the suprachiasmatic nucleus and phase shifts of hamster circadian rhythms. Brain Res. 598(1992); 257-263.
27 Mishima, K., Okawa, M., Hishikawa, Y., Hozumi, S., Hori, H., Takahashi, K.; Morning bright light therapy forsleep and behavior disorders in elderly patients with dementia; Acta Psychiatr. Scand. 89( J 994), I ±7.
28 Nilsson, T.H.; Incident photometry: specifying stimuli for vision and light detectors; Applied Opties, vol.22 no.21 ( 1983); 3457 -3464.
29 Perez R., Seals R., Michalsky J.; All-weather model for sky luminanee distribution, preliminary configuration and val idation; Sol ar Energy, vol.50( J 993); 235-245.
30 Phipps-Nelson J., Redman J.R., Dijk D-J., Rajaratnam S.M.W.; Daytime exposure to bright light, as compared to dimlight, deercases sleepiness and improves psychomotor vigilance performance; Sleep 26(2003); 1-6.
31 Purves D., Fitzpatrick D., Augustine G.J., Katz L.C., Lawrence C., LaMantia A.S., McNamara J.O., Mark W.S .; Neuroscience 2nd edition Sunderland Sinauer Associates, lnc.; (200 I)
32 Rea M.S., Figueiro M.G., Bu!Jough J .D., Bierman A.; A model of phototransduction by the human circadian system. Brain Res Brain Res Rev. 50(2005); 213-228.
33 Saper C.B. , Lu J ., Chou T.C., Goolet J. ; The hypothalamic integrator for circadian rhythms. Trends Neurosci. 28(2005); 52-157 .
34 Severine J ., Me Kenzie N.E.; Ad vances in temperature monitoring; Nursing ( 1997)27.
Master's Thesis 78

Assessment Circadian System & Retina I Illuminance Exposure
35 Sheedy J.E., Gowrisankaran S., Hayes J.R. ; Blink rate decreases with eyelid squint, Optomel. Vis. Sci. 82(2005); 905-911.
36 Teikari P.; Circadian field photometry; Helsinki University of Technology; (2006).
37 Teresi J ., Lawton M .P., Ory M ., Holmes D.; Measurement issues in chronic care populations: dementia special care; Alzheimer Dis. Assoc. Disord . 8(1994) (Suppl. I), Sl44-S 183.
38 Thapan K., Arend! J ., Skene D.J .; An action spectrum for melatonin suppression: evidence fora navel non-rod , noncone photoreceptor system in hu mans . J. Physiol. 535(200 I); 261-267.
39 Uchida K., Okamoto N., Ohara K., Morita Y.; Daily rhythm of serum melatonin in patients with dementia of the degenerate type; Brain Res. 717(1996), 154-159.
40 Uchimura N., Hirano T., Mukai M., Sakamoto T., Nakazawa Y.; lnsomnia in the aged. In: Meier-Ewert, K., Okawa, M . (Eds.). Sleep±Wake Disorders. Plenum Press, New York, (1998) 79-90.
41 Van Cauter E., Plat L., Leproult R., Copinschi G.; Alterations of circadian rhythmicity and sleep in aging: endocrine consequences; Horm. Res. 49(1 998), 147 J 52.
42 Van Someren E.J.W., Kessler A., Mirmiran M., Swaab D.F.; Indirect bright light improves circadian rest-activity rhythm disturbances in demented patients; Biol. Psychiatry 4 I ( 1997), 955±963.
43 Van Someren E.J .W.; Circadian and sleep disturbances in the elderly; Experimental Gerontology 35(2000)9-1 0, 1229-1237
44 Weale R.A.; A Biography of the Eye- Deve.lopment, Growth, Age, HK Lew is & Co., London. ( 1982).
45 Wyszecki, G., Stiles, W.S.; Color Science: Concepts and Methods, Quantitative Data and Formulae; 2nd ed., New York: Wiley-loterscience; ( 1982).
46 Zeitzer J .M., Dijk D.J., Kronauer R., Brown E., Czeisler C.; Sensitivity of the human circadian pacemaker to nocturnallight: melatonin phase resetting and suppression. J Physiol. 526(2000); 695-702.
Master's Thesis 79

Assessment Circadian System & Retina! Illuminance Exposure
16 Symbols, abbreviations & formulas
16.1 Symbols & abbreviations
CIE CRH CSINAPS DMH dSPZ ECG EEG EMG EOG EPT JET ipRGC
a s2
~(I ~I
A Ar dcyc E,"111 E.,:114 Ecal Ec Ec e, EJX!inal
Even ie al
Ew E)~i.J Iw;s
Commission Internationale de l 'Éclairage corticotropin-releasing hormone circadian sleep inventory for normal and pathological states dorsomedial hypothalamic nucleus dorsal subparaventricular zone electrocardiogram electroencephalogram electromyogram electrooculogram clectronic predictive thermometer infrared ear thermometer intrinsically photosensitive retina! ganglion eelt
angular subtense of the souree varianee intereepi regression model slope regression model
pupil diameter (near-axial path) pupil area diameter of the hu man eye (=22.6mm) iJl u minanee actiwatch number 313 illuminancc actiwatch number 314 calibrated illuminance illuminance at chest level illuminance at eye level Troland value retina! illuminance vertical illuminance iJ luminanee at wristlevel speetral irradiance of the souree at the cornea irradiance shortwavelength (M65 nm)
[0)
[ -) [ -) [ -)
[!Jm) [mm2) [mm] [lux] [lux] [lux] [lux) [lux) [td) [lux] [lux] [lux] [W/m2/nm] [mW I m2.nm]
Master's Thesis
IR LGN MIGT MPO mRGC NIF PSG PTFE RED RHT SCN uv vSPZ
t
),
)'-'Tll<JX
L~ccne n R
s{Î.)
SJlldX
sk
TCo.J TL0.J
Yo.l Y'o.l Y1oo> Ymc-.(1)
infra red lateral geniculate nucleus mercury-in-glass thermometer media! preoptie region melanopsin-containing retina! ganglion cells non-image forming polysomnography poly-tetra-f1uor-etheen Retina! Exposure Detector reti no-hypotbalamic tt·act suprachiasmatic nucleus ultra violet ventral subparaventricular zone
random error wavelenght peak wavelenght
scene luminanee number of samples effective irradiance at the retina coeftïcient of determination melatonin action spectrum peak photo sensitivity speetral photo sensitivity transmission of the cornea (near-axial path) transmission of the lens (near-axial path) speetral sensitivity curve for photopic vision rod speetral efficiency function photopic speetral sensitivity mesopic scectral sensitivity
[ -) fnm] [nm]
[cd/m2) [-) [W/m2/nm] l-l [ -) [A.W--1) [A/W) [ -) [-) [nm] [nm) [nm] [nm]
80

Assessment Circadian System & Retinalllluminance Exposure
16.2 Formulas & composed algorithms
{ I } The relative efficiency of light for suppression of melatonin with regard to the age:
R= E)._(A.) = Tc{À.) = TL(A) = A= S(A.) =
effective irradiance at the retina speetral irradiance of the souree at the cornea transmission of the cornea (near-axial path) transmission of the lens (near-axial path) pupil diameter (near-axial path) melatonin action spectrum
[W/m2/nm] [W/m2/nm] [ -) [ -) [!Jm) [ -)
{2} The (conventional) retina] illuminance when a surface with luminanee of one candela per square meter is viewed through a pupil at the eye with an area of one square millimeter:
er = Lscene • Ap
e, = Troland value L soene = scene luminanee Ar= pupil area
{ 3} Troland va lues are related to i! luminanee at the retina by the following function:
1 EreLinal = e{ • ~
eye
E.-ctinal = retinal illuminance e, = Troland value dcyc = diameter of the human eye (=22.6mm)
{ 4} The relation between illuminance at wrist- and eye level, according to Iwata:
Jog Ee = 0,658 + 0,6854 .]og Ew
Ee = ~,. =
r= n=
illuminance at eye level i! luminanee at wrist level coefficient of determination number of samples
= 0,82 = 28055
[td) [cd/m2)
[mm2]
[I x] [td] [mm]
[I x) [I x] [ -) [ -)
{5} The relation between the illuminance recorded by actiwatch 314 and the calibrated illuminance:
Jog Ec =- 0,602 + 1,138 ·log EaJJ4
E. = calibrated i! luminanee E,.;3 14 = illuminance actiwatch number 314
[I x) [I x)
{ 6} The relation between the illuminance recorded by actiwatch 313 and the calibrated illuminance:
log Ec =- 0,535 + 1,093 ·log Ea;JIJ
E_. = calibrated illuminance Ea::m = illuminance actiwatch number 313
Master's Thesis
[I x) [I x)
81

Assessment Circadian System & Retina I Illuminance Exposure
{ 7} The relation between illuminance at wrist- and eye level, according to this research:
logEe= 0,813 +0,614 ·logEw
E. = Ew= r=
n =
i I luminanee at eye level illuminance at wrist level coefficient of determination number of samples
=0,64 = 19456
{ 8} The relation between iJlominanee at chest- and eye level, according to this research:
logEe= 0,821 + 0,511·logEc
E c = E. = r= D=
illuminance at eye level illuminance at chest level coefficient of determination number of samples
= 0,76 = 20523
[I x) [I x)
[-J [-J
[I x)
[I x) [-J [-J
{9} The relation between vertical i I luminanee level and shortwavelenght contri bution is (testcase I):
h465 = 1,821 + 0,015 • Evertical
h465 = irradiance shortwavelength (À465 nm) Evcrtical = venical i! luminanee r = coefficient of determination n = numher of samples
= 0,96 = 12
lmW I m2.nm) [I x)
l-J [ -)
{I 0} The rel a ti on between vertical illuminance leveland sh01twaveJenght contri bution is (testcase ll):
h465 = 2,025 + 0,015 • Evenical
h4fi5 = irradiance shortwavelength (À465 nm) E vcnical = vertical illuminance r = coefficient of determination n = number of samples
=0,99 =7
[mW I m2.nm) [I x) [-J [-J
{ 11 } The relation between vettical iJlominanee level and sh01twavelenght contribution is (testcase III):
1A65 = 3,828 + 0,011• Evertical
Master's Thesis
h465 = irradiance shortwavelength (À465 nm) Evcnical = vertical illuminance r = coefficient of determination n= number of samples
= 0,99 = J J
[mW I m2 .nm) [I x)
[-J [-J
82

Assessment Circadian System & Retina! Illuminance Exposure
Appendix A: Figures & Tables
Figure A_Fl: schematic and photo of the prototype Daysimeter {Bierman et al. 2005]. The photopic sensor is a Hamamatsu S/223-01 silicon photodiode in a herme/ie package. lts relative/y large area of 13 mm2 provide a bare cel/ sensitivity of 0.13 JtA per lx for CJE llluminant A {Rea 2000]. A multi-element subtractive glass filter matches the silicon cel/ response to the photopic luminous efficiency function.. An opa/ glass diffuser mounted to the front of the detector modifles the spatial characteristics of the sensor to be lambertian, mimicking the eye's spatial response as reported in Van Derlofske et al. The cel/, filter and diffuser stack are mmmled in a thin.-wa/1 brass tube to provide mechanica/ proteet ion, electrical shielding and a way to mountthe detector to the printed circuit board by soldering. The photoce/1/fi/ter/diffuser combination has a responsivity of 450 pA per /x ( enelosure Bi). The b/ue sensor is a Hamamatsu G /962 GaP photodiode. ft responds only to light of wavelenghts short er than 570 nm with a peak sensitivity at 470 nm. The sharp long-wavelenght cutoff is generateel by the bandgap cutoff of the sensor's photodiode material. To limit unwanted UV sensilivity of the b/ue sensor and provide the proper sh.ortwavelenght cutoff. a colared glass filter was used (Schol! Glass CG 19). The notch in the blue response at approximate/y 440 nm is the resu/t of cm added gel filter (Roscolux #08, Pa/e Gold) chosen to fine-tune the match to the circadian action spetrum from Rea et al. A photocell with an active area of 5.2 mm2 was clwsen to maximiz.e sensitivity while keeping the detector package smal/. As with the photopic sensor. the blue sensor inc01porates an opal glass diffuserand is similar/y in a brass tube. The sensor assembly has a peak responsivity of 60 nA per walt m-2 ( enelosure B2). The two sensors provide current outputs, which are converteel to voltages using a standOI-d transimpedance amplifier. A Texas Instrument OPA2349 dual amplifier was chosenfor low power demand and rail-to-rail operation. A significant cha/Lenge of the design was that light levels can vary from more 100.000 lx in direct sunlight to /ess than 1 /x at night. Given the wide range of light levels to be measured, it was necessary to incorporate some type of automatic gain selection in the amplifier circuit to provide th.e desired linear response. The automatic gain selection function is accomplished by switching between ine of Jive feedback resistor combinations. Th is is clone by switchin.g resistors in parallel with the most sensitive range resistor using a 4-channe/ complementary metal-oxidesemiconductor (CMOS) analog multiplexer. The range selection is under microprocessor con/rol. The gain resistors have va/ues of 108, 107, 106, 105 and /04 ohms. The parallel combination resu/ts in resistance values that are nol exact powers of ten: a configuration file for the processor compensates for this effect. The positive input of the amplifier is biased at 1.2V and limited to approximately 1 volt below the positive supply rail to reduce leakage current associated with the CMOS switch: thus, the amplifier can swing from 1.2V to approximately 2.3V. This, combined with a 1 2-bit ana/og-to-digital converter (ADC) integrated with the processor, provides for a step siz.e of 0.008 nA on the most sensitive se ale .. mui 0.08 11A on the least sensitive sca/e. The Juli scale ranges are 21 nA Juli se ale and 210 11A Juli scale, respectively. These values correspond to a photopic illumin.ance resolution of 0.0/8 lx and afu/1 scale maximum of 467.000 /x. The two sensors are mmmteel side by side at the end of a printed cirduit board. This ereales a compact, in-fine package that rests on the side of a subjeet 's head and p/aces the dijjusers roughly atthe same plane as the subjeet's cornea {Bierman et al. 2005].
Master's Thesis 83

Assessment Circadian System & Retina! Illuminance Exposure
Figure A_F2: equipment used to establish relation between il/uminance levels eye an.d wrist (table A_Tl ). On the left the actiwatch and a reader, on the risht rhe actiwatchsoftware used to analvze the data.
Figure A_F3: Ulbricht sphere operation diagram on the leftand the sphere itself Th e actiwatch has been extensively validaled for use in different applications ( enelosure B3 ). ft has also been validaled against polvsomnography the 'gold standard' jor use in sleep studies. However when used to record illuminance levels it is also cctlibrated using the Ulbricht sphere, a white globe that is used to measure illuminance levels of various light sources. ldeally calibration data provides a calibrationjactor, values derived from measurements are multiplied with this constant Jactor resulting in data th.at is used for analysis. However in this case such a factor could nol be derived due to extensive variation an.d a large range in these calibrationfactors ( table A_T2). Therefore analysis through SPSS provides calibration algorithms for bath actiwatches, which are used for data analysis.
Model Summary and Parameter Estimates
The independenl variabie is log_E.
Model Summary and Parameter Estimates
Figure A_F4: linear regression modeland parameters obtain.ed through SPSS, regarding actiwatch 313 (below) a nel 314 (above).
Master's Thesis 84

Assessment Circadian System & Retina) llluminance Exposure
log_E
0
2.000
log_W
Model Description
Model Name
Dependent Variabie
Equalion
Independent Variabie
Constant
Variabie Whose Values Label Observalions in Plots
Case Processing Summary
N Total Cases 19546
Excluded Cases • 0 Forecasted Cases 0 Newty Created Cases 0
a. Cases wrth a missing value in any variabie are excluded trom the analysis.
Variabie Processing Summary
MOD_1
log_E
Linear
log_W
lncluded
Unspecified
Variables
5.000
Dependent Independent
loq_ E loq_W Number of Positive Values
19546 19546
Number of Zeros 0 0
Number of Negative Values 0 0
Number of Missing User-Missing 0 0 Va lues System-Missing 0 0
Model Summary and Parameter Estimates
The independent variabie is log_ W.
0 Obse.ved -Unear
Figure A_F5: SPSS da/a ourput for rhe firsr objective and a scal/erplot derived from sojrware SPSS. ft shows the regressionfine [or the firsl objective.
Master's Thesis 85

Assessment Circadian System & Retinal Illuminance Exposure
log_E
1.000 2.000
Model Name
Dependent Variabie
Equation
Independent Variabie
Constant
3,000
log_C
Model Description
Variabie Whose Values Label Observations in Plots
Case Processing Summary
N Total Cases 20523 Excluded Cases a 0 Forecasted Cases 0 Newty Created Cases 0
a. Cases Wlth a mrssing value on any variabie are excluded from the analysis.
Variabie Processing Summary
4,000
MOO_t
tog_E
Linear
tog_C
lncluded
Unspecified
Variables
5.000
Dependent Independent
log_ E log_ c Number of Positive Values
20523 20523
Number of Zeros 0 0 Number of Negative Vatues
0 0
Number of Missing User-Missing 0 0 Va lues System-Missing 0 0
Model Summary and Parameter Estimates
The independent variabie is log_C.
0 Obser!ed -lineaJ
Figure A_F6: SPSS data output and a scatterplot derived from software SP SS. ft shows the regressionfine for the first obiective.
Master's Thesis 86

Assessment Circadian System & Retinalllluminance Exposure
I I f l " ~ ,E:l ed fC;j (:
.... 0 ., ~ ... ., '> 7 .. 'o
j c '< " ·- ;. ' .. jo
; \>- .. ~ " ~·
~; A ... \,
~
~e . .
I ~ EJ r:J
I ... . .. . '• . . .. • • • • . '• .
.. • c • . · . ··-· ~ . ._. .. ·. . . '• b --;-, -c==J i ==- C"'" ~=c==a ~· C"'T ===-d
Figure A_F7: Above: raster used to delermille the general illuminance level of the staffroom. At each measurement point 9 values are recorded: horizontal illuminance level (1200m) and vertical illuminance level in 4 different directions ( 1200mm and 1600mm). On the right a Radiance rendering of the raster and measuremellt points. Under: rasters used to delermine the illuminance level of the two work stations. At each mensurement point 5 values are recorded: horizontal illuminance level ( !200m) and vertical illuminance level in 4 different directions ( 1200mm). On the leji and right Radiance renderings of the rasters and mensurement points.
·-11S':I l 'lQO ?Q(>' 200l zoo; 1'50
':--I. I I t
~ 6
. 6 A
~ .. • 6 " :. •. ' "'
.. .. • ~~ . ' Ie. c "' 0 ' 6 "' ~
D I!!
Figure A_F8: raster used to delermine the general illuminance level of the staffroom. At each mensurement point 5 values are recorded: horizontal illuminance level (1200m) and vertical illuminance level in 4 different directions ( 1200mm). On the right a Radiance rendering of the raster and mensurement points.
Master's Thesis 87

Assessment Circadian System & Retinal Illuminance Exposure
2550 J.W 1570 640
l -.if===3ll
~ I t{ t{ ÈÈ - ~ I 64 64 ti ;; •
~ i d d d ):1 § I--E tL11
11 1 u, lil c____Ji
"
A B c D
Figure A_F9: Above: raster used to delermine the general illuminance level of the staffroom. At each measurement point 5 values are recorded: horizontal illuminance level ( !200m) and vertical il/uminance level in 4 different directions ( !200mm). On the right a Radiance rendering of !he raster and measurement points. Under:rasters used to delermine the illuminance level of the two work stations. At each measurement point 5 values are recorded: horizontal illuminance level ( 1 200m) and vertical i I luminanee level in 4 different directions (}200mm). Onthe right a Radiance rendering o(the rasters and measurement points.
Sub;eci d~ (313+31.:) ~
"'- "' i A
-~ ~ c ~
~ Subject d!Odil (313•314)
B
Figure A_FJO: Set up measurements in testroom, determination ofilluminance levels.
Master's Thesis 88

Assessment Circadian System & Retinal llluminance Exposure
Tables
T bi A Tl a e : use d eqmpment f d or etermmatwn re atwn eye-wns I . . t
Purpose Device ID number Light registration Acliwatch (wrist) ID 314
Actiwatch (eye) ID 313 Data conversion Actiwatch reader ID 668 Illuminance meter Hagner E2 1D 759 Data logger Grant 1200 series ID 396
T bi A T2 J"b . f a e :ca 1 ratwn actors f h or t e actlwatc 1es an d I d" d p110t0 10 e Cal. meter [lx] log Cal[-] Sensor (lx] Actiwatch 314 [lx] Log A 314 [·] Actiwatch 313 [lx] Log A 313 [·]
0 0 6 0 0 0 0 20 1.30 25 43.1 1.63 47.1 1.67 50 1.70 54 104.0 2.02 100.5 2.00 74 1.87 78 152.4 2.18 152.9 2.18 100 2.00 102 206.5 2.31 225.9 2.35 201 2.30 194 384.1 2.58 481.2 2.68 305 2.48 294 540.2 2.73 559.4 2.75 399 2.60 382 650.1 2.81 762.3 2.88 498 2.70 478 821.1 2.91 955.8 2.98 602 2.78 561 956.3 2.98 1123.2 3.05 695 2.84 647 1043.1 3.02 1240.8 3.09 796 2.90 734 1197.7 3.08 1420.9 3.15 907 2.96 842 1365.8 3.14 1652.3 3.22 1000 3.00 912 1401.1 3.15 1694.3 3.23 I 195 3.08 I 113 1625.7 3.21 1910.6 3.28 1507 3.18 1396 1962.4 3.29 2097.2 3.32
Master's Thesis 89

Assessment Circadian System & Retinalllluminance Exposure
T bi A T3 I k a e : og ept d urmg measuremen s WI ac 1watc "th r h . ·r es; activi Jes, wea th er con I IOilS an d w 1erea b outs 12-11-'07
Time Whereabouts Activities Weather Conditions
9:00- 9:30 livingroom ~~-~~~~~8-~~~~~-~~~~_<::~~:~------------------------------------------------------------------- clouded working on laptop(< 4 meters from window)
9:30- 10:00 livingroom working on laptop(< 4 meters from window) clouded
I 0:00- I 0:30 livingroom working on laptop(< 4 meters from window) clouded
10:30- 11 :00 livingroom working on laptop(< 4 meters from window) clouded
11:00- 11:30 livingroom working on laptop(< 4 meters from window) semi-clouded
11:30- 12:00 -----------~!::!.~~~~~-~!.~ ____________ ~-?-~~!_~_g_g_~--!~!~P_{"::_~_!.l~~!-~T.~.!.~~!~--~}-~-~-?.~1. ____________________________ clear sky kitchen and bathroom walking through the house, preparing lunch
] 2:00- 12:30 livingroom eating lunch and reading paper clear sky
12:30- 13:00 livingroom working on laptop(< 4 meters from window) sunny sky
13:00- 13:30 livingroom working on laptop(< 2 meters from window) sunny sky
13:30- 14:00 livingroom working on laptop(< 2 meters from window) sunny sky
14:00- 14:30 -----------~!;:_i_~-~~~~-1!_1 ____________ ~-~~~}_n_g __ ?_I1 __ !~.E~~PJ"::.~-~-~~-~T.~}~~~--~~-i_I_1_~-~~~L_ __________________________ sunny sky outside walking outside fora shortQ_eriod of time, walking the dog
14:30- J 5:00 livingroom working on laptop(< 2 meters from window) clear sky
J 5:00 - J 5:30 livingroom working on laptop(< 2 meters from window) sunny sky
15:30- 16:00 livingroom working on laptop(< 2 meters from window) sunny sky
16:00- 16:30 livingroom working on laptop(< 2 meters from window) clear sky
16:30- 17:00 outside walking the dog for halfan hour --------------~!!-~-~x_~_~x_ ______________ semi clouded
Master's Thesis 90

Assessment Circadian System & Retina! Illuminance Exposure
Table A T4: question and answers regarding new light registration equipment [I] In your expert opinion, is it possible to use head-mounted equipment for measuremenls in case of patients with Alzheimer's
disease? When palients wear glasses, is it possible to attach equipmenl on the frame of these glasses?
j. van Hoof in a pg-unit (dementia word of a nursing home) palienls are usual/yin a late stadium of dementia. Loose sensors are 1w1 recognized or conneeled to anything. Watches are recognized because patients always use to wear !hem. Something on the head wil/ be experienced as/ roublesome and patients wil/ try la re move it. Jf !he recording unit is very smal/ it can perhops be ploeed on the frame of Jhe glasses, providing il does nol have any wires or cab/es.
P. van Bekkum E. M0st
lW
lhis depends on I he s/ate of dementia of I he pat i ent. Classes are much beller Jhan someJhing on I he head, Jhis is advised af?ainsl. A device auached to Jhe f?lasses could be an oplion.
[2] In your expert opinion, is it possible fora patienl to wear an actiwatch fora certain period of urne, w1thout the actiwatch influencing the normal day-pauern of the patient?
J. van Hoof yes, for sure. Especially when patients we re used to wear a watch in the past. However il is importani/a make sure the acliwatch is secured 10 prevent patien/Sfrom removinf? !he watch or losinJ? it.
P. van Bekkum yes E. M0st I have got really good experiences with the actiwatch. Patienls wear !hem without any problems and really
don'! mind wearing them at all. The use of specially developed straps, straps the patient canna! open themselves, is stronf?l)' advised.
[3] WiJl patients experience the actiwatch as 1nconvenient and as aresult messwithit and intluence samples?
J. van Hoof that would be possible, especially with patienls who are nol used to wearing watches. This differs for each individua/ patient.
P. van Bekkum that would be possible. E. M0st no, with us this was not/he case.
[4] How wJll paticnts react to, for example a necklace in which sensors are manufactured'J
J. van Hoof a necklace would be nice for wamen, however palients can take il of, mess wilh iJ or lose il. Same of the patients are nol allowed 10 wear neektaces because of danger of sujfocatinf?.
P. van Bekkum depends on /he individual. E. M0st a necklace could work very wel/, the only risk is that patients wil/ nol want lo give it back because they wil/
think i! was theirs.
[5] How wiJl patients react to , for example a brooch in which sensors are manufactured?
J. van Hoof a brnoch is nice for wamen, men willthink it is st range, perhaps a bulton wil/ workfor men. ft is a very good salution because you will record the vertical illaminance and the sensors wiJl nol be covered by clothinf?.
P. van Bekkum wamen wi/1/ike it and men can possibly wear the sensors in a breast pocket. E. M0st a braoch could work very welf, !he only risk is that patients wil/ nol want to give it back because they will
think il was theirs. Men possibly won 'tlike it very much.
[6] Are there any other posilions on body or clothes possible to place sensors without inteffering with the daily rhythms of the patients?
J. van Hoof I don'! know bul I think the braoch coald work verv wel/. P. van Bekkum I don'! know. E. M0st the position ofthe braoch seems very good to me.
[7] Are there objects or accessories pat1ents wear all day long in which sensorscan be manufactured'J
J. van Hoof nol really, certainlv nol appropriatefor sensor placement. P. van Bekkum na
[8] na
Is it possible al all to attach or place objects containmg sensors on clothes or body of patients, without intluence or interfere with daily patterns of the paticnts?
j. van Hoof is possible, however on clothin!S is always beller than on the body. P. van Bekkum maybe E. M0st yes, the actiwatch doesn 't influence the pattem
[9] Regarding positions to place sensors, do you yourself have any ideas or suggestions?
J. van Hoof no P. van Bekkum 1W
E. M0st no
Master's Thesis 91

Assessment Circadian System & Retina! Illuminance Exposure
T bi A TS I k a e : og ept d "h unng measurements w1t achwatc 1es; achvlhes, weat h er con d"-1hons an d h w ere a b outs 14-03-'08
Time Whereabouts Activities Weather Conditions
9:00- 9:~0 livingroom ~~-~!:~~~g-~~~~-~~~~~~-t-~------------------------------------------------------------------- semi-clouded working on Japtop (> 4 meters from window)
9:~0- I 0:00 livingroom working on laptop (> 4 meters from window) semi-clouded
I 0:00 - I 0 : ~0 livingroom working on laptop (> 4 meters from window) semi-clouded
10:~0- 11 :00 livingroom working on laptop(> 4 meters from window) semi-clouded
11:00- I I :~0 livingroom working on laptop (> 4 meters from window) semi-clouded
11 :~0 - 12:00 kitchen and bathroom walking through the house, preparing lunch semi-c louded
12:00- 12:~0 livingroom eating lunch and reading paper semi -clouded
12:~0-1~:00 livingroom walking the dog for halfan hour semi-clouded
I ~:00- I ~:~0 livingroom working on Japtop (<~meters from window) semi-clouded
13:~0- 14:00 livingroom working on laptop(<~ meters from window) semi-clouded
14:00- 14:~0 livingroom working on Japtop (<~meters from window) semi-clouded
14:~0-15:00 livingroom working on laptop(<~ meters from window) semi-clouded
I 5:00- 15:~0 livingroom working on laptop(<~ meters from window) semi-clouded
15:30- 16:00 livingroom working on Japtop (<~meters from window) semi-clouded
16:00- I 6:~0 livingroom working on Japtop (< 3 meters from window) semi-clouded
16:30- 17:00 outside working on laptop(< 3 meters from window) semi-clouded
Master's Thesis 92

Assessment Circadian System & Retina! Illuminance Exposure
T bi A T6 a e I. f : genera m ormatwn regar d" mg measurements con d ucte d on t ree I erent ocatwns h d"ff
V ALlDATION Date 06-03-2008 Starting time- End time LUO- 17.00 Weather conditions clouded Artificiallighting Fagerhull Indulux: 6 x 3
Measurements General Workstation - Raster 2000 x 2000mm 500 x 500mm ~ Measurement points 44 15 00
Horizontal illuminance ~ ~ Height 1200mm 760mm -00 ~ Vertical illuminance
E-c Height l200mm & 1600mm 1200mm Direction East E;W; N;S
LIGHTWATCHER Date 08-05-2008 Starting time- End time 11.40- 16.00 Weather condilions clear, sunny Artificial lighting Fagerhult Indulux Narrow Beam: 6 x 3
V ALlDATION Date 06-05-2008 Starting time- End time 14.30- 17.00 Weather conditions clear, sunny Artificiallighting No artificiallighting
General measurements General - Raster 2000 x 2000mm - Measurement points ~ 19 00 Horizontal illuminance ~ ~ Height 1200mm & !600mm -00 Vertical illuminance ~
E-c Height 1200mm Direction East
LIGHTWATCHER Date 06-05-2008 Starting time- End time 14.20 - 16.20 Weather conditions clear, sunny Artificiallighting No artificiallighting
V ALlDATION Date 02-05-2008 Starting time -End time 12.00- 15.00 Weather conditions clear, sunny Artificial lighting No artificiallighting
General measurements General Workslation - Raster 2000 x 2000mm 250 x 250mm -- Mecmtrement points 20 15 ~ 00 Horizontal illuminance ~
Height 1200mm 760mm ~ -00 Vertical illuminance ~
E-c Height 1200mm 1200mm Direction East E;W;N;S
LIGHTWATCHER Date 02-05-2008 Starting time- End time 12.00-15.40 Weather conditions clear, sunny Artificial lighting No artificiallighting
Master's Thesis 93

Assessment Circadian System & Retinal llluminance Exposure
Appendix B: documentation on used equipment & photodiodes
[1] Harnamatso S1223-0l silicon photodiode:
Si PIN photodiode
51223 series For visible to IR, precision photometry
e Htg:'n sensiti"Jity e High rol abil ty
e Op~ic.al mEas..:;reme-ni E-qulpmE-.nt e Anstytic.iJ e--quipmE-nt. i-te.
e Hig'"1-SpEII?d respons-e S 1223: fc=3Cl MHz s 122~-01: fc=2'J Mf-iz
• Lew.· C3.JN;ci:ànc:e
• Gener:.~l ratings . .. .. Wlndctt.• ma!<>nal Package -Active area siZP. A Effech'll activ11 ar11a
• Absolute rnaxini.MTI ratings . , . ..
Rwers9 vellage VR~/ax. Power dissipstion p Uperating 19mp9rature Tor.r Sto181J9-'91110Qr8toc" Tsto
Master's Thesis
I
oorosllk3te c~ss -5
2.4. 2.6 3.6. 3.6 6.6 13
. I
30 100
-40 to +100 -5510.±125.
HAMAMATiil.l
mm nvn'
V mw ' C •c
94

2
• Dark curent vs. reverse voltage
" "" ~ ) - ' •a- _,.
~ "' !5 0
1l ~
''"' ,.,,.. 5~ -
~:lp.'. §!!!! f= f-'--'"" C.1
~1.:J3 u:::~ ·j1
,, RE\I'ERSf VOLT ~'G! (ll~
• DimensioMI outline (unit: mm)
hlw ~
."
Master's Thesis
Assessment Circadian System & Retina I Illuminance Exposure
Sl PIN photodlooe S1223 serles
• Photo sensitiv ty tempersture cheracteristic .-!.S.
,.,.,. (j
't
B ~.J
~ --c·.s
" .. I I
o;
F ~ I;!
~ ," 1cct
• Terminal capacil8nce vs. reverse "roll8ge
,. ... ., •• =.--· ......
~ "' ,.-~ l5
.. ) .. :I ei ...
"' RfV!RSE VOl TAG!:: (V)
95

Assessment Circadian System & Retinal Illuminance Exposure [2] Hamamatsu G1962 GaP photodiode:
GaP photodiode
G1961,G1962,G1963 Schottkytype
• Low dark currE>nt e High UV (I.Ein;rtivity
• Generat ratings I Absoll«e maximum ratings
<lilUlfl> • Analytirol instrulllQnts elNdE>t~"1ion
Dlnu15icmal Elia dM! Al>;olule maxomum raillus
oullh61 Adivearea ac.til..., Re .... .., Cçtuating Slorage Type No. Wn dow Pa:kage Sim area vultág6 tDmJ)auJI.urlf lomp .. aure
male riql VIl Max. Tqll l&lg
rrnrnl (mm'l lVI r c1 I ' CI G1961 (!YO • T0-18 1.1 • 1.1 1.0 G1962 ~0 10-5 2.3. 2.3 52 5 -1010 +60 -20 to •70 G1963 (J:iQ 10-8 4.6. 4.6 21
• Eleclrical and optical characterislics (Typ Ta:25 ·c unless otherwise noted)
Spodal Pei< Photo s.ounsfl.ivily
Sbct1 ci'ctiil lOfTil Rise !*'>e 1" NI s 0..1\< ~aft Shunt
r~ae 1-t..tr A.W'r arriOl! wrroot lt ~~ resl5t.anc.e al Cl NEP
Type No. llllg. ~!,Cl tso to
IO ~=OV
VR=OV Rsh
'· i<.p Hg 1000 f>· Max. ao R!.=1 kQ =10kHz
~=10mV
Ï.jJ ine ~Onm 254nm Mln. Typ. ._'JF{(Irr/. 't-IV M.-l. 'T yp.
tnm) ltnm) luA) luA' lilA) I IMI ._I C] lus) loF) iG!1 Gf:l'r (WiHZ" )· G1961 0.04 0.05 2.5 25 5 400 4 40 5.4 •10""' G1962 19l10 55:) 440 0.12 0.03 0.1 0.23 0.3 5 50 1.11 10 1500 2 20 7.6 •10"" G1963 0.75 0.9 10 100 :!) 5000 1 1 1.1 •10" • \t.'lr ldow maten al 0: qua-12 glass
MAMAMAT &U
Master's Thesis 96

Assessment Circadian System & Retina! Illuminance Exposure
GaP photocJioda G1961, G1962, G1963
• Speetral response
(•2 (T)p Ta o; ·q ~-
[ ç > i:: U)
ffi U)
0 .... 2 0..
0.16
0.1
0 .05
L/ 0 UlO
1\
V \ \
"' 600
WAVELENGTH (nm)
• Rise time vs. lood resistance
800
(l)p. Ta-2!1 ·.:. vi fjl:i~t
10mo
tms
~ 1•)(1
i= w lO ä: 1(1
100
~·
~"'
~··
".1~
Master's Thesis
I .MI IIV
/
V
lillil
1111111 lillil 1o' 10' " 1
LOAD REStSTANCE (0)
• Photo sensitivity temperature characteristic
(TYp) tUi.
~-
lt. !;: +-1.0
!!! (.}
iL
~ t0.6 (.}
w a: =-!;; / a: w 0.. :l; w ....
4o)O 600 eco
WAVELENGTH \nm)
• Darl< current vs. reverse voltage
REVERSE VQ. TAGE (V)
97

[3] Actiwatch Light:
Wrist wom lightweiglit sleep 11nd I!Ctivity monitor tor ambult:tory monitoring
Recording of ph)'Sictil sctivit)' by me<~ns clt>n öecelerometer
Recording of ambient light level b'; me<~ns of tl surf~:~ce mounted diode
Designed tor use with custom sleep &nd sctivity antdys~ softY~~"ttre
v.ith ~> resder for dtlt.ï tn.nsfer to 6
PC
Suit11ble tor use with sleep disorders & circ!ldl!ln rhythm studies
Vfllid8ted t~gt~inst polysomnogr&phy for use in sleep
All d!lt& storea in the softwbre IS
fully exportbble for <!n!i'l)'sis in 1:1 third ptorty progrttm
Master's Thesis
Assessment Circadian System & Retina! Illuminance Exposure
The Ac:tlw.tch Ulht is a wrist-mo unted device wtlich delects !lnd logs movement. lt ca·n the refore be used to meanure activi ty or tt.e absence of ït over time. it also meBsures and stores ex! ernal light intensity therefore ent:bling the effect of ligtlt intensity on circadian rh;1hms to be studied. The d.ata is stored In the watch and can be down)oaded to 1:1
PC tor analysis.
The AWL hes a built In sensor on tt.e ace of the watcl1 as shown in the picture.
In the Acti~i ty plots or Actogrttms the light level een be viewed witt' the ac U vity data or separately. A:tivity een be er.al ;·sed in ot h er ways using Period ogrBms, FFT plots o r on·PiH&met r ic Circadian Rhy t h m Anai~'Sis.
The Scti\•itf plots coupled with spec· Jised softwere serve ! o a n alyse sleep-we !I e pt~tterns,
sleep eff iciency fl!l d sleep i agrnentation which give a 1 i n dic~:~tion of overBil sleep quttfit)·.
Veildation The A.ctiwatch hes been extensivel;• val.idated tor us e in ditiere n t applîcatioJ . lt has also been validllted ag;;inst polysomnogr~:~phy the 'gold standard' for use in sleep studies.<
A tuil bibliogra phl/' of published papers using the Actiwlrtch is tWilll&b!e on our wel:ls ite.
ActiwBtl:h Applications The Activ.'atch is in e in t lie f ields of physicel actrvity monitoring, sleep, respiratory medicine, paed latrics, psychi&try, t.eelth psyct·,ology, p111 • Alzt,eimer s & Parkinsor•'s rese<HCh, ger i atrie medicine, derm.:ltology end urology.
Technlcel Speclftcetlon
Weiglit Batter:; life:
AWL
Battery ty-pe: Mei'TlO!j~
17 grams 180dii)S CR2025
64KB Sph;sh-proof: Yes Warrtonty: 2 )'eers Size îmm): 37x291<10 Epoch Rbrlie: 15s-15min Light: 1-32.000 L~.:x Ree time:" 22d1'1)'5
PC A"'>'ysis: Wr~ 2000/XP ::..: 1 MÏI" E'J)'CI1
BIJiiaOBI'r! 1-c, a.rc 11, IOidMy c, ~ C,CinilloO,
~w.
Corrtpsrison Gf a : : grd f.flr i O-,
pci)!aT~IilliC. a~ ~'E=t 'o'e
at!:~ oi sle pililrr~ter:;:
1., ste<>J>-:iso-ae ... :i ~
SleE~>~ : (2001) ~396
&.&nfor... ~ersit,•' Getttef of
E.'t:leH~.w? fOf -ep ~
S:~r= S~ 'OiSOrt$H~ Clirl!t:.
401 Çt.l ~a.--ry KOI!.d, SUitë SS:.!.
~CA~30\JSA
Epochl._. 2eec &eec 1018C
Recor<lingt n; 18 hours G5 ·.ours 3.5da;'!l
Epochl._. 16eec 30eec 1mln
REo::lra.ngtr'T'If 5.5 days 11 deys 22dfl) S
Cambrkt&& NèUroteohnOI~ Ltd. Upper Pendrill Court, Ermine Srreet Nortl ,, Papwortil E•·er&rd, Cambridge UK
T · +44 !0)1480 831223 Fax: +44 10)1480 831733 Erm>ikad mir.@camnted, ,co.uk wwvr.Cfl<-nntecll.CO.I.Ik
•
98

A ... ,.,. .. _
~c ..,....," ...... at' ..u.
Assessment Circadian System & Retina! Illuminance Exposure
~ ..... ::::~:: :.t~·nr:lfll'-·
-~~ .. ~~::;,:,;::,.",.::-, ==. •• :~ .. "..-..... "1""'!,.--•• ~, r:: •. =. ==,:::;,;::.,:::_ == .. "'.,"!'.-.......... .
·--·1 I
.......... .... , b J .. ~~ ... J.i . .JLI.i~~t.o..J..l
.. ~lL&.ioiL~I,,. __ .u .. ,~L ••..• L,J ........ h~
•··-- .
• ..• d. Jlij,, -M'NL !. ui" J ~ . ,.u,d.JJ,,, j •• J
,, Ao l y,.,,,J,,,JJJ,l ~...J ... ll• .A• , ,~~ •••••• . l. .• Lt.Jk,a.J.W ........ Wu~
......... ..
...•. J&
ld11nlll• .....
1 181 .,!! Tl. AJ .. 4 1 ft I~J ,,.1 .... ...
"ormal.-\rrocrua Plor 111.miac mir)· ln•l inl:rltdr. md llpl
Ji.ftla ia r•Ucm·.
1 ________ -n... __ n_'"""~'"~'-• .. t 7 __ _,_ ~""!~d-1~''!7.
lliw-. .. ~.~ rff••~ ., . 2bG IÎI/~
Dl lt
11~ MIJl ., ."
". ... _:;;~~·-·-·--
Master's Thesis
. o\mbitDIJi:chrll'\·tl ;, 'bO\HI in Lax .• -\ rtftrtD<t ltnl ron b. ,., '' ebom~. Timt abo•·~ Ir ran lbtn b. autly•Ad.
·--·---... , ...
99

Assessment Circadian System & Retinal Illuminance Exposure [4] Radiance:
1.:.! \ Vh t i" JlA D l AN
10 "" try
f ocanv
J ' I
ad ng "'llt!J
Master's Thesis 100

Assessment Circadian System & Retina! lilominanee Exposure
Dankwoord Een heel jaar lang heb ik me met het onderwerp licht en gezondheid bezig gehouden. Dit vruchtbare jaar heeft na veel onderzoeken, meten en studeren de afstudeerscriptie zoals die voor u ligt opgeleverd. Tijdens het afgelopen jaar ben ik door vele mensen bijgestaan en geholpen, vandaar dit dankwoord.
Vaste begeleidster van het afgelopen jaar Mariëlle Aarts in het bijzonder bedankt. Haar wekelijkse begeleiding, toe- en inzicht hebben aan de basis gelegen van deze scriptie. Met vragen en opmerkjngen kon ik altijd bij haar terecht, haar kennis en knowhow hebben een belangrijke bijdrage geleverd tijdens mijn afstudeerperiode. Bedankt!
Graag wil ik de leden van mijn afstudeercommissie bedanken voor hun kennis en begeleiding tijdens mijn afstudeerperiode. Martin de Wit die tijdens bijeenkomsten zijn vakkundige licht liet schijnen over dit onderwerp en vaak met prima aanwijzingen mij verder op weg hielp. Jan Diepens, die niet alleen in de commissie erg welkom was maar die mij zeker ook in het lab tot grote ondersteuning is geweest. Vaak heeft bij in het lab naar apparatuur en sensoren gezocht, en hij wist altijd de juiste instrumenten voor me klaar te zetten . Als derde in mijn afstudeercommissie Martine Knoop, die als laatste toe is getreden om mijn afstudeerscriptie te beoordelen. Ook Toine Schoutens bedankt voor het luisterend oor en de hulp bij de metingen in verzorgingstehuis St. Franciscus.
Ook bedank ik de mannen van het lab die mij het afgelopen jaar bijgestaan hebben. Met name Wout van Bommel die menig apparaat weer aan de praat kreeg en met zijn begeleiding een belangrijke bijdrage aan de metingen geleverd heeft. De dames van het secretariaat wil ik bedanken voor de afspraken en bijeenkomsten die zij voor mij ingepland hebben in de drukke agenda's van de commissieleden.
Ook personen buiten de Technische Universiteit die het afgelopen jaar geholpen hebben wil ik bij deze bedanken. Verplegend personeel van verzorgingstehuis St. Franciscos te Gilze, tijdens mijn metingen ter plaatse waren zij niet te beroerd om zich aan mij en mijn metingen aan te passen. Ook Marijke Gordijn van de Rijksuniversiteit Groningen heeft een zeer belangrijke taak vervuld door het beschikbaar stellen van de Lighwatcher en de benodigde informatie.
Mijn familie en schoonouders, pap en mam, Bram en Teun, Piet en Leony. Bedankt voor de interesse die jullie getoond hebben en pap en mam vooral bedankt voor de financiele steun die af en toe noodzakelijk was .
En Jast but zekernotleast mijn vriendin Ankie, die ondanks haar eigen succesvolle afstuderen altijd tijd voor me had . Haar luisterend oor en opbeurende woorden zijn erg belangrijk geweest voor mij het afgelopen jaar, bedankt voor de steun die je me gegeven hebt!
Koen Gommans Eindhoven, augustus 2008
Master's Thesis 101
Copyright © 2022 FDOKUMEN