Detection of differential gene expression in brown adipose tissue of hibernating arctic ground...
52
1 The Detection of Differential Gene Expression in Brown Adipose Tissue of Hibernating Arctic Ground Squirrels Using Mouse Microarrays Jun Yan 1 , Adlai Burman 1 , Calen Nichols 2 , Linda Alila 2 , Louise C. Showe 2 , Michael K. Showe 2 , Bert B. Boyer 1 , Brian M. Barnes 1 , and Thomas G. Marr 1 1 Institute of Arctic Biology, University of Alaska Fairbanks, Fairbanks, AK, 99775, USA 2 The Wistar Institute, 3601 Spruce St., Philadelphia, PA, 19104, USA Running head: Differential Gene Expression in Brown Adipose Tissue during hibernation. Corresponding author: Jun Yan, Mailing address: Institute of Arctic Biology, 311 Irving Building, University of Alaska Fairbanks, Fairbanks, AK, 99775, USA, E-mail: [email protected] , Tel: 907-474-6384. Fax: 907-450-8601. Articles in PresS. Physiol Genomics (February 7, 2006). doi:10.1152/physiolgenomics.00260.2005 Copyright © 2006 by the American Physiological Society.
Transcript of Detection of differential gene expression in brown adipose tissue of hibernating arctic ground...

1
The Detection of Differential Gene Expression in Brown Adipose
Tissue of Hibernating Arctic Ground Squirrels Using Mouse
Microarrays
Jun Yan1, Adlai Burman1, Calen Nichols2, Linda Alila2, Louise C. Showe2,
Michael K. Showe2, Bert B. Boyer1, Brian M. Barnes1, and Thomas G.
Marr1
1Institute of Arctic Biology, University of Alaska Fairbanks, Fairbanks, AK,
99775, USA
2 The Wistar Institute, 3601 Spruce St., Philadelphia, PA, 19104, USA
Running head: Differential Gene Expression in Brown Adipose Tissue
during hibernation.
Corresponding author: Jun Yan, Mailing address: Institute of Arctic Biology,
311 Irving Building, University of Alaska Fairbanks, Fairbanks, AK, 99775,
USA, E-mail: [email protected], Tel: 907-474-6384. Fax: 907-450-8601.
Articles in PresS. Physiol Genomics (February 7, 2006). doi:10.1152/physiolgenomics.00260.2005
Copyright © 2006 by the American Physiological Society.

2
Abstract
Hibernation is an energy-saving strategy adopted by a wide range of
mammals to survive highly seasonal or unpredictable environments. Arctic
ground squirrels living in Alaska provide an extreme example, with 6-9
months long hibernation seasons when body temperature alternates between
levels near 0°C during torpor and 37°C during arousal episodes. Heat
production during hibernation is provided, in part, by non-shivering
thermogenesis that occurs in large deposits of brown adipose tissue (BAT).
BAT is active at tissue temperatures from 0 to 37°C during rewarming and
continuously at near 0°C during torpor in subfreezing conditions. Despite its
crucial role in hibernation, the global gene expression patterns in BAT
during hibernation compared to the non-hibernation season remain largely
unknown. We report a large-scale study of differential gene expression in
BAT between winter hibernating and summer active arctic ground squirrels
using mouse microarrays. Selected differentially expressed genes identified
on the arrays were validated by quantitative real-time PCR using ground
squirrel specific primers. Our results show that the mRNA levels of the
genes involved in nearly every step of the biochemical pathway leading to
non-shivering thermogenesis are significantly increased in BAT during
hibernation, whereas those of genes involved in protein biosynthesis are

3
significantly decreased compared to the summer active animals in August.
Surprisingly, the differentially expressed genes also include adipocyte
differentiation-related protein or adipophilin (Adfp), gap junction protein 1
(Gja1), and secreted protein acidic and cysteine-rich (Sparc), which may
play a role in enhancing thermogenesis at low tissue temperatures in BAT.
Key words: hibernation; metabolism; protein biosynthesis; thermogenesis

4
Introduction
To survive anticipated famine in highly seasonal or unpredictable
environments, a wide range of mammalian species have evolved the energy-
saving strategy known as hibernation. Arctic ground squirrels (Spermophilus
parryii) living near the edge of its northernmost distribution in Alaska
provide an extreme example of hibernation. Over the long arctic winter,
these ground squirrels spend as long as 9 months hibernating in shallow
burrows above the permafrost. As air temperature decreases to –40°C and
the soil temperature down to –18°C, arctic ground squirrels enter torpor by
decreasing rates of heat production and metabolism and lowering core body
temperature to as low as –2.9°C (3). Torpor is interrupted every 10-21 days
throughout hibernation by arousal episodes, however, as arctic ground
squirrels spontaneously rewarm to euthermic body temperatures (36-37°C)
and maintain that temperature for 15-24 hours before slowly reentering
torpor.
Once called the “hibernation gland”, brown adipose tissue (BAT) was
originally observed in hibernators. In hibernating animals and most
mammalian neonates, BAT is essential for heat production through non-

5
shivering thermogenesis (NST). BAT can be found in body regions
including interscapular, periaortic, perirenal, and intercostal regions (11).
BAT mainly consists of brown adipocytes, endothelial cells, interstitial cells,
and preadipocytes that can divide and differentiate to form new brown
adipocytes. In contrast to white adipose tissue (WAT), BAT is richly
vascularized and densely packed with mitochondria, which give rise to its
brown color. Brown adipocytes in the BAT contain many small lipid
droplets (multilocular) whereas white adipocytes in WAT contain one big
lipid droplet (unilocular). In BAT, uncoupling protein 1 (UCP1), a BAT
specific protein, transports protons or the proton equivalents across the
mitochondria inner membrane without synthesizing ATP thus resulting in
part of the energy stored in the proton gradient being dissipated as heat.
BAT deposits persist in adult hibernators year-round, although their mass,
density of mitochondria, and UCP1 content increase 2-3 folds in fall prior to
hibernation (5, 24). Active NST in BAT at euthermic tissue temperatures
during summer occurs under the circumstances of cold-stress or diet-induced
thermogenesis. NST in hibernation, however, occurs in BAT at tissue
temperatures that can vary from 0-37°C as animals rewarm over 3-6 hours
during arousals and also continuously over weeks at tissue temperatures near
6
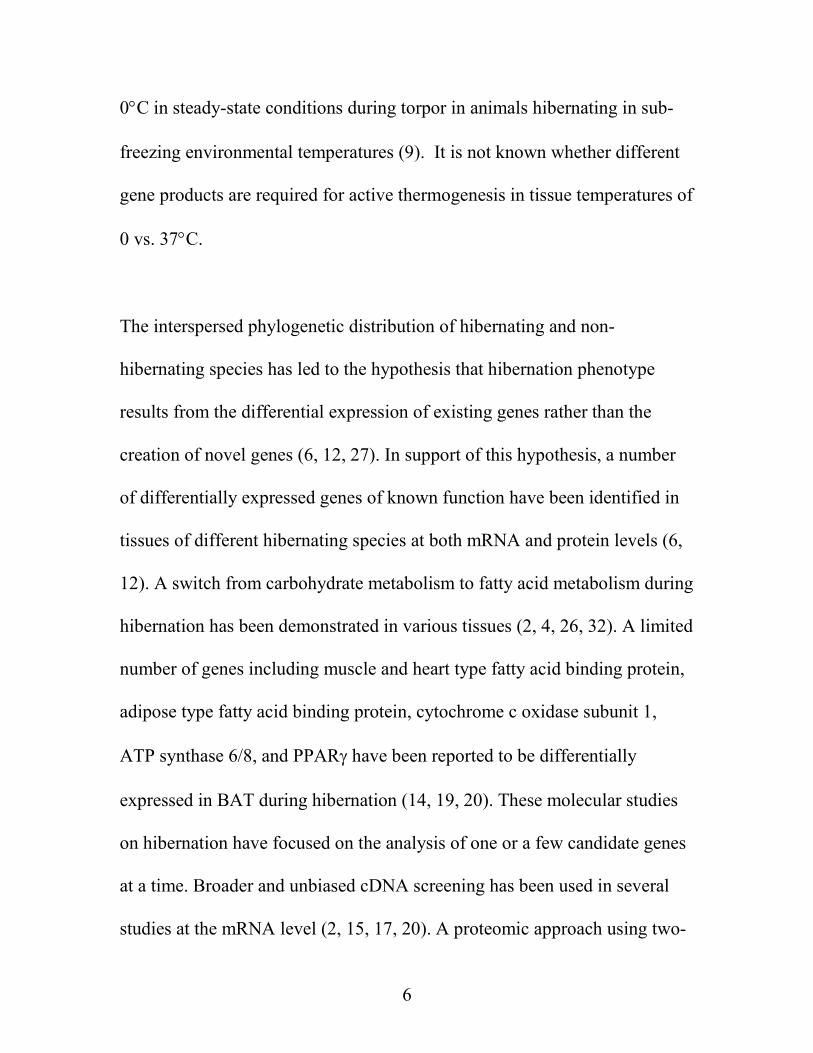
0°C in steady-state conditions during torpor in animals hibernating in sub-
freezing environmental temperatures (9). It is not known whether different
gene products are required for active thermogenesis in tissue temperatures of
0 vs. 37°C.
The interspersed phylogenetic distribution of hibernating and non-
hibernating species has led to the hypothesis that hibernation phenotype
results from the differential expression of existing genes rather than the
creation of novel genes (6, 12, 27). In support of this hypothesis, a number
of differentially expressed genes of known function have been identified in
tissues of different hibernating species at both mRNA and protein levels (6,
12). A switch from carbohydrate metabolism to fatty acid metabolism during
hibernation has been demonstrated in various tissues (2, 4, 26, 32). A limited
number of genes including muscle and heart type fatty acid binding protein,
adipose type fatty acid binding protein, cytochrome c oxidase subunit 1,
ATP synthase 6/8, and PPARγ have been reported to be differentially
expressed in BAT during hibernation (14, 19, 20). These molecular studies
on hibernation have focused on the analysis of one or a few candidate genes
at a time. Broader and unbiased cDNA screening has been used in several
studies at the mRNA level (2, 15, 17, 20). A proteomic approach using two-

7
dimensional gels followed by tandem mass spectrometry has been carried
out to identify differentially expressed liver proteins (16). Currently, several
investigators are pursuing the global analysis of gene expression pattern in
different hibernating species (8, 31). Microarrays provide an efficient
genomic approach for screening a large number of genes for differential
expression. The major difficulty in applying microarray technology to
hibernation studies is the lack of comprehensive genomic sequences for the
hibernating animals of interest. An alternative approach is to use
heterologous arrays consisting of probes from a related model organism.
Previously, Hittel and Storey successfully identified the up-regulation of
muscle and heart type and adipose type fatty acid binding proteins in BAT of
thirteen-lined ground squirrels (Spermophilus tridecemlineatus) using a
commercial rat cDNA array (19). Based on the partial mRNA sequences of
the 81 genes (GenBank accessions: DQ333962- DQ334051) in arctic ground
squirrel that we sequenced in our pilot study, Mouse (Mus musculus) shares
on average 89% mRNA sequence identities with arctic ground squirrel at the
nucleotide level (Table S1, supplementary materials). Mouse microarrays
covering a large number of the genes in the mouse genome have been
developed and used in various studies. Our strategy was to screen for
candidate genes that may be differentially expressed in hibernating arctic

8
ground squirrels by large-scale mouse microarray experiments, then to
validate the selected candidate genes by quantitative real-time PCR using
ground squirrel specific primer pairs.
Materials and Methods
Animals. Arctic ground squirrels were trapped in summer in the Alaska
Range (64°N 146°W, elevation 850 m) or on the North Slope of Alaska near
Toolik Lake (68°N 149°W, elevation 809 m) and transported to University
of Alaska Fairbanks. Animals sampled during hibernation were housed at
5±2°C with a 4:20-h light-dark photoperiod and were given Mazuri Rodent
Chow and water ad libitum and provided with sunflower seeds, carrots, and
apple slices. Animals sampled to represent the summer active season were
captured in August, housed at 18°C with constant light, provided with food
as above, and sacrificed within five days. Animals sampled to represent
hibernation were inspected twice daily and wood shavings were placed on
the dorsal surface of hibernating animals to assess the pattern of torpor bouts
and the occurrence of arousal episodes. Tissues were collected from
hibernators after no fewer than five days of continuous torpor in at least the
third torpor bout of the winter hibernation season. Torpid animals (n=5)

9
were euthanized by decapitation without anesthesia following verification of
core body temperatures <7°C using a rectal thermometer. Summer active
animals (n=3) were anesthetized with halothane and decapitated. Brown
adipose tissues were rapidly dissected, frozen in liquid nitrogen, and stored
at -70°C until total RNA was isolated at a later date. To illustrate the pattern
and extent of body temperature change during a natural hibernation season
of arctic ground squirrels, a small (10 g) temperature-sensitive data logger
was implanted in the peritoneal cavity of a free-living adult male that was
released at its home burrow and then recaptured a year later to retrieve the
logger. Further details about the environment of the ground squirrel, and the
logger and surgery procedure can be found at (23). Animal protocols were
approved by the University of Alaska Fairbanks Institutional Animal Care
and Use Committee.
Sample preparation. Total RNA was prepared from frozen tissue by
homogenizing directly in Tri-reagent (Molecular Research Center) using a
polytron (Brinkman) with a 7mm generator (Kinematica). RNA was
processed according to the manufacturer’s direction and RNA quality was
assessed by 1% agarose gel electrophoresis using SYBR Green II post
staining (Cambrex). All RNA samples were subsequently linearly amplified
10
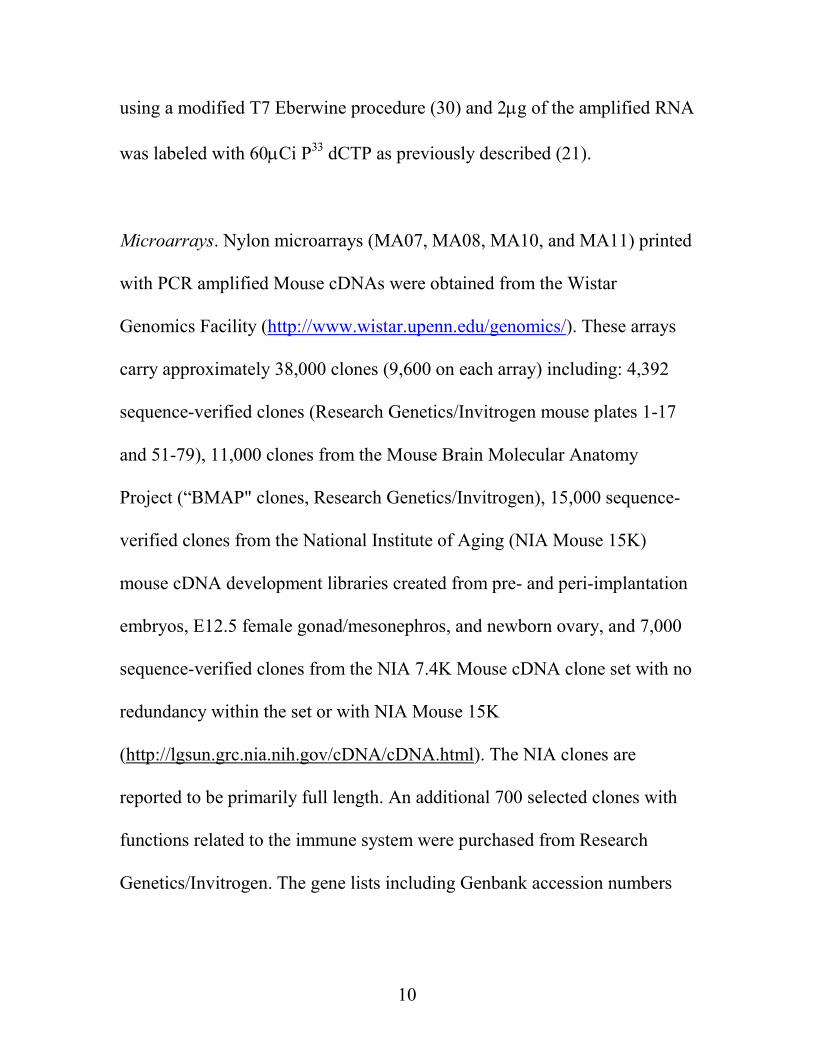
using a modified T7 Eberwine procedure (30) and 2µg of the amplified RNA
was labeled with 60µCi P33 dCTP as previously described (21).
Microarrays. Nylon microarrays (MA07, MA08, MA10, and MA11) printed
with PCR amplified Mouse cDNAs were obtained from the Wistar
Genomics Facility (http://www.wistar.upenn.edu/genomics/). These arrays
carry approximately 38,000 clones (9,600 on each array) including: 4,392
sequence-verified clones (Research Genetics/Invitrogen mouse plates 1-17
and 51-79), 11,000 clones from the Mouse Brain Molecular Anatomy
Project (“BMAP" clones, Research Genetics/Invitrogen), 15,000 sequence-
verified clones from the National Institute of Aging (NIA Mouse 15K)
mouse cDNA development libraries created from pre- and peri-implantation
embryos, E12.5 female gonad/mesonephros, and newborn ovary, and 7,000
sequence-verified clones from the NIA 7.4K Mouse cDNA clone set with no
redundancy within the set or with NIA Mouse 15K
(http://lgsun.grc.nia.nih.gov/cDNA/cDNA.html). The NIA clones are
reported to be primarily full length. An additional 700 selected clones with
functions related to the immune system were purchased from Research
Genetics/Invitrogen. The gene lists including Genbank accession numbers

11
and Unigene build 134 cluster assignments are available at
http://showelab.wistar.upenn.edu/Wistar_Showe_Lab_Gene_Lists.htm.
Hybridization and washing. Filters MA07, MA08, and MA11 were
hybridized with the same labeled target in the same hybridization bottle with
filters separated by nylon mesh. Filter MA10 was hybridized separately at an
earlier date with the same aRNA preparation as used for the rest of filters.
The hybridization was carried out for 16 hours at 42°C followed by 24 hours
at 35°C in 5ml MicroHyb buffer (Research Genetics). The lower
temperatures and extended hybridization times were implemented to
promote cross species hybridization. Filters from both hybridizations were
batch washed in a large container for consistency. Filters were rinsed at
room temperature with 2xSCC/1%SDS to remove residual probe and
MicroHyb solution and then transferred to preheated wash solutions in a
temperature controlled shaking water bath. 1L of solution was used for
filters in the batch. Filters were washed twice for 30min in 2xSCC/1%SDS
at 50°C and then once for 30min in 0.5xSCC/0.5%SDS at 55°C. Filters were
then exposed to phosphorimager screens for 6 days and scanned at 50 µm
resolution in a Storm Phosphorimager. After the first scanning, the filters
were rewashed in 0.1xSSC/0.5%SDS for 30min at 55°C and then reexposed

12
to the Phosphorimager screens for 11 days and scanned for the second time.
Images of the first scanning were used for MA10 filter. Images of the second
scanning were used for MA07, MA08, and MA11 filters for higher
stringency. Image analysis was performed with the ImaGene program
(Biodiscovery).
Microarray Data analysis. Only spots on the array satisfying: flag=0
(nonempty spot) and signal median > background median were included in
the analysis. Local background median was subtracted from signal median
as background-corrected signal. Background-corrected signals were divided
by their median on the array as the normalized expression values. The
normalized expression values of technical replicas (samples split from the
same total RNA extraction) were averaged as the final expression values
then again normalized. The final normalized expression values were log2
transformed. Log fold change is defined as the difference between the means
of log2 transformed expression values in winter hibernating group and
summer active group, i.e. ⟨log2(expression value)⟩hibernating−⟨log2(expression
value)⟩active. The p value of two-tailed Student’s t-test was calculated by
Excel (Microsoft). We used P < 0.05 and log fold change>1 as the criteria
for the significant difference. GenBank accession numbers of all probes on

13
the arrays were uploaded to Stanford Source (http://source.stanford.edu) to
obtain the gene names and symbols. We combined the multiple probes for
the same gene and removed the unannotated (no gene symbols assigned)
probes. When evaluating multiple probes corresponding to the same gene,
the probe with the lowest p value was chosen. The significant genes were
uploaded to GOminer (http://discover.nci.nih.gov/gominer/index.js) to
identify the significant GO (Gene Ontology) categories. The enrichment in
each category was calculated as the proportion of changed genes in the
category relative to the expected proportion on the arrays: the ratio of
changed genes in the category divided by the total number of genes in the
category, divided by the same ratio for the genes on the entire arrays. The p
value of the significance of each GO category was calculated by one-sided
Fisher’s exact test (33). All microarray data series were submitted to NCBI
Gene Expression Omnibus (GEO) with accession number: GSE3426.
Primer design. The specificity of real-time PCR requires using exact or
near-exact gene-specific primer sequences. Spermophilus lateralis and
Spermophilus tridecemlineatus share on average 99% sequence identities
with the arctic ground squirrel (Table S1, supplementary materials). We
combined 81 arctic ground squirrel sequences (GenBank accessions:

14
DQ333962- DQ334051) sequenced from our pilot study with 8,816
Spermophilus lateralis sequences and 2,343 Spermophilus tridecemlineatus
sequences downloaded from GenBank into a ground squirrel database. The
mouse RefSeq sequences of the significant genes identified on the arrays
were searched against the ground squirrel database using blast program (1).
Among the genes with significant ground squirrel sequence homology, 33
genes were selected for Real-time PCR assay based on a broad
representation for important functional categories discussed in Results. This
includes five in fatty acid metabolism, four in TCA cycle, one in anaerobic
metabolism, four in electron transport, one in ATP biosynthesis, two in
transport, one heat shock protein, one antioxidant protein, three in protein
biosynthesis, five in BAT differentiation and remodeling, and six others.
Three additional genes (Ucp1, Hsl, and Fabp4) that were not present on the
arrays were also tested in Real-time PCR. The identified ground squirrel
sequence was also aligned to possible paralogous genes (gene homologs
within the same species, isozymes for example). The sequence regions that
are highly conserved among paralogous genes were avoided in primer
design. Gene-specific primers were designed using Primer Express software
(Applied Biosystem). For Acadm, Sucla2, Suclg1, Actb, and Ucp1 genes,
primers were designed from arctic ground squirrel sequences. For all the rest

15
of genes except Mdh1, primers were designed from Spermophilus lateralis
or Spermophilus tridecemlineatus sequences. For Mdh1 gene, primers
designed from Spermophilus lateralis sequence (GenBank Accession:
CO737160) failed in Real-time PCR reaction. We suspect that this sequence
either is an artifact or has large sequencing errors. Instead, the primers
designed from the conserved regions of Mdh1 gene in human, mouse, and
rat were successful in Real-time PCR reaction. The sequences of primer
pairs and GenBank accession numbers of the orthologous sequences and
their sources from which they are derived are listed in Table S2
(supplementary materials).
Real-time PCR. We carried out Real-time PCR on the same samples used in
the array experiments. Two-step Real-time PCR was performed on ABI-
7900 HT system (Applied Biosystem) using SYBR Green reagent (Applied
Biosystem). The density of total RNA of each sample was measured by
spectrometer. The cDNA was synthesized from 0.5µg total RNA of each
sample using Multiscribe reverse transcriptase (Applied Biosystem) with
oligo d(T)16 primer in 20µl reaction at 25°C for 10min, 48°C for 30min, and
95°C for 5min. The synthesized cDNA was 10x diluted using Rnase-free
water into 200µl solution. 5µl diluted cDNA solution was used in each 25µl

16
Real-time PCR reaction. Cycle parameters were: 95°C for 10min hot start
and 40 cycles of 95°C for 15s; and 60°C for 1min. The controls with no
cDNA templates were performed to rule out the contamination. The controls
with no reverse transcriptase but all other components were used to rule out
the false amplification from genomic DNA. PCR product specificity was
checked by melting curve analysis and gel electrophoresis.
Comparisons between arrays and Real-time PCR. The critical threshold (CT)
value is the PCR cycle number where PCR growth curve crosses a defined
threshold in the linear range of reaction. It can be related to gene expression
values by formula log2(expression value)=C- CT, where C is the
normalization constant. Because we normalized the samples by starting with
the same amount of total RNA, C is constant across the samples for a
specific gene and irrelevant for the following statistical analysis. Two-tailed
Student’s t-test on - CT was directly used.
Results
The body temperature of a typical free-living male arctic ground squirrel
during hibernation is shown in Figure 1. This 1 kg ground squirrel
17
maintained core body temperature between 35-40°C during August and
September before becoming sequestered in its burrow and beginning
hibernation on Oct. 1st 1998. For the duration of the six months hibernation
season, body temperature varied from 3°C and –2°C during torpor bouts that
lasted 10-24 days between nine arousal episodes when body temperature
returned to euthermic temperatures for 10-15 hours.
Four Wistar mouse arrays (MA07, MA08, MA10, MA11) each carrying
9,600 probes were used to screen the differentially expressed genes between
winter hibernating and summer active arctic ground squirrels. We used P <
0.05 and log fold change>1 as the criteria for the significant difference.
Combining all four arrays, we identified 668 probes that were significantly
over-expressed during hibernation and 390 probes that were significantly
under-expressed during hibernation among the 38,400 probes on the arrays.
When there were multiple probes corresponding to the same gene on the
arrays, their results were often consistent. For example, five of eight probes
distributed across four arrays corresponding to Succinate-Coenzyme A
ligase, ADP-forming, beta subunit (Sucla2) gene showed significant over-
expression in winter hibernating squirrels. This indicates our array results
are highly reproducible. After we removed the unannotated probes and

18
combined multiple probes corresponding to the same gene on the arrays, we
identified 408 genes over-expressed during hibernation and 217 genes
under-expressed during hibernation among the 11,670 annotated genes on
the arrays. The top five over-expressed genes during hibernation according
to their log fold changes are: Succinate-Coenzyme A ligase, ADP-forming,
beta subunit (Sucla2, 4.37), Gap junction protein alpha 1 (Gja1, 3.70),
Growth hormone inducible transmembrane protein (Ghitm, 3.47),
Progesterone receptor membrane component 1 (Pgrmc1, 3.39), and
Dihydrolipoamide dehydrogenase (Dld, 3.27), where the numbers in the
brackets are log fold changes. The top five under-expressed genes during
hibernation are: Eukaryotic translation elongation factor 1 gamma (Eef1g, -
2.95), expressed sequence AV312086 (-2.52), Ribosomal protein S10
(Rps10, -2.36), Ribosomal protein L35 (Rpl35, -2.36), Syntaxin 6 (Stx6, -
2.34).
The significant differentially expressed genes identified on the arrays were
classified according to their GO (Gene Ontology) categories. The
significantly over-represented GO categories and their gene members are
listed in Table 1 and 2. The important functional categories are summarized
as below.

19
Metabolism. The genes involved in fatty acid metabolism, tricarboxylic
(TCA) cycle, electron transport, and ATP synthesis were significantly over-
expressed in hibernating animals compared to summer active animals. These
include: acyl-CoA synthatase long-chain (Acsl1), acyl-CoA dehydrogenase
(Acadm, Acadl), and acyl-CoA acyltransferase (Acaa2) in fatty acid
metabolism; succinate-CoA ligase (Sucla2, Suclg1), isocitrate
dehydrogenase (Idh3a, Idh3b), and malate dehydrogenase (Mdh1) in
tricarboxylic acid (TCA) cycle; cytochrome c somatic (Cycs), cytochrome b-
5 (Cyb5), NADH dehydrogenase (Ndufa8, Ndufb9), ubiquinol-cytochrome c
reductase (Uqcrb, Uqcrc2, Uqcrfs1, Uqcrh), and cytochrome c oxidase
(Cox6c, Cox7c, Cox17) in electron transport; ATP synthase (Atp5a1, Atp5b,
Atp5f1) in ATP synthesis. Lactate dehydrogenase (Ldha, Ldhb) involved in
anaerobic metabolism was significantly over-expressed during hibernation.
Methylmalonyl-Coenzyme A mutase (Mut) was also significantly over-
expressed during hibernation.
Protein biosynthesis. The genes involved in protein biosynthesis were
significantly under-expressed during hibernation including Eukaryotic

20
translation elongation factor (Eef1d, Eef1g), translation initiation factor
(Eif3s5), and a total of 23 ribosomal proteins.
Transport. Heart and muscle type fatty acid binding protein (Fabp3)
responsible for intracellular transport of fatty acids was significantly over-
expressed during hibernation. Solute carrier family 25 member 20 or
carnitine/acyl-carnitine translocase (Slc25a20 or Cact) located at the
mitochondrial inner membrane where it transfers fatty acylcarnitines into
mitochondria was also significantly over-expressed during hibernation.
Heat shock proteins. There were 37 heat shock proteins present on the
arrays. Heat shock 70kDa protein 9A (Hspa9a) and DnaJ (Hsp40) homolog,
subfamily B, member 9 (Dnajb9) were over-expressed during hibernation,
whereas heat shock 10kDa protein 1 (Hspe1) and heat shock 90kDa protein
1 alpha (Hspca) were under-expressed during hibernation.
Antioxidant proteins. Two isozymes of superoxide dismutase: Sod1 and
Sod2 were both over-expressed during hibernation.

21
BAT differentiation and remodeling. Adipocyte differentiation-related
protein or adipophilin (Adfp) and Gap junction protein 1 (Gja1) were over-
expressed during hibernation. Secreted protein acidic and cysteine-rich
(Sparc) and β-actin (Actb) were significantly under-expressed during
hibernation.
Others. Asparagine synthetase (Asns) and Tyrosine 3-
monooxygenase/tryptophan 5-monooxygenase activation proteins (Ywhae,
Ywhag, Ywhaz) were over-expressed during hibernation whereas
transforming growth factor beta 1 induced transcript 4 (Tgfb1i4) and
hemoglobin alpha 1 (Hba1) were under-expressed during hibernation.
Quantitative Real-time PCR was used to test 33 genes differentially
expressed during hibernation, including 28 over-expressed and 5 under-
expressed genes that were identified on the arrays. Ground squirrel specific
primer pairs were used to guarantee the specificity of PCR reactions. The
results are listed in Table 3. In the quantitative real-time PCR assay, all 33
genes showed changes of expression levels between hibernating animals and
summer active animals in the same direction as the array results. 26 genes
(79%) showed significant differences (P<0.05) in real-time PCR assay.

22
Among the rest 7 genes, Atp5b (P=0.08), Cox6c (P=0.06), and Tgfb1i4
(P=0.06) showed less significant differences (P<0.1) whereas the differences
in Acaa2, Suclg1, Idh3a, and Dld were not significant (P>0.1) in real-time
PCR assay. The log fold changes of 33 genes in the real-time PCR were
plotted against those on the arrays in Figure 2. The linear fit of the plot gives
y = 0.5885x + 0.0943 (R2 = 0.4678) where y is the real-time PCR result and
x is the array result. Three additional genes that were absent on the arrays
(Ucp1, Hsl, Fabp4) were also tested in real-time PCR assay. Ucp1 level is
increased by 5.67-fold (P<0.001) and Hsl level is increased by 2.96-fold
(P=0.03) whereas Fabp4 level is not significantly changed (P=0.805) in
hibernating animals compared to summer active animals.
Discussion
Our results are consistent with the previous studies of differential gene
expression in BAT during hibernation. The over-expression of Fabp3 during
hibernation on our arrays is consistent with (13, 19). The over-expression of
cytochrome c oxidase and ATP synthase on our arrays is consistent with
(20). However, as pointed out in (20, 28), the protein level of ATP synthase
is low in BAT since the major role of BAT is heat production through futile
23
proton cycling. This disagreement may be due to the regulation at post-
transcriptional level. The over-expression of two isozymes of superoxide
dismutase (Sod1 and Sod2) during hibernation is consistent with (10).
Buzadzic et al. showed that the activities of both Sod1 and Sod2 were
increased in brown adipose tissue of European ground squirrels
(Spermophilus citellus) during hibernation. Superoxide dismutase acts as an
antioxidant to destroy the harmful superoxide radicals in the body. The
increased level of the antioxidant can protect the tissue from reactive oxygen
species generated as a result of the intense metabolic activity sustained by
this tissue during arousal.
In BAT, NST is controlled by norepinephrine released by sympathetic
nerves. Norepinephrine signaling through β3-adrenoceptor activates
hormone sensitive lipase (Hsl) to cleave the triglyceride stored in the lipid
droplet in brown adipocytes into free fatty acid and glycerol. In our real-time
PCR assay, Hsl level is significantly increased in hibernating animals
compared to summer active animals. In cytosol, free fatty acid is bound with
fatty acid binding proteins. Two types of fatty acid binding proteins exist in
BAT: muscle and heart type (Fabp3) and adipose type (Fabp4). Hittel and
Storey showed that both types of fatty acid binding proteins were over-

24
expressed during hibernation (19). We also showed that Fabp3 is over-
expressed during hibernation on our arrays. While Fabp4 was not present on
our arrays, Fabp4 is not significantly over-expressed during hibernation in
our real-time PCR assay. The fatty acid is activated to fatty acyl-CoA by
acyl-CoA synthetases before entering mitochondria. On our arrays, acyl-
CoA synthatase long-chain (Acsl1) is over-expressed during hibernation.
Fatty acyl-CoA is transformed to fatty acyl-carnitine by carnitine
palmitoyltransferase I then transported into the mitochondria through
carnitine/acyl-carnitine translocase (Cact) and reconverted to fatty acyl-CoA
by carnitine palmitoyltransferase II. This carnitine-mediated entry process is
the rate-limiting step for fatty acid β-oxidation. On our arrays, Cact is
significantly over-expressed during hibernation. After entering
mitochondria, fatty acyl-CoA undergoes β-oxidation to generate acetyl-CoA.
The enzymes involved in the first and last steps of β-oxidation cycles, acyl-
CoA dehydrogenase (Acadm, Acadl) and acyl-CoA acyltransferase (Acaa2),
are over-expressed during hibernation on our arrays. In mitochondria, acetyl-
CoA is further oxidized in TCA cycle. Three of the eight enzymes in TCA
cycles, succinate-CoA ligase (Sucla2, Suclg1), isocitrate dehydrogenase
(Idh3a, Idh3b), and malate dehydrogenase (Mdh1), are significantly over-
expressed during hibernation on our arrays. Both fatty acid β-oxidation and
25
TCA cycle lead to the formation of the reduced electron carrier FADH and
NADH, which are then oxidized by the electron transport chain. All three
enzymes in electron transport chain, NADH dehydrogenase (Ndufa8,
Ndufb9), ubiquinol-cytochrome c reductase (Uqcrb, Uqcrc2, Uqcrfs1,
Uqcrh), and cytochrome c oxidase (Cox6c, Cox7c, Cox17), are over-
expressed during hibernation on our arrays. The respiration through the
electron transport chain pumps protons out of the mitochondria matrix
leading to the formation of the proton gradient across mitochondria
membrane. As the protons or proton equivalents flow through Ucp1, the
energy stored in the proton gradient is dissipated as heat. While Ucp1 was
not present on our arrays, we used real-time PCR to show that it was indeed
over-expressed during hibernation. It is remarkable that nearly every step in
the biochemical pathway leading to NST is elevated in BAT during
hibernation. Under the above-freezing conditions of this experiment,
thermogenic activity in the BAT of animals sampled during torpor should
have been low and only activated during arousal. There are evidences that
the translation of mRNA into proteins is inhibited during torpor (18, 29).
The under-expression of a large number of genes involved in protein
biosynthesis on our arrays also supports this view. The elevated mRNA

26
levels of the genes involved in NST may be important for rapid translation
after arousal to high body temperature (22).
During hibernation, NST has to work at tissue temperatures from 0 to 37°C
in BAT whereas the tissue temperatures in BAT is always near 37°C in
summer active animals. Among the differentially expressed genes identified
on our arrays, some may potentially enhance the thermogenesis at low tissue
temperature during hibernation. The over-expression of adfp gene during
hibernation on our arrays indicates the enhanced brown adipocyte
differentiation in BAT during hibernation. More mature adipocytes means
higher thermogenic capacity in BAT. Gap junctions are intercellular
channels for the diffusion of low molecular weight molecules between cells.
Gja1 or connexin 43, a member of gap junction proteins, has been shown to
be over-expressed in the heart of hibernating hamsters, which may help
hamsters avoid fibrillation during hibernation and arousal (25). The over-
expressed Gja1 may enhance the substrate transport through gap junction in
BAT and thus increase its thermogenic capacity during hibernation. Sparc is
a matrix-associated protein that elicits changes in cell shape, inhibits cell-
cycle progression, and influences the synthesis of extracellular matrix. Sparc
is under-expressed during hibernation on our arrays. Bradshaw et al. showed

27
that mice lacking Sparc exhibit an increase in the size and number of
adipocytes (7). The under-expression of Sparc during hibernation may also
play a role in the accumulation and differentiation of adipocytes in BAT.
Actb which is normally considered a house-keeping gene is under-expressed
during hibernation. This further suggests that BAT may have undergone
structure remodeling to enable the differentiation and maturation of brown
adipocyte to increase its thermogenic capacity at low tissue temperature
during hibernation.
In conclusion, our microarray results not only agree with previous studies on
BAT during hibernation but also have revealed the differential expression of
a large number of genes not previously shown to be involved in hibernation.
It is clear from this study that significant global changes occur at the mRNA
level in BAT during hibernation. The fact that the genes involved in nearly
every step of the biochemical pathway leading to NST are over-expressed in
BAT during hibernation reflects the unique role of BAT as a “furnace”
during hibernation. The differential expression of the genes involved in
adipose differentiation, substrate transport, and structure remodeling may
enhance the thermogenesis in BAT at low tissue temperature. Future studies
including multiple stages throughout hibernation and concurring protein
28
expression would give us a more complete understanding of molecular
mechanism underlying the hibernation phenotype.
Acknowledgements
We thank Vadim Fedorov for the help in RNA extraction.
Grants
We wish to acknowledge the support from NIH grant RR-16466-01 (T. G.
Marr), NSF grant EPS-0092040 (T. G. Marr), Microarray Network grant
NSF-RCN 0090286 (M. K. Showe and B. B. Boyer), DoD EPSCoR grant
N00014-01-1-0907 (B. B. Boyer), University of Alaska Foundation (T. G.
Marr, B. M. Barnes, and B. B. Boyer), and NSF grant NSF 0117104 (B. M.
Barnes).

29
References
1. Altschul SF, Gish W, Miller W, Myers EW, and Lipman DJ. Basic
local alignment search tool. J Mol Biol 215: 403-410, 1990.
2. Andrews MT, Squire TL, Bowen CM, and Rollins MB. Low-
temperature carbon utilization is regulated by novel gene activity in the heart
of a hibernating mammal. Proc Natl Acad Sci USA 95: 8392–8397, 1998.
3. Barnes BM. Freeze avoidance in a mammal: body temperatures below 0
degree C in an Arctic hibernator. Science 244: 1593-1595, 1989.
4. Bauer VW, Squire TL, Lowe ME, and Andrews MT. Expression of a
chimeric retroviral-lipase mRNA confers enhanced lipolysis in a hibernating
mammal. Am J Physiol Regul Integr Comp Physiol 281: R1186–R1192,
2001.
5. Boyer BB, Barnes BM, Kopecky J, Jacobsson A, and Hermanska J.
Molecular control of prehibernation brown fat growth in arctic ground
squirrels. In: Life in the Cold III: Ecological, Physiological and Molecular

30
Mechanisms, edited by Carey C, Florant GL, Wunder BA, Horwitz B.
Boulder (CO): Westview Press, 1993.
6. Boyer BB, and Barnes BM. Molecular and Metabolic Aspects of
Mammalian Hibernation. BioScience 49: 713-724, 1999.
7. Bradshaw AD, Graves DC, Motamed K, and Sage EH. SPARC-null
mice exhibit increased adiposity without significant differences in overall
body weight. Proc Natl Acad Sci USA 100: 6045-6050, 2003.
8. Brauch KM, Dhruv ND, Hanse EA, and Andrews MT. Digital
transcriptome analysis indicates adaptive mechanisms in the heart of a
hibernating mammal. Physiol Genomics 23: 227-234, 2005.
9. Buck CL and Barnes BM. Effects of ambient temperature on metabolic
rate, respiratory quotient, and torpor in an arctic hibernator.
Am J Physiol Regul Integr Comp Physiol 279(1): R255-62, 2000.

31
10. Buzadzic B, Spasic M, Saicic ZS, Radojicic R, Petrovic VM, and
Halliwell B. Antioxidant defenses in the ground squirrel Citellus citellus. 2.
The effect of hibernation. Free Radic Biol Med 9: 407-413, 1990.
11. Cannon B and Nedergaard J. Brown adipose tissue: function and
physiological significance, Physiol Rev 84: 277-359, 2004.
12. Carey HV, Andrews MT, and Martin SL. Mammalian hibernation:
cellular and molecular responses to depressed metabolism and low
temperature. Physiol Rev 83: 1153-81, 2003.
13. Daikoku T, Shinohara Y, Shima A, Yamazaki N, and Terada H.
Dramatic enhancement of the specific expression of the heart-type fatty acid
binding protein in rat brown adipose tissue by cold exposure. FEBS Lett 410:
383-386, 1997.
14. Eddy SF, Morin PJ, and Storey KB. Cloning and expression of PPAR-
gamma and PGC-1alpha from the hibernating ground squirrel, Spermophilus
tridecemlineatus. Mol Cell Biochem 269(1-2): 175-182, 2005.

32
15. Epperson LE, and Martin SL. Quantitative assessment of ground
squirrel mRNA levels in multiple stages of hibernation. Physiol Genomics
10: 93 –102, 2002.
16. Epperson LE, Dahl TA, and Martin SL. Quantitative Analysis of
Liver Protein Expression During Hibernation in the Golden-mantled Ground
Squirrel. Mol Cell Proteomics 3: 920-933, 2004.
17. Fahlman A, Storey JM, and Storey KB. Gene up-regulation in heart
during mammalian hibernation. Cryobiology 40: 332–342, 2000.
18. Frerichs KU, Smith CB, Brenner M, DeGracia DJ, Krause GS,
Marrone L, Dever TE, Hallenbeck JM. Suppression of protein synthesis
in brain during hibernation involves inhibition of protein initiation and
elongation. Proc Natl Acad Sci USA 95: 14511-14516, 1998.
19. Hittel DS and Storey KB. Differential expression of adipose- and heart-
type fatty acid binding proteins in hibernating ground squirrels. Biochim
Biophys Acta 1522: 238-243, 2001.
33
20. Hittel DS and Storey KB. Differential expression of mitochondria-
encoded genes in a hibernating mammal. J Exp Biol 205: 1625-1631, 2002.
21. Kari L, Loboda A, Nebozhyn M, Rook AH, Vonderheid EC, Nichols
C, Virok D, Chang C, Horng WH, Johnston J, Wysocka M, Showe MK,
and Showe LC. Classification and prediction of survival in patients with the
leukemic phase of cutaneous T-cell lymphoma. J Exp Med 197:1477-1488,
2003.
22. Knight JE, Narus EN, Martin SL, Jacobson A, Barnes BM, and
Boyer BB. mRNA stability and polysome loss in hibernating Arctic ground
squirrels (Spermophilus parryii). Mol Cell Biol 20: 6374-6379, 2000.
23. Long RA, TJ Martin, and BM Barnes. Body temperature and activity
patterns in free-living arctic ground squirrels. J Mammal 86(2): 312-322,
2005.
24. Milner RE, Wang LC, Trayhurn P. Brown fat thermogenesis during
hibernation and arousal in Richardson's ground squirrel. Am J Physiol 256:
R42-8, 1989.

34
25. Saitongdee P, Milner P, Becker DL, Knight GE, Burnstock G.
Increased connexin43 gap junction protein in hamster cardiomyocytes
during cold acclimatization and hibernation. Cardiovasc Res 47: 108-15,
2000.
26. Soukri A, Valverde F, Hafid N, Elkebbaj MS, and Serrano A.
Occurrence of a differential expression of the glyceraldehyde-3-phosphate
dehydrogenase gene in muscle and liver from euthermic and induced
hibernating jerboa (Jaculus orientalis). Gene 181: 139-145, 1996.
27. Srere HK, Wang LCH, and Martin SL. Central role for differential
gene expression in mammalian hibernation. Proc Natl Acad Sci USA 89:
7119-7123, 1992.
28. Tvrdik P, Kuzela S, and Houstek J. Low translational efficiency of the
F1-ATPase beta-subunit mRNA largely accounts for the decreased ATPase
content in brown adipose tissue mitochondria. FEBS Lett 313: 23-26, 1992.

35
29. Van Breukelen F and Martin SL. Translational initiation is uncoupled
from elongation at 18C during mammalian hibernation. Am J Physiol Reg
Comp Integrative Physiol 281: R1374-R1379, 2001.
30. Van Gelder RN, von Zastrow ME, Yool A, Dement AC, Barchas JD,
and Eberwine EH. Amplified RNA synthesized from limited quantities of
heterogeneous cDNA. Proc Natl Acad Sci USA 87: 1663–1667, 1990.
31. Williams DR, Epperson LE, Li W, Hughes MA, Taylor R, Rogers J,
Martin SL, Cossins AR, and Gracey AY. Seasonally hibernating
phenotype assessed through transcript screening. Physiol Genomics 24: 13–
22, 2005.
32. Wilson BE, Deeb S, and Florant GL. Seasonal changes in hormone-
sensitive and lipoprotein lipase mRNA concentrations in marmot white
adipose tissue. Am J Physiol 262: R177-R181, 1992.
33. Zeeberg BR, Feng W, Wang G, Wang MD, Fojo AT, Sunshine M,
Narasimhan S, Kane DW, Reinhold WC, Lababidi S, Bussey KJ, Riss J,
Barrett JC, and Weinstein JN. GoMiner: a resource for biological

36
interpretation of genomic and proteomic data. Genome Biology 4: R28,
2003.

37
Figure 1.
Figure 1. Core body temperature change in a free-living male arctic ground
squirrel over-wintering near the shore of Toolik Lake in northern Alaska.
The hibernation season is composed of several bouts of daily torpor
followed by extended bouts of multi-day torpor interrupted by eight arousal
episodes, when body temperature briefly returns to euthermic levels.

38
Figure 2.
Figure 2. Log fold changes of 33 genes on the arrays versus those in Real-
time PCR assay. The p values of their gene expression changes on the arrays
and in Real-time PCR assay are shown in Table 3.

39
Table 1. Significant GO categories classified by GOminer.
Table 1. The list of significant GO categories classified by Gominer. The
enrichment in each category was calculated as the proportion of changed
genes in the category relative to the expected proportion on the arrays. The p
value of the significance of each GO category was calculated by one-sided
Fisher’s exact test (33).
GO category Total
genes on
the arrays
Differentially
expressed
genes
Enrichment Log10(p)
TCA cycle 22 6 6.87 -3.79
Electron transport 177 17 2.42 -3.22
ATP synthesis 21 5 5.95 -2.93
Fatty acid
metabolism
88 10 2.86 -2.62
Protein
biosynthesis
357 27 3.45 -8.04

40
Table 2. Genes in each significant GO category identified by Gominer.
GO category Gene name Gene
symbol
Accession
number
Log
fold
change
P
value
Tricarboxylic
acid cycle
Dihydrolipoamide S-
succinyltransferase
Dlst AI849904 2.30 0.002
Isocitrate
dehydrogenase 3
(NAD+) alpha
Idh3a BG077913 1.69 0.002
Isocitrate
dehydrogenase 3
(NAD+) beta
Idh3b AU019946 1.37 0.04
Malate dehydrogenase
1
Mdh1 BG064914 1.50 0.004
Succinate-Coenzyme A
ligase, ADP-forming,
beta subunit
Sucla2 AI835580 4.37 <0.001

41
Succinate-CoA ligase,
GDP-forming, alpha
subunit
Suclg1 BG071511 1.11 0.03
Electron
transport
Cytochrome c oxidase,
subunit VIc
Cox6c BG085306 2.21 <0.001
Cytochrome c oxidase,
subunit VIIc
Cox7c BG077312 1.64 0.004
Cytochrome b-5 Cyb5 BG065259 1.30 <0.001
Cytochrome c, somatic Cycs BG063100 3.25 <0.001
Dihydrolipoamide
dehydrogenase
Dld AI847502 3.27 0.001
Electron transferring
flavoprotein,
dehydrogenase
Etfdh BG083466 1.62 0.02
Glycerol phosphate
dehydrogenase 2,
mitochondrial
Gpd2 AI846919 1.62 0.006

42
NADH dehydrogenase
(ubiquinone) 1 beta
subcomplex, 9
Ndufb9 BG087636 1.98 0.004
NADH dehydrogenase
(ubiquinone) Fe-S
protein 1
Ndufs1 BG088100 1.28 0.03
NADH dehydrogenase
(ubiquinone) 1 alpha
subcomplex, 8
Ndufa8 BG087056 1.73 0.005
Thioredoxin 1 Txn1 AI844775 1.27 0.001
Ubiquinol-cytochrome
c reductase binding
protein
Uqcrb BG085012 2.80 0.009
Ubiquinol cytochrome
c reductase core protein
2
Uqcrc2 BG075001 1.14 0.006
Ubiquinol-cytochrome
c reductase, Rieske
iron-sulfur polypeptide
1
Uqcrfs1 AI850420 1.26 0.04

43
Ubiquinol-cytochrome
c reductase hinge
protein
Uqcrh AI843761 1.06 0.01
ATP
biosynthesis
ATP synthase, H+
transporting,
mitochondrial F1
complex, alpha subunit,
isoform 1
Atp5a1 AW412466 2.77 0.007
ATP synthase, H+
transporting
mitochondrial F1
complex, beta subunit
Atp5b BQ559302 2.29 <0.001
ATP synthase, H+
transporting,
mitochondrial F0
complex, subunit b,
isoform 1
Atp5f1 AI837594 1.39 0.04
ATPase, H+ Atp6v0d1 AU043006 2.02 0.003

44
transporting, V0
subunit D isoform 1
ATPase, H+
transporting, V1
subunit E isoform 1
Atp6v1e1 AI844873 1.89 0.04
Fatty acid
metabolism
Acetyl-Coenzyme A
acyltransferase 2
Acaa2 BG085346 1.23 0.007
Acetyl-Coenzyme A
dehydrogenase, long-
chain
Acadl C79809 2.32 0.004
Acetyl-Coenzyme A
dehydrogenase,
medium chain
Acadm AI840666 2.29 <0.001
Acyl-Coenzyme A
thioesterase 2
Acate2 BG063815 1.04 0.003
Acyl-CoA synthetase
long-chain family
Acsl1 BG074754 1.96 <0.001

45
member 1
Caveolin, caveolae
protein 1
Cav1 BG083456 1.49 0.05
Glycerol-3-phosphate
acyltransferase,
mitochondrial
Gpam BQ552668 1.38 0.04
Protein kinase, cAMP
dependent regulatory,
type II beta
Prkar2b AI851427 1.25 0.02
Sterol carrier protein 2,
liver
Scp2 BG086835 1.70 0.007
Protein
biosynthesis
Acidic ribosomal
phosphoprotein P0
Arbp BG064817 -1.16 0.05
UDP-Gal:betaGlcNAc
beta 1,3-
galactosyltransferase,
polypeptide 3
B3galt3 AI841494 -1.71 0.008

46
Eukaryotic translation
elongation factor 1
delta
Eef1d AI839632 -2.17 0.02
Eukaryotic translation
elongation factor 1
gamma
Eef1g BG072780 -2.95 <0.001
Eukaryotic translation
initiation factor 3,
subunit 5
Eif3s5 AI836722 -1.25 0.03
Finkel-Biskis-Reilly
murine sarcoma virus,
ubiquitously expressed;
Ribosomal protein S30
Fau BG087448 -1.76 0.004
Laminin receptor 1
(ribosomal protein SA)
Lamr1 BG072822 -1.70 <0.001
Ribosomal protein L10 Rpl10 BG085975 -1.84 0.005
Ribosomal protein
L10A
Rpl10a AI849117 -1.00 0.04
Ribosomal protein L12 Rpl12 AI851649 -1.15 0.04

47
Ribosomal protein
L13A
Rpl13a BG087204 -1.07 0.02
Ribosomal protein
L18A
Rpl18a BG072556 -1.85 0.002
Ribosomal protein L3 Rpl3 BG072595 -1.65 <0.001
Ribosomal protein L31 Rpl31 BG086430 -1.47 0.002
Ribosomal protein L32 Rpl32 AW556391 -1.66 <0.001
Ribosomal protein L35 Rpl35 BG072983 -2.36 0.002
Ribosomal protein L36 Rpl36 BG072993 -2.10 0.01
Ribosomal protein L4 Rpl4 BG086419 -1.29 0.03
Ribosomal protein L17 Rpl7 BG072985 -1.11 0.04
Ribosomal protein,
large, P1
Rplp1 BG074911 -1.99 <0.001
Ribosomal protein,
large, P2
Rplp2 AI853822 -1.93 0.01
Ribosomal protein S14 Rps14 BG086818 -1.67 <0.001
Ribosomal protein S15 Rps15 BG087421 -2.24 0.002
Ribosomal protein S16 Rps16 BG072615 -1.58 0.005
Ribosomal protein S5 Rps5 BI076433 -1.45 0.01
48
Ribosomal protein S8 Rps8 BG085869 -1.38 0.002
Ribosomal protein S9 Rps9 BG067495 -1.58 0.009
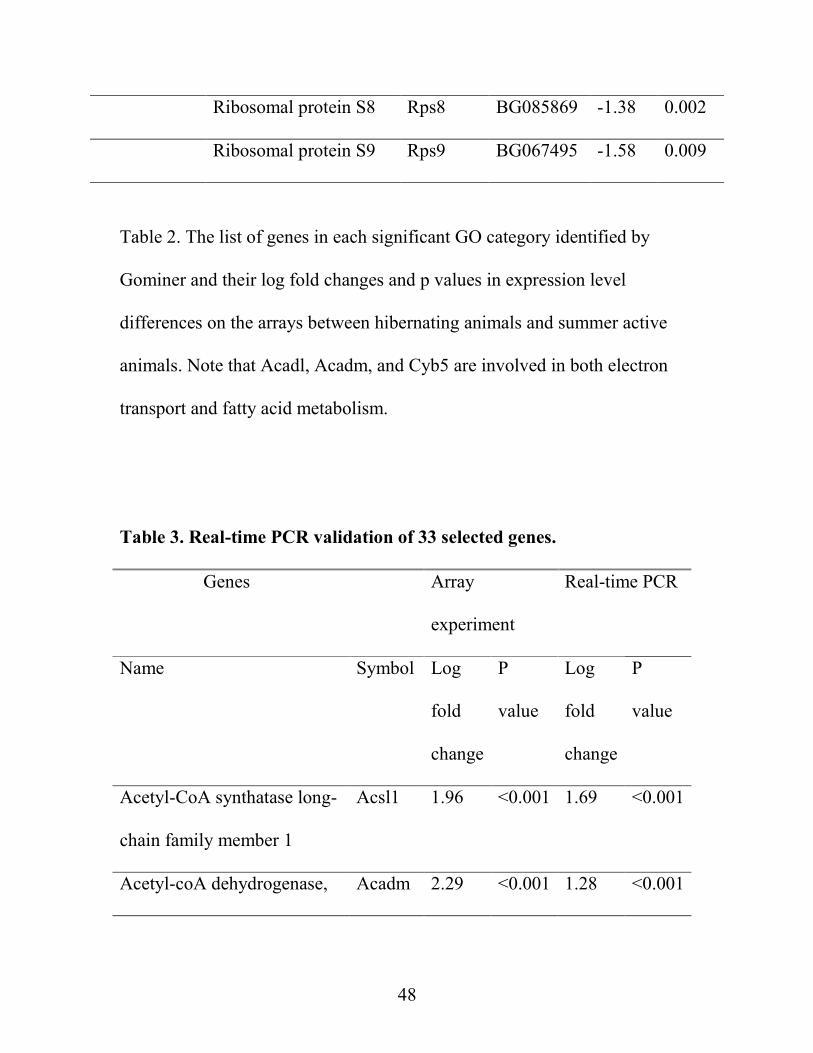
Table 2. The list of genes in each significant GO category identified by
Gominer and their log fold changes and p values in expression level
differences on the arrays between hibernating animals and summer active
animals. Note that Acadl, Acadm, and Cyb5 are involved in both electron
transport and fatty acid metabolism.
Table 3. Real-time PCR validation of 33 selected genes.
Genes Array
experiment
Real-time PCR
Name Symbol Log
fold
change
P
value
Log
fold
change
P
value
Acetyl-CoA synthatase long-
chain family member 1
Acsl1 1.96 <0.001 1.69 <0.001
Acetyl-coA dehydrogenase, Acadm 2.29 <0.001 1.28 <0.001

49
median chain
Sterol carrier protein 2 Scp2 1.70 0.007 0.717 0.039
Acyl-Coenzyme A
thioesterase 2
Acate2 1.04 0.003 1.88 0.008
acetyl-Coenzyme A
acyltransferase 2
Acaa2 1.23 0.007 0.38 0.20
Succinate-CoA ligase, ADP-
forming
Sucla2 4.37 <0.001 2.47 <0.001
Succinate-CoA ligase, GDP-
forming, alpha subunit
Suclg1 1.11 0.03 0.10 0.65
Isocitrate dehydrogenase 3
(NAD+) alpha
Idh3a 1.69 0.002 0.34 0.45
Malate dehydrogenase 1 Mdh1 1.50 0.004 1.05 0.037
Cytochrome c oxidase,
subunit VI c
Cox6c 2.21 <0.001 0.53 0.055
Dihydrolipoamide
dehydrogenase
Dld 3.27 0.001 0.44 0.18
Cytochrome c, somatic Cycs 3.25 <0.001 0.72 0.023
NADH dehydrogenase 1 Ndufa8 1.73 0.005 2.14 0.002

50
alpha 8
Lactate dehydrogenase alpha Ldha 1.11 0.01 0.979 0.005
ATP synthase, H+
transporting mitochondrial
F1 complex, beta subunit
Atp5b 2.29 <0.001 1.51 0.08
Fatty acid binding protein 3 Fabp3 2.54 0.004 4.26 <0.001
Carnitine/acylcarnitine
translocase
Cact 1.74 <0.001 2.05 0.009
Heat shock protein 9A Hspa9a 2.62 <0.001 0.76 0.006
Superoxide dismutase 2 Sod2 1.59 0.005 1.21 0.001
Translation elongation factor
1 alpha 1
Eef1a1 -0.945 0.02 -0.951 0.03
Ribosomal protein S16 Rps16 -1.58 0.005 -0.881 0.005
Ribosomal protein L3 Rpl3 -1.65 <0.001 -0.67 0.023
Adipose differentiation-
related protein
Adfp 0.833 0.01 3.26 <0.001
Growth hormone inducible
transmembrane protein
Ghitm 2.85 0.003 1.40 0.01
Gap junction protein alpha 1 Gja1 2.74 0.001 2.17 0.002

51
Secreted protein, acidic,
cysteine-rich
Sparc -1.52 0.003 -2.14 <0.001
β-actin Actb -1.21 0.004 -1.16 0.04
Asparagine synthetase Asns 1.32 0.003 1.65 0.005
Tyrosine 3-
monooxygenase/tryptophan
5-monooxygenase activation
protein, epsilon polypeptide
Ywhae 1.26 0.007 0.57 0.039
Methylmalonyl-Coenzyme A
mutase
Mut 2.21 <0.001 0.81 0.026
Protein tyrosine phosphatase
4a1
Ptp4a1 1.29 <0.001 1.10 0.024
Transforming growth factor
beta 1 induced transcript 4
Tgfb1i4 -1.25 0.048 -0.80 0.06
RAB1, member RAS
oncogene family
Rab1 1.94 <0.001 1.04 0.01
Table 3. Comparison between array experiment and real-time PCR assay for
33 selected genes. Log fold change in real-time PCR was calculated from the
difference in - CT between hibernating animals and summer active animals,

52
where CT is critical threshold in real-time PCR. P value was calculated from
two-tailed Student’s t-test.