Generating addressable protein microarrays with PROfusion™ covalent mRNA-protein fusion technology
BioMed CentralBMC Genomics
ss
Open AcceResearch articleComparative genomics profiling of clinical isolates of Aeromonas salmonicida using DNA microarraysJohn HE Nash*1, Wendy A Findlay1, Christian C Luebbert1, Oksana L Mykytczuk1, Simon J Foote1, Eduardo N Taboada1, Catherine D Carrillo1, Jessica M Boyd2, Duncan J Colquhoun3, Michael E Reith2 and Laura L Brown2Address: 1Institute for Biological Sciences, National Research Council of Canada, 100 Sussex Drive, Ottawa, Ontario, K1A 0R6, Canada, 2Institute for Marine Biosciences, National Research Council of Canada, 1411 Oxford Street, Halifax, Nova Scotia, B3H 3Z1, Canada and 3National Veterinary Institute, Department for Fish Health, Post Box 8156 Dep., 0033 Oslo, Norway
Email: John HE Nash* - [email protected]; Wendy A Findlay - [email protected]; Christian C Luebbert - [email protected]; Oksana L Mykytczuk - [email protected]; Simon J Foote - [email protected]; Eduardo N Taboada - [email protected]; Catherine D Carrillo - [email protected]; Jessica M Boyd - [email protected]; Duncan J Colquhoun - [email protected]; Michael E Reith - [email protected]; Laura L Brown - [email protected]
* Corresponding author
AbstractBackground: Aeromonas salmonicida has been isolated from numerous fish species and shows widevariation in virulence and pathogenicity. As part of a larger research program to identify virulencegenes and candidates for vaccine development, a DNA microarray was constructed using a subsetof 2024 genes from the draft genome sequence of A. salmonicida subsp. salmonicida strain A449. Themicroarray included genes encoding known virulence-associated factors in A. salmonicida andhomologs of virulence genes of other pathogens. We used microarray-based comparative genomichybridizations (M-CGH) to compare selected A. salmonicida sub-species and other Aeromonasspecies from different hosts and geographic locations.
Results: Results showed variable carriage of virulence-associated genes and generally increasedvariation in gene content across sub-species and species boundaries. The greatest variation wasobserved among genes associated with plasmids and transposons. There was little correlationbetween geographic region and degree of variation for all isolates tested.
Conclusion: We have used the M-CGH technique to identify subsets of conserved genes fromamongst this set of A. salmonicida virulence genes for further investigation as potential vaccinecandidates. Unlike other bacterial characterization methods that use a small number of gene orDNA-based functions, M-CGH examines thousands of genes and/or whole genomes and thus is amore comprehensive analytical tool for veterinary or even human health research.
Published: 07 March 2006
BMC Genomics2006, 7:43 doi:10.1186/1471-2164-7-43
Received: 03 November 2005Accepted: 07 March 2006
This article is available from: http://www.biomedcentral.com/1471-2164/7/43
© 2006Nash et al; licensee BioMed Central Ltd.This is an Open Access article distributed under the terms of the Creative Commons Attribution License (http://creativecommons.org/licenses/by/2.0), which permits unrestricted use, distribution, and reproduction in any medium, provided the original work is properly cited.
Page 1 of 15(page number not for citation purposes)

BMC Genomics 2006, 7:43 http://www.biomedcentral.com/1471-2164/7/43
BackgroundAeromonas salmonicida, the causative agent of furunculosisin salmonid fish, is a non-motile, Gram-negative bacte-rium, and one of the most studied bacterial pathogens offish. Furunculosis is an important disease in wild and cul-tured stocks of fish with the potential for severe negativeeconomic impact. The Canadian Aquaculture IndustryAlliance estimated the total direct and indirect costs ofinfectious diseases within the Canadian aquacultureindustry at over $400 M annually, with furunculosis con-tributing approximately $4 M annually to these losses [1].A. salmonicida is not limited to salmonids and many spe-cies of fish are affected. Several excellent reviews of A. sal-monicida and furunculosis are available [2-4].
Although Bergey's Manual of Systematic Bacteriology [5]recognizes five subspecies of A. salmonicida: salmonicida,achromogenes, masoucida, smithia, and pectinolytica, manylaboratories currently classify A. salmonicida subsp. salmo-nicida as "typical" and any isolate deviating phenotypi-cally as "atypical". Morphological and biochemicaldifferences are used to distinguish typical and atypical iso-lates. These are pigment production, colony size andgrowth rate, haemolysis, and sucrose fermentation[4,6,7]. A. salmonicida subsp. salmonicida (i.e. typical) iso-lates grow well on blood agar with large colonies, producebrown, diffusible pigment, are haemolytic and do not fer-ment sucrose. Historically, typical strains are thought tobe extremely homogenous [8,9], and therefore any devia-tion in any of these characteristics has been consideredenough evidence to classify a strain as "atypical" [8,10].However, some of these parameters are subjective, and arelargely based on the experience of the operator/microbiol-ogist, possibly leading to misclassification. Moleculartechniques are not yet used on a regular basis in many lab-oratories that type A. salmonicida. Although typical iso-lates are generally phenotypically homogenous somevariation does exist [10], particularly with regard to theproduction of hemolysin and degradation of casein. Anti-biotic resistance patterns have shown potential as epiz-ootiological markers in specific geographical origins.Typing schemes based on biochemical and other pheno-typic methods are dependent on many factors, includingplastic bacterial phenotypes and the often low consistencyof inter-laboratory testing [11].
Genetic analysis provides a more stable basis for micro-biological investigation than phenotypic methods. Sev-eral molecular techniques, including finger-printing byRandomly Amplified DNA Polymorphism (RAPD-PCR)[12,13], Amplified Fragment Length Polymorphism(AFLP) [14], Pulsed-Field Gel Electrophoresis (PFGE)[9,15], Restriction Enzyme Fragmentation Patterns(REFP) [16], plasmid profiling [17,18], and ribotyping[19,20], have been used to study different strains of A. sal-
monicida. While the results generally support the pheno-typical evidence that typical strains are geneticallyhomogenous and may well be clonal, and that atypicalisolates are heterogeneous, there is little congruencebetween the techniques in establishing relationshipsbetween subspecies, strains and isolates. Austin et al.[1998] showed that among 52 isolates of atypical A. sal-monicida taken from a wide host and geographical range,there was no agreement between PCR, RAPD, ribotyping,or phenotypic typing methods [8].
The use of genome arrays containing whole genomes orlarge sets of genes, either as a result of high-coveragegenome sequencing or selected after suppressive subtrac-tive hybridization have been used to study genome varia-bility among strains of bacterial pathogens, includingCampylobacter jejuni [21], Flavobacterium psychrophilum[22], Listeria monocytogenes [23], and Burkholderia species[24]. To examine the genomic diversity of virulence fac-tors among clinical isolates of A. salmonicida and otheraeromonads, we constructed a DNA microarray of 2024selected virulence-related genes from A. salmonicida subsp.salmonicida strain A449. A449 is a wild-type typical viru-lent clinical isolate which has been sequenced and it iscurrently undergoing annotation.
We are undertaking a research program to examine themolecular mechanisms of interaction between A. salmoni-cida and Atlantic salmon (Salmo salar L.). The applied goalof this program is to develop vaccines, vaccine deliverysystems and other health management tools. In order todevelop vaccines we must first identify virulence-associ-ated genes as potential vaccine candidates, the processknown as "reverse vaccinology" [25]. Accurate typing isimportant in searching for vaccine candidates if there areknown differences in pathogenicity of the sub-species, orif there is variation between the degree of conservation ofvirulence genes within each subspecies. Although all sub-species of A. salmonicida have been implicated in clinicalcases in fishes, Aeromonas salmonicida subsp. salmonicida ismore prevalent within salmonids and "typical" isolatesare more often associated with disease outbreaks insalmon [3]. Moreover, there are indications that there aredifferences in the susceptibility and immune response ofsalmonids and other fishes to "atypical" isolates [14,26].Therefore it is essential that any characterization or typingschemes be accurate, if health management strategies areto be based, even partly, on those schemes.
We used M-CGH to study the genetic relationshipsbetween Aeromonas species, subspecies and strains basedon gene conservation profiles and to examine genomicdiversity. We compared strains and isolates from selectedgeographic areas and host species to explore correlationsbetween geographic or host origin and conservation or
Page 2 of 15(page number not for citation purposes)

BMC Genomics 2006, 7:43 http://www.biomedcentral.com/1471-2164/7/43
diversity of genes. These strains were selected to provide adiverse sample of clinical and laboratory isolates from thediffering geographic regions and host species infected.Our goal was to identify a set of virulence-associated genesconserved across these strains to consider for future con-sideration as vaccine candidates. We hypothesized greatervariability of these virulence genes between subspeciesand no correlation between the "typical" and "atypical"classifications and gene variability. We also hypothesizedpositive correlation between the degree of variability andthe functional category of the variable genes involved.
ResultsComparative genomic hybridization (M-CGH) profilesfor each of the Aeromonas isolates listed in Table 1 wereobtained by competitively hybridizing labeled genomicDNA (gDNA) from the relevant isolate and from the A449control strain to an A. salmonicida microarray comprising2024 putative virulence genes, selected from a draftgenome sequence of the wild type strain A. salmonicidasubsp. salmonicida A449.
Hierarchical clustering of the seventeen Aeromonas isolatesbased on the overall variability in the M-CGH data is rep-resented by the dendrogram in Figure 1A. As expected, theten A. salmonicida subsp. salmonicida strains and the con-trol strain A449 clustered together. One atypical strain(N4705) also clustered in this group. There is very strongsupport (99%) for the clustering of the eleven A. salmoni-
cida subsp. salmonicida strains with the atypical strainN4705, but much lower bootstrap values for mostbranches within this main cluster. Figure 1B shows hierar-chical clustering of the seventeen Aeromonas samplesbased only on "chromosomal" genes, after genes assignedto the plasmid and transposon functional categories wereremoved. The ten A. salmonicida subsp. salmonicida strainscluster with A449 and the atypical strain N4705. In eachdendrogram, as expected, A. bestiarum and A. caviaeshowed the most divergence from the main cluster, fol-lowed by A. salmonicida subsp. masoucida and A. salmonic-ida subsp. achromogenes, consistent with the species/subspecies boundaries. It is interesting to note that one ofthe A. salmonicida atypical samples (N2517) clusteredwith A. salmonicida subsp. achromogenes, whereas the sec-ond atypical strain (N4705) clustered with the A. salmon-icida subsp. salmonicida A449 control strain. These resultssuggest that neither of these should be considered A. sal-monicida atypical strains.
The M-CGH data for the sixteen Aeromonas samplesordered with hierarchical clustering of the genes is shownin Figure 2. Genes were considered to be conserved if thesignal differed by less than a factor of two between thetester and the control (Log Ratios of between -1.0 and+1.0), as described by Taboada et al., 2004 [21]. The lowercutoff of -1.0 is fairly conservative as we have shown pre-viously that it encompasses over 99.5% of highly con-served genes but less than 1% of missing genes [27]. To
Table 1: Aeromonas strains analyzed by M-CGH in this study
Strain Species Host species Origin Source1
A449 A. salmonicida salmonicida Salmo trutta (brown trout) France CC4
ATCC 51108 A. bestiarum diseased fish Scotland CC5
ATCC 15468 A. caviae guinea pig France CC5
ATCC 33659 A. salmonicida achromogenes S. trutta USA CC5
N2517 A. salmonicida atypical Hippoglossus hippoglossus (Atlantic halibut) Norway CC6
N4705 A. salmonicida atypical Scophthalmus maximus (Turbot) Norway CC6
ATCC 27013 A. salmonicida masoucida Oncorhynchus masoucida (Masou salmon) Japan CC7
ATCC 33658 A. salmonicida salmonicida Salmo salar (Atlantic salmon) France CC7
ATCC 51413 A. salmonicida salmonicida S. trutta Finland CC7
80204-1 A. salmonicida salmonicida S. salar NB2 LD7
BC6129 A. salmonicida salmonicida S. salar BC3 CC8
N1718 A. salmonicida salmonicida S. salar Norway CC6
N2461 A. salmonicida salmonicida S. maximus Norway CC6
N2660 A. salmonicida salmonicida S. salar Norway CC6
N3395 A. salmonicida salmonicida S. salar Norway CC4
N4399 A. salmonicida salmonicida S. salar Norway CC6
SS70.1 A. salmonicida salmonicida Oncorhynchus kisutch (Coho salmon) NB2 LD7 [30]
1 Clinical Case (CC) or Lab-Derived (LD)2 New Brunswick, Canada (NB)3 British Columbia, Canada (BC)4 Dr. William Kay, University of Victoria, BC;5 American Type Culture Collection (ATCC)6 Norwegian Veterinary Institute, Oslo, Norway7 Dr. Gilles Olivier, Department of Fisheries and Oceans, Moncton, New Brunswick8 Dr. Joanne Constantine, BC Ministry of Agriculture, Food and Fisheries, Victoria, British Columbia
Page 3 of 15(page number not for citation purposes)

BMC Genomics 2006, 7:43 http://www.biomedcentral.com/1471-2164/7/43
Page 4 of 15(page number not for citation purposes)
Hierarchical clustering of Aeromonas strains based on M-CGH data for all genes on the microarrayFigure 1Hierarchical clustering of Aeromonas strains based on M-CGH data for all genes on the microarray. The dendro-gram was produced using the MEV software from TIGR with Euclidean distance and average linkage clustering (n = 1,000 boot-strap iterations). Isolates in bold are atypical isolates that cluster with other known subspecies. The bootstrap values which lead to their cluster assignment are also in bold. All ATCC type strains are denoted "ATCC", and unless otherwise noted, all other isolates are A. salmonicida subsp. salmonicida. (A) Sample clustering based on all genes on the AsalChip1 microarray. (B) Sample clustering based on genes not assigned to the plasmid or transposon functional categories (i.e. "chromosomal" genes).
A. bestiarum ATCC
A. caviae ATCC
A. salmonicida masoucida ATCC
A. salmonicida achromogenes ATCC
N2517 (atypical)
N2461
SS70.1
80204-1
A
N1718
A. salmonicida salmonicida ATCC 51413
BC6129
N3395
N2660
A449
N4705 (atypical)
A. salmonicida salmonicida ATCC 33658
N4399
91
90
44
94
99
23
29
37
63
94
99
90
84
100
90
A. salmonicida salmonicida ATCC 51413
N3395
BC6129
A. salmonicida salmonicida ATCC 33658
N2660
N1718
N4705 (atypical)
N4399
A. bestiarum ATCC
A. caviae ATCC
N2517 (atypical)
A. salmonicida masoucida ATCC
A. salmonicida achromogenes ATCC
A449
B
N2461
80204-1
SS70.1
95
87
89
91
69
61
80
52
79
44
86
100
61
83

BMC Genomics 2006, 7:43 http://www.biomedcentral.com/1471-2164/7/43
Page 5 of 15(page number not for citation purposes)
Variable genes in Aeromonas samplesFigure 2Variable genes in Aeromonas samples. Genes which were conserved (-1<Log Ratio <1) in all samples are removed. Red indicates genes with higher signal intensity for the tester than the control strain (higher copy number than strain A449). Green indicates genes with lower signal intensity for the tester than the control (divergent in sequence or missing or lower copy number). Gene order reflects results of hierarchical clustering of genes performed as described in Materials and Methods. The strains are ordered as in Figure 1, and unless otherwise noted, all other isolates are A. salmonicida subsp. salmonicida. aAsm – A. salmonicida subsp. masoucida, bAsa – A. salmonicida subsp. achromogenes, cAss – A. salmonicida subsp. salmonicida. (A) All genes which are divergent in at least one of the sixteen Aeromonas isolates. Blue bars indicate genes associated with the plasmid cate-gory and orange bars indicate genes associated with the transposon category as described in Material and Methods. (B) Subset of genes which are divergent (Log Ratio< -1) in the fourteen A. salmonicida strains and were not assigned to the plasmid or transposon functional categories. Genes predicted to code for OMPs (purple) and for flagella/pili proteins (grey) are indicated.
Asab
A. bestiarum
A. caviae
Asma
N2517 (atypical)N2461
Assc ATCC 51413 SS70.1N3395BC6129Assc ATCC 33658N2660
80204-1N1718
N4705 (atypical)N4399
Assc ATCC 33658
AB
Asab
Asma
N2517 (atypical)N2461
Assc ATCC 51413SS70.1N3395BC6129
N2660
80204-1N1718
N4705 (atypical)N4399

BMC Genomics 2006, 7:43 http://www.biomedcentral.com/1471-2164/7/43
highlight the variable genes, the Log Ratio value was set to0 (black) for conserved genes, and genes which were con-served in all of the samples have been removed. Geneswith Log Ratio values less than -1.0 (green) were consid-ered to be divergent in sequence or absent from the testerstrain, while those with Log Ratios values greater than
+1.0 (red) were expected to be present in higher copynumber in the tester than in the control strain. As shownin Figure 2A, clusters with the highest variability across thesamples correspond to plasmid- and transposon-associ-ated genes. As expected, A. bestiarum and A. caviae havehigher numbers of variable genes than the A. salmonicida
Table 2: Keywords from gene annotations used to identify virulence and virulence-associated genes, and assign functional categories
Keyworda Functional category Relevance
Aerolysin Toxin known virulence proteinantibiotic Antibiotic resistance antibiotic resistance/susceptibilitycapsule CHO/Surface factors capsule biosynthesis/transportcatalase Flagella/pilin; OMP catalase/peroxidaseschemotax IC protect; Toxin chemotaxis proteinschitin Other; Toxin chitinasecpa Flagella/pilin pilus assembly complexdismutase IC protect superoxide dismutaseextracel Other extracellular proteinsferr Iron systems; Transport; ferredoxins, ferric transportfimb Flagella/pilin fimbrial proteinsflag Flagella/pilin flagellar proteinsglycosyl CHO/Surface factors glycosyl transferaseshemolysin Toxin hemolysin/aerolysininvas OMP invasions or invasion/adhesioniron Iron systems; Transport iron transport/bindingLaf Flagella/pilin Vibrio parahaemolyticus chemotaxis proteinLfg Flagella/pilin V. parahaemolyticus flagellar hook proteinlip CHO/Surface factors lipid/lipoproteinmacrophage IC protect macrophage toxinsmembrane OMP outer/inner membrane proteinsOMP OMP outer membrane proteinspenicillin Antibiotic resistance penicillin resistanceperoxid IC protect ; Toxin peroxidasepil Flagella/pilin pilin/pilus assembly proteinplasmid Plasmid plasmid-encodedpolymer Sigma DNA polymerase/Sigma factorporin OMP outer membrane porin proteinprotease Other; Toxin proteasespseudopilin Secretion part of Type II secretion systempul Flagella/pilin part of Type II secretion systemquorum Other quorum sensing proteinsreceptor OMP membrane receptor proteinsresistance Antibiotic resistance antibiotic resistanceRTX Toxin RTX toxin (hemolysin)secret Secretion secretion systems/secretory proteinssial CHO/Surface factors; Other; sialic acid transport/synthetasesiderophore OMP siderophore receptorsigma Sigma sigma factorSOD IC protect superoxide dismutasesuperoxide IC protect superoxide dismutaseTad Flagella/pilin Vibrio spp. pilus assembly proteintap Other; Transport ABC transporter/ATP-binding proteintoxin Toxin toxin genestransferase CHO/Surface factors; Other glycosyl and other transferasestransport Transport transport proteinstranspos Transposon transposasesusher Flagella/pilin chaperone/usher type fimbriaeYop Secretion Type III Secretion system gene in Yersinia spp.
aor portions of keywords selected to include grammatical variants, e.g. invas would select invasion or invasins, etc.
Page 6 of 15(page number not for citation purposes)

BMC
Gen
omic
s 20
06, 7
:43
http
://w
ww
.bio
med
cent
ral.c
om/1
471-
2164
/7/4
3
Page
7 o
f 15
(pag
e nu
mbe
r not
for c
itatio
n pu
rpos
es)
Table 3: Number of divergent genes (Log Ratio <-1) in each strain for each functional category
A. salmonicida subsp. salmonicida A. salmonicida atypical
Functional category: Abea Acab Asac Asmd 33658 51413 80204-1 BC6129 N1718 N2461 N2660 N3395 N4399 SS70.1 N2517 N4705
Antibiotic resist 11 14 7 5 0 0 0 0 0 0 0 4 0 6 3 0
CHO/surface 30 36 20 18 4 3 3 4 3 6 3 7 3 9 14 0
Flagella/pilin 50 30 29 12 1 1 0 0 0 1 1 1 1 2 16 0
IC protect 3 3 1 1 0 0 0 0 0 0 0 0 0 0 0 0
Iron systems 16 15 7 6 0 0 0 0 0 1 0 2 0 2 5 0
OMP 53 56 33 21 6 4 5 1 3 8 1 4 1 16 22 2
Other 24 43 22 13 4 3 3 3 3 4 3 3 3 7 18 0
Plasmid 28 25 8 10 0 0 0 0 3 4 0 5 1 4 6 0
Secretion 22 17 4 7 1 0 0 1 0 1 0 4 0 6 2 0
Sigma 5 7 3 2 0 0 0 0 0 0 0 1 1 1 2 0
Toxin 15 19 6 5 0 0 0 0 0 1 0 0 0 2 6 0
Transport 51 59 39 19 3 4 0 0 1 5 0 6 0 15 31 1
Transposon 119 99 54 62 6 4 6 4 11 36 6 13 7 6 50 2
Total 326 321 187 144 17 12 11 7 18 57 7 36 10 49 136 4
aAbe – A. bestiarumbAca – A. caviaecAsa – A. salmonicida subsp. achromogenesdAsm – A. salmonicida subsp. masoucida

BMC Genomics 2006, 7:43 http://www.biomedcentral.com/1471-2164/7/43
strains. Figure 2B shows the subset of genes that are notassociated with transposons or plasmids but are divergentin at least one of the fourteen A. salmonicida samples.These divergent "chromosomal" genes show some cluster-ing of genes coding for outer membrane proteins and flag-ella/pili.
The number of genes divergent or absent according to thefunction categories assigned in Table 2 and by species/strain is presented in Table 3. The highest degree of diver-gence compared to A449 can be seen for A. caviae and A.bestiarum, followed by the type strains of A. salmonicidasubspp. masoucida and achromogenes as well as one of the
Variability of genes associated with plasmids and transposons in 16 Aeromonas strains and speciesFigure 3Variability of genes associated with plasmids and transposons in 16 Aeromonas strains and species. Red indicates genes with higher signal intensity for the tester than the control strain (higher copy number than in strain A449). Green indi-cates genes with lower signal intensity for the tester than the control (divergent in sequence or missing or at lower copy number). Gene order reflects results of hierarchical clustering of genes performed as described in Materials and Methods. The strains are ordered as in Figure 1, and unless otherwise noted, all other isolates are A. salmonicida subsp. salmonicida. aAsm – A. salmonicida subsp. masoucida, bAsa – A. salmonicida subsp. achromogenes, cAss – A. salmonicida subsp. salmonicida. (A) All genes from the plasmid functional category. The blue bars (both light and dark) indicate genes found on plasmid 5, and the dark blue bars correspond to predicted TTSS genes. (B) All genes from the transposon functional category. The orange bars indicate genes with strong sequence similarity to known transposases.
A BA
. b
estia
rum
A.
cavia
e
N25
17 (
atyp
ical
)
N24
61
Ass
cA
TC
C 5
1413
S
S70
.1N
3395
BC
6129
Ass
cA
TC
C 3
3658
N
2660
8020
4-1
N17
18
N47
05 (
atyp
ical
)
N43
99
Asa
b
A.
bestia
rum
A.
cavia
e
N25
17 (
atyp
ical
)N
2461
Ass
cA
TC
C 5
1413
S
S70
.1N
3395
BC
6129
Ass
cA
TC
C 3
3658
N26
60
8020
4-1
N17
18
N47
05 (
atyp
ical
)
N43
99
Asm
a
Asm
a
Asa
b
Page 8 of 15(page number not for citation purposes)
BMC Genomics 2006, 7:43 http://www.biomedcentral.com/1471-2164/7/43
Page 9 of 15(page number not for citation purposes)
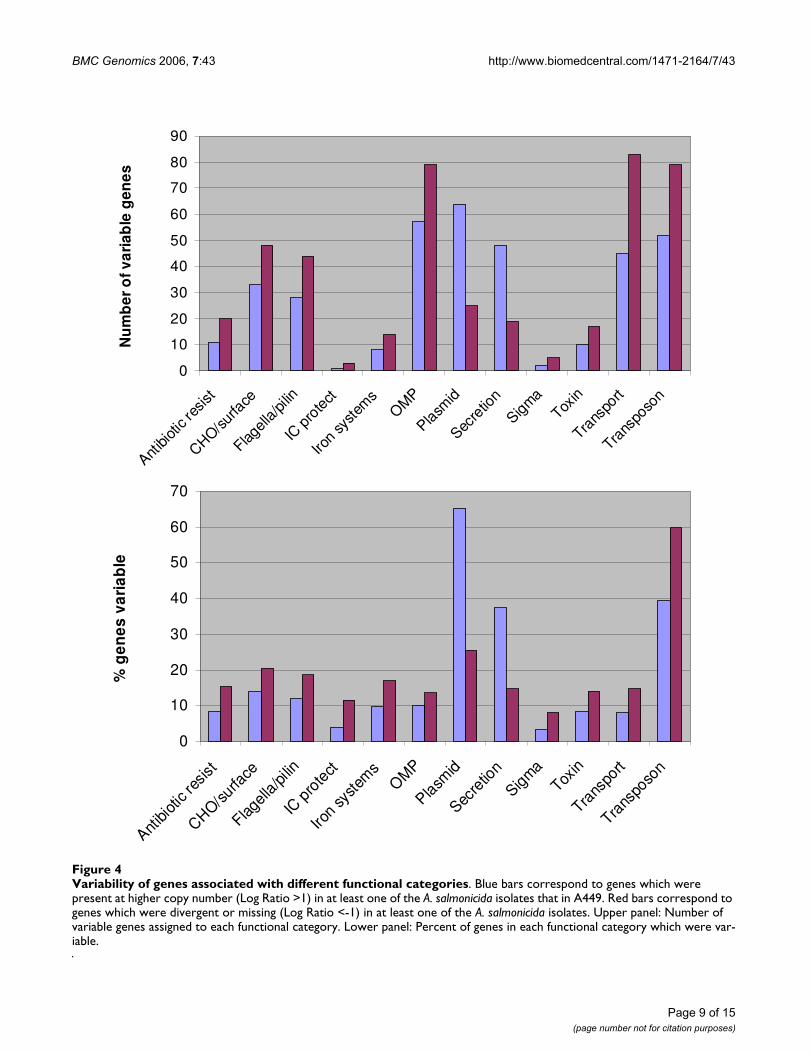
Variability of genes associated with different functional categoriesFigure 4Variability of genes associated with different functional categories. Blue bars correspond to genes which were present at higher copy number (Log Ratio >1) in at least one of the A. salmonicida isolates that in A449. Red bars correspond to genes which were divergent or missing (Log Ratio <-1) in at least one of the A. salmonicida isolates. Upper panel: Number of variable genes assigned to each functional category. Lower panel: Percent of genes in each functional category which were var-iable.
0
10
20
30
40
50
60
70
80
90
Antibiotic
resist
CHO/s
urfa
ce
Flagel
la/p
ilin
IC p
rote
ct
Iron s
yste
ms
OM
P
Plasm
id
Secre
tion
Sigm
a
Toxin
Trans
port
Trans
poso
n
Nu
mb
er
of
va
ria
ble
ge
ne
s
0
10
20
30
40
50
60
70
Antibio
tic re
sist
CHO/s
urface
Flagel
la/p
ilin
ICpro
tect
Iron s
yste
ms
OM
P
Plasm
id
Secre
tion
Sigm
a
Toxin
Trans
port
Trans
poso
n
% g
en
es
va
ria
ble

BMC Genomics 2006, 7:43 http://www.biomedcentral.com/1471-2164/7/43
atypical samples (N2517). There was much less variationbetween the A. salmonicida subsp. salmonicida strains andthe other A. salmonicida atypical strain (N4705). Of the A.salmonicida subsp. salmonicida strains, N2461, isolatedfrom turbot, and SS70.1, the only isolate from a Pacificsalmon species (coho salmon), showed the highest degreeof variability among chromosomal genes. These data not-withstanding, there does not appear to be a strong corre-lation between the level of genomic variability and eitherhost or geographical origin.
The M-CGH data for genes associated with mobile ele-ments (plasmids and transposons) in the sixteen Aerom-onas samples is shown in Figure 3. Hierarchical clusteringof the plasmid-associated genes (Figure 3A) shows cluster-ing of highly variable genes matching a known plasmid of~155 kb [plasmid 5, M. Reith – unpublished data]. A sub-set of genes on this plasmid matches type three secretionsystem (TTSS) genes found in other bacteria, which isunsurprising considering that TTSS genes can be plasmid-borne in A. salmonicida subsp. salmonicida [28]. Weobserved genomic variability consistent with the lowerintensity signal for some plasmid genes, including TTSSgenes, for several strains (Figure 3A). Of these, the strainSS70.1 is an avirulent, laboratory-derived strain created bytreating an A. salmonicida subsp. salmonicida strain withethidium bromide [29,30]. This likely resulted in the lossof at least one plasmid [data not shown], which wouldcontribute to this observation. On the other hand, manygenes on plasmid 5 appear to be present in higher copynumber in many of the tester strains than in A449. Figure3B shows the M-CGH data for genes associated with trans-posons. Many of these genes appear to be highly diver-gent, present at lower copy number, or missing in varioustester strains, and many of the genes match known trans-posases.
The number of variable genes assigned to each functionalcategory is shown in Figure 4, as well as the percent ofgenes in each category that were observed to be variable.Within the function categories other than transposon orplasmid, most genes that appeared to be divergent ormissing in various Aeromonas strains are associated withtransport, surface carbohydrate biosynthesis, outer mem-brane, and flagella/pili proteins. In contrast, genes associ-ated with secretion were most likely to be present inhigher copy numbers in the tester strains compared toA449. In summary, the highest degree of variability wasseen in Aeromonas genes associated with mobile elements:the plasmids or the transposons, whereas genes within thechromosome of the bacterium displayed the lowest levelof variability.
DiscussionIn this study, patterns of variability of the 2024 selectedvirulence-associated genes of A. salmonicida subsp. salmo-nicida strain A449 within the sixteen various test isolatesof A. salmonicida and other Aeromonas species were exam-ined. It is noteworthy that genes divergent and absent insome tester strains seem to be distributed across the entireA449 genome sequence and across all the predicted func-tional categories whereas genes shown to be at highercopy number than in the reference strain were clustered inselected loci associated with plasmids. The number ofdivergent and absent genes correlated strongly with spe-cies and subspecies boundaries. For A. bestiarum and A.caviae ~16% of the genes were divergent or missing,whereas for the achromogenes and masoucida subspecies~8% of the genes were divergent or missing. The rangeacross the various A. salmonicida subsp. salmonicida strainswas between 0.3% and 2%, again reinforcing the singleclone theory for this species. Overall, for the 14 A. salmo-nicida isolates studied, approximately 19% of the geneswere divergent in at least one sample. For comparison, ourprevious meta-analysis of M-CGH studies of 97 strains ofC. jejuni showed ~33% of the genes in the genome weredivergent in at least one strain [21]. It is likely that as weexamine more strains of A. salmonicida the number ofdivergent genes will increase. One interesting finding isthat almost 70% of the virulence-associated genes on theDNA microarray are conserved across all the Aeromonasspecies. Because more than 80% of these highly conservedgenes appear to be chromosomal, this suggests that thedivergence of A. bestiarum, A. caviae, and A. salmonicidamay have occurred fairly recently.
The majority of A. salmonicida subsp. salmonicida isolatesstudied were isolated from Atlantic salmon and gavehomogenous results, i.e., there is no correlation betweenhost or geographic origin and M-CGH patterns in subsp.salmonicida isolates. Highest variability amongst thesubsp. salmonicida isolates was observed in an isolate(SS70.1) from coho salmon and in an isolate (N2461)from turbot. However, more isolates from Pacific salmonshould be analyzed before drawing definite conclusionson the variation between isolates from Atlantic and Pacificsalmon. The relatively low number of divergent genes inmost of the A. salmonicida subsp. salmonicida strains sup-ports the findings of Garcia et al. who identified a singleclone of A. salmonicida subsp. salmonicida as responsiblefor most outbreaks of disease worldwide [9].
Differentiation of typical and atypical strains of A. salmo-nicida is important economically if it can be shown thatthere are significant differences in the degree of variationin the genes associated with virulence and pathogenicity,and which affect the immune response of the host. If thisis the case, then accurate typing methods and differentia-
Page 10 of 15(page number not for citation purposes)

BMC Genomics 2006, 7:43 http://www.biomedcentral.com/1471-2164/7/43
tion between typical and atypical strains and subspeciesare required for diagnostic methods and for vaccine devel-opment. Lund et al. have shown variation in the protectiveability of some commercial furunculosis vaccines (wholebacterins made with typical strains) against atypicalstrains infecting farmed spotted wolffish [14] and halibut(cited in [14]). In this context, M-CGH provides an objec-tive means to type clinical isolates based upon the pres-ence, absence or divergence of a large number of genes.
Phenotypical variation amongst subsp. salmonicida iso-lates is rare but has been described [31]. The increased res-olution of M-CGH compared to phenotypic typing can beillustrated on consideration of strain N4705 which wasconsidered an atypical strain on phenotypical grounds.However, both M-CGH and subsequent pulsed-field gelelectrophoresis [Colquhoun, unpublished results] suggestthat this strain is very closely related to, and should per-haps more accurately be considered a typical strain. Simi-larly, atypical strain N2517, may be more accuratelyplaced within the subspecies achromogenes based upon M-CGH results.
Further comparative studies will be required to establishthe level of strain resolution capable by M-CGH foraeromonads. However, in the absence of completegenome sequence data for each Aeromonas strain used, M-CGH, which in this study uses over 2,000 separate geneticmarkers, represents a comprehensive, high- resolutionmethodology for comparing genome information. Recentwork by our group used M-CGH to examine the quantita-tive relationship between the Log Ratio and probe/targetidentity, and these analytical processes were used in thestudy [27].
It is preferable that vaccine candidates be strongly con-served among strains that cause disease. The M-CGH datafrom these experiments will provide a list of conservedgenes, sorted by function category, which can be furtheranalyzed to generate these candidates. For example, thereare bioinformatics programs available to predict sub-cel-lular location [32] to select candidates which may beexposed to the host immune system, or to predict adhes-ins [33]. These downstream analyses, in combinationwith M-CGH analysis will reduce the number of genesrequired to be cloned in order to test the immuneresponse of their encoded proteins. These experiments arecurrently underway.
It must be noted that M-CGH does not reveal informationabout gene expression or the specific role of targeted genesin pathogenicity or host immune responses. However, it isa powerful tool in reverse vaccinology and M-CGH is asensitive and comprehensive technique that can deter-mine genomic variation between pathogen strains, and it
also can be used as a screening tool for target identifica-tion, and/or a typing method.
ConclusionM-CGH is a powerful first screen for vaccine target identi-fication, and is the basis of reverse vaccinology [25], as itfacilitates identification of conserved and duplicatedgenes associated with virulent strains. This technique mayalso prove useful in strain typing and epidemiologicalstudies.
Comparative analysis of genomic data of A. salmonicidaand related organisms reveals candidates common to allclinical isolates or those strains shown to be associatedwith virulence and disease. Our work on knock-outmutants of A449 virulence genes, combined with pro-teomic analysis of selected isolates confirm the results ofour M-CGH analyses and will enable us to select specificantigens for vaccine development [work in progress].
The findings reported here support our initial hypothesesthat variability exists between subspecies, that there is nocorrelation between 'typical' and 'atypical' classificationsand gene variability. We also found that there is a positivecorrelation between the degree of variability and the func-tional category of the genes involved.
Future work will include the use of microarray transcriptprofiling experiments to further focus the choice of targetgenes. This will allow us to develop an ongoing, dynamiclist of vaccine candidates to be used in live challenges forvirulence and protection assays and then in further vac-cine development.
MethodsBacterial strainsIsolates of Aeromonas spp. used in this study are presentedin Table 1. The isolates were characterized as belonging toeither typical or atypical groups using a limited number ofbiochemical tests and phenotypical characteristics.Important characteristics for differentiation were growthrates, colony size, production of brown diffusible pig-ment, hemolysin production, and to a lesser extent, pro-duction of acid from sucrose. The reference strain, A449 isa wild-type isolate of A. salmonicida subsp. salmonicida,kindly donated by Dr. William Kay, University of Victoria,British Columbia. All strains were grown on Tryptic SoyAgar (TSA, Difco) at 18°C for 24–48 hours beforegenomic DNA isolation.
Selection of genes for DNA microarray constructionThe draft genome sequence of A. salmonicida strain A449[available upon request from the National ResearchCouncil of Canada, Institute for Marine Biosciences] wasused as a source of the genes used in this study. ORFs were
Page 11 of 15(page number not for citation purposes)

BMC Genomics 2006, 7:43 http://www.biomedcentral.com/1471-2164/7/43
identified using the Glimmer software package [34], andused to search for homologs among the bacterial genesubset of Genbank [35] using the BLASTP program [36].We selected 2024 ORFs for inclusion on a DNA microar-ray based upon one or more of the following criteria:
i) Similarity to known virulence factors from other bacte-ria based on visual examination of the BLASTP analysis ofthe A. salmonicida genome.
ii) Presence of "virulence-associated keywords" within thegene annotations of homologs returned from BLASTPanalysis. These keywords and their associated functionalcategories are described in Table 2.
iii) Similarity to genes in the National University of Singa-pore Fish Pathogen Database [37].
DNA sequences corresponding to plasmids pAsa1, pAsa2and pAsa3 were excluded from our microarray becausethey only had genes for self-existence, and no virulencefactors [38]. Sequences corresponding to two then-newly-discovered plasmids (plasmids 4–5), which had not beenfully characterized at the time the draft sequence wasobtained, are included in the DNA microarray.
Construction of an Aeromonas salmonicida A449 amplicon-based DNA microarrayPCR primers were designed successfully for each of the2024 ORFs described above using the Primer3 program[39] controlled by an automated script as described previ-
Variation in hybridization signal intensity with amplicon lengthFigure 5Variation in hybridization signal intensity with amplicon length. The average signal intensity in the control channel is plotted versus amplicon size. The amplicons were "binned" in 50 bp increments (to 1900 bp) then in 200 bp increments (from 2000 to 3000 bp). There were only 4 amplicons of size over 3000 bp.
0
5000
10000
15000
20000
25000
30000
35000
40000
0 500 1000 1500 2000 2500 3000 3500
AmpSize (nt)
Av
era
ge
Sig
na
l In
ten
sit
y
Page 12 of 15(page number not for citation purposes)

BMC Genomics 2006, 7:43 http://www.biomedcentral.com/1471-2164/7/43
ously [21]. Primer-selection parameters were standardizedand included a similar predicted melting temperature (62± 3°C), uniform length (21 nt), and a minimum ampli-con size of 160 bp. The average amplicon size was 890 bp(range 164 to 4268 bp). Generation of PCR ampliconsand fabrication of DNA microarrays were as described[21]. Details on the construction of this microarray(AsalChip1) are available [40].
Genomic DNA labellingGenomic DNA was isolated as described [21], and frag-mented by nebulization [41]. 100 µg of DNA in nebuliza-tion buffer [10 mM Tris; 1 mM EDTA (pH 8.0), 35%glycerol (v/v)] was placed in the chamber of an AeroMistNebulizer (IPI Medical Products, Chicago, IL), andsheared by passing nitrogen gas through the chamber at15 psi for 1 minute. The DNA was precipitated with etha-nol and suspended in 100 µl of 10 mM Tris; 1 mM EDTA(pH 8.0). Typically, the DNA was fragmented to a range of0.4 to 12 kb in size. 5 µg of fragmented gDNA were fluo-rescently labelled using direct chemical coupling with theLabel-IT (Mirus Corp., Madison, WI) cyanine dyes Cy3and Cy5 as recommended by the manufacturer. Probeswere purified from unincorporated dyes by sequentiallypassing samples through SigmaSpin (Sigma, Oakville,ON) and Qiaquick (Qiagen, Mississauga, ON) columns.Labelled DNA sample yields and dye incorporation effi-ciencies were calculated using the Nanodrop ND-1000spectrophotometer (Nanodrop, Rockland, DE).
Microarray hybridizationsThe hybridization profile for each strain was obtained byco-hybridizing labelled DNA from the tester strain andfrom the A. salmonicida A449 (control) strain to ourmicroarray. DNA from tester strains was labelled with Cy5and the control strain with Cy3. Dye swaps were per-formed on selected strains to test for potential dye-incor-poration bias. Labelled samples were normalized byselecting tester/control sample pairs with similar dyeincorporation efficiencies. Equivalent amounts (1 to 2 µg)of labelled tester and control samples were pooled,lyophilized, and then re-suspended in 35 µl of hybridiza-tion buffer [1 × DIGEasy hybridization solution (Roche,Laval, QC); 0.5 µg/µl of torulla yeast tRNA]. Probes weredenatured at 65°C for 5 minutes and applied to themicroarray. Hybridizations were performed overnight at37°C under 24 × 42-mm glass cover slips in a high-humidity chamber. Microarrays were washed 2 × 5 min-utes at 50°C in 1 × SSC with 0.1% SDS, then 2 × 5 minutesat 50°C in 0.5 × SSC, and 1 × 5 minutes at 50°C in 0.1 ×SSC. Slides were spun dry (500 × g, 5 minutes) and storedin lightproof containers until scanned.
Data acquisition and analysisMicroarrays were scanned using a Chipreader laser scan-ner (BioRad, Mississauga, ON) according to the manufac-turer's recommendations. Spot quantification, signalnormalization and data visualization were performedusing the program ArrayPro Analyzer (version 4.5; MediaCybernetics, Silver Spring, MD). Net signal intensitieswere obtained by performing local-ring background sub-traction. "Tester signal" is defined as the signal intensity ofthe selected Aeromonas isolates labeled with appropriatefluorescent dye, while "control signal" is defined as thesignal intensity of A. salmonicida strain A449 labelled withits appropriate fluorescent dye. The control signalincreases with increasing amplicon size as shown in Fig-ure 5. The ratio of tester signal to control signal for eachgene was transformed to its base 2 logarithm [42], log2[Tester Signal/Control Signal], referred to as "Log Ratio".Data from each channel were adjusted using cross-chan-nel Loess normalization of the Log Ratio data and lowintensity and anomalous spots were flagged and removed.Data was stored and archived using the BASE BioArraySoftware Environment [43].
Technical variation in our methodology was tested byselecting a subset of strains for replicate hybridizations,and treating the data from replicates separately through-out the various analyses. Consistency in the data wasassessed by direct comparison of the lists of variable genesobtained from each replicate. Microarray data from sets ofhybridizations were exported from BASE after removal offlagged spots, Loess normalization and averaging of datafrom duplicate spots. Filtering of genes based on the func-tional categories described in Table 2 was applied asrequired, and the results were analyzed using the MEVsoftware package from TIGR [44,45]. Visualization andhierarchical clustering of microarray data, using EuclideanDistance metrics and Average Linkage Clustering, was per-formed in MEV using algorithms developed by Eisen et al.[46]. We generated sample trees as well as support treesbased on bootstrapping genes with 1000 iterations toexamine the variation of CGH profiles between the differ-ent isolates.
Identification of plasmid and TTSS genesChromosomal and plasmid genes present on the arrayhad not been distinguished from each other in the origi-nal construction phase. When the sequences of plasmids4–5 became available, i.e. were separated from the chro-mosomal genome assembly as it progressed, the BLASTsoftware package [47] was used to compare the nucleotidesequences of all ORFs on the A. salmonicida microarraychip to the sequences of plasmids 4–5, and thus identifythem. We also created a database of all known bacterialTTSS genes and used BLAST to identify ORFs within the A.salmonicida genome sequence with high similarity to these
Page 13 of 15(page number not for citation purposes)

BMC Genomics 2006, 7:43 http://www.biomedcentral.com/1471-2164/7/43
genes. These results were used to generate gene lists foruploading into MEV to characterize observed gene clus-ters.
List of abbreviationsM-CGH: microarray-based comparative genomic hybridi-zation; gDNA: genomic DNA; ORF: open reading frame;nt: nucleotides; psi: pounds per square inch
Authors' contributionsJHEN co-led the conception and design of the study, con-tributed to the design of the microarray, participated inthe interpretation of data, drafted and co-wrote the man-uscript. WAF carried out analysis and interpretation ofmicroarray data, produced the figures, assisted in produc-tion of the microarray, and contributed to writing themanuscript. CCL and OLM performed microarray hybrid-izations, generated microarray data, and assisted in pro-duction of the microarray. SJF identified the genes andperformed the annotation of the draft version of genome.ENT participated in the design of the study and interpre-tation of data. CDC participated in the design of the studyand performed microarray hybridizations. JMB partici-pated in the selection of virulence targets for the array, andcontributed to writing the manuscript. DJC provided sev-eral strains, participated in the interpretation of data, andin the writing of the manuscript. MER provided the draftsequence of the genome, and contributed to writing themanuscript. LLB co-led the conception and design ofstudy, designed and built the DNA microarray, partici-pated in the interpretation of data, drafted and co-wrotethe manuscript. All authors submitted comments ondrafts, and read and approved the final manuscript.
AcknowledgementsFunding for this work has been provided to LLB, JMB, WAF, OLM, JHEN, MER, and ENT through the National Research Council Genomics and Health Initiative. The expert technical assistance of Sandra Sperker, Darren Sarty and Brian Agnew is appreciated. We are grateful to Dr. William Kay (University of Victoria, Victoria, BC) for his kind donation of the A449 strain and to Dr. Gilles Olivier (Fisheries and Oceans Canada, Moncton, NB) and Dr. Joanne Constantine (BC Ministry of Agriculture, Food, and Fisheries, Victoria, BC), for their kind donations of A. salmonicida clinical iso-lates. We thank Dr. Kyoung Park for critically reviewing the manuscript. This is NRC Publication # 2005-42556.
References1. Canadian Aquaculture Industry Alliance 2006 [http://
www.aquaculture.ca/EnglishWeb.html].2. E-M B: Furunculosis: the history of the diseases and of disease
research. In Furunculosis - Multidisciplinary Fish Disease ResearchEdited by: Bernoth EM, A.E. E, P.J M, G. O and P. S. London, AcademicPress; 1997:1-20.
3. Hiney M, Olivier G: Furunculosis (Aeromonas salmonicida). InFish Diseases and Disorders III: Viral, Bacterial and Fungal Infections Editedby: Woo PTK and Bruno DW. Oxford, CAB Publishing;1999:341-425.
4. Wiklund T, Dalsgaard I: Occurrence and significance of atypicalAeromonas salmonicida in non-salmonid and salmonid fishspecies: a review. Dis Aquat Organ 1998, 32:49-69.
5. Garrity GM, Winters M, Searles DB: Taxonomic outline of theprocaryotic genera. In Bergey's Manual of Systematic BacteriologyNew York, Sprimger Verlag; 2001:1-39.
6. K.H. B, H. F, H-J. S, W K: Aeromonas salmonicida from salmo-nids and cyprinids - serological and cultural identification. JVet Med 1986, B33:777-783.
7. McCarthy DH, Roberts RJ: Furunculosis in fish - the presentstage of our knowledge. In Advances in Aquatic Microbiology Editedby: Droop MR and Jannasch HW. London, Academic Press;1980:293-341.
8. Austin B, Austin DA, Dalsgaard I, Gudmundsdottir BK, Hoie S, Thorn-ton JM, Larsen JL, O'Hici B, Powell R: Characterization of atypicalAeromonas salmonicida by different methods. Syst Appl Micro-biol 1998, 21:50-64.
9. Garcia JA, Larsen JL, Dalsgaard I, Pedersen K: Pulsed-field gel elec-trophoriesis analyis of Aeromonas salmonicida ssp. salmoni-cida. FEMS Microbiol Lett 2000, 190:163-166.
10. Dalsgaard I, Nielsen B, Larsen JL: Characterization of Aerom-onas salmonicida subsp. salmonicida: a comparative study ofstrains of different geographic origin. J Appl Bacteriol 1994,77:21-30.
11. Dalsgaard I, Gudmundsdottir BK, Helgason S, Hoie S, Thoresen OF,Wichardt UP, Wiklund T: Identification of atypical Aeromonassalmonicida: inter-laboratory evaluation and harmonizationof methods. J Appl Microbiol 1998, 84:999-1006.
12. Miyata M, Aoki T, Inglis V, Yoshida T, Endo M: RAPD analysis ofAeromonas salmonicida and Aeromonas hydrophila. J ApplBacteriol 1995, 79:181-185.
13. Inglis V, Colquhoun D, Pearson MD, Miyata M, Aoki T: Analysis ofDNA relationships among Aeromonas species by RAPD(randomly amplified polymorphic DNA) typing. AquacultureInternational 1996, 4:43-53.
14. Lund V, Espelid S, Mikkelsen H: Vaccine efficacy in spotted wolff-ish Anarhichas minor: relationship to molecular variation inA-layer protein of atypical Aeromonas salmonicida. Dis AquatOrgan 2003, 56:31-42.
15. O'Hici B, Olivier G, Powell R: Genetic diversity of the fish path-ogen Aeromonas salmonicida demonstrated by randomamplified polymorphic DNA and pulsed-field gel electro-phoresis analyses. Dis Aquat Organ 2000, 39:109-119.
16. Whittington RJ, Djordjevic SP, Carson J, RB C: Restriction endonu-clease analysis of atypical Aeromonas salmonicida isolatesfrom goldfish Carassius auratus, silver perch Bidyanus bidy-anus, and greenback flounder Rhombosolea tapirina in Aus-tralia. Dis Aquat Org 1995, 22:185-191.
17. Sørum H, Kvello JH, Hastein T: Occurrence and stability of plas-mids in Aeromonas salmonicida subsp. salmonicida isolatedfom salmonids with furunculosis. Dis Aquat Org 1993,16:199-206.
18. Sørum H, Holstad G, Lunder T, Hastein T: Grouping by plasmidprofiles of atypical Aeromonas salmonicida isolated fromfish, with special reference to salmonid fish. Dis Aquat Organ2000, 41:159-171.
19. Hanninen ML, Hirvela-Koski V: Molecular and phenotypic meth-ods for the characterization of atypical Aeromonas salmon-icida. Vet Microbiol 1997, 56:147-158.
20. Nielsen B, Olsen JE, Larsen JL: Ribotyping of Aeromonas salmo-nicida subsp. salmonicida. Dis Aquat Org 1994, 18:155-158.
21. Taboada EN, Acedillo RR, Carrillo CD, Findlay WA, Medeiros DT,Mykytczuk OL, Roberts MJ, Valencia CA, Farber JM, Nash JH: Large-scale comparative genomics meta-analysis of Campylo-bacter jejuni isolates reveals low level of genome plasticity. JClin Microbiol 2004, 42:4566-4576.
22. Soule M, Cain K, LaFrentz S, Call DR: Combining suppressionsubtractive hybridization and microarrays to map theintraspecies phylogeny of Flavobacterium psychrophilum.Infect Immun 2005, 73:3799-3802.
23. Borucki MK, Kim SH, Call DR, Smole SC, Pagotto F: Selective dis-crimination of Listeria monocytogenes epidemic strains by amixed-genome DNA microarray compared to discrimina-tion by pulsed-field gel electrophoresis, ribotyping, and mul-tilocus sequence typing. J Clin Microbiol 2004, 42:5270-6.
24. Ong C, Ooi CH, Wang D, Chong H, Ng KC, Rodrigues F, Lee MA,Tan P: Patterns of large-scale genomic variation in virulentand avirulent Burkholderia species. Genome Res 2004,14:2295-2307.
Page 14 of 15(page number not for citation purposes)

BMC Genomics 2006, 7:43 http://www.biomedcentral.com/1471-2164/7/43
Publish with BioMed Central and every scientist can read your work free of charge
"BioMed Central will be the most significant development for disseminating the results of biomedical research in our lifetime."
Sir Paul Nurse, Cancer Research UK
Your research papers will be:
available free of charge to the entire biomedical community
peer reviewed and published immediately upon acceptance
cited in PubMed and archived on PubMed Central
yours — you keep the copyright
Submit your manuscript here:http://www.biomedcentral.com/info/publishing_adv.asp
BioMedcentral
25. Rappuoli R: Reverse vaccinology, a genome-based approach tovaccine development. Vaccine 2001, 19:2688-2691.
26. Bricknell IR, Bowden TJ, Verner-Jeffreys DW, Bruno DW, Shields RJ,Ellis AE: Susceptibility of juvenile and sub-adult Atlantic hali-but (Hippoglossus hippoglossus L.) to infection by Vibrioanguillarum and efficacy of protection induced by vaccina-tion. Fish Shellfish Immunol 2000, 10:319-327.
27. Taboada EN, Acedillo RR, Luebbert CC, Findlay WA, Nash JH: Anew approach for the analysis of bacterial microarray-basedComparative Genomic Hybridization: insights from anempirical study. BMC Genomics 2005, 6:78.
28. Stuber K, Burr SE, Braun M, Wahli T, Frey J: Type III secretiongenes in Aeromonas salmonicida subsp salmonicida arelocated on a large thermolabile virulence plasmid. J Clin Micro-biol 2003, 41:3854-3856.
29. Burr SE, Wahli T, Segner H, Pugovkin D, Frey J: Association ofType III secretion genes with virulence of Aeromonas salmo-nicida subsp. salmonicida. Dis Aquat Org 2003, 57:167-171.
30. Hackett JL, Lynch WH, Paterson WD, Coombs DH: ExtracellularProtease, Extracellular Haemolysin, and Virulence inAeromonas salmonicida. Can J Fish Aquat Sci 1984, 41:1354-1360.
31. Koppang EO, Fjølstad M, Melgård B, Vigerust M, Sørum H: Non-pig-ment-producing isolates of Aeromonas salmonicida subspe-cies salmonicida: isolation, identification, transmission andpathogenicity in Atlantic salmon, Salmo salar L. Journal of FishDiseases 2000, 23:39-48.
32. Gardy JL, Laird MR, Chen F, Rey S, Walsh CJ, Ester M, Brinkman FS:PSORTb v.2.0: expanded prediction of bacterial protein sub-cellular localization and insights gained from comparativeproteome analysis. Bioinformatics 2005, 21:617-623.
33. Sachdeva G, Kumar K, Jain P, Ramachandran S: SPAAN: a softwareprogram for prediction of adhesins and adhesin-like proteinsusing neural networks. Bioinformatics 2005, 21:483-491.
34. Delcher AL, Harmon D, Kasif S, White O, Salzberg SL: Improvedmicrobial gene identification with GLIMMER. Nucleic Acids Res1999, 27:4636-4641.
35. National Center For Biotechnology Information's Prokaryo-tic Genomes Database [http://www.ncbi.nlm.nih.gov/genomes/lproks.cgi]
36. Altschul SF, Madden TL, Schaffer AA, Zhang J, Zhang Z, Miller W, Lip-man DJ: Gapped BLAST and PSI-BLAST: a new generation ofprotein database search programs. Nucleic Acids Res 1997,25:3389-3402.
37. Fish Pathogen Database 2006 [http://dbsdb.nus.edu.sg/fpdb/index.html].
38. Boyd J, Williams J, Curtis B, Kozera C, Singh R, Reith M: Threesmall, cryptic plasmids from Aeromonas salmonicida subsp.salmonicida A449. Plasmid 2003, 50:131-144.
39. Rozen S, Skaletsky H: Primer3 on the WWW for general usersand for biologist programmers. Methods Mol Biol 2000,132:365-86.
40. AsalChip Description 2006 [http://www.ibs-isb.nrc-cnrc.gc.ca/glycobiology/asalchips_e.html].
41. Bodenteich AS, Chissoe Y, Wang F, Roe BA: Shotgun cloning asthe strategy of choice to generate templates for highthroughput dideoxynucleotide sequencing. In Automated DNAsequencing and analysis techniques Edited by: Adams MD, Fields C andVenter C. London, UK: Academic Press; 1994:42-50.
42. Smyth GK, Yang YH, Speed T: Statistical issues in cDNA micro-array data analysis. Methods Mol Biol 2003, 224:111-136.
43. Saal LH, Troein C, Vallon-Christersson J, Gruvberger S, Borg A,Peterson C: BioArray Software Environment (BASE): a plat-form for comprehensive management and analysis of micro-array data. Genome Biol 2002, 3:SOFTWARE0003.
44. Saeed AI, Sharov V, White J, Li J, Liang W, Bhagabati N, Braisted J,Klapa M, Currier T, Thiagarajan M, Sturn A, Snuffin M, Rezantsev A,Popov D, Ryltsov A, Kostukovich E, Borisovsky I, Liu Z, Vinsavich A,Trush V, Quackenbush J: TM4: a free, open-source system formicroarray data management and analysis. Biotechniques 2003,34:374-8.
45. TM4 Microarray Software Suite 2006 [http://www.tm4.org/mev.html].
46. Eisen MB, Spellman PT, Brown PO, Botstein D: Cluster analysisand display of genome-wide expression patterns. Proc NatlAcad Sci U S A 1998, 95:14863-14868.
47. Altschul SF, Gish W, Miller W, Myers EW, Lipman DJ: Basic localalignment search tool. J Mol Biol 1990, 215:403-410.
Page 15 of 15(page number not for citation purposes)
Copyright © 2022 FDOKUMEN