Cell orientation entropy (COrE): predicting biochemical recurrence from prostate cancer tissue...
8
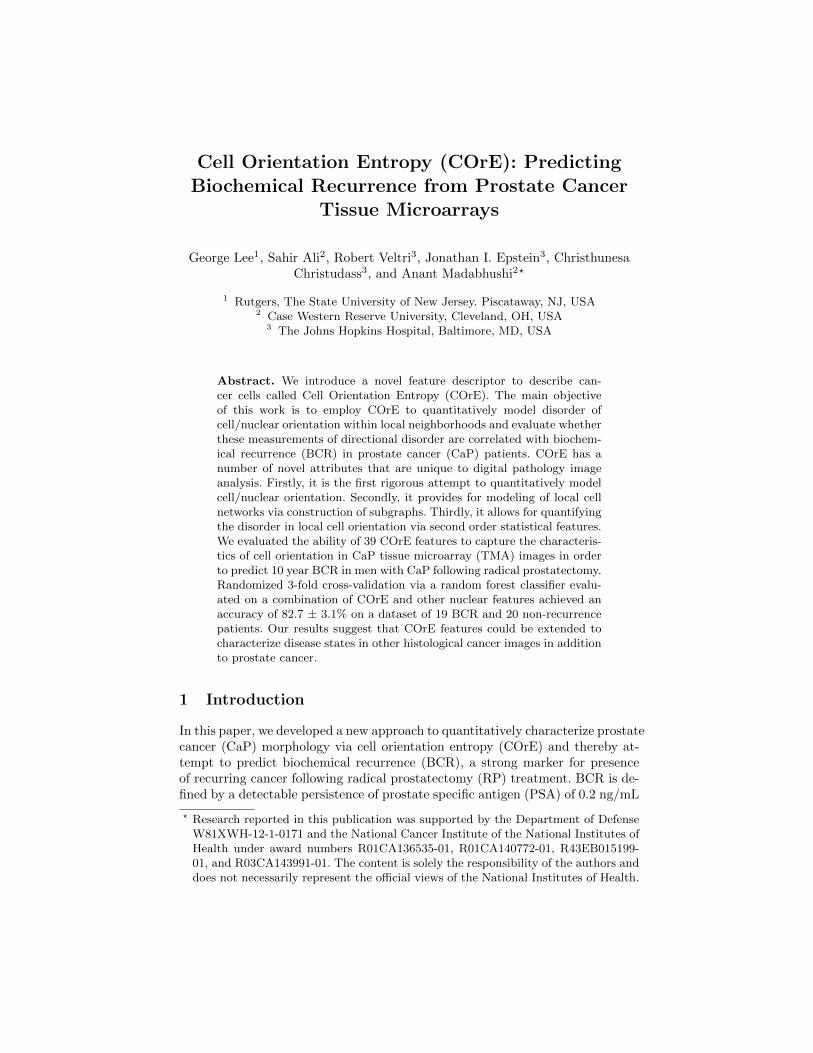
Cell Orientation Entropy (COrE): Predicting Biochemical Recurrence from Prostate Cancer Tissue Microarrays George Lee 1 , Sahir Ali 2 , Robert Veltri 3 , Jonathan I. Epstein 3 , Christhunesa Christudass 3 , and Anant Madabhushi 2? 1 Rutgers, The State University of New Jersey. Piscataway, NJ, USA 2 Case Western Reserve University, Cleveland, OH, USA 3 The Johns Hopkins Hospital, Baltimore, MD, USA Abstract. We introduce a novel feature descriptor to describe can- cer cells called Cell Orientation Entropy (COrE). The main objective of this work is to employ COrE to quantitatively model disorder of cell/nuclear orientation within local neighborhoods and evaluate whether these measurements of directional disorder are correlated with biochem- ical recurrence (BCR) in prostate cancer (CaP) patients. COrE has a number of novel attributes that are unique to digital pathology image analysis. Firstly, it is the first rigorous attempt to quantitatively model cell/nuclear orientation. Secondly, it provides for modeling of local cell networks via construction of subgraphs. Thirdly, it allows for quantifying the disorder in local cell orientation via second order statistical features. We evaluated the ability of 39 COrE features to capture the characteris- tics of cell orientation in CaP tissue microarray (TMA) images in order to predict 10 year BCR in men with CaP following radical prostatectomy. Randomized 3-fold cross-validation via a random forest classifier evalu- ated on a combination of COrE and other nuclear features achieved an accuracy of 82.7 ± 3.1% on a dataset of 19 BCR and 20 non-recurrence patients. Our results suggest that COrE features could be extended to characterize disease states in other histological cancer images in addition to prostate cancer. 1 Introduction In this paper, we developed a new approach to quantitatively characterize prostate cancer (CaP) morphology via cell orientation entropy (COrE) and thereby at- tempt to predict biochemical recurrence (BCR), a strong marker for presence of recurring cancer following radical prostatectomy (RP) treatment. BCR is de- fined by a detectable persistence of prostate specific antigen (PSA) of 0.2 ng/mL ? Research reported in this publication was supported by the Department of Defense W81XWH-12-1-0171 and the National Cancer Institute of the National Institutes of Health under award numbers R01CA136535-01, R01CA140772-01, R43EB015199- 01, and R03CA143991-01. The content is solely the responsibility of the authors and does not necessarily represent the official views of the National Institutes of Health.
Transcript of Cell orientation entropy (COrE): predicting biochemical recurrence from prostate cancer tissue...
Cell Orientation Entropy (COrE): PredictingBiochemical Recurrence from Prostate Cancer
Tissue Microarrays
George Lee1, Sahir Ali2, Robert Veltri3, Jonathan I. Epstein3, ChristhunesaChristudass3, and Anant Madabhushi2?
1 Rutgers, The State University of New Jersey. Piscataway, NJ, USA2 Case Western Reserve University, Cleveland, OH, USA
3 The Johns Hopkins Hospital, Baltimore, MD, USA
Abstract. We introduce a novel feature descriptor to describe can-cer cells called Cell Orientation Entropy (COrE). The main objectiveof this work is to employ COrE to quantitatively model disorder ofcell/nuclear orientation within local neighborhoods and evaluate whetherthese measurements of directional disorder are correlated with biochem-ical recurrence (BCR) in prostate cancer (CaP) patients. COrE has anumber of novel attributes that are unique to digital pathology imageanalysis. Firstly, it is the first rigorous attempt to quantitatively modelcell/nuclear orientation. Secondly, it provides for modeling of local cellnetworks via construction of subgraphs. Thirdly, it allows for quantifyingthe disorder in local cell orientation via second order statistical features.We evaluated the ability of 39 COrE features to capture the characteris-tics of cell orientation in CaP tissue microarray (TMA) images in orderto predict 10 year BCR in men with CaP following radical prostatectomy.Randomized 3-fold cross-validation via a random forest classifier evalu-ated on a combination of COrE and other nuclear features achieved anaccuracy of 82.7 ± 3.1% on a dataset of 19 BCR and 20 non-recurrencepatients. Our results suggest that COrE features could be extended tocharacterize disease states in other histological cancer images in additionto prostate cancer.
1 Introduction
In this paper, we developed a new approach to quantitatively characterize prostatecancer (CaP) morphology via cell orientation entropy (COrE) and thereby at-tempt to predict biochemical recurrence (BCR), a strong marker for presenceof recurring cancer following radical prostatectomy (RP) treatment. BCR is de-fined by a detectable persistence of prostate specific antigen (PSA) of 0.2 ng/mL
? Research reported in this publication was supported by the Department of DefenseW81XWH-12-1-0171 and the National Cancer Institute of the National Institutes ofHealth under award numbers R01CA136535-01, R01CA140772-01, R43EB015199-01, and R03CA143991-01. The content is solely the responsibility of the authors anddoes not necessarily represent the official views of the National Institutes of Health.

following RP. Nearly 60,000 patients undergo RP treatment for CaP each year,and for 15-40% of RP patients, BCR occurs within 5 years [1]. Gleason scoring(GS) is a qualitative system (2-10) which uses gland morphology to grade CaPaggressiveness and is representative of the clinical standard for predicting BCR.High GS 8-10 cases have been found to be correlated with BCR and presence ofaggressive disease and often secondary treatment is provided to accompany RPbased on the identification of high GS. Meanwhile, patients with GS 6 typicallyhave a very low incidence of BCR and would not indicate a need for secondarytreatment. Unfortunately, outcomes of intermediate GS 7 cancers can vary con-siderably, and statistical tables suggest a 5-year BCR-free survival rate as low as43% in these men [2]. As such, predicting BCR in GS 7 cases is an important andlargely unsolved problem with significant clinical and therapeutic implications.
While pathologists have traditionally used microscopic evaluation of histo-logical tissue to determine the extent and severity of cancer, the recent advent ofdigital whole slide scanners has allowed for the development of quantitative his-tomorphometry (QH) for automated evaluation of histological tissue. The mainidea behind these QH methods is to model the appearance of tumor morphol-ogy on histopathology via shape, textural, and spatio-architectural descriptors.While qualitative cancer grading remains by far the single most important prog-nostic measure of aggressive disease, it subjective and prone to inter-reviewervariability among pathologists [3].
Many researchers have attempted to develop automated, computerized grad-ing algorithms to address the problems of inter-reviewer variability in cancergrading and thereby improve classification accuracy [4–8]. Jafari-Khouzani etal. [6] examined the role of image texture features based on co-occurrence ma-trices for the purpose of automated CaP grading. However, these matrices arebased on pixel intensity and lack direct biological significance. Tabesh et al. [5]also looked at color, texture, and structural morphology to evaluate prostatehistopathology in terms of grading. However, complex spatial relationships be-tween structures are not investigated.
Graph tesselations of cell nuclei using Voronoi or Delaunay graphs aim to de-scribe the spatial interactions between nuclei in the tissue and have previouslybeen found to be predictive of CaP grade [4]. However, these features are derivedfrom fully connected graphs, whose edges traverse across epithelial and stromalregions. By connecting globally, fully connected graphs tend to dilute the con-tribution of the tumor morphologic features specific to the cancer epithelium.Therefore, global graphs are not sensitive to local cell organization, which maybe critical in characterizing tumor aggressiveness.
Analysis of local subgraphs, which unlike global graphs (e.g. Voronoi and De-launay) that aim to capture a global architectural signature for the tumor, canallow for quantification of local interactions within flexible localized neighbor-hoods. Bilgen et al. [7] constructed different types of cell graphs for evaluatingbreast cancer. In [8], Veltri et al. investigated nuclear morphology using a de-scriptor called nuclear roundness variance. Cell morphology was found to exceedGleason scoring for predicting CaP aggressiveness.
In this paper, we present a new set of QH features, cell orientation entropy(COrE), which aim to capture the local directional information of epithelialcancer cells. CaP is fundamentally a disease of glandular disorganization and theresulting breakdown in nuclei orientation is related to its grade [9]. Epithelialcells align themselves with respect to the glands, and thus display a coherentdirectionality. However, cancerous prostate glands are less well formed, resultingin a more chaotic organization and orientation of the surrounding nuclei.
COrE attempts to model this difference between cancerous and benign re-gions via a novel scheme, unique to digital pathology image analysis. Firstly,it is the first rigorous attempt to quantitatively model cell orientation and ex-plore the linkage between cell orientation and CaP aggressiveness. Secondly,while previous work has focused on global graph networks for characterizing tu-mor architecture, COrE employs subgraphs to construct local cell networks andthereby quantify second order statistics based on co-occurrence matrices of cellorientations. While co-occurrence matrices are commonly used to describe imagetextures [10], by quantifying second order statistics of image intensities, this isthe first instance of the use of the co-occurrence matrix to evaluate local, higherorder interactions of nuclear orientations. These second order local statisticalfeatures of nuclear orientation yield a rich set of descriptors for distinguishingthe different CaP tumor classes.
2 Cell Orientation Entropy (COrE)
2.1 Automated Cell Segmentation
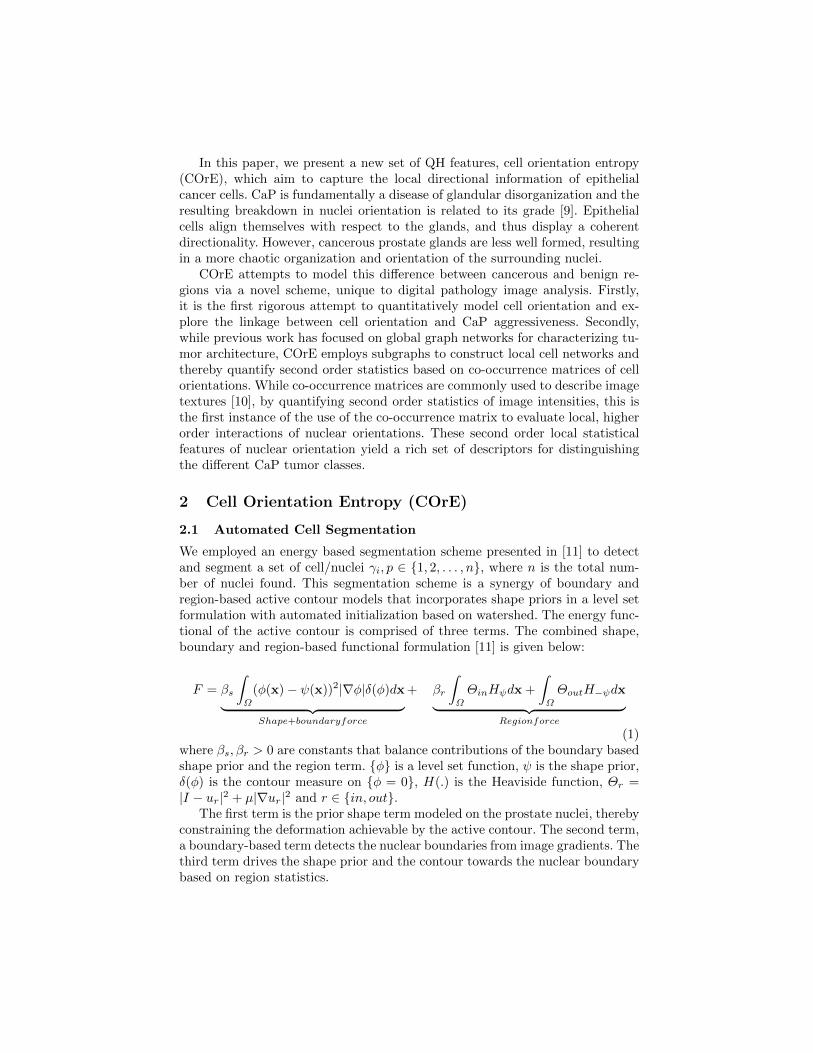
We employed an energy based segmentation scheme presented in [11] to detectand segment a set of cell/nuclei γi, p ∈ 1, 2, . . . , n, where n is the total num-ber of nuclei found. This segmentation scheme is a synergy of boundary andregion-based active contour models that incorporates shape priors in a level setformulation with automated initialization based on watershed. The energy func-tional of the active contour is comprised of three terms. The combined shape,boundary and region-based functional formulation [11] is given below:
F = βs
∫Ω
(φ(x)− ψ(x))2|∇φ|δ(φ)dx︸ ︷︷ ︸Shape+boundaryforce
+ βr
∫Ω
ΘinHψdx +
∫Ω
ΘoutH−ψdx︸ ︷︷ ︸Regionforce
(1)where βs, βr > 0 are constants that balance contributions of the boundary basedshape prior and the region term. φ is a level set function, ψ is the shape prior,δ(φ) is the contour measure on φ = 0, H(.) is the Heaviside function, Θr =|I − ur|2 + µ|∇ur|2 and r ∈ in, out.
The first term is the prior shape term modeled on the prostate nuclei, therebyconstraining the deformation achievable by the active contour. The second term,a boundary-based term detects the nuclear boundaries from image gradients. Thethird term drives the shape prior and the contour towards the nuclear boundarybased on region statistics.

2.2 Calculating Cell Orientation
To determine the directionality for each cell γi, we perform principal componentanalysis on a set of boundary points [xi, yi] to obtain the principal componentsZ = [z1, z2]. The first principal component z1 describes the directionality of thecell in the form of the major axis z1 =< zx1 , z
y1 >, along which the greatest
variance occurs in the nuclear boundary. The principal axis z1 is converted toan angle θ(γi) ∈ [0180] counterclockwise from the vector < 1, 0 > by θ(γi) =180
π arctan(zy1zx1
).
2.3 Local Cell Subgraphs
Pairwise spatial relationships between cells are defined via sparsified graphs. Agraph G = V,E, where V represents the set of n nuclear centroids γi, γj ∈ V ,i, j ∈ 1, 2, . . . , n as nodes, and E represents the set of edges which connectthem. The edges between all pairs of nodes γi, γj are determined via the proba-bilistic decaying function
E = (i, j) : r < d(i, j)−α,∀γi, γj ∈ V , (2)
where d(i, j) represents the Euclidean distance between γi and γj . α ≥ 0 controlsthe density of the graph, where α approaching 0 represents a high probability ofconnecting nodes while α approaching ∞ represents a low probability. r ∈ [0, 1]is an empirically determined edge threshold.
2.4 Calculating Second Order Statistics for Cell Orientation
The objects of interest for calculating COrE features are the cell directions givenby a discretization of the angles θ(γi), such that θ(γi) = ω× ceil( θω ), where ω isa discretization factor. Neighbors defined by the local cell subgraphs G, allow usto define neighborhoods for each cell. For each γi ∈ V , we define a neighborhoodNi, to include all γj ∈ V where a path between γi and γj exists in graph G.
An N ×N co-occurrence matrix C subsequently captures angle pairs whichco-occur in each neighborhood Ni, such that for each Ni,
CNi(a, b) =
Ni∑γi,γj
N∑a,b=1
1, if θ(γi)=a and θ(γj)=b
0, otherwise(3)
where N = 180ω , the number of discrete angular bins. We then extract second
order statistical features (Contrast energy, Contrast inverse moment, Contrastaverage, Contrast variance, Contrast entropy, Intensity average, Intensity vari-ance, Intensity entropy, Entropy, Energy, Correlation, Information measure 1,Information measure 2) from each co-occurrence matrix CNi
(a, b). Selected for-mulations are described in Table 1. Mean, standard deviation, and range of Θacross all Ni constitute the set of 39 COrE features.

Table 1: Representative COrE featuresCOrE Feature (Θ) Description
Entropy∑a,b−C(a, b) log(C(a, b)))
Energy∑a,b C(a, b)
2
Correlation∑a,b
(a−µa)(b−µb)C(a,b)σaσb
Contrast (variance)∑a,b |a− b|
2C(a, b)
3 Experimental Design
3.1 Prostate Cancer Tissue Microarray Data
While COrE is extensible towards the histological analysis of other pathologicaldiseases, we have chosen prostate cancer (CaP) as a test case for this initialwork. Our dataset comprised of histologic image samples in the form of tissuemicroarray (TMA) cores from 19 CaP patients who experienced BCR within 10years of RP, and from 20 patients who did not (NR). Patients were matchedfor GS 7 and tumor stage 3A. CaP tissue included in the TMAs were selectedand reviewed by an expert pathologist. For this study, each of 39 patients wasrepresented by a single randomly selected 0.6mm TMA core image, chosen froma set of 4 TMA cores taken for that patient.
3.2 Comparative Methods for Evaluating COrE
We compared the efficacy of COrE features with previously studied nuclear fea-tures. The shape of individual nuclei has previously been shown to be prognosticof GS [8, 12]. The set of 100 cell morphology features representing mean, stan-dard deviation of nuclear size and shape are summarized in Table 2.
Nuclear/cell architecture refers to the spatial arrangement of cells in can-cerous and benign tissue. 51 architectural image features describing the nucleararrangement were extracted as described in [12]. Voronoi diagrams, DelaunayTriangulation and Minimum Spanning Trees were constructed on the digitalhistologic image using the nuclear centroids as vertices (See Table 2).
For all feature sets, the nuclear segmentations from Section 2.1 were used tocalculate the cell boundaries and centroids. In total, we investigated the perfor-mance of 4 feature cohorts: (1) 100 features describing cell morphology, (2) 51features describing cell architectures, (3) 39 features describing cell orientationentropy (COrE), and (4) the combined feature set spanning cohorts (1-3).
3.3 Random Forest Classifier
In this study, we demonstrate the efficacy of including COrE features for improv-ing classification accuracy and area under the receiver operating characteristiccurve (AUC) in predicting BCR in CaP patients from prostate TMAs. Ran-domized 3-fold cross validation was performed on the top 10 most informativefeatures selected via Student t-test for each of 4 feature cohorts defined in Section3.2. Classification was performed using a random forest classifier.

Table 2: Summary of 151 nuclear morphologic featuresCell Morphology # Description
100 Area Ratio, Distance Ratio, Standard Deviationof Distance, Variance of Distance, Distance Ratio,Perimeter Ratio, Smoothness, Invariant Moment 1-7, Fractal Dimension, Fourier Descriptor 1-10 (Mean,Std. Dev, Median, Min / Max of each)
Cell Architecture Description
Voronoi Diagram 12 Polygon area, perimeter, chord length: mean, std.dev., min/max ratio, disorder
Delaunay Triangulation 8 Triangle side length, area: mean, std. dev., min/maxratio, disorder
Minimum Spanning Tree 4 Edge length: mean, std. dev., min/max ratio, disorder
Nearest Neighbors 27 Density of nuclei, distance to nearest nuclei
4 Results and Discussion
Figure 1 reveals the ability of the COrE features to capture the differences inangular disorder across localized cell networks and illustrates the differencesbetween the BCR and NR cases in terms of the COrE features.
In Table 3, we can summarize the performance of feature descriptors describ-ing cell architecture and cell morphology which appear to have a maximum BCRprediction accuracy of 79.9%. However, by inclusion of novel cell orientation en-tropy (COrE) features, the overall classifier accuracy improves to 82.7%. Similarimprovements are also observed in terms classification AUC. This reflects theutility of COrE features as a valuable prognostic measurement for predictingBCR in conjunction with previously described nuclear morphologic features.
Classifier improvement following inclusion of COrE features suggests thatmany of the new COrE features are non-correlated with previously defined cellarchitectural and morphological feature sets. This distinction is illustrated inFigure 1, where we observe the differences between COrE features compared withthose obtained from Voronoi and Delaunay graphs. These graphs span acrossstromal and epithelial regions, while COrE features are limited to subgraphs inlocalized regions. It is also important to note that the combination of COrE andnuclear morphologic features clearly and significantly outperform the clinicalstandard of pathologist grade, which classified all cases as GS 7.
Table 3: 100 runs of 3-fold Random Forest ClassificationArchitecture Morphology COrE Arch + Morph + COrE
Accuracy 71.2 ± 4.2% 79.9 ± 3.7% 74.6 ± 4.1% 82.7 ± 3.1%
AUC 0.641 ± 0.054 0.773 ± 0.042 0.688 ± 0.063 0.809 ± 0.037

5 Concluding Remarks
In this work, we presented a new feature descriptor, cell orientation entropy(COrE), for quantitative measurement of local disorder in nuclear orientationsin digital pathology images. We demonstrated high accuracy and improvementin predicting BCR in 39 CaP TMAs via the use of COrE features. While COrEfeatures did not outperform other quantitative histomorphometric measurementssuch as nuclear shape and architecture significantly, the combination of nuclearshape, architectural and COrE features boosted classifier accuracy in identifyingpatients at risk for BCR following radical prostatectomy. More significantly, thecombination of COrE and other image based features significantly outperformedpathologist derived GS, which is 50% for GS 7, and is further known to have atbest moderate inter-observer agreement (κ = 0.47-0.7) [3]. In future work, weaim to evaluate the applicability of COrE features in other disease sites such asbreast cancer.
References
1. Trock, B., et al.: Prostate cancer-specific survival following salvage radiotherapyvs observation in men with biochemical recurrence after radical prostatectomy.JAMA 299(23) (Jun 2008) 2760–2769
2. Han, M., et al.: Biochemical (prostate specific antigen) recurrence probabilityfollowing radical prostatectomy for clinically localized prostate cancer. J Urol169(2) (Feb 2003) 517–523
3. Allsbrook, Jr, W., et al.: Interobserver reproducibility of gleason grading of pro-static carcinoma: general pathologist. Hum Pathol 32(1) (Jan 2001) 81–88
4. Christens-Barry, W., Partin, A.: Quantitative grading of tissue and nuclei inprostate cancer for prognosis prediction. Johns Hopkins Apl Technical Digest.18 (1997) 226–233
5. Tabesh, A., et al.: Multifeature prostate cancer diagnosis and gleason grading ofhistological images. IEEE Trans on Medical Imaging 26(10) (2007) 1366–1378
6. Jafari-Khouzani, K., Soltanian-Zadeh, H.: Multiwavelet grading of pathologicalimages of prostate. IEEE Trans on Biomedical Engineering 50(6) (2003) 697–704
7. Bilgin, C., et al.: Cell-graph mining for breast tissue modeling and classification.In: IEEE Eng in Med and Biol Soc, EMBS. (2007) 5311–5314
8. Veltri, R.W., et al.: Nuclear roundness variance predicts prostate cancer pro-gression, metastasis, and death: A prospective evaluation with up to 25 years offollow-up after radical prostatectomy. The Prostate 70(12) (2010) 1333–1339
9. Epstein, J.I.: An update of the gleason grading system. Journal Of Urology (the)183(2) (2010) 433
10. Haralick, R., et al.: Textural features for image classification. IEEE Trans. onSystems, Man and Cybernetics (6) (1973) 610–621
11. Ali, S., Madabhushi, A.: An integrated region-, boundary-, shape-based activecontour for multiple object overlap resolution in histological imagery. IEEE Trans-actions on Medical Imaging 31(7) (2012) 1448–1460
12. Doyle, S., et al.: Cascaded discrimination of normal, abnormal, and confounderclasses in histopathology: Gleason grading of prostate cancer. BMC bioinformatics13(1) (2012) 282

(a) (b) (c)
(d) (e) (f)
(g) (h) (i)
(j) (k) (l)
Fig. 1: Prostate TMAs pertaining to (a)-(f) BCR and (g)-(l) NR case stud-ies. Nuclei are used as nodes for calculation of (b),(h) Delaunay graphs. Au-tomated segmentation (d),(j) defines the nuclear boundaries and locations fromthe TMA image. (e),(k) Cell orientation vectors are calculated from the segmen-tated boundaries (illustrated via different boundary colors). (c),(i) Subgraphs areformed by connecting neighboring cells. COrE features calculate contrast in thecell orientation (with dark regions showing more angular coherence and brightregions showing more disorder). Summation of the co-occurrence matrices pro-vide a visual interpretation of disorder, where (f) shows brighter co-occurrencevalues in the off-diagonal cells, suggesting higher co-occurrence of nuclei of dif-fering orientations compared to (l).