Cancer-Associated Carbohydrate Antigens as Potential Biomarkers for Hepatocellular Carcinoma
This Provisional PDF corresponds to the article as it appeared upon acceptance. Fully formattedPDF and full text (HTML) versions will be made available soon.
Detection of biomarkers for Hepatocellular Carcinoma using a hybrid univariategene selection methods
Theoretical Biology and Medical Modelling 2012, 9:34 doi:10.1186/1742-4682-9-34
Nagwan M Abdel Samee ([email protected])Nahed H Solouma ([email protected])
Yasser M Kadah ([email protected])
ISSN 1742-4682
Article type Research
Submission date 21 February 2012
Acceptance date 3 July 2012
Publication date 6 August 2012
Article URL http://www.tbiomed.com/content/9/1/34
This peer-reviewed article can be downloaded, printed and distributed freely for any purposes (seecopyright notice below).
Articles in TBioMed are listed in PubMed and archived at PubMed Central.
For information about publishing your research in TBioMed or any BioMed Central journal, go to
http://www.tbiomed.com/authors/instructions/
For information about other BioMed Central publications go to
http://www.biomedcentral.com/
Theoretical Biology andMedical Modelling
© 2012 Abdel Samee et al.This is an open access article distributed under the terms of the Creative Commons Attribution License (http://creativecommons.org/licenses/by/2.0),
which permits unrestricted use, distribution, and reproduction in any medium, provided the original work is properly cited.
Detection of biomarkers for Hepatocellular
Carcinoma using a hybrid univariate gene selection
methods
Nagwan M Abdel Samee1*,†
* Corresponding author
Email: [email protected]
Nahed H Solouma2,†
Email: [email protected]
Yasser M Kadah3,†
Email: [email protected]
1 Computer Engineering Department, Misr University for Science and
Technology, Giza, Egypt
2 Engineering Applications Department, NILES, Cairo University, Giza, Egypt
3 Biomedical Engineering Department, Cairo University, Giza, Egypt
† Equal contributors.
Abstract
Background
Discovering new biomarkers has a great role in improving early diagnosis of Hepatocellular
carcinoma (HCC). The experimental determination of biomarkers needs a lot of time and
money. This motivates this work to use in-silico prediction of biomarkers to reduce the
number of experiments required for detecting new ones. This is achieved by extracting the
most representative genes in microarrays of HCC.
Results
In this work, we provide a method for extracting the differential expressed genes, up
regulated ones, that can be considered candidate biomarkers in high throughput microarrays
of HCC. We examine the power of several gene selection methods (such as Pearson’s
correlation coefficient, Cosine coefficient, Euclidean distance, Mutual information and
Entropy with different estimators) in selecting informative genes. A biological interpretation
of the highly ranked genes is done using KEGG (Kyoto Encyclopedia of Genes and
Genomes) pathways, ENTREZ and DAVID (Database for Annotation, Visualization, and
Integrated Discovery) databases. The top ten genes selected using Pearson’s correlation
coefficient and Cosine coefficient contained six genes that have been implicated in cancer
(often multiple cancers) genesis in previous studies. A fewer number of genes were obtained
by the other methods (4 genes using Mutual information, 3genes using Euclidean distance
and only one gene using Entropy). A better result was obtained by the utilization of a hybrid
approach based on intersecting the highly ranked genes in the output of all investigated
methods. This hybrid combination yielded seven genes (2 genes for HCC and 5 genes in
different types of cancer) in the top ten genes of the list of intersected genes.
Conclusions
To strengthen the effectiveness of the univariate selection methods, we propose a hybrid
approach by intersecting several of these methods in a cascaded manner. This approach
surpasses all of univariate selection methods when used individually according to biological
interpretation and the examination of gene expression signal profiles.
Background
Microarray is a powerful technology for gene profiling. Being able to retrieve the gene
expression values of the whole genome and thus studying the molecular biology of tissues
can lead to diagnosis of different diseases [1]. Next to the value of microarrays in
understanding the biological processes underlying a specific disease, it has a great role in
discovering new biomarkers for cancers. A biomarker in the biomedical field is a substance
that has a characteristic feature as an objective indicator of a biological state, such as normal
physiological processes [2]. The most important advantage of Insilco prediction of
biomarkers using microarrays is minimizing the number of experimental work required for
detecting new biomarkers and thus saving much time and money.
In liver cancer, exploring gene expression patterns of samples from healthy patients and
others infected with Hepatocellular Carcinoma (HCC) has revealed a significant difference in
the expression of some genes from normal to tumour samples. Genes having high variance
between both classes of samples in their expression are informative features that should be
used in any further analysis as suggested biomarkers. Discovering new biomarkers of HCC
can help in early detection of this type of cancer. Early detection of HCC is a vital issue as it
can help patients in receiving therapeutic benefits rather than curative surgery. Unfortunately,
there is no effective biomarker for early detection of HCC. The current diagnosing of HCC
relies on detection of an inaccurate biomarker, alpha-fetoprotein (AFP) [3]. Therefore, there
is a need for detecting new reliable biomarkers for HCC.
Detection of biomarkers in the context of machine learning can be treated as a feature
selection problem that tries to select features (markers) that can distinguish between different
classes of data. The selected features are a list of genes that might be informative for
discriminating different types and subtypes of diseases. So we will refer to feature selection
all through this paper by gene selection.
A widely used approach for gene selection is the univariate selection approach [4,5].
Univariate selection approaches yield consistently better results than multivariate approaches
[6]. In the univariate approach, the relevance of each gene is determined individually.
However, the multivariate approach such as Singular Value Decomposition (SVD) and
Principal Component Analysis (PCA) considers the interactions between genes. Some of the
univariate methods are: Pearson’s correlation coefficients, Euclidean distance, Cosine
coefficient, Entropy and Mutual information.

Discovery of biomarkers from microarrays data was studied in several publications [4-7]. All
of these research efforts were seeking for selecting informative genes as a prerequisite step of
a high performance classifier. None have assessed the quality of the gene selection methods
from the point of retrieving relevant biomarkers known in the biological databases. A
research paper made a comparison between the univariate and multivariate approaches in
improving the accuracy of classification [6]. This work employed seven microarrays datasets
representing different types of cancer. They found that the univariate methods surpassed the
multivariate with five datasets. This was due to the small number of samples relative to the
number of genes being studied which is always the case in microarrays. Another research
work offered a combination between the Correlation Coefficient, as a univariate selection
approach, and the singular value decomposition (SVD), as a multivariate approach [4].
However, they did not attain high classification accuracy due to the dependency between
samples of the microarrays data being studied. So in our research, we focused on testing the
Correlation Coefficient as a gene selection method individually or integrated with other
univariate gene selection methods. A robust method of discovering new biomarker using the
ensemble feature selection techniques in support vector machine (SVM) classifier was also
presented [2]. This method improved the performance of the classification of microarrays
data. However this was achieved only in cases when studying a few tens of genes. So, this
method is not suitable for studying high throughput microarrays data that almost contain
more than 20,000 genes. Another study by Cho et al. [5] presented a comparative study of
different gene selection methods (Pearson’s correlation coefficients, Euclidean distance,
Cosine coefficient, Mutual information and information gain). They used three benchmarking
datasets and tested the impact of using such gene selection methods on different classifiers.
An ideal biomarker was assumed that had two values of 0 and 1, which might produce
irrelevant correlation and cosine coefficient. So, in this study we rather preferred to propose
different values than those ones as well as normalize the gene expression values when the
Euclidean Distance and the Cosine Coefficient are being calculated.
To conclude, the scope of those previous publications was focused on benchmarking data
sets, which contains a few thousands of genes, to compare the adequacy of different gene
selection methods and usually assessed using different classifiers. Therefore, we were
motivated to expand the research to cover microarrays of HCC comprising a huge number of
genes by means of the proposed hybrid technique. We examined the power of some of the
previous methods (cf. [5]) in addition to different Entropy estimators. Biological validation of
the retained top ten lists of genes is proposed in our work too. Moreover, the significance of
signal profiles of the selected genes in both normal and tumor samples were validated using t-
test.
Briefly, we defined an ideal biomarker as a gene that has two discrete values, minus one in
normal samples and one in tumour samples. Genes with similar profile to the ideal biomarker
are selected using Pearson’s correlation coefficients, Euclidean distance, Cosine coefficient,
Entropy and Mutual information. Then they are ranked according to their similarity with the
ideal gene. Highly ranked genes from all methods are intersected in a cascaded manner.
Finally, the top ranked genes are examined by checking their signal profiles and mining the
biological databases for their existence as known biomarkers.
Methods
The steps of the proposed framework include pre-processing of Affymetrix files, gene
selection, gene ranking, finding common genes and gene validation through biological
interpretation and signal profiling. These steps are shown in Figure 1.
Figure 1 The proposed hybrid technique
Materials
Thirty five microarray samples were downloaded from Gene Expression Omnibus (GEO)[8].
Nineteen of theses samples are taken from normal subjects. The remaining sixteen samples
are for subjects with HCC as a complication of HCV cirrhosis. This data were collected on
the Affymetrix HG-U133A 2.0 platform. The raw data in “.CEL” format was collected from
GEO are pre-processed using the Affy package provided by Bioconductor [9].
Ideal biomarker
Suppose we have a gene expression matrix that contains a set of genes' expression values
measured in Q samples. The first k samples are taken from normal persons and the remaining
L samples are taken from HCC patients. Each gene in this matrix can be defined as a vector
of Q values. An ideal up regulated biomarker can be defined as a gene that having a value of
minus one in normal samples and a value of one in tumour samples. The ideal up regulated
biomarker is a step up signal as shown in Figure 2.
Figure 2 An ideal up regulated biomarker
Pearson's correlation coefficient
The similarity between the ideal up regulated biomarker, BIdeal, and a gene Y can be
determined by computing the Pearson's correlation coefficient [10] as stated in equation 1.
i
i
___
i Ideal Ideal
1
___2 2
i Ideal Ideal
1 1
(Y Y )(B B )
r
(Y Y ) (B B )
Q
i
Q Q
i i
(1)
The Pearson's correlation coefficient, r, is always between −1 and +1. The closer the
correlation is to +/−1, the closer to a perfect linear relationship.
Euclidean distance
The similarity between two vectors can be determined by measuring the distance between
them in the space. So, we used the Euclidean distance between BIdeal and all genes as another
measure of similarity between them. See the following equation.
i
2
i Ideal
1
d ((Y Y) -B )Q
i
(2)
The gene expression values were first normalized (by subtracting the mean value of each
gene from all its values) before calculating the Euclidean distance between them and BIdeal. In
this manner, all values will be in the same range from −1 to 1 and an accurate distance will be
calculated.
Cosine coefficient
The Cosine coefficient can measure the dependency between BIdeal, and a gene Y as seen in
equation 3. If the Cosine coefficient is zero, then they are independent and if one, then they
are pointing in the same direction.
i
i
i Ideal
1cosine
2 2
i Ideal
1 1
(Y Y ) B
r
(Y Y ) B
Q
i
Q Q
i i
(3)
In the same manner, all genes expression values were first normalized as mentioned above.
Mutual Information
Informative genes can also be discovered by computing the Mutual information between all
genes and BIdeal. The formula of calculating the Mutual information [11,12] is given as,
)|()(Y),I(BIdeal YBHBH IdealIdeal (4)
In this formula, we need firstly need to calculate , the entropy of BIdeal, and the
conditional entropy between BIdeal and a gene Y: .
Entropy
The Entropy is a measure of the uncertainty of a discrete random variable x. It is calculated
via estimators. The estimator that is most commonly used is the Empirical estimator. It is also
called Maximum likelihood [13]. It is defined by,
1
( ) ( )( ) log
nemp k k
k
nb x nb xH X
Q Q
(5)
where, is the number of data points in bin k, m is number of observations (the
number of gene expression values) and n is the number of bins. This method estimates the
probability of each gene by counting the number of values in each bin of comparable values.
In this paper, the number of bins equals two as the informative genes should have different
expression values in normal samples than those in tumour samples. Other entropy's
estimators are: Miller-Madow, Shrink and Schurmann-Grassberger. The Miller-Madow
Entropy estimator adds a correction bias to the Empirical estimator. The Shrinkage Entropy
estimator is a combination of two different estimators: one with low variance and the other
with low bias. The last examined estimator is the Schurmann-Grassberger Entropy estimator.
It uses the Dirichlet distribution which is a generalization of Beta distribution [13-16].
Results
For each gene selection method, we calculated the similarity between the ideal gene and
22277 genes comprising the original data set. Genes that have a strong association with the
ideal gene should have Pearson correlation coefficient values from ±0.7-1 [5]. So, the number
of retrieved genes using this method was 2284 genes. We restricted the number of selected
genes using the other methods to the same number of genes. The functional annotations of the
top ten genes are mined through DAVID's functional annotation [17], ENTREZ [18] and
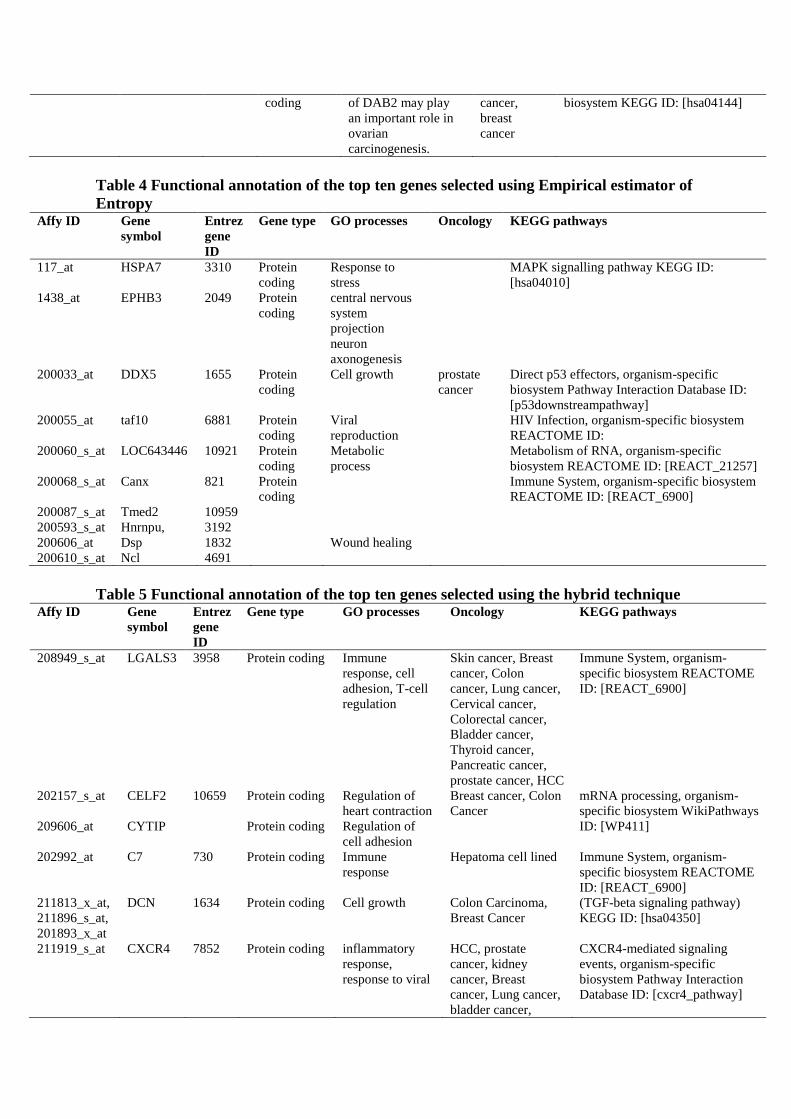
KEGG pathways [19]. The results obtained from each method are listed in Tables 1, 2, 3, 4
and 5. In each table, we listed for each gene in the top ten lists its Affy ID, symbol, ENTREZ
ID, type, Gene Ontology (GO) processes, Oncology term and pathways. Signal profiles of
first four genes in the top ten genes are charted as shown in the figures section.
Table 1 Functional annotation of the top ten genes selected using Pearson's correlation
coefficient and Cosine coefficient Affy ID Gene
symbol
Entrez
gene ID
Gene type GO
processes
Oncology KEGG pathways
202988_s_at RGS1 5996 Protein
coding
Immune
response
CXCR4-mediated signaling
events, organism-specific
biosystem Pathway Interaction
Database ID: [cxcr4_pathway]
208949_s_at LGALS3 3958 Protein
coding
Immune
response, cell
adhesion, T-
cell
regulation
Skin cancer, Breast
cancer, Colon cancer,
Lung cancer, Cervical
cancer, Colorectal cancer,
Bladder cancer, Thyroid
cancer, Pancreatic cancer,
prostate cancer, HCC
Immune System, organism-
specific biosystem REACTOME
ID: [REACT_6900]
217028_at,
211919_s_at
CXCR4 7852 Protein
coding
inflammatory
response,
response to
viral
prostate cancer, kidney
cancer, Breast cancer,
Lung cancer, bladder
cancer, Pancreatic cancer,
Colorectal cancer,
Thyroide cancer, Qastric
cancer
CXCR4-mediated signaling
events, organism-specific
biosystem Pathway Interaction
Database ID: [cxcr4_pathway]
205798_at IL7R 3575 Protein
coding
Immune
response
HCV Primary immunodeficiency
KEGG ID: [hsa05340]
202157_s_at CELF2 10659 Protein
coding
Regulation of
heart
contraction
Breast cancer, Colon
Cancer
mRNA processing, organism-
specific biosystemWikiPathways
ID: [WP411]
209606_at CYTIP Protein
coding
Regulation of
cell adhesion
202992_at C7 730 Protein
coding
Immune
response
Hepatoma cell lined Immune System, organism-
specific biosystem REACTOME
ID: [REACT_6900]
211813_x_at,
201893_x_at
DCN 1634 Protein
coding
Cell growth Colon Carcinoma, Breast
Cancer
(TGF-beta signaling pathway)
KEGG ID: [hsa04350]
Table 2 Functional annotation of the top ten genes selected using Mutual Information Affy ID Gene Entrez Gene GO processes Oncology KEGG pathways
symbol gene
ID
type
201034_at ADD3 120 Protein
coding
Drug response
201141_at GPNMB 10457 Protein
coding
negative
regulation of
cell
proliferation
Liver
inflammation
201278_at,
201280_s_at
DAB2 1601 Protein
coding
Prostate Cancer,
Breast Cancer,
esophageal
Cancer
201311_s_at SH3BGRL 6451 Protein
coding
EGFR1 Signaling Pathway, organism-
specific biosystemWikiPathways ID:
[WP437]
201893_x_at DCN 1634 Protein
coding
Cell growth Colon
Carcinoma,
Breast Cancer
(TGF-beta signaling pathway) KEGG
ID: [hsa04350]
202157_s_at CELF2 10659 Breast cancer,
Colon Cancer
202207_at Arl4c 10123 Protein
coding
202336_s_at Pam 5066 Protein
coding
Response to
drug
202403_s_at COL1A2 1278 Protein
coding
blood vessel
development
colorectal cancer,
breast cancer
Platelet Activation, organism-specific
biosystem REACTOME ID:
[REACT_798]
Table 3 Functional annotation of the top ten genes selected using Euclidean distance Affy ID Gene
symbol
Entrez
gene
ID
Gene type GO processes Oncology KEGG pathways
201893_x_at,
211896_s_at,
211813_x_at
DCN 1634 Protein
coding
Cell growth Colon
Carcinoma,
Breast
Cancer
(TGF-beta signaling pathway)
KEGG ID: [hsa04350]
202992_at C7 730 Protein
coding
Immune response Hepatoma
cell lined
Immune System, organism-specific
biosystem REACTOME ID:
[REACT_6900]
201918_at SLC25A36, 55186, Protein
coding
204319_s_at Rgs10, 6001 Protein
coding
G alpha (i) signalling events,
organism-specific biosystem
REACTOME ID: [REACT_19231]
211368_s_at CASP1 834 Protein
coding
plays a central role in
the execution-phase
of cell apoptosis.
Colorectal
cancer
Immune System, organism-specific
biosystem REACTOME ID:
[REACT_6900]
218589_at LPAR6 10161 The protein encoded
by this gene belongs
to the family of G-
protein coupled
receptors, that are
preferentially
activated by
adenosine and uridine
nucleotides.
G alpha (q) signalling events,
organism-specific biosystem
REACTOME ID: [REACT_18283]
212509_s_at mxra7 439921 Protein
coding
201278_at DAB2 1601 Protein The down-regulation Prostate Endocytosis, organism-specific
coding of DAB2 may play
an important role in
ovarian
carcinogenesis.
cancer,
breast
cancer
biosystem KEGG ID: [hsa04144]
Table 4 Functional annotation of the top ten genes selected using Empirical estimator of
Entropy Affy ID Gene
symbol
Entrez
gene
ID
Gene type GO processes Oncology KEGG pathways
117_at HSPA7 3310 Protein
coding
Response to
stress
MAPK signalling pathway KEGG ID:
[hsa04010]
1438_at EPHB3 2049 Protein
coding
central nervous
system
projection
neuron
axonogenesis
200033_at DDX5 1655 Protein
coding
Cell growth prostate
cancer
Direct p53 effectors, organism-specific
biosystem Pathway Interaction Database ID:
[p53downstreampathway]
200055_at taf10 6881 Protein
coding
Viral
reproduction
HIV Infection, organism-specific biosystem
REACTOME ID:
200060_s_at LOC643446 10921 Protein
coding
Metabolic
process
Metabolism of RNA, organism-specific
biosystem REACTOME ID: [REACT_21257]
200068_s_at Canx 821 Protein
coding
Immune System, organism-specific biosystem
REACTOME ID: [REACT_6900]
200087_s_at Tmed2 10959
200593_s_at Hnrnpu, 3192
200606_at Dsp 1832 Wound healing
200610_s_at Ncl 4691
Table 5 Functional annotation of the top ten genes selected using the hybrid technique Affy ID Gene
symbol
Entrez
gene
ID
Gene type GO processes Oncology KEGG pathways
208949_s_at LGALS3 3958 Protein coding Immune
response, cell
adhesion, T-cell
regulation
Skin cancer, Breast
cancer, Colon
cancer, Lung cancer,
Cervical cancer,
Colorectal cancer,
Bladder cancer,
Thyroid cancer,
Pancreatic cancer,
prostate cancer, HCC
Immune System, organism-
specific biosystem REACTOME
ID: [REACT_6900]
202157_s_at CELF2 10659 Protein coding Regulation of
heart contraction
Breast cancer, Colon
Cancer
mRNA processing, organism-
specific biosystem WikiPathways
ID: [WP411] 209606_at CYTIP Protein coding Regulation of
cell adhesion
202992_at C7 730 Protein coding Immune
response
Hepatoma cell lined Immune System, organism-
specific biosystem REACTOME
ID: [REACT_6900]
211813_x_at,
211896_s_at,
201893_x_at
DCN 1634 Protein coding Cell growth Colon Carcinoma,
Breast Cancer
(TGF-beta signaling pathway)
KEGG ID: [hsa04350]
211919_s_at CXCR4 7852 Protein coding inflammatory
response,
response to viral
HCC, prostate
cancer, kidney
cancer, Breast
cancer, Lung cancer,
bladder cancer,
CXCR4-mediated signaling
events, organism-specific
biosystem Pathway Interaction
Database ID: [cxcr4_pathway]
Pancreatic cancer,
Colorectal cancer,
Thyroide cancer,
Qastric cancer
214247_s_at DKK3 Lung cancer, prostate
cancer, breast cancer,
Head and neck cell
carcinoma
201137_s_at HLA-
DPB1
hepatitis C virus
(HCV).
Discussion
Biological interpretation
As observed from the biological details listed in Table 1, it is clear that top ten genes selected
by the Pearson correlation coefficient and Cosine coefficient are the same. This is due to the
high similarity between them according to equations 1 and 3. Six of the top ten genes selected
using these two methods have been previously implicated in different types of cancers
according to their oncology term. Four genes (RGS1, LGALS3, IL7R and C7) have immune
response process as one of their GO processes. Moreover, two genes (IL7R and LGALS3) are
related to liver disease as they were manipulated in the literature of HCV and HCC. This
derives the attention to the importance of carrying up further biological investigation on these
discovered genes.
In Table 2, a different set of genes were retrieved using Mutual information. Four genes
(DAB2, DCN, CELF2 and COL1A2) have appeared previously in cancers. Another gene
(GPNMB) appeared to be involved with the liver inflammation. Two genes (DCN and C7) as
shown in Table 3 are common genes in the list retrieved using Euclidean distance and
Pearson's correlation coefficient methods. These two genes have been involved in colon and
breast carcinoma. DAB2 which is a regulator of ovarian carcinoma and has been implicated
in prostate and breast cancer is a common gene in the top ten genes selected using Euclidean
distance and Mutual information.
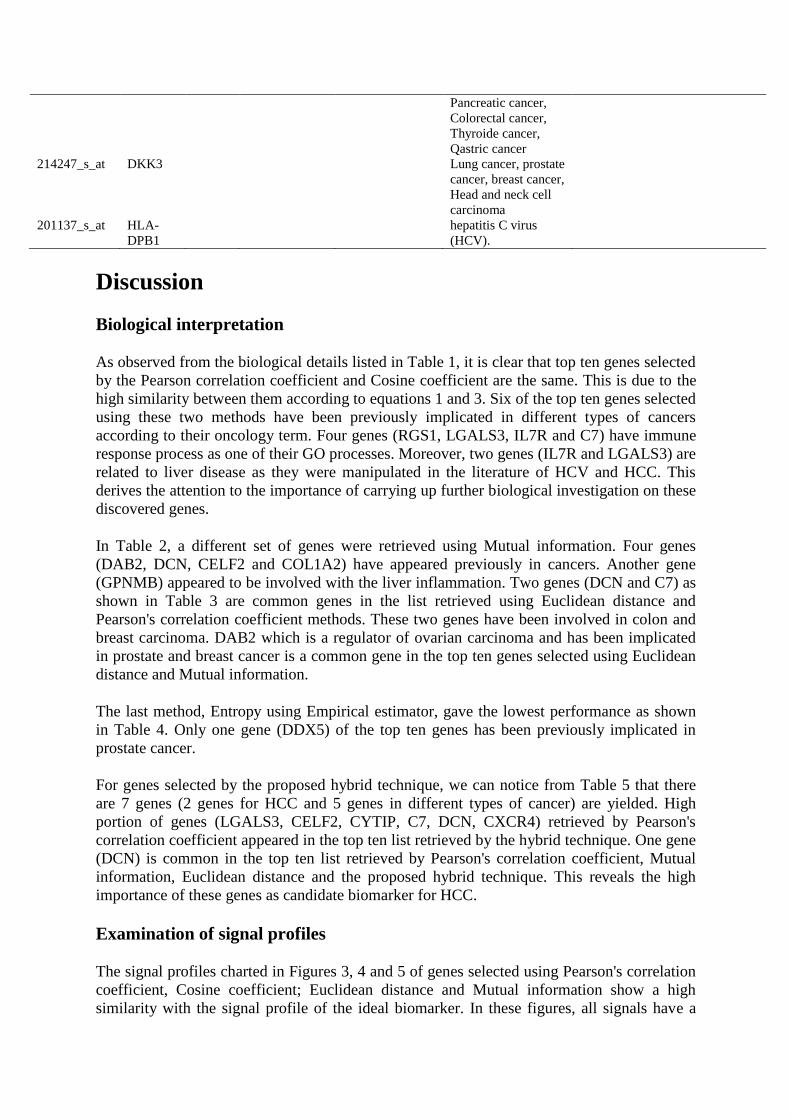
The last method, Entropy using Empirical estimator, gave the lowest performance as shown
in Table 4. Only one gene (DDX5) of the top ten genes has been previously implicated in
prostate cancer.
For genes selected by the proposed hybrid technique, we can notice from Table 5 that there
are 7 genes (2 genes for HCC and 5 genes in different types of cancer) are yielded. High
portion of genes (LGALS3, CELF2, CYTIP, C7, DCN, CXCR4) retrieved by Pearson's
correlation coefficient appeared in the top ten list retrieved by the hybrid technique. One gene
(DCN) is common in the top ten list retrieved by Pearson's correlation coefficient, Mutual
information, Euclidean distance and the proposed hybrid technique. This reveals the high
importance of these genes as candidate biomarker for HCC.
Examination of signal profiles
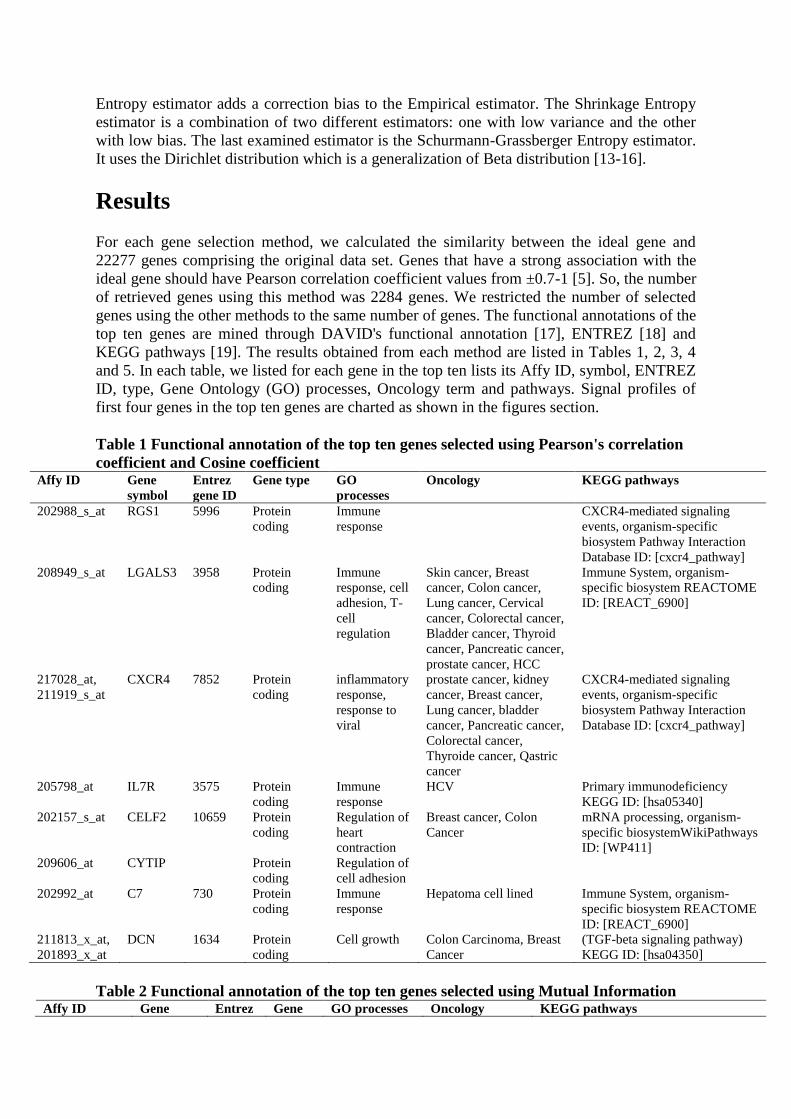
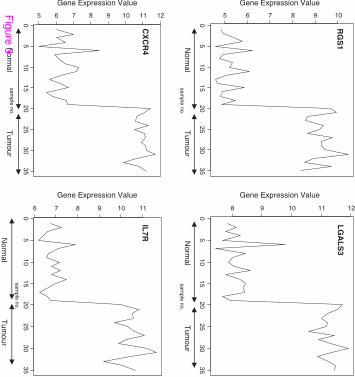
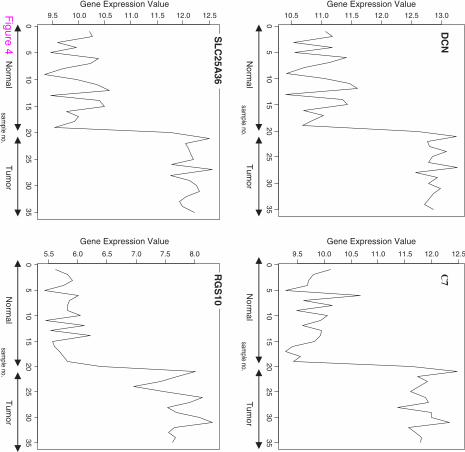
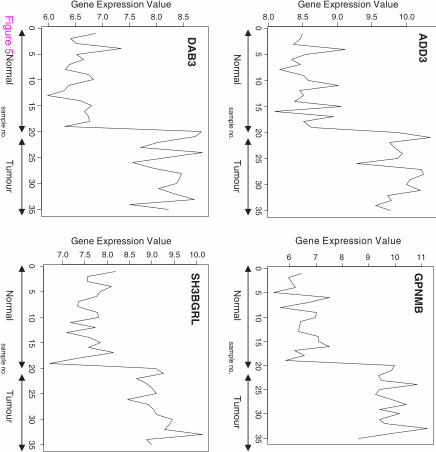
The signal profiles charted in Figures 3, 4 and 5 of genes selected using Pearson's correlation
coefficient, Cosine coefficient; Euclidean distance and Mutual information show a high
similarity with the signal profile of the ideal biomarker. In these figures, all signals have a
step up shape. This derives us to consider these genes as up regulated biomarkers for HCC.
The significance level of these signals according to their p-values in Table 6 shows the
significance of the selected genes.
Figure 3 Profiles of four genes of top ten genes selected using Pearson's correlation
coefficient and Cosine coefficient
Figure 4 Profiles of four genes of top ten genes selected using Euclidean distance
Figure 5 Profiles of four genes of top ten genes selected using Mutual information
Table 6 The significance level of the first four genes in the top ten list Gene selection method Gene symbol t-test p-value
Pearson's Correlation Coefficient RGS1 −21.4863 <2.2e-16
LGALS3 −21.6676 <2.2e-16
CXCR4 −21.6883 <2.2e-16
IL7R −19.8349 <2.2e-16
Euclidean Distance DCN −18.8684 <2.2e-16
C7 −19.5595 <2.2e-16
SLC25A36 −19.9836 <2.2e-16
RGS10 −14.6328 2.630e-12
Mutual Information ADD3 −14.163 2.103e-15
GPNMB −15.6387 2.999e-16
DAB3 −13.1599 5.279e-13
SH3BGRL −11.7037 4.181e-13
Empirical Estimator HSPA7 0.1818 0.857
EPHB3 4.9734 1.997e-05
DDX5 −5.4255 6.336e-06
Taf10 8.9728 3.129e-10
Miller-Madow Entropy estimator HSPA7 0.1818 0.857
EPHB3 4.9734 1.997e-05
DDX5 −5.4255 6.336e-06
Taf10 8.9728 3.129e-10
Shrink Entropy estimator DDR1 −3.8611 0.0005685
RFC2 4.8055 3.665e-05
HSPA7 0.1818 0.857
EPHB3 4.9734 1.997e-05
Schurmann-Grassburger Entropy estimator HSPA7 0.1818 0.857
EPHB3 4.9734 1.997e-05
DDX5 −5.4255 6.336e-06
Taf10 8.9728 3.129e-10
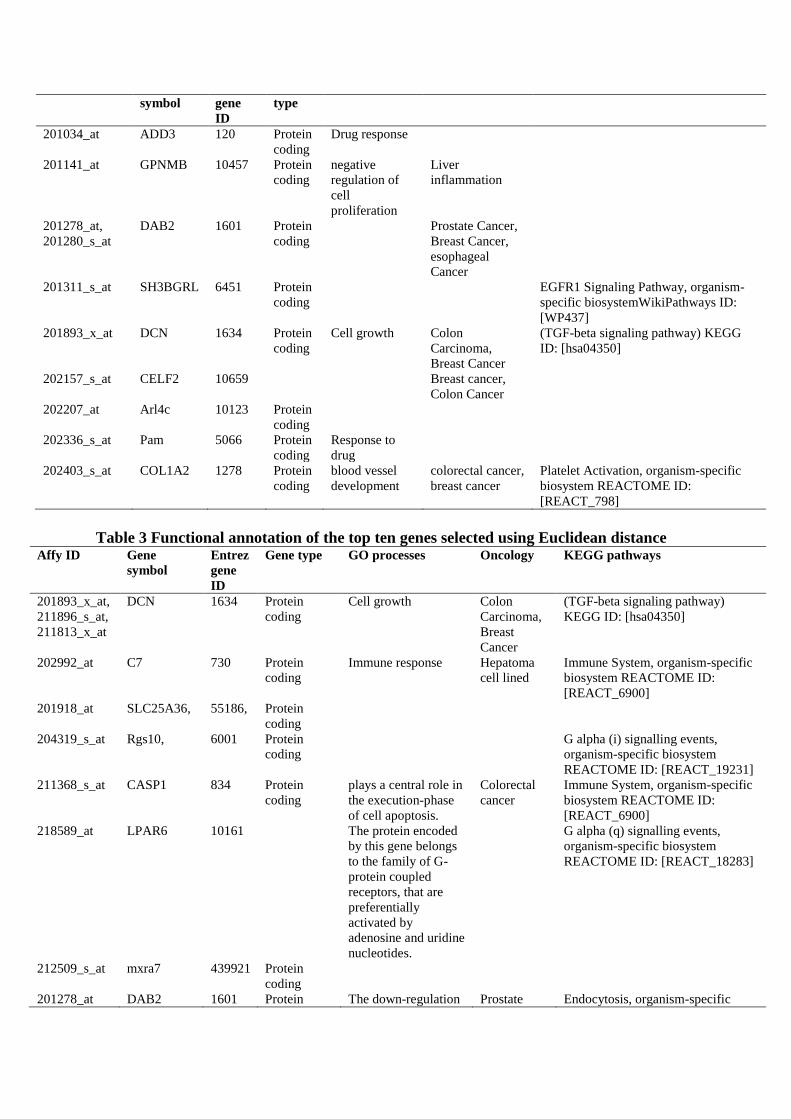
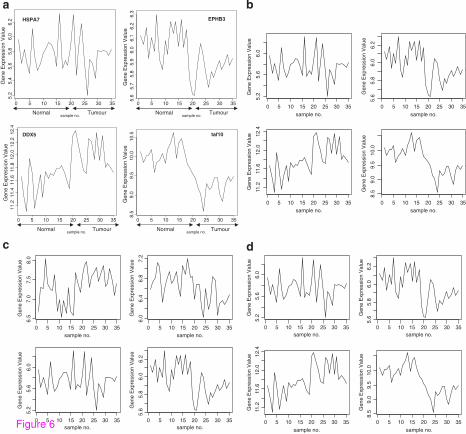
The signal profiles of genes selected using Entropy using Empirical estimator shown in
Figure 6a have a random shape. Also as seen in Figure 6b, 6c and 6d, the other estimators of
Entropy: Miller-Madow, Shrink, Schurmann-Grassberger gave a random shapes too for their
selected genes. These signals have comparable p-values as in Table 6. These results reveal a
low performance of Entropy. Without generalization, we conclude that the Entropy is an
inadequate gene selection method in our application.
Figure 6 (a) Profiles of four genes of top ten genes selected using Empirical entropy
estimator. (b) Profiles of four genes of top ten genes selected using Miller-Madow entropy
estimator. (c) Profiles of four genes of top ten genes selected using Shrink entropy estimator.
(d) Profiles of four genes of top ten genes selected using Schurmann-Grassburger Entropy
estimator
Conclusions
The investigated methods of gene selection when used individually gave a comparable
performance while Entropy method provided fairly acceptable result with respect to
validating the results using the biological databases. Even more, by examining the signal
profiles of genes retrieved using Entropy with different estimators, the signals are found to be
visually non discriminating normal and tumour samples and this inspection was emphasised
using t-test statistics. Nevertheless, the proposed hybrid approach surpassed all of the
proposed methods when used solely. We conclude that the proposed technique is feasible
when mining in a huge number of genes in high throughput microarrays. The proposed
framework has detected a list of only 172 informative genes out of 22777 genes being
studied. This list contains novel informative genes that are suggested as biomarkers for HCC
and thus deserve further lab investigation as a future work.
Competing interest
The authors declare that they have no competing interest.
Authors’ contributions
NA collected the biological data, participated in data implementation and drafted the
manuscript. NS and YK supervised the study, and participated in its design and coordination.
All authors read and approved the final manuscript.
References
1. Li L, Ying L, Naesens M, Xiao W, Sigdel T, Hsieh S, Martin J, Chen R, Liu K, Mindrinos
M, et al: Interference of globin genes with biomarker discovery for allograft rejection in
peripheral blood samples. Physiol Genom 2008, 32(2):190–197.
2. Abeel T, Helleputte T, Van de Peer Y, Dupont P, Saeys Y: Robust biomarker
identification for cancer diagnosis with ensemble feature selection methods. Bioinformatics 2010, 26(3):392–398.
3. Lee IN, Chen CH, Sheu JC, Lee HS, Huang GT, Chen DS, Yu CY, Wen CL, Lu FJ, Chow
LP: Identification of complement C3a as a candidate biomarker in human chronic
hepatitis C and HCV-related hepatocellular carcinoma using a proteomics approach. Proteomics 2006, 6(9):2865–2873.
4. Mahmoodian H, HamiruceMarhaban M, Rahim RA, Rosli R, Iqbal Saripan M: A
combinatory algorithm of univariate and multivariate gene selection. J Theor Appl
Inform Technol 2009, 5(2):113–118.
5. Cho SB, Won HH: Machine learning in DNA microarray analysis for cancer
classification. Proc First Asia-Pacific Bioinform Conf 2003, 19:189–198.
6. Lai C, Reinders M, Van't Veer L, Wessels L: A comparison of univariate and
multivariate gene selection techniques for classification of cancer datasets. BMC
Bioinformatics 2006, 7(1):235.
7. Glazko GV, Emmert-Streib F: Unite and conquer: univariate and multivariate
approaches for finding differentially expressed gene sets. Bioinformatics 2009,
25(18):2348–2354.
8. Edgar R, Domrachev M, Lash AE: Gene Expression Omnibus: NCBI gene expression
and hybridization array data repository. Nucleic Acids Res 2002, 30:207–210.
9. Gentleman RCCVBD, Bolstad BM, Dettling M, Dudoit S, Ellis BGL, Ge Y, Gentry J,
Hornik K, Hothorn T, Huber W, Iacus SIR, Leisch F, Li C, Maechler M, Rossini AJ,
Sawitzki G, Smith CSG, Tierney L, Yang YH, Zhang J: Bioconductor:Open software
development for computational biology and bioinformatics. Genome Biol 2004,
5(10):R80.
10. You Z, Wang S, Gui J, Zhang S: A Novel Hybrid Method of Gene Selection and Its
Application on Tumor Classification. In ICIC '08 Proceedings of the 4th international
conference on Intelligent Computing: Advanced Intelligent Computing Theories and
Applications - with Aspects of Artificial Intelligence. 2008:1055–1068.
11. Daub CO SR, Selbig J, Kloska S: Estimating mutual information using B-spline
functions – an improved similarity measure for analysing gene expression data. BMC
Bioinformatics 2004, 5:118.
12. Paninski L: Estimation of entropy and mutual information. Neural Comput 2003,
15(6):1191–1253.
13. Meyer PE, Lafitte F, Bontempi G: minet: A R/Bioconductor Package for Inferring
Large Transcriptional Networks Using Mutual Information. BMC Bioinformatics 2008,
9:461–470.
14. Schafer J, Strimmer K: A Shrinkage Approach to Large-Scale Covariance Matrix
Estimation and Implications for Functional Genomics. Stat Appl Genet Mol Biol 2005,
4(1): doi:10.2202/1544-6115.1175.
15. Schäfer J, Strimmer K: An empirical Bayes approach to inferring large-scale gene
association networks. Bioinformatics 2005, 21:6.
16. Nemenman I, Bialek W, Steveninck RR: Entropy and information in neural spike
trains: Progress on the sampling problem. Phys Rev E 2004, 69:5.
17. Dennis G, Sherman BT, Hosack DA, Yang J, Gao W, Lane HC, Lempicki RA: DAVID:
Database for Annotation, Visualization, and Integrated Discovery. Genome Biol 2003,
4:P3.
18. Maglott D, Ostell J, Pruitt KD, Tatusova T: Entrez Gene: gene-centered information at
NCBI. Nucleic Acids Res 2007, 35:D26–D31.

19. Kanehisa M, Goto S: KEGG: Kyoto Encyclopedia of Genes and Genomes. Nucleic
Acids Res 2000, 28(1):27–30.

Find Overlapped Genes
Gene validation
Biological Interpretation
Signal Profiling
GeneRanking
Preprocessing (Summarization)
Gene selection
Candidate Biomarkers
Pea
rso
n's
corr
elat
ion
Co
sin
e co
effi
cien
t
Mu
tual
info
rmat
ion
Eu
clid
ean
dis
tan
ce
En
tro
py
Figure 1
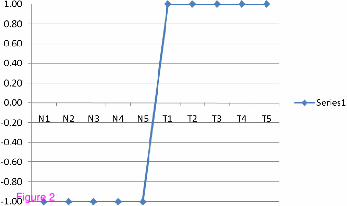
Figure 2
05
10
15
20
25
30
35
8 9 10 11 12
sam
ple
no.
Gene Expression Value
05
10
15
20
25
30
35
5 6 7 8 9 10
sam
ple
no.
Gene Expression Value
LG
AL
S3
R
GS
1
05
10
15
20
25
30
35
5 6 7 8 9 10 11 12
sam
ple
no.
Gene Expression Value
05
10
15
20
25
30
35
6 7 8 9 10 11
sam
ple
no.
Gene Expression Value
CX
CR
4
IL7R
Norm
al
Tum
our
Norm
al
Tum
our
Norm
al
Norm
al
Tum
our
Tum
our
Fig
ure
3
05
10
15
20
25
30
35
10.5 11.0 11.5 12.0 12.5 13.0
sam
ple
no.
Gene Expression Value
05
10
15
20
25
30
35
9.5 10.0 10.5 11.0 11.5 12.0 12.5
sam
ple
no.
Gene Expression Value
05
10
15
20
25
30
35
9.5 10.0 10.5 11.0 11.5 12.0 12.5
sam
ple
no.
Gene Expression Value
05
10
15
20
25
30
35
5.5 6.0 6.5 7.0 7.5 8.0
sam
ple
no.
Gene Expression Value
DC
NC
7
No
rma
l N
orm
al
No
rma
l N
orm
al
Tu
mo
r T
um
or
Tu
mo
r T
um
or
SL
C2
5A
36
RG
S1
0
Fig
ure
4
sa
mp
le n
o.
Gene Expression Value
sa
mp
le n
o.
Gene Expression Value
sa
mp
le n
o.
Gene Expression Value
05
10
15
20
25
30
35
8.0 8.5 9.0 9.5 10.0
05
10
15
20
25
30
35
6 7 8 9 10 11
05
10
15
20
25
30
35
6.0 6.5 7.0 7.5 8.0 8.5
05
10
15
20
25
30
35
7.0 7.5 8.0 8.5 9.0 9.5 10.0
sa
mp
le n
o.
Gene Expression Value
AD
D3
GP
NM
B
DA
B3
SH
3B
GR
L
Norm
al
Norm
al
Norm
al
Norm
al
Tum
our
Tum
our
Tum
our
Tum
our
Fig
ure
5
0 5 10 15 20 25 30 35
5.2
5.4
5.6
5.8
6.0
6.2
sample no.
Ge
ne
Exp
ressio
n V
alu
e
0 5 10 15 20 25 30 35
5.6
5.7
5.8
5.9
6.0
6.1
6.2
6.3
sample no.
Ge
ne
Exp
ressio
n V
alu
e
0 5 10 15 20 25 30 35
11.2
11.4
11.6
11.8
12.0
12.2
12.4
sample no.
Ge
ne
Exp
ressio
n V
alu
e
0 5 10 15 20 25 30 35
8.5
9.0
9.5
10.0
10.5
sample no.
Ge
ne
Exp
ressio
n V
alu
e
HSPA7 EPHB3
DDX5 taf10
Normal Normal
Normal Normal
Tumour Tumour
Tumour Tumour
sample no.
Gene E
xpre
ssio
n V
alu
e
sample no.
Gene E
xpre
ssio
n V
alu
e
sample no.
Gene E
xpre
ssio
n V
alu
e
0 5 10 15 20 25 30 35
5.2
5.6
6.0
0 5 10 15 20 25 30 35
5.6
5.8
6.0
6.2
0 5 10 15 20 25 30 35
11.2
11.6
12.0
12.4
0 5 10 15 20 25 30 35
8.5
9.0
9.5
10.0
sample no.
Gene E
xpre
ssio
n V
alu
e
sample no.
Gene E
xpre
ssio
n V
alu
e
sample no.
Gene E
xpre
ssio
n V
alu
e
sample no.
Gene E
xpre
ssio
n V
alu
e
0 5 10 15 20 25 30 35
6.5
7.0
7.5
8.0
0 5 10 15 20 25 30 35
6.0
6.4
6.8
7.2
0 5 10 15 20 25 30 35
5.2
5.6
6.0
0 5 10 15 20 25 30 35
5.6
5.8
6.0
6.2
sample no.
Gene E
xpre
ssio
n V
alu
e
sample no.
Gene E
xpre
ssio
n V
alu
e
sample no.
Gene E
xpre
ssio
n V
alu
e
sample no.
Gene E
xpre
ssio
n V
alu
e
0 5 10 15 20 25 30 35
5.2
5.6
6.0
0 5 10 15 20 25 30 35
5.6
5.8
6.0
6.2
0 5 10 15 20 25 30 35
11.2
11.6
12.0
12.4
0 5 10 15 20 25 30 35
8.5
9.0
9.5
10.0
sample no.
Gene E
xpre
ssio
n V
alu
e
a b
c d
Figure 6
Copyright © 2022 FDOKUMEN