
Ethylene stimulates the accumulation of ripening-related mRNAs in tomatoes
Upload
independentCategory
view
1download
0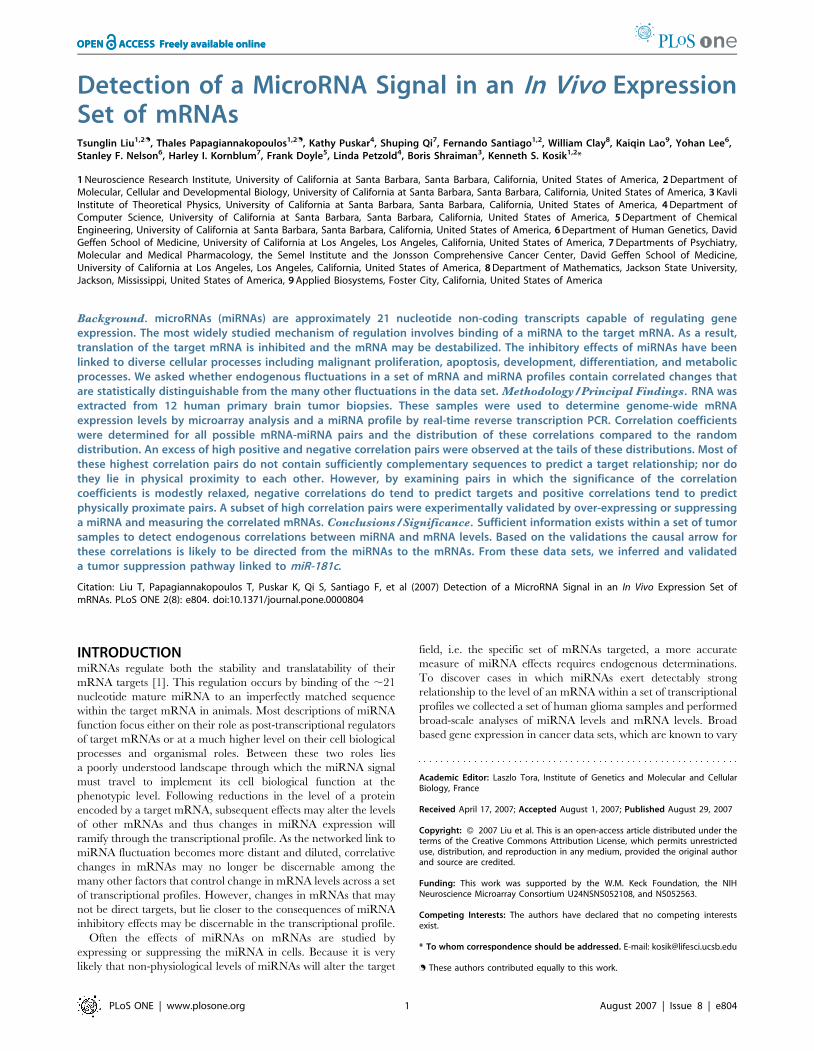
Detection of a MicroRNA Signal in an In Vivo ExpressionSet of mRNAsTsunglin Liu1,2., Thales Papagiannakopoulos1,2., Kathy Puskar4, Shuping Qi7, Fernando Santiago1,2, William Clay8, Kaiqin Lao9, Yohan Lee6,Stanley F. Nelson6, Harley I. Kornblum7, Frank Doyle5, Linda Petzold4, Boris Shraiman3, Kenneth S. Kosik1,2*
1 Neuroscience Research Institute, University of California at Santa Barbara, Santa Barbara, California, United States of America, 2 Department ofMolecular, Cellular and Developmental Biology, University of California at Santa Barbara, Santa Barbara, California, United States of America, 3 KavliInstitute of Theoretical Physics, University of California at Santa Barbara, Santa Barbara, California, United States of America, 4 Department ofComputer Science, University of California at Santa Barbara, Santa Barbara, California, United States of America, 5 Department of ChemicalEngineering, University of California at Santa Barbara, Santa Barbara, California, United States of America, 6 Department of Human Genetics, DavidGeffen School of Medicine, University of California at Los Angeles, Los Angeles, California, United States of America, 7 Departments of Psychiatry,Molecular and Medical Pharmacology, the Semel Institute and the Jonsson Comprehensive Cancer Center, David Geffen School of Medicine,University of California at Los Angeles, Los Angeles, California, United States of America, 8 Department of Mathematics, Jackson State University,Jackson, Mississippi, United States of America, 9 Applied Biosystems, Foster City, California, United States of America
Background. microRNAs (miRNAs) are approximately 21 nucleotide non-coding transcripts capable of regulating geneexpression. The most widely studied mechanism of regulation involves binding of a miRNA to the target mRNA. As a result,translation of the target mRNA is inhibited and the mRNA may be destabilized. The inhibitory effects of miRNAs have beenlinked to diverse cellular processes including malignant proliferation, apoptosis, development, differentiation, and metabolicprocesses. We asked whether endogenous fluctuations in a set of mRNA and miRNA profiles contain correlated changes thatare statistically distinguishable from the many other fluctuations in the data set. Methodology/Principal Findings. RNA wasextracted from 12 human primary brain tumor biopsies. These samples were used to determine genome-wide mRNAexpression levels by microarray analysis and a miRNA profile by real-time reverse transcription PCR. Correlation coefficientswere determined for all possible mRNA-miRNA pairs and the distribution of these correlations compared to the randomdistribution. An excess of high positive and negative correlation pairs were observed at the tails of these distributions. Most ofthese highest correlation pairs do not contain sufficiently complementary sequences to predict a target relationship; nor dothey lie in physical proximity to each other. However, by examining pairs in which the significance of the correlationcoefficients is modestly relaxed, negative correlations do tend to predict targets and positive correlations tend to predictphysically proximate pairs. A subset of high correlation pairs were experimentally validated by over-expressing or suppressinga miRNA and measuring the correlated mRNAs. Conclusions/Significance. Sufficient information exists within a set of tumorsamples to detect endogenous correlations between miRNA and mRNA levels. Based on the validations the causal arrow forthese correlations is likely to be directed from the miRNAs to the mRNAs. From these data sets, we inferred and validateda tumor suppression pathway linked to miR-181c.
Citation: Liu T, Papagiannakopoulos T, Puskar K, Qi S, Santiago F, et al (2007) Detection of a MicroRNA Signal in an In Vivo Expression Set ofmRNAs. PLoS ONE 2(8): e804. doi:10.1371/journal.pone.0000804
INTRODUCTIONmiRNAs regulate both the stability and translatability of their
mRNA targets [1]. This regulation occurs by binding of the ,21
nucleotide mature miRNA to an imperfectly matched sequence
within the target mRNA in animals. Most descriptions of miRNA
function focus either on their role as post-transcriptional regulators
of target mRNAs or at a much higher level on their cell biological
processes and organismal roles. Between these two roles lies
a poorly understood landscape through which the miRNA signal
must travel to implement its cell biological function at the
phenotypic level. Following reductions in the level of a protein
encoded by a target mRNA, subsequent effects may alter the levels
of other mRNAs and thus changes in miRNA expression will
ramify through the transcriptional profile. As the networked link to
miRNA fluctuation becomes more distant and diluted, correlative
changes in mRNAs may no longer be discernable among the
many other factors that control change in mRNA levels across a set
of transcriptional profiles. However, changes in mRNAs that may
not be direct targets, but lie closer to the consequences of miRNA
inhibitory effects may be discernable in the transcriptional profile.
Often the effects of miRNAs on mRNAs are studied by
expressing or suppressing the miRNA in cells. Because it is very
likely that non-physiological levels of miRNAs will alter the target
field, i.e. the specific set of mRNAs targeted, a more accurate
measure of miRNA effects requires endogenous determinations.
To discover cases in which miRNAs exert detectably strong
relationship to the level of an mRNA within a set of transcriptional
profiles we collected a set of human glioma samples and performed
broad-scale analyses of miRNA levels and mRNA levels. Broad
based gene expression in cancer data sets, which are known to vary
Academic Editor: Laszlo Tora, Institute of Genetics and Molecular and CellularBiology, France
Received April 17, 2007; Accepted August 1, 2007; Published August 29, 2007
Copyright: � 2007 Liu et al. This is an open-access article distributed under theterms of the Creative Commons Attribution License, which permits unrestricteduse, distribution, and reproduction in any medium, provided the original authorand source are credited.
Funding: This work was supported by the W.M. Keck Foundation, the NIHNeuroscience Microarray Consortium U24NSNS052108, and NS052563.
Competing Interests: The authors have declared that no competing interestsexist.
* To whom correspondence should be addressed. E-mail: [email protected]
. These authors contributed equally to this work.
PLoS ONE | www.plosone.org 1 August 2007 | Issue 8 | e804

in a manner that is predictive of tumor grade and patient
prognosis [2–4], were used to find significant correlations between
endogenous fluctuations in the miRNA and mRNA expression.
mRNAs were measured with oligonucleotide arrays (Affymetrix).
The miRNA profile was measured by multiplex RT-PCR (Applied
Biosystems) which can discern the specificity of miRNAs even for
very similar sequences from the same family [5]. These methods are
more reliable when comparing the expression of the same miRNA,
which was done in this study. The statistical analysis applied to the
data set revealed an excess of high correlation miRNA-mRNA pairs
beyond the number expected by chance. A subset of these high
correlation pairs was experimentally validated and revealed
a network of linked genes related to carcinogenesis.
RESULTS
Detection of highly correlated of miRNA-mRNA pairsWe measured the expression levels of 330 miRNAs and about
14,500 genes in 12 brain tumor biopsies from humans using
multiplex RT-PCR and Affymetrix oligonucleotide microarrays,
respectively. Before correlation analysis, we filtered data with
substantial noise due to low abundance in order to gain more
confidence in the resulting correlations (see Methods). We also
filtered those data with little variation across the 12 samples because
the absence of high variation will result in correlations mainly due to
noise. These criteria left 93 miRNAs and 7,089 probe sets for the
analysis. This approach was chosen because we intended to ask
whether there existed significant correlation within a highly
accurate data set, instead of extracting lower reliability data from
the entire data set. Both the mRNA and the miRNA data sets were
normalized by quantile normalization (see Methods). After
normalization, we calculated the Pearson’s correlation between
the expression profiles of the miRNAs and the mRNAs, and
compared these correlations with the random case. The random
case is referred to as any result obtained from randomly generated
or permuted expression profiles. Here, we asked whether the
distribution of 93*7,089 = 659,277 correlation coefficients, r’s, from
the data set was significantly different from the random case.
The distribution of r’s between our data set and the random
case (see Methods for a derived closed form solution of the random
case) clearly differed (Figure 1A). To ensure a truly random
control, we randomly permuted the order of samples in miRNA
(or mRNA) profiles and repeated the analysis 100 times. Such
random permutations preserved the autocorrelations among
miRNAs and mRNAs, and generated results close to the random
case. Quantitatively, our data set output 74 and 1631 correlations
below 20.9 and 20.8 respectively, while the output from the
random cases was 23.65 and 615.12 on average. The binomial
probability to obtain at least 74 and 1631 correlations from
659277 random trials with a probability of success (23.65/659277)
and (615.12/659277) was 1.4*10211 and 1.6*10211 respectively.
Similarly, the binomial probability to obtain at least 75 and 1735
correlations above 0.9 and 0.8 from 659277 random trials with
a probability of success (23.73/659277) and (628.19/659277) was
3.6*10211 and 1.1*10211 respectively. These small p-values
indicated the significant difference between our data set and the
random cases. Thus, the correlations between miRNAs and
mRNAs contained information regarding interactions, but did not
suggest a causal direction of the interaction. The difference
between the distribution of correlations in the data set and that of
the random distributions, was re-plotted with the ratio between the
number of r’s in each range of experimentally derived coefficients
to the random case (Figure1B). At both positive and negative
correlation tails, the miRNA-mRNA correlations were stronger
and more numerous than expected in the random case.
As seen in Figure1B the high positive and negative correlations
at the tails indicated a set of miRNA-mRNA correlations that were
stronger and more numerous than expected in the random case.
To define this set we defined a cutoff rc according to the equality
P(r < �rc(or r > rc) in the random case)�
(number of mRNAs)~0:1
This says that for a given miRNA, the expected number of mRNAs
with correlation greater than rc (,0.916 with 7089 mRNAs) is only
0.1 in the random case. A correlation coefficient was considered
high when the absolute value was above the 0.916 cutoff. With
a total of 93 miRNAs, we would expect 9.3 pairs with a high
negative correlation by chance; however we obtained 35 such pairs
from our experimental data (Table1), of which 27% were expected
to occur by chance. Similarly, for the positive correlations, we
obtained 37 such pairs, of which 25% were expected to occur by
chance. In other words, approximately one quarter of the total high
correlation pairs—72 positive and negative correlations (Table1)—
could be false positives. Nevertheless, the binomial probability in
obtaining at least 72 coefficients above the cutoff with the
probability of success 0.1 is very low (P,5*10221).
Figure 1. Distribution of correlation coefficients. (A) The histogram consists of 40 bins ranging from 21 to 1. (B) The ratio of number of correlationcoefficients in the experimental data to the random case for bin in Figureo 1A. At high correlations, the number of microRNA-mRNA pairs is largerthan expected in the random case. This result suggests information exists in the correlation coefficients between miRNAs and mRNAs.doi:10.1371/journal.pone.0000804.g001
MiRNA/mRNA Correlated Pairs
PLoS ONE | www.plosone.org 2 August 2007 | Issue 8 | e804
The clear correlation signal arising from just 12 samples was
somewhat surprising given the very large number of correlations
tested. However, the finding was validated by demonstrating
a decline in excess strong correlations over the random case with
fewer samples (Figure S2, where the ratio in number of
coefficients, similar to Figure1B, was plotted). The signal declined
with fewer samples because the correlation between a miRNA and
an mRNA in the actual data did not increase as fast as the
probability for high correlations in the random case. This
difference from the random case increased our confidence that
the signal was bona fide.
Target Predictions among Correlated PairsAmong the explanations for high negative correlation pairs is
direct targeting of the mRNA by the paired miRNA. Therefore,
we checked the percentage of miRNA-mRNA high correlation
pairs that were predicted as target pairs by TargetScan [6].
Among the 35 high negative correlation pairs four were predicted
to have one target site (Table1). This number of predicted targets
may represent chance because among 37 high positive correlation
pairs five were predicted to have one target site. No high positive
correlation pair has two predicted sites, but among the high
correlation negative correlation pairs two pairs (in addition to the
four single target site pairs) had two predicted target sites (Table1).
Among the 659277 miRNA-mRNA pairs, 84238 (,12.8%) were
predicted targets. Thus, with 35 (or 37) pairs, we would expect
about 4,5 predicted target pairs by chance, which was the case
for the highly correlated miRNA-mRNA pairs. These findings
demonstrate that the dominant feature of the miRNA-mRNA
relationship in terms of the magnitude of change in the mRNAs is
indirectly related to the binding of the miRNA to its mRNA
targets. miRNA binding to a target usually has only a modest effect
on the level of the target mRNA and a greater effect on the
Figure 2. Percentage of predicted targets across a range ofcorrelation coefficients. The percentage of targets over the range ofcorrelation defined in Figureo 1 decreases with the increasingcorrelation between miRNAs and mRNAs. This implies that thecorrelation indeed captures information about target prediction, andthe negative slope might be related to direct targeting effect betweenmiRNAs and mRNAs.doi:10.1371/journal.pone.0000804.g002
Table 1. List of miRNA-mRNA high correlation pairs and number of predicted target sites.. . . . . . . . . . . . . . . . . . . . . . . . . . . . . . . . . . . . . . . . . . . . . . . . . . . . . . . . . . . . . . . . . . . . . . . . . . . . . . . . . . . . . . . . . . . . . . . . . . . . . . . . . . . . . . . . . . . . . . . . . . . . . . . . . . . . . . . . . . . . . . . . . .
miRNA(hsa-) mRNA r site miRNA(hsa-) mRNA r site miRNA(hsa-) mRNA r site
let-7b ULK2 0.93 1 miR-195 SF3B2 0.92 0 miR-30d ASTN 0.94 0
let-7i CBLB 20.92 0 miR-195 AARS 0.93 0 miR-30d TAOK3 0.94 0
miR-106b ADSS 20.92 0 miR-195 SVIL 20.94 1 miR-340 LAMC1 20.96 0
miR-106b TCF4 0.96 0 miR-195 LNK,SH2B3 20.92 0 miR-340 LPHN2 20.93 0
miR-139 INPP5A 0.96 0 miR-195 MAPT 0.92 0 miR-340 DNM3 0.94 0
miR-142-5p SNAP23 0.92 1 miR-195 FTO 0.93 0 miR-342 LPHN1 20.92 0
miR-142-5p EVI2B 0.92 1 miR-195 SCN3A 0.92 1 miR-342 APC2 20.92 0
miR-181c PCAF 0.93 1 miR-19a ANXA4 20.93 1 miR-365 APIP 0.92 0
miR-181c ASCC1 0.95 0 miR-19a GSTO1 20.92 0 miR-92 ANXA7 20.93 0
miR-193a TM9SF1 0.92 0 miR-19a IFITM1 20.94 1 miR-182 FADS2 0.92 0
miR-193a B3GALNT1 0.94 0 miR-19a DDX11 0.93 0 miR-182 HPS1 20.93 0
miR-193a SOD2 0.92 0 miR-19a TTC3 0.93 0 miR-204 HRASLS 20.92 0
miR-193a PBEF1 0.93 0 miR-19a ENTPD1 20.93 0 miR-9 ATP6V0E 20.93 0
miR-194 AARS 0.95 0 miR-19a NCF2 20.92 0 miR-9 AMPD3 20.93 0
miR-194 LNK,SH2B3 20.96 0 miR-19a PRR13 20.92 0 miR-9 CCNG1 20.92 1
miR-194 REEP1 0.93 0 miR-27a PDZD8 20.92 0 miR-99a MAPT 0.93 0
miR-194 INA 0.92 0 miR-27b FSCN1 0.92 0 miR-99a MAPT 0.92 0
miR-194 LY75 20.95 0 miR-29a TRIM37 20.94 2 miR-155 RGS17 0.95 0
miR-194 PBX1 0.92 0 miR-29b DDX50 0.94 0 miR-155 SPRY4 0.92 0
miR-194 SCAMP5 0.92 0 miR-30b RAP2C 20.93 2 miR-376b TULP3 20.92 0
miR-194 RPIP8 0.92 0 miR-30c TXNIP 20.93 0 miR-518a-2* COPS4 20.93 0
miR-194 DLST,DLSTP 20.95 0 miR-30c ULK2 20.92 0 miR-518a-2* DCHS1 20.92 0
miR-194 CTBS 20.94 0 miR-30d TSPAN7 0.92 0 miR-93 PVRL2 20.93 0
miR-194 C1orf78 20.95 0 miR-30d PFKM 0.95 0 miR-95 HS2ST1 20.96 0
doi:10.1371/journal.pone.0000804.t001....
....
....
....
....
....
....
....
....
....
....
....
....
....
....
....
....
....
....
....
....
....
....
....
....
....
..
MiRNA/mRNA Correlated Pairs
PLoS ONE | www.plosone.org 3 August 2007 | Issue 8 | e804
encoded protein. Therefore, direct binding effects are more
difficult to detect in an endogenous data set of profiles. However,
the ability to detect specific endogenous changes in an mRNA
profile associated with miRNA fluctuations has not been pre-
viously reported.
Although most of the strongest miRNA-mRNA correlations are
not likely to be due to direct targeting, it is possible to detect in the
data set a weak effect that is consistent with miRNA targeting to
specific mRNAs. The coefficients of all miRNA-mRNA pairs were
split into 40 bins, ranging from 21 to 1 with a bin size 0.05 and
the percentage of predicted target pairs for each bin calculated
(Figure2). A clear trend was observed as the correlation went from
negative to positive: the percentage of predicted target pairs
decreased. As a control, we repeated the target analysis for the 100
random permutations mentioned above and compared their slopes
(see Methods). None of the 100 random permutations gave a slope
as negative as our observation, which indicated the significance of
the trend. This finding is consistent with data that miRNAs can
down regulate their targeted mRNAs [7], and therefore more
predicted target pairs should lie in the region of negative
correlation. This trend was apparent in the data even though
about 87% of the miRNA-mRNA pairs were not predicted as
target pairs by TargetScan.
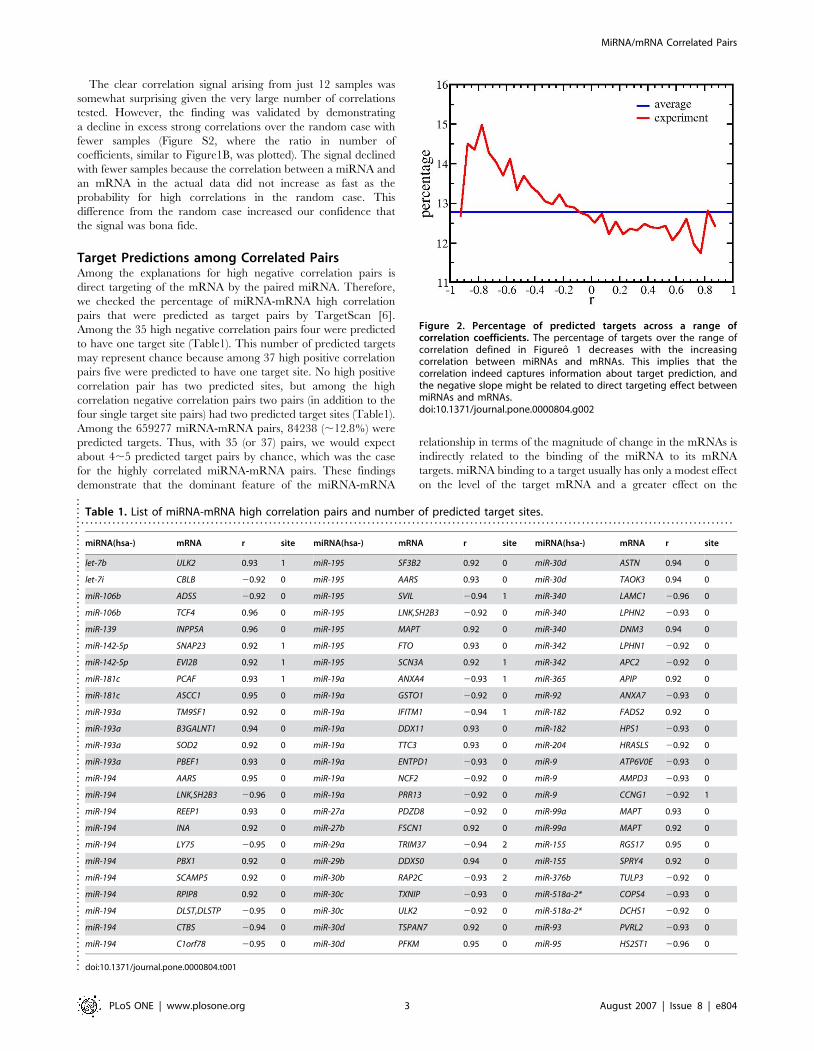
Having detected a relationship between negative correlation
values and the percentage of predicted targets, we next asked
whether for a given miRNA, do its predicted targets show more
negative correlations. To this end, we split the 7,089 correlations
of each miRNA into two groups, those with and without predicted
targets. We then applied one sided Wilcoxon Rank Sum (WRS)
test to check the null hypothesis, that the correlation of the first
group is not lower than the second group. For each miRNA, the
one sided WRS test gave a P-value, and a P-value smaller than
a given cutoff indicated that the correlation with the predicted
targets was more negative than that with non-predicted targets. Of
91 miRNAs (two miRNAs from the set of 93 were not in
TargetScan.), 28 (,30%) miRNAs fell below the significance level
P = 0.05 (Figure3). Using the Bonferroni correction for multiple
tests, 7 miRNAs were found to show significantly more negative
correlations with the predicted targets, while only two were found
to show more positive correlation (Figure3). No relationship was
found between miRNA abundance and this difference in the rank
sum. Thus, those pairs which are predicted targets, but showed
a more positive correlation may be indirectly related.
Positive Correlations between Proximate PairsSome miRNAs are intronic, and these miRNAs show correlated
expression patterns with their host genes [8]. This observation was
replicated in our data where almost all the miRNAs and their host
genes showed positive correlations (Table2). Three miRNA-
mRNA pairs, miR-25/MCM7, miR-15b/SMC4L1, and miR-30c/
NFYC also appeared in the previous study. The reported
correlation coefficients were 0.838, 0.509, and 0.406, respectively,
values which are consistent with our data (Table2). We also
observed the co-expression of neighboring miRNAs as reported in
the same study (Figure S1).
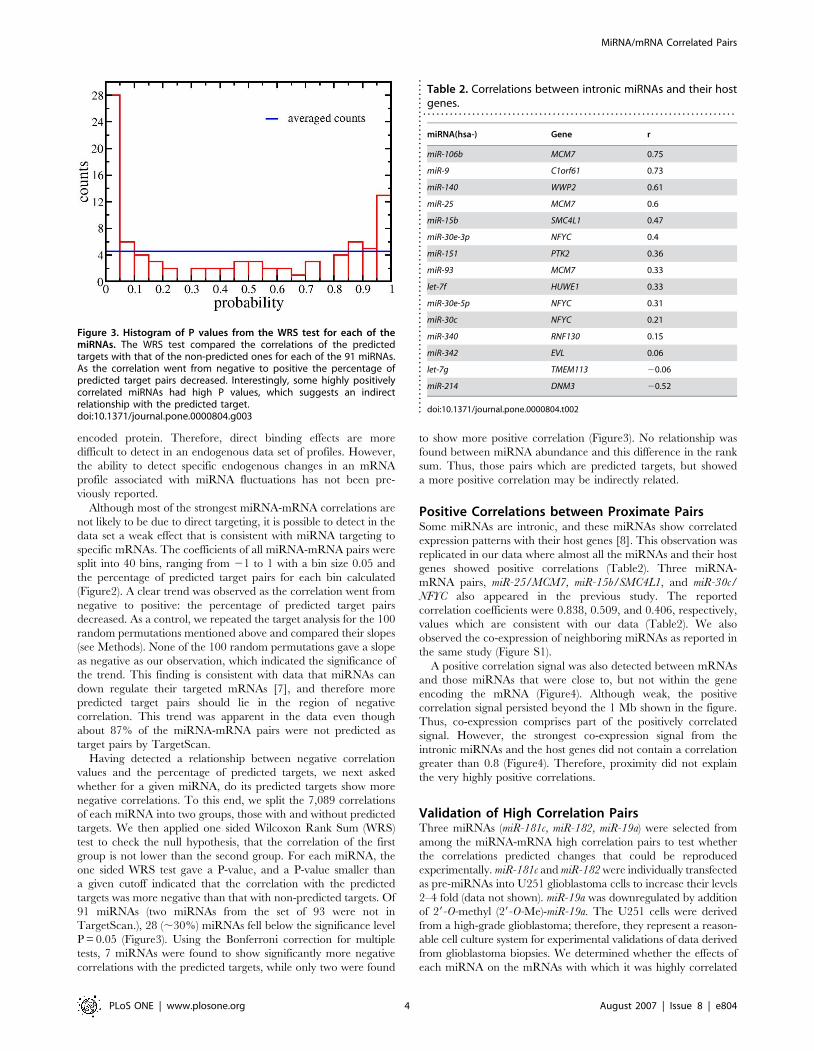
A positive correlation signal was also detected between mRNAs
and those miRNAs that were close to, but not within the gene
encoding the mRNA (Figure4). Although weak, the positive
correlation signal persisted beyond the 1 Mb shown in the figure.
Thus, co-expression comprises part of the positively correlated
signal. However, the strongest co-expression signal from the
intronic miRNAs and the host genes did not contain a correlation
greater than 0.8 (Figure4). Therefore, proximity did not explain
the very highly positive correlations.
Validation of High Correlation PairsThree miRNAs (miR-181c, miR-182, miR-19a) were selected from
among the miRNA-mRNA high correlation pairs to test whether
the correlations predicted changes that could be reproduced
experimentally. miR-181c and miR-182 were individually transfected
as pre-miRNAs into U251 glioblastoma cells to increase their levels
2–4 fold (data not shown). miR-19a was downregulated by addition
of 29-O-methyl (29-O-Me)-miR-19a. The U251 cells were derived
from a high-grade glioblastoma; therefore, they represent a reason-
able cell culture system for experimental validations of data derived
from glioblastoma biopsies. We determined whether the effects of
each miRNA on the mRNAs with which it was highly correlated
Figure 3. Histogram of P values from the WRS test for each of themiRNAs. The WRS test compared the correlations of the predictedtargets with that of the non-predicted ones for each of the 91 miRNAs.As the correlation went from negative to positive the percentage ofpredicted target pairs decreased. Interestingly, some highly positivelycorrelated miRNAs had high P values, which suggests an indirectrelationship with the predicted target.doi:10.1371/journal.pone.0000804.g003
Table 2. Correlations between intronic miRNAs and their hostgenes.
. . . . . . . . . . . . . . . . . . . . . . . . . . . . . . . . . . . . . . . . . . . . . . . . . . . . . . . . . . . . . . . . . . . . . .
miRNA(hsa-) Gene r
miR-106b MCM7 0.75
miR-9 C1orf61 0.73
miR-140 WWP2 0.61
miR-25 MCM7 0.6
miR-15b SMC4L1 0.47
miR-30e-3p NFYC 0.4
miR-151 PTK2 0.36
miR-93 MCM7 0.33
let-7f HUWE1 0.33
miR-30e-5p NFYC 0.31
miR-30c NFYC 0.21
miR-340 RNF130 0.15
miR-342 EVL 0.06
let-7g TMEM113 20.06
miR-214 DNM3 20.52
doi:10.1371/journal.pone.0000804.t002....
....
....
....
....
....
....
....
....
....
....
....
....
....
....
....
....
....
...
MiRNA/mRNA Correlated Pairs
PLoS ONE | www.plosone.org 4 August 2007 | Issue 8 | e804
corresponded to the relationship predicted in the correlation data
set. These experiments also served to suggest the direction of
causality between the correlated pair.
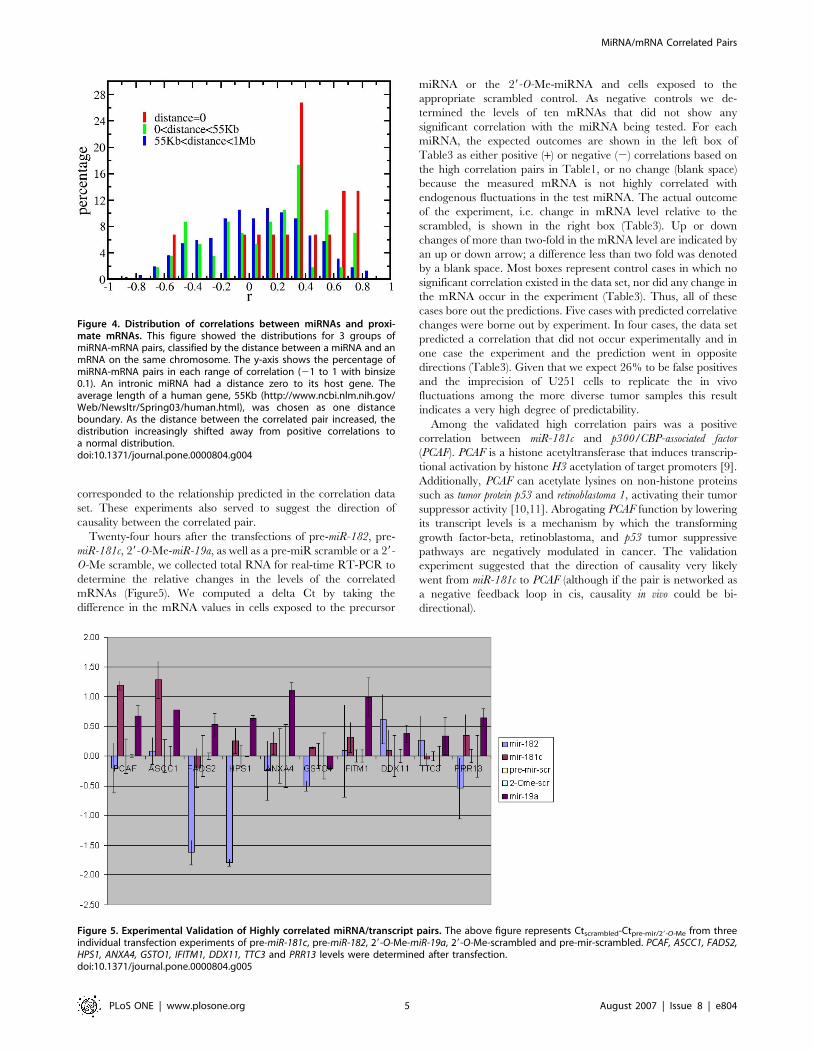
Twenty-four hours after the transfections of pre-miR-182, pre-
miR-181c, 29-O-Me-miR-19a, as well as a pre-miR scramble or a 29-
O-Me scramble, we collected total RNA for real-time RT-PCR to
determine the relative changes in the levels of the correlated
mRNAs (Figure5). We computed a delta Ct by taking the
difference in the mRNA values in cells exposed to the precursor
miRNA or the 29-O-Me-miRNA and cells exposed to the
appropriate scrambled control. As negative controls we de-
termined the levels of ten mRNAs that did not show any
significant correlation with the miRNA being tested. For each
miRNA, the expected outcomes are shown in the left box of
Table3 as either positive (+) or negative (2) correlations based on
the high correlation pairs in Table1, or no change (blank space)
because the measured mRNA is not highly correlated with
endogenous fluctuations in the test miRNA. The actual outcome
of the experiment, i.e. change in mRNA level relative to the
scrambled, is shown in the right box (Table3). Up or down
changes of more than two-fold in the mRNA level are indicated by
an up or down arrow; a difference less than two fold was denoted
by a blank space. Most boxes represent control cases in which no
significant correlation existed in the data set, nor did any change in
the mRNA occur in the experiment (Table3). Thus, all of these
cases bore out the predictions. Five cases with predicted correlative
changes were borne out by experiment. In four cases, the data set
predicted a correlation that did not occur experimentally and in
one case the experiment and the prediction went in opposite
directions (Table3). Given that we expect 26% to be false positives
and the imprecision of U251 cells to replicate the in vivo
fluctuations among the more diverse tumor samples this result
indicates a very high degree of predictability.
Among the validated high correlation pairs was a positive
correlation between miR-181c and p300/CBP-associated factor
(PCAF). PCAF is a histone acetyltransferase that induces transcrip-
tional activation by histone H3 acetylation of target promoters [9].
Additionally, PCAF can acetylate lysines on non-histone proteins
such as tumor protein p53 and retinoblastoma 1, activating their tumor
suppressor activity [10,11]. Abrogating PCAF function by lowering
its transcript levels is a mechanism by which the transforming
growth factor-beta, retinoblastoma, and p53 tumor suppressive
pathways are negatively modulated in cancer. The validation
experiment suggested that the direction of causality very likely
went from miR-181c to PCAF (although if the pair is networked as
a negative feedback loop in cis, causality in vivo could be bi-
directional).
Figure 4. Distribution of correlations between miRNAs and proxi-mate mRNAs. This figure showed the distributions for 3 groups ofmiRNA-mRNA pairs, classified by the distance between a miRNA and anmRNA on the same chromosome. The y-axis shows the percentage ofmiRNA-mRNA pairs in each range of correlation (21 to 1 with binsize0.1). An intronic miRNA had a distance zero to its host gene. Theaverage length of a human gene, 55Kb (http://www.ncbi.nlm.nih.gov/Web/Newsltr/Spring03/human.html), was chosen as one distanceboundary. As the distance between the correlated pair increased, thedistribution increasingly shifted away from positive correlations toa normal distribution.doi:10.1371/journal.pone.0000804.g004
Figure 5. Experimental Validation of Highly correlated miRNA/transcript pairs. The above figure represents Ctscrambled-Ctpre-mir/29-O-Me from threeindividual transfection experiments of pre-miR-181c, pre-miR-182, 29-O-Me-miR-19a, 29-O-Me-scrambled and pre-mir-scrambled. PCAF, ASCC1, FADS2,HPS1, ANXA4, GSTO1, IFITM1, DDX11, TTC3 and PRR13 levels were determined after transfection.doi:10.1371/journal.pone.0000804.g005
MiRNA/mRNA Correlated Pairs
PLoS ONE | www.plosone.org 5 August 2007 | Issue 8 | e804

We performed western blot analysis to verify the increase of
PCAF protein levels in response to miR-181c upregulation in U251
cells and in an additional glioma line, U87. Twenty-four hours
post-transfection we observed a significant increase in PCAF in the
pre-miR-181c treated U87 and U251 cells when compared to the
negative control scramble (Figure6A,B). This observation sug-
gested that the increase of PCAF observed in the qPCR
experiments was translated into an increase in the protein/enzyme
levels in both glioma lines. The upregulation of PCAF in response
to increased miR-181c could occur through a known transactivator
of PCAF, p53 [12,13]. We checked the levels of p53 in both U251
and U87 treated cells and observed a significant increase of p53
protein levels in the miR-181c treated U251 cells (Figure6C,D);
however we could not detect p53 in the U87 cells.
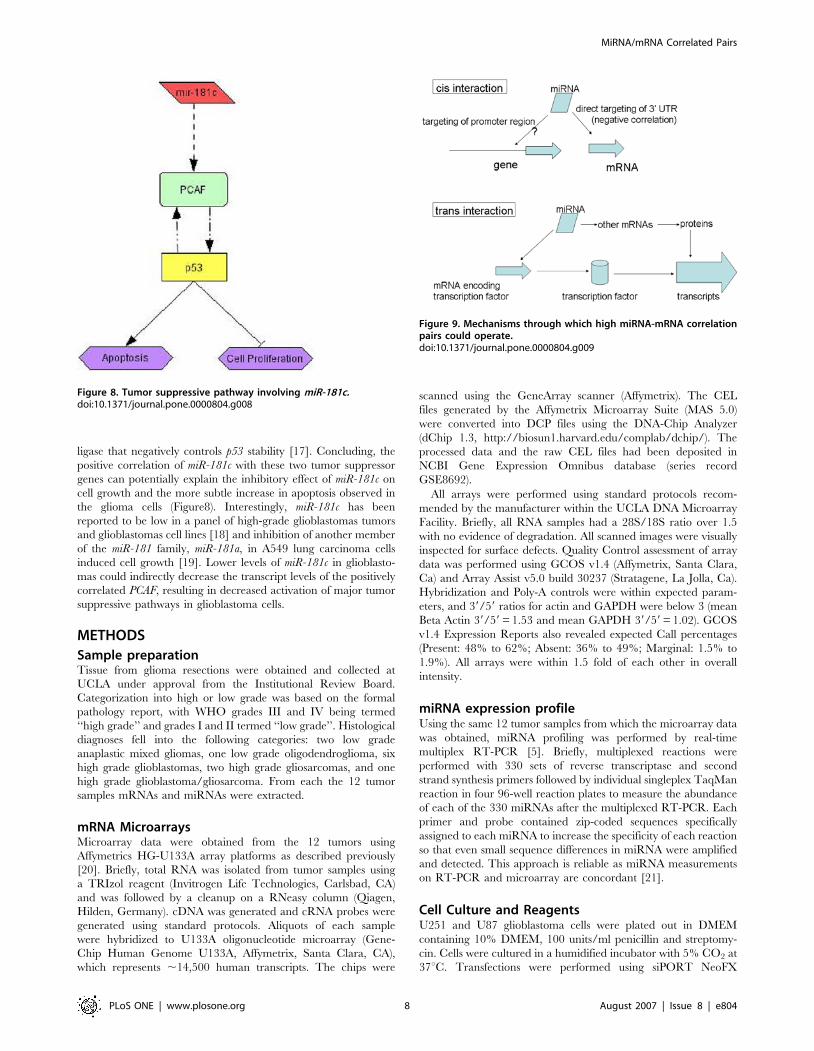
We then tested how miR-181c upregulation affected cell
proliferation and apoptosis, because the upregulation of PCAF
and p53 protein levels in U251 cells could lead to activation of
a plethora of other downstream tumor suppressive genes that can
suppress the oncogenic state of these glioma cells. We used the
Cell-Titer Glo assay to determine the number of metabolically
viable cells upon addition of miR-181c as compared to the
negative control scramble. We observed ,30% (p,0.01, t-test)
decrease in viable cells in the miR-181c treated sample, relative to
the negative control (Figure7A). This decrease could occur due to
increased apoptosis, therefore we checked the activity of Caspase-
3/7 in cells that were treated under the same conditions. There
was ,12% (p,0.05, t-test) increase in Caspase-3/7 activity in
response to miR-181c upregulation relative to the negative control
(Figure7B). These results suggest that the decrease of cell
numbers with miR-181c addition could be partially explained
by increased apoptosis. However, the level of apoptosis that we
observed does not fully account for the much higher difference in
the viable cell numbers, suggesting that miR-181c is also having
an anti-proliferative effect which could be mediated through p53
and PCAF (Figure8).
DISCUSSIONRNA from 12 brain tumor samples with some variation in their
histological diagnoses was sufficient to detect a set of miRNA-
mRNA pairs whose fluctuations are highly correlated. The merit
of this statistical detection method is that it avoids non-
physiological conditions required to alter gene expression. The
number of such high correlation pairs was significantly greater
than expected in the random case (Figure1). A weak positive
correlative effect due to distance between the pairs could be
detected (Figure4) as well as a weak negative correlative effect due
to direct miRNA targeting of mRNAs (Figure2,3). However,
among the very high correlation pairs only a small number bore
a predicted target relationship (11 of 72, Table1) or were located
on the same chromosome (7 of 72). For the remaining high
correlation pairs the data does not imply any direction of
casualty—is the correlation due to an effect of the miRNA on
the mRNA or vice versa? Key to this approach was the
endogeneous variations among the samples. In other words, the
correlations might stem from individual differences and are not
tumor specific. By restricting the samples to gliomas rather than
including healthy controls, these data in general cannot directly
address carcinogenesis. The interpretation of the correlations is
limited to miRNA/mRNA relationships solely within our sample
set.
Validation of the correlations was obtained by over-expressing
or suppressing the implicated miRNA and measuring the mRNAs
predicted to correlate. These experiments frequently matched the
prediction and suggested that in these cases, the correlation was
due to an effect of the miRNA on the mRNA (Table3). As
expected, some pairs were not validated. Among the reasons for
failure to validate are: (a) some of the high correlation pairs are
false positives; (b) the U251 cells do not exactly replicate the
tumors; (c) in some cases more than one miRNA contributes to the
effect; (d) the direction of causality may pass from mRNA to
miRNA; (e) direct causality does not underlie the relationship,
rather the high correlation is the consequence that both the
miRNA and the mRNA have a true biological relationship with
a third element. Nevertheless, the statistical approach to
endogenous fluctuations can reveal in vivo effects of miRNAs on
the transcriptional profile.
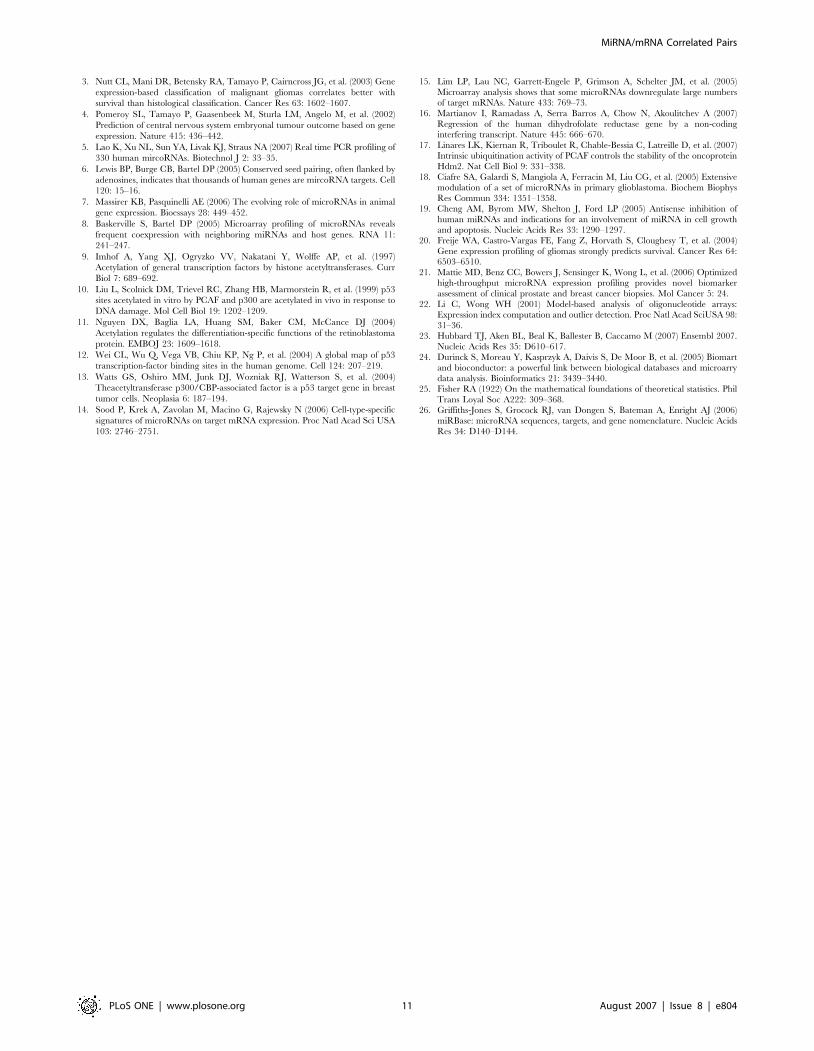
Global effects of miRNAs upon the transcriptional profile and
tissue specificity of mRNA expression have been reported [14,15].
However, these studies have generally focused on miRNA targets
which show more modest effects compared to the non-target
effects described here. Furthermore, in one of the cited studies [15]
the over-expression of a miRNA by transfection can create non-
physiological changes upon the mRNA target field. Because direct
miRNA targeting is unlikely in the absence of a seed region, as
observed in most of the high correlation pairs, other explanations
for how the high correlation pairs might arise were schematized
(Figure9). Among the possible explanations for high correlation
pairing is the binding of the miRNA to the promoter region of the
paired gene with the result that transcription increases in those sets
with positive correlations. A non-coding RNA binding to
a promoter has been described [16], albeit in this case suppression
occurred. Also possible is that the mRNA drives the effect on the
miRNA.
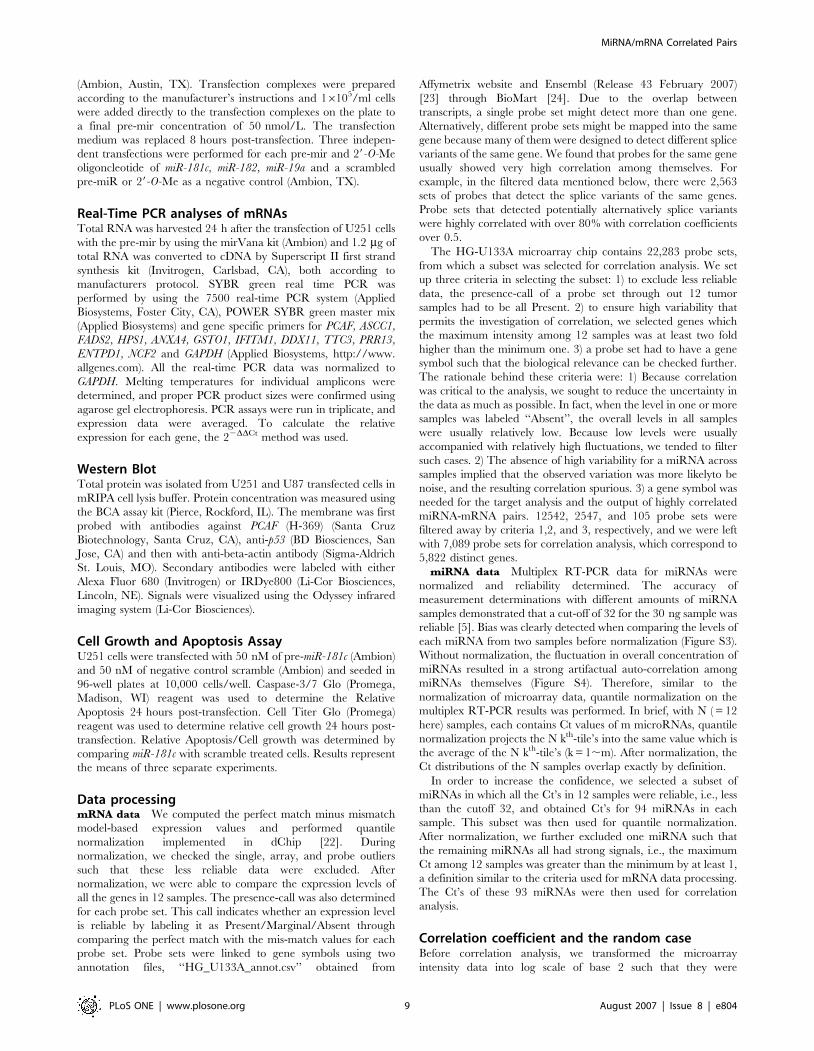
Validation experiments allowed us to infer a tumor suppression
pathway involving miR-181c (Figure8). MiR-181c and PCAF were
among the endogenously highly correlated transcripts. We
determined that miR-181c leads to an increase in PCAF and p53
protein levels consistent with the known positive interactions
between PCAF and p53 (Figure6). At least two possible
mechanisms could explain this result. The increase in p53 protein
levels could drive the increase in PCAF [12,13]. Alternatively, the
increase in p53 could occur through PCAF, which was recently
shown to stabilize p53 by inactivating MDM2, an E3 ubiquitin
Table 3. Validation of highly correlated pairs.. . . . . . . . . . . . . . . . . . . . . . . . . . . . . . . . . . . . . . . . . . . . . . . . . . . . . . . . . . . . . . . . . . . . . .
miR-182 (X) miR-181c (X) miR-19a (Y)
PCAF +X X
ASCC1 +X X
FADS2 +X Y
HPS1 -Y Y
ANXA4 -X X
GSTO1 -X
IFITM1 -X X
DDX11 +Y
TTC3 +Y
PRR13 -X
The left box under each miRNA column indicates a high positive (+) or negative(2) correlation (|r|.0.916) of that miRNA with the mRNA in each row. The up ordown arrow next to the plus or minus sign indicates the expected directionwhen the miRNA at the top of the column is experimentally changed. miR-182and 181c were upregulated (X) and miR-19a was downregulated (Y). Theobserved direction of change is indicated in the right box under each miRNAcolumn. A difference of less than two fold is considered as no change anddenoted by a blank.doi:10.1371/journal.pone.0000804.t003..
....
....
....
....
....
....
....
....
....
....
....
....
....
....
....
....
....
....
MiRNA/mRNA Correlated Pairs
PLoS ONE | www.plosone.org 6 August 2007 | Issue 8 | e804
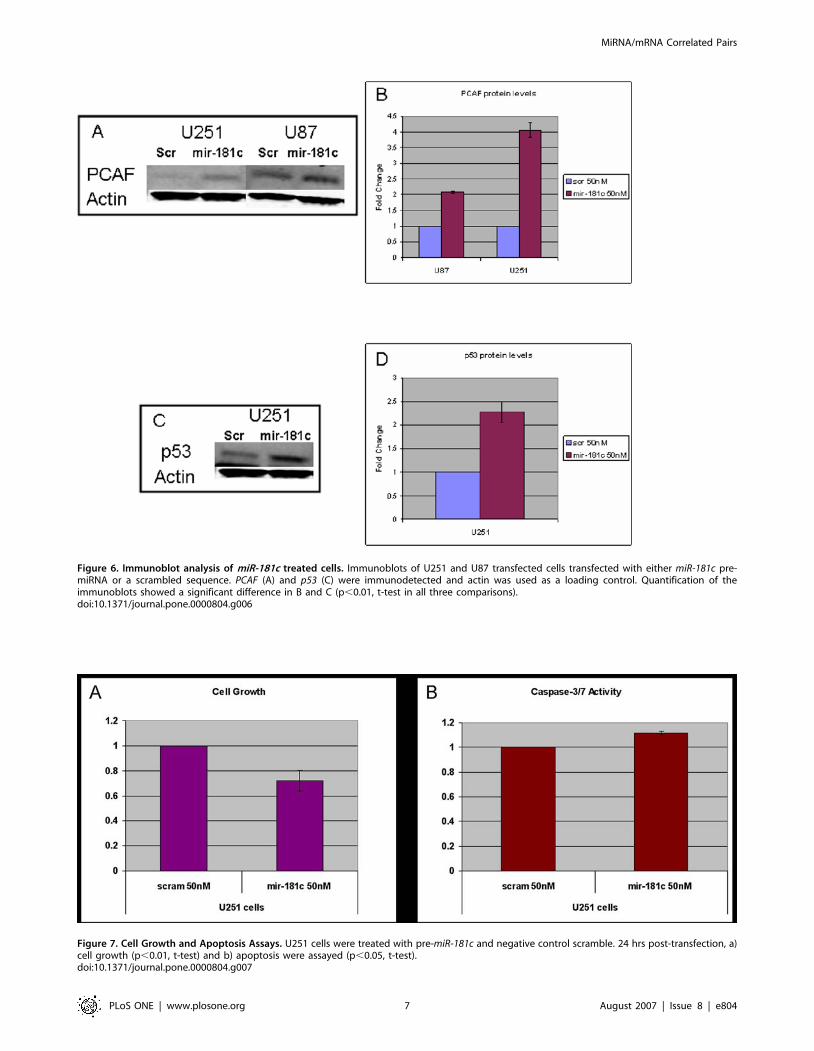
Figure 6. Immunoblot analysis of miR-181c treated cells. Immunoblots of U251 and U87 transfected cells transfected with either miR-181c pre-miRNA or a scrambled sequence. PCAF (A) and p53 (C) were immunodetected and actin was used as a loading control. Quantification of theimmunoblots showed a significant difference in B and C (p,0.01, t-test in all three comparisons).doi:10.1371/journal.pone.0000804.g006
Figure 7. Cell Growth and Apoptosis Assays. U251 cells were treated with pre-miR-181c and negative control scramble. 24 hrs post-transfection, a)cell growth (p,0.01, t-test) and b) apoptosis were assayed (p,0.05, t-test).doi:10.1371/journal.pone.0000804.g007
MiRNA/mRNA Correlated Pairs
PLoS ONE | www.plosone.org 7 August 2007 | Issue 8 | e804
ligase that negatively controls p53 stability [17]. Concluding, the
positive correlation of miR-181c with these two tumor suppressor
genes can potentially explain the inhibitory effect of miR-181c on
cell growth and the more subtle increase in apoptosis observed in
the glioma cells (Figure8). Interestingly, miR-181c has been
reported to be low in a panel of high-grade glioblastomas tumors
and glioblastomas cell lines [18] and inhibition of another member
of the miR-181 family, miR-181a, in A549 lung carcinoma cells
induced cell growth [19]. Lower levels of miR-181c in glioblasto-
mas could indirectly decrease the transcript levels of the positively
correlated PCAF, resulting in decreased activation of major tumor
suppressive pathways in glioblastoma cells.
METHODS
Sample preparationTissue from glioma resections were obtained and collected at
UCLA under approval from the Institutional Review Board.
Categorization into high or low grade was based on the formal
pathology report, with WHO grades III and IV being termed
‘‘high grade’’ and grades I and II termed ‘‘low grade’’. Histological
diagnoses fell into the following categories: two low grade
anaplastic mixed gliomas, one low grade oligodendroglioma, six
high grade glioblastomas, two high grade gliosarcomas, and one
high grade glioblastoma/gliosarcoma. From each the 12 tumor
samples mRNAs and miRNAs were extracted.
mRNA MicroarraysMicroarray data were obtained from the 12 tumors using
Affymetrics HG-U133A array platforms as described previously
[20]. Briefly, total RNA was isolated from tumor samples using
a TRIzol reagent (Invitrogen Life Technologies, Carlsbad, CA)
and was followed by a cleanup on a RNeasy column (Qiagen,
Hilden, Germany). cDNA was generated and cRNA probes were
generated using standard protocols. Aliquots of each sample
were hybridized to U133A oligonucleotide microarray (Gene-
Chip Human Genome U133A, Affymetrix, Santa Clara, CA),
which represents ,14,500 human transcripts. The chips were
scanned using the GeneArray scanner (Affymetrix). The CEL
files generated by the Affymetrix Microarray Suite (MAS 5.0)
were converted into DCP files using the DNA-Chip Analyzer
(dChip 1.3, http://biosun1.harvard.edu/complab/dchip/). The
processed data and the raw CEL files had been deposited in
NCBI Gene Expression Omnibus database (series record
GSE8692).
All arrays were performed using standard protocols recom-
mended by the manufacturer within the UCLA DNA Microarray
Facility. Briefly, all RNA samples had a 28S/18S ratio over 1.5
with no evidence of degradation. All scanned images were visually
inspected for surface defects. Quality Control assessment of array
data was performed using GCOS v1.4 (Affymetrix, Santa Clara,
Ca) and Array Assist v5.0 build 30237 (Stratagene, La Jolla, Ca).
Hybridization and Poly-A controls were within expected param-
eters, and 39/59 ratios for actin and GAPDH were below 3 (mean
Beta Actin 39/59 = 1.53 and mean GAPDH 39/59 = 1.02). GCOS
v1.4 Expression Reports also revealed expected Call percentages
(Present: 48% to 62%; Absent: 36% to 49%; Marginal: 1.5% to
1.9%). All arrays were within 1.5 fold of each other in overall
intensity.
miRNA expression profileUsing the same 12 tumor samples from which the microarray data
was obtained, miRNA profiling was performed by real-time
multiplex RT-PCR [5]. Briefly, multiplexed reactions were
performed with 330 sets of reverse transcriptase and second
strand synthesis primers followed by individual singleplex TaqMan
reaction in four 96-well reaction plates to measure the abundance
of each of the 330 miRNAs after the multiplexed RT-PCR. Each
primer and probe contained zip-coded sequences specifically
assigned to each miRNA to increase the specificity of each reaction
so that even small sequence differences in miRNA were amplified
and detected. This approach is reliable as miRNA measurements
on RT-PCR and microarray are concordant [21].
Cell Culture and ReagentsU251 and U87 glioblastoma cells were plated out in DMEM
containing 10% DMEM, 100 units/ml penicillin and streptomy-
cin. Cells were cultured in a humidified incubator with 5% CO2 at
37uC. Transfections were performed using siPORT NeoFX
Figure 8. Tumor suppressive pathway involving miR-181c.doi:10.1371/journal.pone.0000804.g008
Figure 9. Mechanisms through which high miRNA-mRNA correlationpairs could operate.doi:10.1371/journal.pone.0000804.g009
MiRNA/mRNA Correlated Pairs
PLoS ONE | www.plosone.org 8 August 2007 | Issue 8 | e804
(Ambion, Austin, TX). Transfection complexes were prepared
according to the manufacturer’s instructions and 16105/ml cells
were added directly to the transfection complexes on the plate to
a final pre-mir concentration of 50 nmol/L. The transfection
medium was replaced 8 hours post-transfection. Three indepen-
dent transfections were performed for each pre-mir and 29-O-Me
oligoncleotide of miR-181c, miR-182, miR-19a and a scrambled
pre-miR or 29-O-Me as a negative control (Ambion, TX).
Real-Time PCR analyses of mRNAsTotal RNA was harvested 24 h after the transfection of U251 cells
with the pre-mir by using the mirVana kit (Ambion) and 1.2 mg of
total RNA was converted to cDNA by Superscript II first strand
synthesis kit (Invitrogen, Carlsbad, CA), both according to
manufacturers protocol. SYBR green real time PCR was
performed by using the 7500 real-time PCR system (Applied
Biosystems, Foster City, CA), POWER SYBR green master mix
(Applied Biosystems) and gene specific primers for PCAF, ASCC1,
FADS2, HPS1, ANXA4, GSTO1, IFITM1, DDX11, TTC3, PRR13,
ENTPD1, NCF2 and GAPDH (Applied Biosystems, http://www.
allgenes.com). All the real-time PCR data was normalized to
GAPDH. Melting temperatures for individual amplicons were
determined, and proper PCR product sizes were confirmed using
agarose gel electrophoresis. PCR assays were run in triplicate, and
expression data were averaged. To calculate the relative
expression for each gene, the 22DDCt method was used.
Western BlotTotal protein was isolated from U251 and U87 transfected cells in
mRIPA cell lysis buffer. Protein concentration was measured using
the BCA assay kit (Pierce, Rockford, IL). The membrane was first
probed with antibodies against PCAF (H-369) (Santa Cruz
Biotechnology, Santa Cruz, CA), anti-p53 (BD Biosciences, San
Jose, CA) and then with anti-beta-actin antibody (Sigma-Aldrich
St. Louis, MO). Secondary antibodies were labeled with either
Alexa Fluor 680 (Invitrogen) or IRDye800 (Li-Cor Biosciences,
Lincoln, NE). Signals were visualized using the Odyssey infrared
imaging system (Li-Cor Biosciences).
Cell Growth and Apoptosis AssayU251 cells were transfected with 50 nM of pre-miR-181c (Ambion)
and 50 nM of negative control scramble (Ambion) and seeded in
96-well plates at 10,000 cells/well. Caspase-3/7 Glo (Promega,
Madison, WI) reagent was used to determine the Relative
Apoptosis 24 hours post-transfection. Cell Titer Glo (Promega)
reagent was used to determine relative cell growth 24 hours post-
transfection. Relative Apoptosis/Cell growth was determined by
comparing miR-181c with scramble treated cells. Results represent
the means of three separate experiments.
Data processingmRNA data We computed the perfect match minus mismatch
model-based expression values and performed quantile
normalization implemented in dChip [22]. During
normalization, we checked the single, array, and probe outliers
such that these less reliable data were excluded. After
normalization, we were able to compare the expression levels of
all the genes in 12 samples. The presence-call was also determined
for each probe set. This call indicates whether an expression level
is reliable by labeling it as Present/Marginal/Absent through
comparing the perfect match with the mis-match values for each
probe set. Probe sets were linked to gene symbols using two
annotation files, ‘‘HG_U133A_annot.csv’’ obtained from
Affymetrix website and Ensembl (Release 43 February 2007)
[23] through BioMart [24]. Due to the overlap between
transcripts, a single probe set might detect more than one gene.
Alternatively, different probe sets might be mapped into the same
gene because many of them were designed to detect different splice
variants of the same gene. We found that probes for the same gene
usually showed very high correlation among themselves. For
example, in the filtered data mentioned below, there were 2,563
sets of probes that detect the splice variants of the same genes.
Probe sets that detected potentially alternatively splice variants
were highly correlated with over 80% with correlation coefficients
over 0.5.
The HG-U133A microarray chip contains 22,283 probe sets,
from which a subset was selected for correlation analysis. We set
up three criteria in selecting the subset: 1) to exclude less reliable
data, the presence-call of a probe set through out 12 tumor
samples had to be all Present. 2) to ensure high variability that
permits the investigation of correlation, we selected genes which
the maximum intensity among 12 samples was at least two fold
higher than the minimum one. 3) a probe set had to have a gene
symbol such that the biological relevance can be checked further.
The rationale behind these criteria were: 1) Because correlation
was critical to the analysis, we sought to reduce the uncertainty in
the data as much as possible. In fact, when the level in one or more
samples was labeled ‘‘Absent’’, the overall levels in all samples
were usually relatively low. Because low levels were usually
accompanied with relatively high fluctuations, we tended to filter
such cases. 2) The absence of high variability for a miRNA across
samples implied that the observed variation was more likelyto be
noise, and the resulting correlation spurious. 3) a gene symbol was
needed for the target analysis and the output of highly correlated
miRNA-mRNA pairs. 12542, 2547, and 105 probe sets were
filtered away by criteria 1,2, and 3, respectively, and we were left
with 7,089 probe sets for correlation analysis, which correspond to
5,822 distinct genes.
miRNA data Multiplex RT-PCR data for miRNAs were
normalized and reliability determined. The accuracy of
measurement determinations with different amounts of miRNA
samples demonstrated that a cut-off of 32 for the 30 ng sample was
reliable [5]. Bias was clearly detected when comparing the levels of
each miRNA from two samples before normalization (Figure S3).
Without normalization, the fluctuation in overall concentration of
miRNAs resulted in a strong artifactual auto-correlation among
miRNAs themselves (Figure S4). Therefore, similar to the
normalization of microarray data, quantile normalization on the
multiplex RT-PCR results was performed. In brief, with N ( = 12
here) samples, each contains Ct values of m microRNAs, quantile
normalization projects the N kth-tile’s into the same value which is
the average of the N kth-tile’s (k = 1,m). After normalization, the
Ct distributions of the N samples overlap exactly by definition.
In order to increase the confidence, we selected a subset of
miRNAs in which all the Ct’s in 12 samples were reliable, i.e., less
than the cutoff 32, and obtained Ct’s for 94 miRNAs in each
sample. This subset was then used for quantile normalization.
After normalization, we further excluded one miRNA such that
the remaining miRNAs all had strong signals, i.e., the maximum
Ct among 12 samples was greater than the minimum by at least 1,
a definition similar to the criteria used for mRNA data processing.
The Ct’s of these 93 miRNAs were then used for correlation
analysis.
Correlation coefficient and the random caseBefore correlation analysis, we transformed the microarray
intensity data into log scale of base 2 such that they were
MiRNA/mRNA Correlated Pairs
PLoS ONE | www.plosone.org 9 August 2007 | Issue 8 | e804

comparable with the Ct data of miRNAs. In addition, we
converted a Ct value into 32-Ct such that the latter value was
positively proportional to the log of copy number.
The distribution of correlation coefficients of two normally
distributed random variables was utilized [25]. The derivation was
recapped as follows: Given two profiles xi and yi with i = 1,N,
where N is the number of data points (N = 12 in our case), the
Pearson’s correlation coefficient r is defined as
r~
PNi~1
(xi{�xx)(yi{�yy)ffiffiffiffiffiffiffiffiffiffiffiffiffiffiffiffiffiffiffiffiffiffiffiffiPNi~1
(xi{�xx)2
s ffiffiffiffiffiffiffiffiffiffiffiffiffiffiffiffiffiffiffiffiffiffiffiPNi~1
(yi{�yy)2
s ~XN
i~1
dxidyi
where dxi and dyi are the normalized profiles with mean equals
zero and norm equals one (Sdxi = 0 and Sdxi2 = 1). We can view
dxi and dyi as two vectors on a uni-sphere in high dimensional
space, then r is simply the inner product of these two vectors. For
example, in three dimensions, without loss of generality we set z-
axis as the direction of one vector, the inner product is simply the
angle between the two vectors, i.e., r = cosh. The probability
density of r can be derived through
p(r)dr~p(h)dh~
ðp(A) sin hdhdw~
1
2sin hdh,
where A is the surface area in three dimensional space. For
a random vector, the distribution on the surface should be uniform
such that p(A) = 1/A = 1/4p, a constant. In n-dimensions, the
probability density of h is known as p(h)sinh(n22). Thus,
p(r)! sin h(n{2) dh
dr~ sin h(n{3)~(1{r2)(n{3)=2:
Since the vector is constrained to have its mean as zero, given N
data points, the vectors stay in N-1 dimensions. Thus, n equals N-1
in the last equation; after normalization such that the probability
adds up to one, we obtained the probability distribution as
p(r; N)~C((N{1)=2)ffiffiffipp
C((N=2){1)(1{r2)(N{4)=2:
To confirm the probability distribution, we ran the following
simulations. We used our miRNA/mRNA data and randomly
generated a set of mRNA/miRNA data of the same size and
compared the resulting distribution of correlations with the
formula. All the 100 trials resulted in a distribution very close to
the random case. In addition, we randomly permuted the sample
order in the miRNA (or mRNA) profiles and repeated the analysis.
The clear signals shown in figures of this work disappeared in all
100 such trials (data not shown).
TargetScan predictionBulk data of the predicted mRNA targets of miRNAs in
TargetScan (Release 3.1 November 2006) was downloaded from
the website. We considered miRNAs in both conserved and non-
conserved families (conservation across human, mouse, rat, dog,
and sometimes chicken). The predicted targets only in human
were extracted. Two binding sites were considered distinct if their
seed region loci in the multiply aligned 39UTR sequences were
different. The 39UTR length for each gene was determined from
the 39UTR sequence from TargetScan. We removed the masked
bases and counted the remaining bases as the 39UTR length.
Estimation of slope in target percentageWe selected the correlation between 20.8 and 0.8 for slope
estimation to avoid the large fluctuations due to small amount of
miRNA-mRNA pairs outside the range. In Figure2, the slope of
points inside this range was obtained by fitting the curve to
a straight line.
miRNA host genes and their lociHost gene information was obtained from miRBase (Release 9.1
February 2007) [26]. Gene loci were obtained from Ensembl
(Release 43 February 2007) [23] through BioMart [24] using
dataset Homo sapiens NCBI36. Each gene loci is a range of base
pairs and the distance between two genes was defined as the head
to tail distance except when a miRNA is in the intron of an
mRNA.
SUPPORTING INFORMATION
Figure S1 Relationship between the correlation of two miRNAs
on the same chromosome strand and the distance separating the
two miRNA loci (small points). The distances for all pairs of
miRNAs were ranked, and the distance rank is used as the x-axis.
For each distance rank, the physical distance on the chromosome
strand in log-scale is shown (circles). To view the coarse-grained
relationship, five correlations for each distance rank are averaged.
For example, for distance rank 10, we averaged the five
correlations of distance ranks 8 to 12.
Found at: doi:10.1371/journal.pone.0000804.s001 (1.45 MB TIF)
Figure S2 Ratio of number of correlation coefficients between
our experiments and the random case with 12, 11, 10, 9, 8, and 7
samples.
Found at: doi:10.1371/journal.pone.0000804.s002 (1.45 MB TIF)
Figure S3 Scatter plots of the Ct values of two samples for all
miRNAs. Two pairs of two samples were shown as an illustration.
Found at: doi:10.1371/journal.pone.0000804.s003 (1.45 MB TIF)
Figure S4 Distribution of correlation coefficients among miR-
NAs before and after normalization.
Found at: doi:10.1371/journal.pone.0000804.s004 (1.45 MB TIF)
ACKNOWLEDGMENTSThanks to Nickolaus Rajewsky for his insightful suggestions and to the
unstinting help from members of the Kosik lab.
Author Contributions
Conceived and designed the experiments: KK. Performed the experiments:
TP SQ FS YL. Analyzed the data: BS FD TL KP WC LP. Contributed
reagents/materials/analysis tools: SN HK KL. Wrote the paper: KK TL
TP.
REFERENCES1. Nilsen TW (2007) Mechanisms of microRNA-mediated gene regulation in
animal cells. Trends Genet.
2. Lu J, Getz G, Miska EA, Alvarez-Saavedra E, Lamb J, et al. (2005) MicroRNA
expression profiles classify human cancers. Nature 435: 834–838.
MiRNA/mRNA Correlated Pairs
PLoS ONE | www.plosone.org 10 August 2007 | Issue 8 | e804
3. Nutt CL, Mani DR, Betensky RA, Tamayo P, Cairncross JG, et al. (2003) Gene
expression-based classification of malignant gliomas correlates better with
survival than histological classification. Cancer Res 63: 1602–1607.
4. Pomeroy SL, Tamayo P, Gaasenbeek M, Sturla LM, Angelo M, et al. (2002)
Prediction of central nervous system embryonal tumour outcome based on gene
expression. Nature 415: 436–442.
5. Lao K, Xu NL, Sun YA, Livak KJ, Straus NA (2007) Real time PCR profiling of
330 human mircoRNAs. Biotechnol J 2: 33–35.
6. Lewis BP, Burge CB, Bartel DP (2005) Conserved seed pairing, often flanked by
adenosines, indicates that thousands of human genes are mircoRNA targets. Cell
120: 15–16.
7. Massirer KB, Pasquinelli AE (2006) The evolving role of microRNAs in animal
gene expression. Bioessays 28: 449–452.
8. Baskerville S, Bartel DP (2005) Microarray profiling of microRNAs reveals
frequent coexpression with neighboring miRNAs and host genes. RNA 11:
241–247.
9. Imhof A, Yang XJ, Ogryzko VV, Nakatani Y, Wolffe AP, et al. (1997)
Acetylation of general transcription factors by histone acetyltransferases. Curr
Biol 7: 689–692.
10. Liu L, Scolnick DM, Trievel RC, Zhang HB, Marmorstein R, et al. (1999) p53
sites acetylated in vitro by PCAF and p300 are acetylated in vivo in response to
DNA damage. Mol Cell Biol 19: 1202–1209.
11. Nguyen DX, Baglia LA, Huang SM, Baker CM, McCance DJ (2004)
Acetylation regulates the differentiation-specific functions of the retinoblastoma
protein. EMBOJ 23: 1609–1618.
12. Wei CL, Wu Q, Vega VB, Chiu KP, Ng P, et al. (2004) A global map of p53
transcription-factor binding sites in the human genome. Cell 124: 207–219.
13. Watts GS, Oshiro MM, Junk DJ, Wozniak RJ, Watterson S, et al. (2004)
Theacetyltransferase p300/CBP-associated factor is a p53 target gene in breast
tumor cells. Neoplasia 6: 187–194.
14. Sood P, Krek A, Zavolan M, Macino G, Rajewsky N (2006) Cell-type-specific
signatures of microRNAs on target mRNA expression. Proc Natl Acad Sci USA
103: 2746–2751.
15. Lim LP, Lau NC, Garrett-Engele P, Grimson A, Schelter JM, et al. (2005)
Microarray analysis shows that some microRNAs downregulate large numbersof target mRNAs. Nature 433: 769–73.
16. Martianov I, Ramadass A, Serra Barros A, Chow N, Akoulitchev A (2007)
Regression of the human dihydrofolate reductase gene by a non-codinginterfering transcript. Nature 445: 666–670.
17. Linares LK, Kiernan R, Triboulet R, Chable-Bessia C, Latreille D, et al. (2007)Intrinsic ubiquitination activity of PCAF controls the stability of the oncoprotein
Hdm2. Nat Cell Biol 9: 331–338.
18. Ciafre SA, Galardi S, Mangiola A, Ferracin M, Liu CG, et al. (2005) Extensivemodulation of a set of microRNAs in primary glioblastoma. Biochem Biophys
Res Commun 334: 1351–1358.19. Cheng AM, Byrom MW, Shelton J, Ford LP (2005) Antisense inhibition of
human miRNAs and indications for an involvement of miRNA in cell growthand apoptosis. Nucleic Acids Res 33: 1290–1297.
20. Freije WA, Castro-Vargas FE, Fang Z, Horvath S, Cloughesy T, et al. (2004)
Gene expression profiling of gliomas strongly predicts survival. Cancer Res 64:6503–6510.
21. Mattie MD, Benz CC, Bowers J, Sensinger K, Wong L, et al. (2006) Optimizedhigh-throughput microRNA expression profiling provides novel biomarker
assessment of clinical prostate and breast cancer biopsies. Mol Cancer 5: 24.
22. Li C, Wong WH (2001) Model-based analysis of oligonucleotide arrays:Expression index computation and outlier detection. Proc Natl Acad SciUSA 98:
31–36.23. Hubbard TJ, Aken BL, Beal K, Ballester B, Caccamo M (2007) Ensembl 2007.
Nucleic Acids Res 35: D610–617.24. Durinck S, Moreau Y, Kasprzyk A, Daivis S, De Moor B, et al. (2005) Biomart
and bioconductor: a powerful link between biological databases and microarry
data analysis. Bioinformatics 21: 3439–3440.25. Fisher RA (1922) On the mathematical foundations of theoretical statistics. Phil
Trans Loyal Soc A222: 309–368.26. Griffiths-Jones S, Grocock RJ, van Dongen S, Bateman A, Enright AJ (2006)
miRBase: microRNA sequences, targets, and gene nomenclature. Nucleic Acids
Res 34: D140–D144.
MiRNA/mRNA Correlated Pairs
PLoS ONE | www.plosone.org 11 August 2007 | Issue 8 | e804
Copyright © 2022 FDOKUMEN