miR-BAG: Bagging Based Identification of MicroRNA Precursors
15
miR-BAG: Bagging Based Identification of MicroRNA Precursors Ashwani Jha . , Rohit Chauhan . , Mrigaya Mehra . , Heikham Russiachand Singh, Ravi Shankar* Studio of Computational Biology & Bioinformatics, Biotechnology Division, CSIR-Institute of Himalayan Bioresource Technology (CSIR-IHBT), Palampur, Himachal Pradesh, India Abstract Non-coding elements such as miRNAs play key regulatory roles in living systems. These ultra-short, ,21 bp long, RNA molecules are derived from their hairpin precursors and usually participate in negative gene regulation by binding the target mRNAs. Discovering miRNA candidate regions across the genome has been a challenging problem. Most of the existing tools work reliably only for limited datasets. Here, we have presented a novel reliable approach, miR-BAG, developed to identify miRNA candidate regions in genomes by scanning sequences as well as by using next generation sequencing (NGS) data. miR-BAG utilizes a bootstrap aggregation based machine learning approach, successfully creating an ensemble of complementary learners to attain high accuracy while balancing sensitivity and specificity. miR-BAG was developed for wide range of species and tested extensively for performance over a wide range of experimentally validated data. Consideration of position-specific variation of triplet structural profiles and mature miRNA anchored structural profiles had a positive impact on performance. miR-BAG’s performance was found consistent and the accuracy level was observed to be .90% for most of the species considered in the present study. In a detailed comparative analysis, miR-BAG performed better than six existing tools. Using miR-BAG NGS module, we identified a total of 22 novel miRNA candidate regions in cow genome in addition to a total of 42 cow specific miRNA regions. In practice, discovery of miRNA regions in a genome demands high-throughput data analysis, requiring large amount of processing. Considering this, miR-BAG has been developed in multi-threaded parallel architecture as a web server as well as a user friendly GUI standalone version. Citation: Jha A, Chauhan R, Mehra M, Singh HR, Shankar R (2012) miR-BAG: Bagging Based Identification of MicroRNA Precursors. PLoS ONE 7(9): e45782. doi:10.1371/journal.pone.0045782 Editor: Ramin Homayouni, University of Memphis, United States of America Received April 12, 2012; Accepted August 23, 2012; Published September 25, 2012 Copyright: ß 2012 Jha et al. This is an open-access article distributed under the terms of the Creative Commons Attribution License, which permits unrestricted use, distribution, and reproduction in any medium, provided the original author and source are credited. Funding: The study has been funded by CSIR-EMPOWER grant OLP-37 and Department of Biotechnology(DBT), Govt of India, grant# BTPR/11098/BID/07/261/ 2008. The funders had no role in study design, data collection and analysis, decision to publish, or preparation of the manuscript. Competing Interests: The authors have declared that no competing interests exist. * E-mail: [email protected] . These authors contributed equally to this work. Introduction miRNAs are now expected to regulate approximately 80% of genes [1]. They are mainly involved in post transcriptional regulation through transcript disruption and translational block- ade. miRNAs can be found in the intergenic, intronic as well as exonic regions [2,3]. In animal systems, once transcribed from the genome either by RNA Polymerase II [4] or by RNA Polymerase III [5], the transcripts (primary miRNAs) are recognized by the Drosha-DGCR8 microprocessor complex. This complex cleaves pri-miRNAs into pre-miRNAs. Thereafter, Exportin transports these pre-miRNAs to the cytoplasmic space, utilizing Ran-GTP transport pathway [6]. In cytoplasm, another RNAse III, Dicer, cleaves the pre-miRNA into mature miRNA duplex [7]. The initial approaches for miRNA precursor discovery relied mainly on detection of the hairpin-shaped structure, which is common to all pre-miRNAs. However, groups like Bentwich et al suggested that there are approximately 11 million hairpins in human genome, making it a daunting task to correctly identify miRNA precursor candidates [8]. Some novel features and rules thus became imperative for better identification of miRNAs. Initially, one approach was designed for C. elegans [9], on the basis of the degree of conservation of miRNAs across various species. Similar approach was adopted by miRSeeker [10] designed for Drosophila. While searching for homology, miRSeeker also considered sequence conservation along with criteria like base pairing and presence of miRNAs in at least one of the arms of the hairpin sequences. Although these tools were important mile- stones, issues with their accuracy and consistency persisted widely, leading to development of better approaches. Later, Bentwich et al developed PalGrade [8], which assigned a stability score to every hairpin, depending upon its secondary structure. It also imple- mented a scoring scheme based on various features like hairpin length, loop length, sequence repetitiveness, bulge length and type of inverted repeat. Berezikov’s group analyzed genomic regions with conserved profiles, employing Phylogenetic Shadowing, and selected the sequences having ability to form hairpins [11]. Sætrom et al identified some miRNA specific properties like structural conservation in miRNA primary transcripts, which might ead to development of better performing precursor identification tools [12]. Most of the initial approaches for miRNA candidate identifi- cation relied upon the filter based protocols. These included various combinations of rules derived for stem size, loop size, number and size of bulges, GC content, etc. However, such approaches may not be appropriate, particularly when the instances exhibit deviation from the conservation rule. It has been PLOS ONE | www.plosone.org 1 September 2012 | Volume 7 | Issue 9 | e45782
Transcript of miR-BAG: Bagging Based Identification of MicroRNA Precursors
miR-BAG: Bagging Based Identification of MicroRNAPrecursorsAshwani Jha., Rohit Chauhan., Mrigaya Mehra., Heikham Russiachand Singh, Ravi Shankar*
Studio of Computational Biology & Bioinformatics, Biotechnology Division, CSIR-Institute of Himalayan Bioresource Technology (CSIR-IHBT), Palampur, Himachal Pradesh,
India
Abstract
Non-coding elements such as miRNAs play key regulatory roles in living systems. These ultra-short, ,21 bp long, RNAmolecules are derived from their hairpin precursors and usually participate in negative gene regulation by binding thetarget mRNAs. Discovering miRNA candidate regions across the genome has been a challenging problem. Most of theexisting tools work reliably only for limited datasets. Here, we have presented a novel reliable approach, miR-BAG,developed to identify miRNA candidate regions in genomes by scanning sequences as well as by using next generationsequencing (NGS) data. miR-BAG utilizes a bootstrap aggregation based machine learning approach, successfully creatingan ensemble of complementary learners to attain high accuracy while balancing sensitivity and specificity. miR-BAG wasdeveloped for wide range of species and tested extensively for performance over a wide range of experimentally validateddata. Consideration of position-specific variation of triplet structural profiles and mature miRNA anchored structural profileshad a positive impact on performance. miR-BAG’s performance was found consistent and the accuracy level was observedto be .90% for most of the species considered in the present study. In a detailed comparative analysis, miR-BAG performedbetter than six existing tools. Using miR-BAG NGS module, we identified a total of 22 novel miRNA candidate regions in cowgenome in addition to a total of 42 cow specific miRNA regions. In practice, discovery of miRNA regions in a genomedemands high-throughput data analysis, requiring large amount of processing. Considering this, miR-BAG has beendeveloped in multi-threaded parallel architecture as a web server as well as a user friendly GUI standalone version.
Citation: Jha A, Chauhan R, Mehra M, Singh HR, Shankar R (2012) miR-BAG: Bagging Based Identification of MicroRNA Precursors. PLoS ONE 7(9): e45782.doi:10.1371/journal.pone.0045782
Editor: Ramin Homayouni, University of Memphis, United States of America
Received April 12, 2012; Accepted August 23, 2012; Published September 25, 2012
Copyright: � 2012 Jha et al. This is an open-access article distributed under the terms of the Creative Commons Attribution License, which permits unrestricteduse, distribution, and reproduction in any medium, provided the original author and source are credited.
Funding: The study has been funded by CSIR-EMPOWER grant OLP-37 and Department of Biotechnology(DBT), Govt of India, grant# BTPR/11098/BID/07/261/2008. The funders had no role in study design, data collection and analysis, decision to publish, or preparation of the manuscript.
Competing Interests: The authors have declared that no competing interests exist.
* E-mail: [email protected]
. These authors contributed equally to this work.
Introduction
miRNAs are now expected to regulate approximately 80% of
genes [1]. They are mainly involved in post transcriptional
regulation through transcript disruption and translational block-
ade. miRNAs can be found in the intergenic, intronic as well as
exonic regions [2,3]. In animal systems, once transcribed from the
genome either by RNA Polymerase II [4] or by RNA Polymerase
III [5], the transcripts (primary miRNAs) are recognized by the
Drosha-DGCR8 microprocessor complex. This complex cleaves
pri-miRNAs into pre-miRNAs. Thereafter, Exportin transports
these pre-miRNAs to the cytoplasmic space, utilizing Ran-GTP
transport pathway [6]. In cytoplasm, another RNAse III, Dicer,
cleaves the pre-miRNA into mature miRNA duplex [7].
The initial approaches for miRNA precursor discovery relied
mainly on detection of the hairpin-shaped structure, which is
common to all pre-miRNAs. However, groups like Bentwich et al
suggested that there are approximately 11 million hairpins in
human genome, making it a daunting task to correctly identify
miRNA precursor candidates [8]. Some novel features and rules
thus became imperative for better identification of miRNAs.
Initially, one approach was designed for C. elegans [9], on the basis
of the degree of conservation of miRNAs across various species.
Similar approach was adopted by miRSeeker [10] designed for
Drosophila. While searching for homology, miRSeeker also
considered sequence conservation along with criteria like base
pairing and presence of miRNAs in at least one of the arms of the
hairpin sequences. Although these tools were important mile-
stones, issues with their accuracy and consistency persisted widely,
leading to development of better approaches. Later, Bentwich et al
developed PalGrade [8], which assigned a stability score to every
hairpin, depending upon its secondary structure. It also imple-
mented a scoring scheme based on various features like hairpin
length, loop length, sequence repetitiveness, bulge length and type
of inverted repeat. Berezikov’s group analyzed genomic regions
with conserved profiles, employing Phylogenetic Shadowing, and
selected the sequences having ability to form hairpins [11].
Sætrom et al identified some miRNA specific properties like
structural conservation in miRNA primary transcripts, which
might ead to development of better performing precursor
identification tools [12].
Most of the initial approaches for miRNA candidate identifi-
cation relied upon the filter based protocols. These included
various combinations of rules derived for stem size, loop size,
number and size of bulges, GC content, etc. However, such
approaches may not be appropriate, particularly when the
instances exhibit deviation from the conservation rule. It has been
PLOS ONE | www.plosone.org 1 September 2012 | Volume 7 | Issue 9 | e45782
observed that the multi-variate statistical approaches deliver better
than the rule based methods. One such pioneering approach had
been Triplet-SVM [13]. There, the authors opined for the need to
consider the fact that besides miRNAs, the hairpin structure also
exists with several other genomic elements. Therefore, the authors
considered psuedo-hairpins for a better model while preparing the
negative dataset. The same group also identified a property named
triplet element, which captured structural as well as sequence
information through support vector models. It resulted into a
remarkable increase in accuracy and performance consistency.
Subsequently, there was surge in use of different machine learning
approaches including Random Forests [14], Bayesian methods
[15] and many other SVM based tools, where inclusion of triplet
or its variants gained importance. Agarwal et al [16] developed a
method to discover miRNA precursors while applying context
sensitive HMM to model RNA secondary structures. The authors
used memory supported probabilist models to construct paired
regions as well as symmetrical bulges in miRNAs. Ritchie et al
developed MirEval [17], which combined windowed structural
scanning using Triplet-SVM’s methodology [13] and a protocol to
evaluate structural properties. It also implemented phyolgenetic
conservation through GERP method [18] and a sequence
homology search method introduced by Tanzen and Standler
[19]. Using Drosha processing site information along with regular
sequence and structural features implemented through SVM,
successful identification of miRNA precursors was demonstrated
by Helvik et al [20]. A recently developed tool MiRPara [21] took
a more realistic approach while considering datasets. The authors
proposed that the structures and sequences reported in miRBase
[22] might have incomplete information for miRNAs, as in actual
the precursors could have longer sequences. Therefore, actual
precursors might have different structural and compositional
features. The authors identified a few region specific sequence and
structural features for partial pri-miRNA sequences, which
performed well for large number of species.
As mentioned above, the initial approaches for miRNA
discovery had largely relied upon conservation of sequences across
various species, homology, hairpin detection and free energy
calculation. This resulted into localization of miRNA model
building and detection of similar kind of miRNA candidates.
Therefore, even with newer approaches, influence of homology
would suppress the identification of novel candidates and other
unseen properties of miRNAs. Thus, expansion of datasets also
became limited. Recent advances with Next Generation Sequenc-
ing (NGS) driven technologies helped in guiding the process of
miRNA discovery by providing a confidence measure through
read mapping to the reference sequences. This also encouraged
the genome wide scanning for miRNA candidates with better
speed and confidence, reporting novel miRNA candidate regions
which were otherwise missed by earlier techniques and tools [23].
Due to such developments, an approximate exponential increase
in number of novel miRNA families is notable in the recent
releases of miRBase (figure 1a–b). Leveraging from break-
throughs made by NGS, recently, some groups have developed
tools for detection of miRNA candidates using NGS read data.
miRDeep [24] has been one such tools for analyzing data from
Illumina Genome Analyzer sequencing platform and for identi-
fying miRNA candidates while considering reads distribution
across a reference. The mapped regions are considered to measure
the RNA secondary structure based information. Following
miRDeep, a few more such tools like miRNAkey [25],
miRanalyser [26] and MIReNA [27] have come up.
The present work reports a novel approach to identify miRNA
candidates with high accuracy and stable performance over wide
range of species. Biologically relevant novel features like miRNA
specific mature miRNA guided structural profile matrices and
structural triplet density variation profiles with respect to position
have been introduced to derive a superior and stable performance.
An ensemble machine learning methodology, Bootstrap Aggre-
gating (BAGging), has been implemented. It employs comple-
mentary classifiers like Support Vector Machine (SVM), Naive
Bayes (NB) and Best First Decision Trees (BFTree) to build the
final classifier models for large number of species, enhancing the
performance strongly. An NGS module has been built to find
miRNA precursor candidates, using Illumina read data. The
process of miRNA candidate detection requires large volume of
sequence data scanning, which makes it dependent upon extensive
computing. Considering this, the entire approach has been
implemented as a web-server as well as user friendly standalone
GUI version, both in parallel architecture.
Methods
DatasetsSix different species viz., Human, Mouse, Rat, Dog, Nematode
and Fruit fly were used in this study. For the above six species,
positive and negative datasets were created. The positive sets
included known miRNA containing sequences from the species
while the negative sets included pseudohairpin sequences gener-
ated from mRNAs, rRNAs, snoRNAs, snRNAs, tRNAs, and
SINE elements.
Genomic sequences were downloaded from UCSC [28] and
Ensembl [29]. The precursors, mature miRNAs and their co-
ordinates were downloaded from miRBase version 18 [22]. The
sequences for mRNA, rRNA, snoRNA, snRNA, SINEs and
tRNA, along with their co-ordinates were downloaded from
UCSC [28] and Ensembl [29]. SINE sequences were collected
after running RepeatMasker/Repbase [30].
Dataset GenerationPositive dataset generation. The central base of the
terminal loop was treated as the reference point. Mature miRNAs
were mapped into the pre-miRNAs and the genomic location of
various structural components were recorded. Considering the
central base of the terminal loop as the midpoint, genomic
sequences up to 200 bp were extracted from the flanking regions.
This placed the reference point appropriately at constant position,
providing uniformity across all possible dataset instances, irre-
spective of variation in length, loop size and relative positioning of
mature miRNA regions.
Negative dataset creation. In the negative dataset sequenc-
es, the terminal loops were identified. The middle base of the
terminal loop was considered as the reference central position for
every negative instance, as in case of the precursors for reference
position identification. The negative dataset consisted of different
types of RNA sequences including ribosomal RNA, small
nucleolar RNA, small nuclear RNA, transfer RNA, SINE
sequences and mRNA sequences, all taking pseudohairpin shapes.
For all instances, the genomic co-ordinate of central reference
position was considered for taking 200 bp sequence with equal
flanks. For the dataset of human pseudohairpins, 8,494 pseudo-
hairpins (used by Triplet-SVM) were downloaded and searched
across the genomic sequences [13]. RNAfold [31] was run against
the mRNA transcriptome data from all target species considered
here, to derive the pseudo-hairpin datasets. The sequences used to
create the training and testing datasets for all target species are
mentioned in Supporting Material S1.
Pre-miRNA Identification with miR-BAG
PLOS ONE | www.plosone.org 2 September 2012 | Volume 7 | Issue 9 | e45782
Features Generation and ExtractionThe feature data vectors were generated for 200 nucleotides
long primary windows, having three different sub-window types,
of which two were sliding windows. The features were classified
into two broad categories, based on the manner they were
estimated. Class I properties were estimated with overlapping
sliding windows run over full length of the sequences. Class II
properties were estimated for complete length sequences,
without the sliding window. A comparative study was performed
by changing the window size from 17 nucleotides to 45
nucleotides for deciding the most appropriate window size
regarding Class I properties. The best discrimination was
observed for window size of 21 nucleotides. Thus, window size
of 21 nucleotides with one nucleotide overlap for each sliding
window was employed. The major properties considered using
the sliding windows were: total normalized hydrogen bondings
per window, mononucleotide densities, dinucloetide densities
and structural triplet element densities for all 20 combinations
of the three structural characters: ‘‘ (‘‘, ’’)’’ and ‘‘.’’. Every such
window provided a relative position in a sequence and
associated values for the features mentioned above, giving
positional feature values with respect to the reference position.
The overall work-flow is mentioned in Figure 2.
Class II features were calculated for full length of the sequences
instead of the sliding windows. This class includes structural profile
based scoring feature and maximum number of consecutive paired
bases (CPB) observed in a given structure-sequence. CPB
represented the longest pairing stretch observed in a given
structural sequence. miRNA specific structural profile matrix
based scoring emerged as one of the most critical features observed
in the present study. It derives motivation from the fact that
miRNA precursors are structurally highly conserved for mature
miRNA regions, which are supposed to host a few binding sites for
various processing factors in miRNA genesis and localization. For
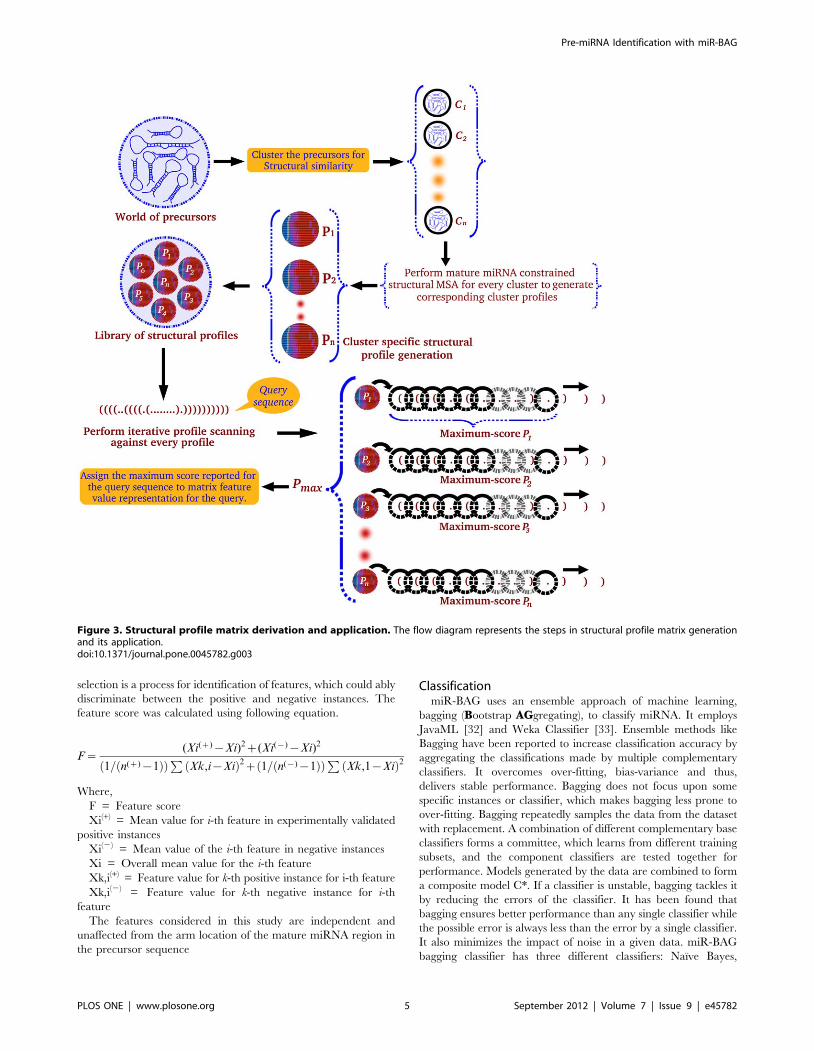
every target species, a library of position specific structural
matrices was created utilizing the pre-miRNA sequences men-
tioned in miRBase version 18. The secondary structures of pre-
miRNAs were derived using RNAfold [31]. This was followed by
mature miRNA region constrained alignment to evaluate the
structural similarity across various miRNA families and develop
structural similarity based clusters of miRNAs (figure 3).
For developing the structural profiles, information about
coordinates of mature miRNA regions was necessary. This
information was derived by mapping mature miRNAs into their
precursors, which in turn were also mapped into the correspond-
ing secondary structures. RNAfold [31] draws secondary structure
of RNA and gives output in dot-bracket form (‘‘(‘‘,’’.‘‘,’’)’’). To
distinguish mature miRNA regions from rest of the regions,
RNAfold [31] notations were transformed using the following:
(‘‘(‘‘2.’’M’’, ‘‘.’’2.’’O’’, ‘‘N’’ 2.’’ )’’. For the flanking regions
around the mature miRNA region, the transformation was done
as: ‘‘(‘‘2.’’L’’, ‘‘.’’2.’’D’’ and ‘‘)’’2.R.
The in-house developed scripts aligned the modified struc-
tural notations/encodings by aligning first for the mature
miRNA regions (containing M,O,N), followed by bidirectional
alignment for rest of the structural regions (L,D,R). By doing so,
the mature miRNA region constraints and guides a suitable
alignment, restoring structural information with respect to the
mature miRNA region. Such structural information could
otherwise be lost while aligning various precursor sequences
end to end (Figure 3). In this manner, structural proximities
between various precursor molecules were measured and
clusters of proximal precursors anchored at mature miRNA
regions were formed. For every miRNA, structural alignment
was done against the rest of miRNAs with 80% identity cut-off.
All closely similar miRNA structures formed miRNA specific
clusters, which were multiple-aligned using an in-house devel-
oped constrained progressive multiple structural alignment tool.
This generated a library of precursor miRNA structural profiles,
where every profile contained information about probability of
occurrence of a secondary structure state for every position in a
more accurate manner. The length of such profile is the
distance between the coordinates of the smallest node at the left
side and that at the right side of the mature miRNA region.
This ensures consideration of most informative and fully
aligning regions only. Every putative miRNA candidate is
scanned through this library of structural profiles to identify the
highest scoring regions. The highest score observed for sequence
becomes the representative score for the corresponding full
sequence. The same score is also taken as a feature component
for machine learning step (figure 3). For every profile, the
structural sequence is first scanned through a series of
overlapping sliding windows. The size of such windows is fixed
dynamically by the length of the profile, as described above.
Using the above mentioned procedure, a total of 1,411 miRNA
specific structural profiles were generated for human miRNAs.
Similarly, a total of 727, 320, 393, 222 and 207 structural
profiles were generated for mouse, dog, rat, C. elegans and
Drosophila miRNAs, respectively.
Finally, for every input sequence considered with 200 bp length,
there were 80 left sliding windows, 80 right sliding windows and
one fixed window. Each window had 40 features, 180 position
specific structure weighted bond information features and two
window independent features (CPB and Profile score), leading to a
total of 6,622 features, representing every 200 bp sequence.
Feature selection was performed to identify the most important
features contributing to the discrimination process. Feature
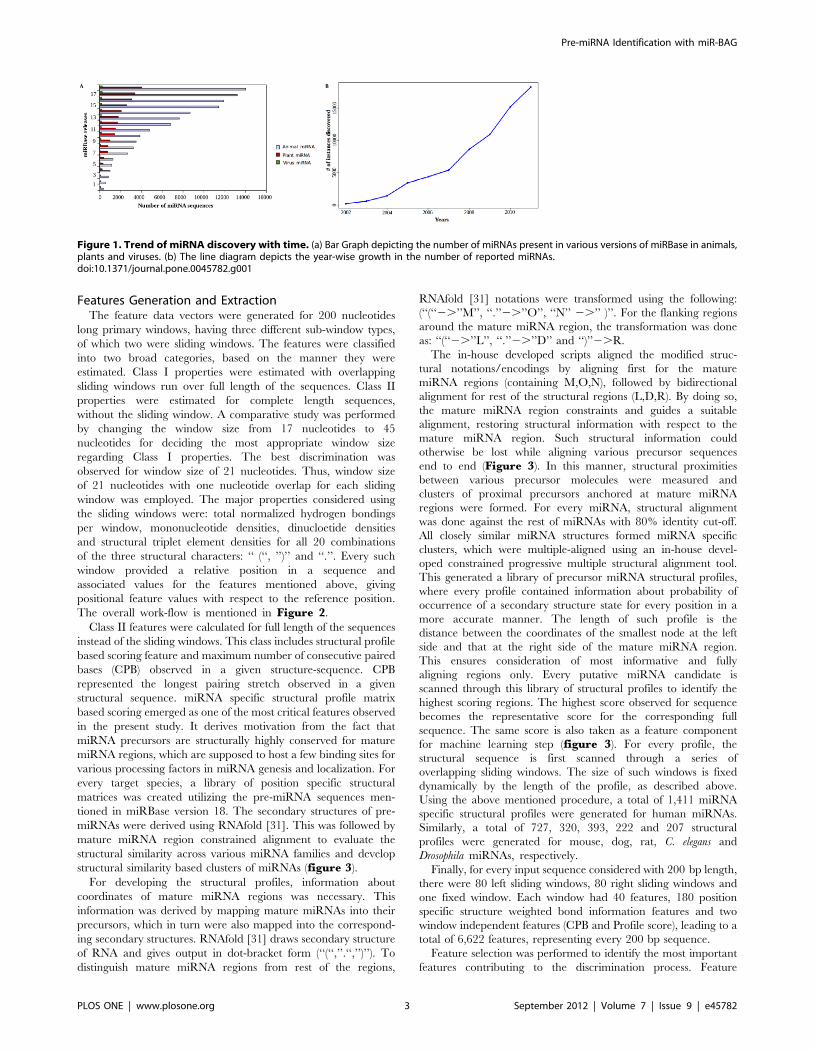
Figure 1. Trend of miRNA discovery with time. (a) Bar Graph depicting the number of miRNAs present in various versions of miRBase in animals,plants and viruses. (b) The line diagram depicts the year-wise growth in the number of reported miRNAs.doi:10.1371/journal.pone.0045782.g001
Pre-miRNA Identification with miR-BAG
PLOS ONE | www.plosone.org 3 September 2012 | Volume 7 | Issue 9 | e45782
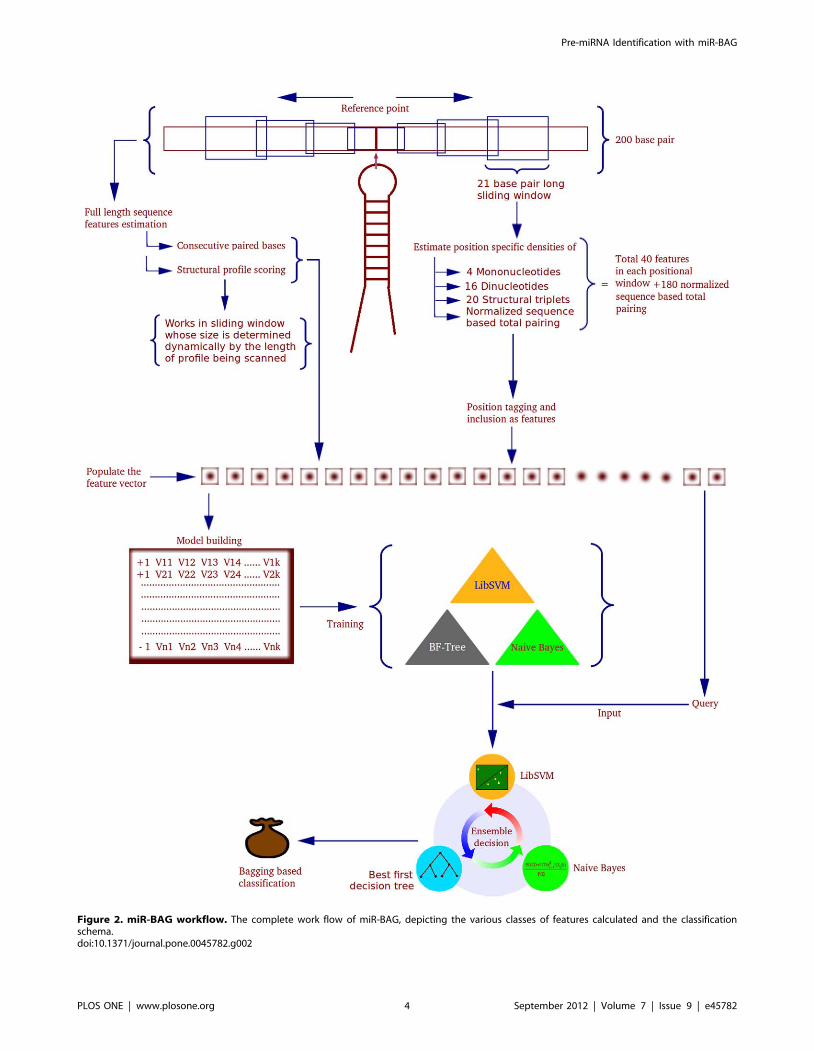
Figure 2. miR-BAG workflow. The complete work flow of miR-BAG, depicting the various classes of features calculated and the classificationschema.doi:10.1371/journal.pone.0045782.g002
Pre-miRNA Identification with miR-BAG
PLOS ONE | www.plosone.org 4 September 2012 | Volume 7 | Issue 9 | e45782
selection is a process for identification of features, which could ably
discriminate between the positive and negative instances. The
feature score was calculated using following equation.
F~(Xi(z){Xi)2z(Xi({){Xi)2
1= n(z){1ð Þð ÞP
Xk,i{Xið Þ2z 1= n({){1ð Þð ÞP
Xk,1{Xið Þ2
Where,
F = Feature score
Xi(+) = Mean value for i-th feature in experimentally validated
positive instances
Xi(2) = Mean value of the i-th feature in negative instances
Xi = Overall mean value for the i-th feature
Xk,i(+) = Feature value for k-th positive instance for i-th feature
Xk,i(2) = Feature value for k-th negative instance for i-th
feature
The features considered in this study are independent and
unaffected from the arm location of the mature miRNA region in
the precursor sequence
ClassificationmiR-BAG uses an ensemble approach of machine learning,
bagging (Bootstrap AGgregating), to classify miRNA. It employs
JavaML [32] and Weka Classifier [33]. Ensemble methods like
Bagging have been reported to increase classification accuracy by
aggregating the classifications made by multiple complementary
classifiers. It overcomes over-fitting, bias-variance and thus,
delivers stable performance. Bagging does not focus upon some
specific instances or classifier, which makes bagging less prone to
over-fitting. Bagging repeatedly samples the data from the dataset
with replacement. A combination of different complementary base
classifiers forms a committee, which learns from different training
subsets, and the component classifiers are tested together for
performance. Models generated by the data are combined to form
a composite model C*. If a classifier is unstable, bagging tackles it
by reducing the errors of the classifier. It has been found that
bagging ensures better performance than any single classifier while
the possible error is always less than the error by a single classifier.
It also minimizes the impact of noise in a given data. miR-BAG
bagging classifier has three different classifiers: Naıve Bayes,
Figure 3. Structural profile matrix derivation and application. The flow diagram represents the steps in structural profile matrix generationand its application.doi:10.1371/journal.pone.0045782.g003
Pre-miRNA Identification with miR-BAG
PLOS ONE | www.plosone.org 5 September 2012 | Volume 7 | Issue 9 | e45782
Support Vector Machine (SVM) and Best First decision tree
(BFTree).
Naıve Bayes removes the noisy features of data while estimating
conditional probability. A Naıve Bayes classifier estimates the class
probability by assuming conditional independence between the
features, using the following equation:
P(Y DX )~P(Y )Pd
i~1 P(XiDY )
P(X )
Where:
P(X) = Prior probability of observing the feature vector X.
P(Y|X) = Posterior probability of the given hypothesis Y
(identified class).
P(Xi|Y) = Posterior conditional probability of observing ith
feature’s value Xi, given prior of hypothesis.
Best First decision tree (BF Tree) expands the best nodes first
while creating the tree. The best node is the node whose split
reduces impurity. The above mentioned two methods reduce over-
fitting and do not need any huge learning set to classify. Also, such
classification utilizes each attribute to find a local optimal solution.
The third classifier implemented in the present study is Support
Vector Machine (SVM). SVM forms a decision boundary with
maximum error margin hyperplanes to classify instances, provid-
ing global solutions. The SVM kernel implemented in the present
work is a Gaussian kernel, having the following equation:
k X , Yð Þ~ exp {c X{Yk k2� �
Where, k = Kernel of functions X and Y.
Inconsistency with variable datasets has been an issue with
kernels of SVM. A kernel may classify some datasets accurately
while on some other datasets its accuracy may decrease. With the
bagging approach implemented in the present study, each
classifier makes up for others’ demerit in a complementary
fashion, bringing stability and consistency along with high
accuracy.
The basic bagging algorithm:
Input:
D, a set of training samples.
Let K be the number of bootstrap samples.
C, a vector of learning schemes (Naive Bayes, BFTree and
SVM).
Pseudo code:
1 for I = 1 to k do
2 Create a bootstrap sample of size N, Di
3 for j = 1 to C do
4 Train a base classifier Cj on the bootstrap sample Di
5 end for
6 end for
7 C*(x) = argmax Si d(Ci(x) = y).
Performance MeasurementDifferent performance-measure tests were conducted: 1) Tests
with datasets for six different species pre-miRNAs (miRBase
version 18) [22]. Above mentioned sources were used to develop
the resources for positive and negative instances. 2) Performance
comparison with recently published tools: microPred [34], Triplet-
SVM [13], CSHMM [16], miRNA SVM [20], MiRPara [21] and
MirEval [17] 3) Ten fold cross validation based Receiver
Operating Characteristic Curve (ROC) tests for performance over
large datasets. The values for accuracy(Ac), sensitivity(Sn),
specificity(Sp) and MCC were calculated using the following
equations:
Sn = TP/(TP+FN)
Sp = TN/(TN+FP)
Acc = (TN+TP)/(TN+FP+TP+FN)
MCC = {(TP*TN)2(FP*FN)}/
!(TP+FN)*(TP+FP)*(TN+FP)*(TN+FN)
Where:
TP = True Positives
TN = True Negatives
FP = False Positives
FN = False Negatives
Sn = Sensitivity
Sp = Specificity
Acc = Accuracy
MCC = Matthew’s Correlation Coefficient
The Receiver Operating Characteristic Curves (ROCs) with
corresponding Area Under the Curve (AUC) were plotted for all
models using 10 folds cross validation. Open source ‘‘R’’-statistical
package and ROCR were used to build the ROC plots.
For all training and testing datasets considered in the present
study, thorough care was taken to avoid any bias created due to
redundancy and common occurrences of instances. All identical
entries common to the test and training sets were removed.
Therefore, the testing datasets are mostly with instances which
were never used during the training step. Also, they were never
seen before instances for the classifiers. All these precautions
minimized any possibility of bias.
Implementation of ParallelismIn miR-BAG, divide and conquer approach has been imple-
mented to achieve parallelism. Parallelism has been implemented
by applying Java Concurrent Library (JCL). Parallelism has been
implemented at three major levels: 1) Sequence 2) Windows and 3)
Matrices. Details about implementation of concurrency is given in
Supporting Material S2. In general, the program has inbuilt
capacity to decide the total number of threads to be utilized in a
processor, which could be useful in case of processor overload
variation.
Next Generation Sequencing Data AnalysisThe FASTQ files for Bos taurus transcriptome was downloaded
form NCBI database GEO [35]. In this experiment, the authors
had reported Illumina reads for 95 different tissues and conditions
[GSE21544] [36]. The length of the reads in the FASTQ files was
16 bases. Sequences of miRNA hairpins were downloaded from
miRBase version 18 [22], non coding RNA sequences were
downloaded from Rfam [37] version 10.0, and the mRNA
sequences were downloaded from UCSC [28]. Genomic index for
Bos taurus was downloaded from Bowtie database [38]. The
downloaded FASTA sequences were converted to Bowtie indexes,
using Bowtie-Build. In total, 290,240,521 reads were generated in
the experiment. These reads were extracted from the FASTQ files
and count of each unique read was recorded. After considering the
unique reads only, the number of total reads decreased to
7,434,705. This step was performed to reduce the computation
time, memory requirement and processor load. Thereafter, these
reads were mapped across the miRNA precursor sequences, non-
coding RNA sequences and mRNA sequences to filter out the
already annotated reads using Bowtie with 10 hits threshold. The
remaining reads which did not map to any of the annotated
regions were considered for novel miRNAs identification.
Pre-miRNA Identification with miR-BAG
PLOS ONE | www.plosone.org 6 September 2012 | Volume 7 | Issue 9 | e45782
Detection of known miRNA. The known pre-miRNA
sequences specific to Bos taurus were downloaded from miRBase
[22] and were mapped back to the genome to find their
coordinates. The coordinates were used to extract the sequences
with a total of 250 bases, which included the flanking regions.
miR-BAG was run with a human specific classifier model.
Identification of novel miRNA candidates. The final reads
which did not map to any of the already annotated RNA
categories were mapped to Bos taurus genome. The mapped
coordinates were extracted from the Bowtie result file. Using these
coordinates, sequences of 250 bases were extracted in FASTA
format from the genome file, which was downloaded from UCSC
while considering the read mapping region as the center. All these
sequences were searched for possible novel miRNA candidate
regions, using miR-BAG. MiRNA abundance was measured by
applying Read per million read count normalization (RPKM).
Server and Standalone ImplementationThe entire server was implemented in Apache-Linux platform
using PHP. Majority of the codes were developed in C++, JAVA
and PERL. Statistical processing and calculations were imple-
mented through methods developed in ‘‘R’’ open source statistical
package. The standalone GUI version was developed in QT C++.
The entire work was carried out in Open Source OS environment
of Ubuntu and Fedora Linux platforms.
Results and Discussion
miR-BAG has been developed to identify miRNA precursors in
genomic sequences with high efficiency, accuracy and perfor-
mance stability. miR-BAG algorithm has applied some novel
sequence-structure based features and an efficient machine
learning protocol. As mentioned earlier, many of the previously
developed tools worked with conventional properties like mini-
mum free energy (MFE), phylogenetic conservation and hair-pin
loop detection. In miPred [39], the authors introduced an
approach independent of conservation, which was dependent
upon the Minimum Free Indexes proposed by Zhang et al [40],
using single sequence ab initio folding. As per the observations
made by Gardener and Giegerich [41], MFE might not be
discriminating enough, as the reliability of such methods decreases
with increase in the length of sequences. In case of miRNAs, this
becomes a matter of concern, as finding the TSS and exact
precursors is still a major challenge. Considering the limitations of
single sequence based ab initio folding, such uncertainty may have
impact over the accuracy of secondary structure determination
process. To analyze the contribution of minimum free energy in
distinguishing miRNAs from non-miRNA sequences, energy
distribution plots were drawn using RNAfold [31] (Supporting
Material S3). As could be observed from the plots, there has been
a large overlap between the MFE values for miRNA candidates
and non miRNA sequences, suggesting insufficiency of MFE as an
efficient discriminating property. Thus, single sequence structure
derived conventional properties may have some limitations as a
good discriminator.
Consistent Accuracy while Identifying miRNAs for WideRange of Species
Large volumes of different datasets were created for each species
considered in the present study. The process of dataset generation
is also dependent upon the availability of sequences for a given
species. The positive and negative sets were made by randomly
selection of sequences from the parent sets. For positive sets, this
consisted of known miRNA containing sequences, while the
negative sets consisted of various classes of RNA sequences.
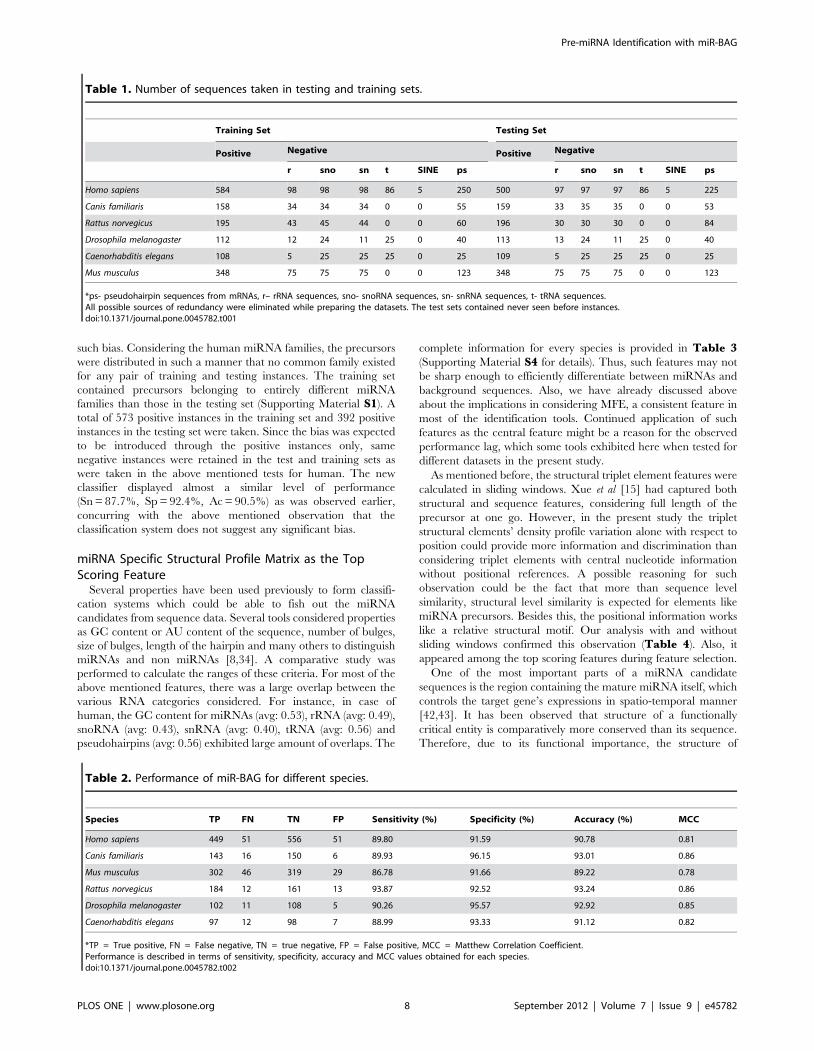
Related information is summarized in Table 1 and elaborated in
the implementation section. While creating training and testing
datasets, a balance was maintained between the positive and
negative sets to prevent any issue arising due to class imbalance. In
negative sets, proportionate representation of negative instances
from various categories was maintained to ensure a balanced
representation. All possible redundancy in the datasets was
curtailed.
The developed species models included Homo sapiens, Rattus
norvegicus, Mus musculus, Canis familiaris, Caenorhabditis elegans and
Drosophila melanogaster. When tested over the experimentally
validated instances in the test set, the developed model for human
yielded an accuracy of ,91%. The classifier was able to identify a
total of 556 true negatives out of a total of 607 negative instances,
approaching a specificity value of 91.59%. The observed
sensitivity was at 89.8%, with a total of 449 true positives correctly
identified while 51 instances were identified wrongly as false
negative instances. Almost similar level of performance was noted
for other species (associated details are available in Table 1 and
Table 2), exhibiting high sensitivity and specificity values with
much smaller gaps.
On an average, about 92% overall accuracy was observed for all
species considered in the current study, suggesting high accuracy
of the classifiers with an average sensitivity of ,90% and an
average specificity of ,93%. Complete performance break up in
species specific manner has been summarized in Table 2. Besides
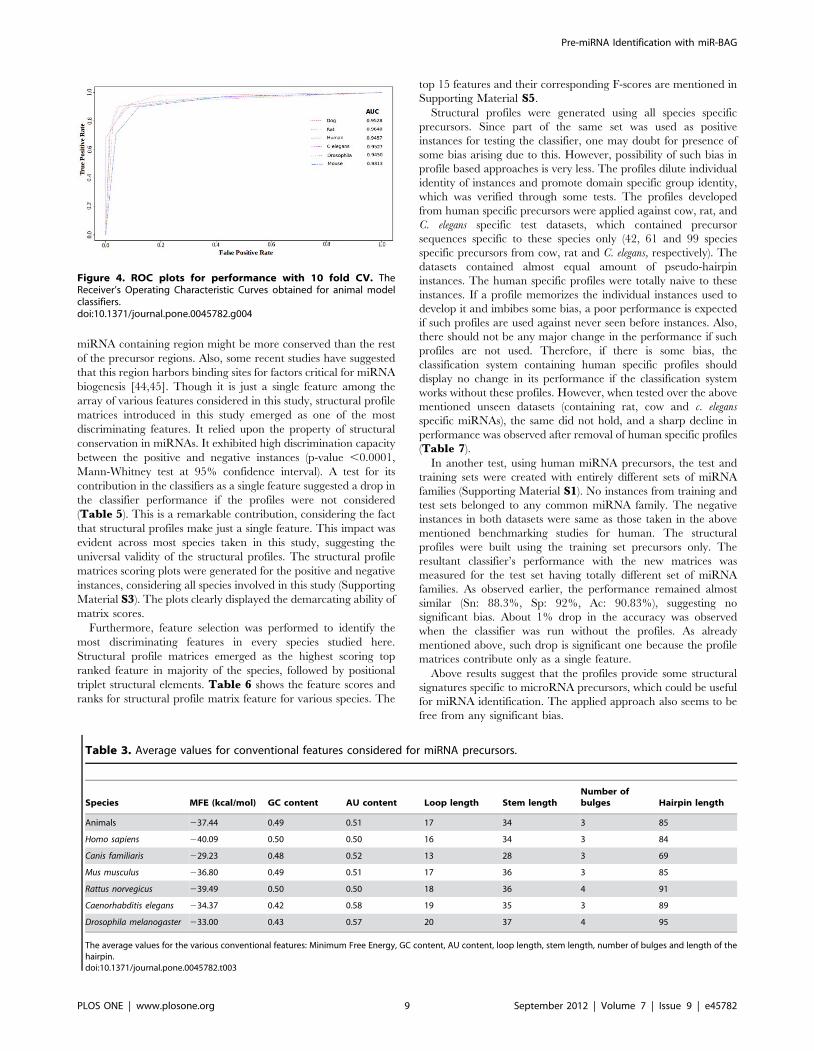
this, 10 folds cross validation based performance tests yielded good
quality ROC curves for all target species with high AUC values
(average AUC value = 0.94) (Figure 4). Similarly, the MCC
values for the classifiers also exhibited higher scores for most of the
species. The highest MCC was observed for dog and rat with a
value of 0.86 (Table 2). MCC and AUC are considered as an
appropriate indicator for performance, robustness and reliability
for a given classification system. These values emerged consider-
ably good for the species models developed in the present study.
The redundancy was curtailed from every dataset considered in
the present study and cases common to training and testing
datasets for the target species were not removed. Though the
subfamilies of a common miRNA family could be present in the
training and testing datasets, such condition did not create bias in
the classification system. At mature miRNA level, a substantial
similarity exists between the mature miRNA regions of instances
having a common miRNA family. However, in the present work,
information has been extracted from 200 bp precursor sequences.
In such sequences, despite of some instances sharing a common
miRNA family, the overall identity level is much lower than the
identity at mature miRNA level. Still, to assess the possibility of
bias introduced due to presence of similar sequences, a test was
performed. All relationship instances between training and testing
sets which exhibited .80% identity were removed. The perfor-
mance was analyzed for the new sets without such instances. The
total number of such sequences exhibiting .80% identity was
found to be much small in number than the total sequences
considered for testing. Extremely slight changes in performance
was noticed, where the performance drop never crossed even
0.9%, clearly suggesting that the classification system was free
from any such bias.
One may still argue that despite of having poor overall
similarity, existence of common family led mature miRNA region
similarity alone may cause some bias. Though the presented
algorithm considers the features contributed by a large region of
200 bp in position specific manner where significant existence of
such bias is least expected, a test was carried out to measure any
Pre-miRNA Identification with miR-BAG
PLOS ONE | www.plosone.org 7 September 2012 | Volume 7 | Issue 9 | e45782
such bias. Considering the human miRNA families, the precursors
were distributed in such a manner that no common family existed
for any pair of training and testing instances. The training set
contained precursors belonging to entirely different miRNA
families than those in the testing set (Supporting Material S1). A
total of 573 positive instances in the training set and 392 positive
instances in the testing set were taken. Since the bias was expected
to be introduced through the positive instances only, same
negative instances were retained in the test and training sets as
were taken in the above mentioned tests for human. The new
classifier displayed almost a similar level of performance
(Sn = 87.7%, Sp = 92.4%, Ac = 90.5%) as was observed earlier,
concurring with the above mentioned observation that the
classification system does not suggest any significant bias.
miRNA Specific Structural Profile Matrix as the TopScoring Feature
Several properties have been used previously to form classifi-
cation systems which could be able to fish out the miRNA
candidates from sequence data. Several tools considered properties
as GC content or AU content of the sequence, number of bulges,
size of bulges, length of the hairpin and many others to distinguish
miRNAs and non miRNAs [8,34]. A comparative study was
performed to calculate the ranges of these criteria. For most of the
above mentioned features, there was a large overlap between the
various RNA categories considered. For instance, in case of
human, the GC content for miRNAs (avg: 0.53), rRNA (avg: 0.49),
snoRNA (avg: 0.43), snRNA (avg: 0.40), tRNA (avg: 0.56) and
pseudohairpins (avg: 0.56) exhibited large amount of overlaps. The
complete information for every species is provided in Table 3(Supporting Material S4 for details). Thus, such features may not
be sharp enough to efficiently differentiate between miRNAs and
background sequences. Also, we have already discussed above
about the implications in considering MFE, a consistent feature in
most of the identification tools. Continued application of such
features as the central feature might be a reason for the observed
performance lag, which some tools exhibited here when tested for
different datasets in the present study.
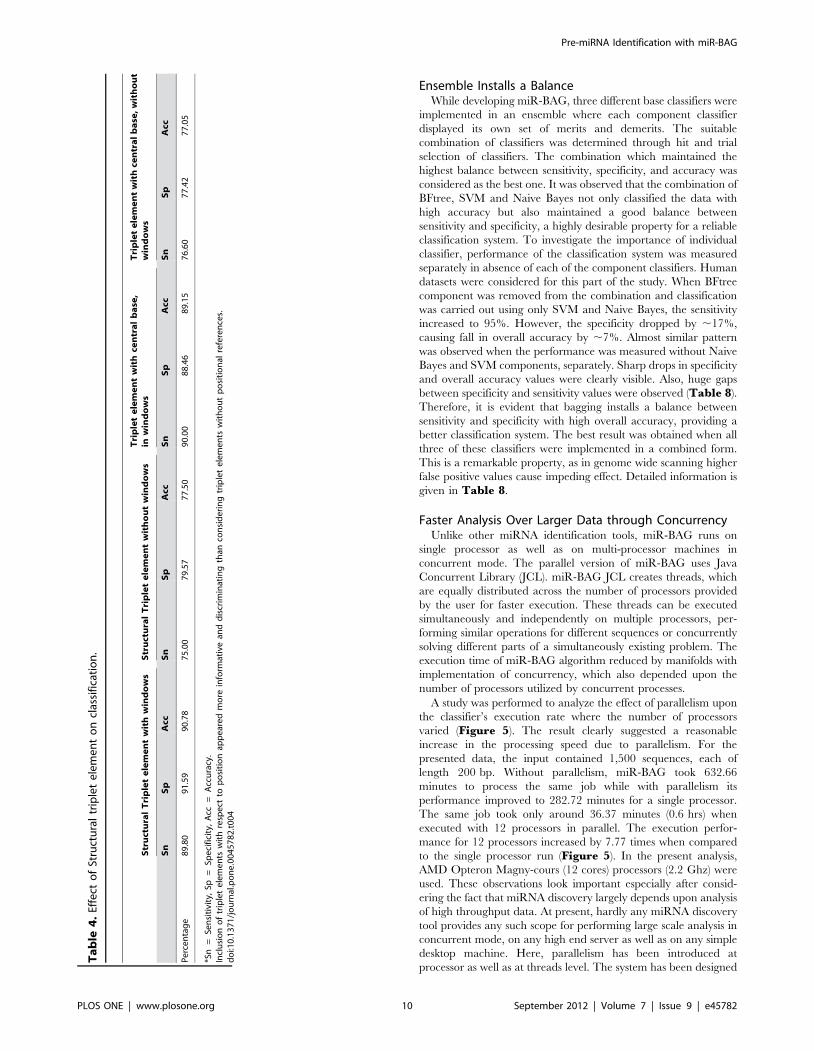
As mentioned before, the structural triplet element features were
calculated in sliding windows. Xue et al [15] had captured both
structural and sequence features, considering full length of the
precursor at one go. However, in the present study the triplet
structural elements’ density profile variation alone with respect to
position could provide more information and discrimination than
considering triplet elements with central nucleotide information
without positional references. A possible reasoning for such
observation could be the fact that more than sequence level
similarity, structural level similarity is expected for elements like
miRNA precursors. Besides this, the positional information works
like a relative structural motif. Our analysis with and without
sliding windows confirmed this observation (Table 4). Also, it
appeared among the top scoring features during feature selection.
One of the most important parts of a miRNA candidate
sequences is the region containing the mature miRNA itself, which
controls the target gene’s expressions in spatio-temporal manner
[42,43]. It has been observed that structure of a functionally
critical entity is comparatively more conserved than its sequence.
Therefore, due to its functional importance, the structure of
Table 1. Number of sequences taken in testing and training sets.
Training Set Testing Set
Positive Negative Positive Negative
r sno sn t SINE ps r sno sn t SINE ps
Homo sapiens 584 98 98 98 86 5 250 500 97 97 97 86 5 225
Canis familiaris 158 34 34 34 0 0 55 159 33 35 35 0 0 53
Rattus norvegicus 195 43 45 44 0 0 60 196 30 30 30 0 0 84
Drosophila melanogaster 112 12 24 11 25 0 40 113 13 24 11 25 0 40
Caenorhabditis elegans 108 5 25 25 25 0 25 109 5 25 25 25 0 25
Mus musculus 348 75 75 75 0 0 123 348 75 75 75 0 0 123
*ps- pseudohairpin sequences from mRNAs, r– rRNA sequences, sno- snoRNA sequences, sn- snRNA sequences, t- tRNA sequences.All possible sources of redundancy were eliminated while preparing the datasets. The test sets contained never seen before instances.doi:10.1371/journal.pone.0045782.t001
Table 2. Performance of miR-BAG for different species.
Species TP FN TN FP Sensitivity (%) Specificity (%) Accuracy (%) MCC
Homo sapiens 449 51 556 51 89.80 91.59 90.78 0.81
Canis familiaris 143 16 150 6 89.93 96.15 93.01 0.86
Mus musculus 302 46 319 29 86.78 91.66 89.22 0.78
Rattus norvegicus 184 12 161 13 93.87 92.52 93.24 0.86
Drosophila melanogaster 102 11 108 5 90.26 95.57 92.92 0.85
Caenorhabditis elegans 97 12 98 7 88.99 93.33 91.12 0.82
*TP = True positive, FN = False negative, TN = true negative, FP = False positive, MCC = Matthew Correlation Coefficient.Performance is described in terms of sensitivity, specificity, accuracy and MCC values obtained for each species.doi:10.1371/journal.pone.0045782.t002
Pre-miRNA Identification with miR-BAG
PLOS ONE | www.plosone.org 8 September 2012 | Volume 7 | Issue 9 | e45782
miRNA containing region might be more conserved than the rest
of the precursor regions. Also, some recent studies have suggested
that this region harbors binding sites for factors critical for miRNA
biogenesis [44,45]. Though it is just a single feature among the
array of various features considered in this study, structural profile
matrices introduced in this study emerged as one of the most
discriminating features. It relied upon the property of structural
conservation in miRNAs. It exhibited high discrimination capacity
between the positive and negative instances (p-value ,0.0001,
Mann-Whitney test at 95% confidence interval). A test for its
contribution in the classifiers as a single feature suggested a drop in
the classifier performance if the profiles were not considered
(Table 5). This is a remarkable contribution, considering the fact
that structural profiles make just a single feature. This impact was
evident across most species taken in this study, suggesting the
universal validity of the structural profiles. The structural profile
matrices scoring plots were generated for the positive and negative
instances, considering all species involved in this study (Supporting
Material S3). The plots clearly displayed the demarcating ability of
matrix scores.
Furthermore, feature selection was performed to identify the
most discriminating features in every species studied here.
Structural profile matrices emerged as the highest scoring top
ranked feature in majority of the species, followed by positional
triplet structural elements. Table 6 shows the feature scores and
ranks for structural profile matrix feature for various species. The
top 15 features and their corresponding F-scores are mentioned in
Supporting Material S5.
Structural profiles were generated using all species specific
precursors. Since part of the same set was used as positive
instances for testing the classifier, one may doubt for presence of
some bias arising due to this. However, possibility of such bias in
profile based approaches is very less. The profiles dilute individual
identity of instances and promote domain specific group identity,
which was verified through some tests. The profiles developed
from human specific precursors were applied against cow, rat, and
C. elegans specific test datasets, which contained precursor
sequences specific to these species only (42, 61 and 99 species
specific precursors from cow, rat and C. elegans, respectively). The
datasets contained almost equal amount of pseudo-hairpin
instances. The human specific profiles were totally naive to these
instances. If a profile memorizes the individual instances used to
develop it and imbibes some bias, a poor performance is expected
if such profiles are used against never seen before instances. Also,
there should not be any major change in the performance if such
profiles are not used. Therefore, if there is some bias, the
classification system containing human specific profiles should
display no change in its performance if the classification system
works without these profiles. However, when tested over the above
mentioned unseen datasets (containing rat, cow and c. elegans
specific miRNAs), the same did not hold, and a sharp decline in
performance was observed after removal of human specific profiles
(Table 7).
In another test, using human miRNA precursors, the test and
training sets were created with entirely different sets of miRNA
families (Supporting Material S1). No instances from training and
test sets belonged to any common miRNA family. The negative
instances in both datasets were same as those taken in the above
mentioned benchmarking studies for human. The structural
profiles were built using the training set precursors only. The
resultant classifier’s performance with the new matrices was
measured for the test set having totally different set of miRNA
families. As observed earlier, the performance remained almost
similar (Sn: 88.3%, Sp: 92%, Ac: 90.83%), suggesting no
significant bias. About 1% drop in the accuracy was observed
when the classifier was run without the profiles. As already
mentioned above, such drop is significant one because the profile
matrices contribute only as a single feature.
Above results suggest that the profiles provide some structural
signatures specific to microRNA precursors, which could be useful
for miRNA identification. The applied approach also seems to be
free from any significant bias.
Figure 4. ROC plots for performance with 10 fold CV. TheReceiver’s Operating Characteristic Curves obtained for animal modelclassifiers.doi:10.1371/journal.pone.0045782.g004
Table 3. Average values for conventional features considered for miRNA precursors.
Species MFE (kcal/mol) GC content AU content Loop length Stem lengthNumber ofbulges Hairpin length
Animals 237.44 0.49 0.51 17 34 3 85
Homo sapiens 240.09 0.50 0.50 16 34 3 84
Canis familiaris 229.23 0.48 0.52 13 28 3 69
Mus musculus 236.80 0.49 0.51 17 36 3 85
Rattus norvegicus 239.49 0.50 0.50 18 36 4 91
Caenorhabditis elegans 234.37 0.42 0.58 19 35 3 89
Drosophila melanogaster 233.00 0.43 0.57 20 37 4 95
The average values for the various conventional features: Minimum Free Energy, GC content, AU content, loop length, stem length, number of bulges and length of thehairpin.doi:10.1371/journal.pone.0045782.t003
Pre-miRNA Identification with miR-BAG
PLOS ONE | www.plosone.org 9 September 2012 | Volume 7 | Issue 9 | e45782
Ensemble Installs a BalanceWhile developing miR-BAG, three different base classifiers were
implemented in an ensemble where each component classifier
displayed its own set of merits and demerits. The suitable
combination of classifiers was determined through hit and trial
selection of classifiers. The combination which maintained the
highest balance between sensitivity, specificity, and accuracy was
considered as the best one. It was observed that the combination of
BFtree, SVM and Naive Bayes not only classified the data with
high accuracy but also maintained a good balance between
sensitivity and specificity, a highly desirable property for a reliable
classification system. To investigate the importance of individual
classifier, performance of the classification system was measured
separately in absence of each of the component classifiers. Human
datasets were considered for this part of the study. When BFtree
component was removed from the combination and classification
was carried out using only SVM and Naive Bayes, the sensitivity
increased to 95%. However, the specificity dropped by ,17%,
causing fall in overall accuracy by ,7%. Almost similar pattern
was observed when the performance was measured without Naive
Bayes and SVM components, separately. Sharp drops in specificity
and overall accuracy values were clearly visible. Also, huge gaps
between specificity and sensitivity values were observed (Table 8).
Therefore, it is evident that bagging installs a balance between
sensitivity and specificity with high overall accuracy, providing a
better classification system. The best result was obtained when all
three of these classifiers were implemented in a combined form.
This is a remarkable property, as in genome wide scanning higher
false positive values cause impeding effect. Detailed information is
given in Table 8.
Faster Analysis Over Larger Data through ConcurrencyUnlike other miRNA identification tools, miR-BAG runs on
single processor as well as on multi-processor machines in
concurrent mode. The parallel version of miR-BAG uses Java
Concurrent Library (JCL). miR-BAG JCL creates threads, which
are equally distributed across the number of processors provided
by the user for faster execution. These threads can be executed
simultaneously and independently on multiple processors, per-
forming similar operations for different sequences or concurrently
solving different parts of a simultaneously existing problem. The
execution time of miR-BAG algorithm reduced by manifolds with
implementation of concurrency, which also depended upon the
number of processors utilized by concurrent processes.
A study was performed to analyze the effect of parallelism upon
the classifier’s execution rate where the number of processors
varied (Figure 5). The result clearly suggested a reasonable
increase in the processing speed due to parallelism. For the
presented data, the input contained 1,500 sequences, each of
length 200 bp. Without parallelism, miR-BAG took 632.66
minutes to process the same job while with parallelism its
performance improved to 282.72 minutes for a single processor.
The same job took only around 36.37 minutes (0.6 hrs) when
executed with 12 processors in parallel. The execution perfor-
mance for 12 processors increased by 7.77 times when compared
to the single processor run (Figure 5). In the present analysis,
AMD Opteron Magny-cours (12 cores) processors (2.2 Ghz) were
used. These observations look important especially after consid-
ering the fact that miRNA discovery largely depends upon analysis
of high throughput data. At present, hardly any miRNA discovery
tool provides any such scope for performing large scale analysis in
concurrent mode, on any high end server as well as on any simple
desktop machine. Here, parallelism has been introduced at
processor as well as at threads level. The system has been designed
Ta
ble
4.
Effe
cto
fSt
ruct
ura
ltr
iple
te
lem
en
to
ncl
assi
fica
tio
n.
Str
uct
ura
lT
rip
let
ele
me
nt
wit
hw
ind
ow
sS
tru
ctu
ral
Tri
ple
te
lem
en
tw
ith
ou
tw
ind
ow
sT
rip
let
ele
me
nt
wit
hce
ntr
al
ba
se,
inw
ind
ow
sT
rip
let
ele
me
nt
wit
hce
ntr
al
ba
se,
wit
ho
ut
win
do
ws
Sn
Sp
Acc
Sn
Sp
Acc
Sn
Sp
Acc
Sn
Sp
Acc
Pe
rce
nta
ge
89
.80
91
.59
90
.78
75
.00
79
.57
77
.50
90
.00
88
.46
89
.15
76
.60
77
.42
77
.05
*Sn
=Se
nsi
tivi
ty,
Sp=
Spe
cifi
city
,A
cc=
Acc
ura
cy.
Incl
usi
on
of
trip
let
ele
me
nts
wit
hre
spe
ctto
po
siti
on
app
ear
ed
mo
rein
form
ativ
ean
dd
iscr
imin
atin
gth
anco
nsi
de
rin
gtr
iple
te
lem
en
tsw
ith
ou
tp
osi
tio
nal
refe
ren
ces.
do
i:10
.13
71
/jo
urn
al.p
on
e.0
04
57
82
.t0
04
Pre-miRNA Identification with miR-BAG
PLOS ONE | www.plosone.org 10 September 2012 | Volume 7 | Issue 9 | e45782
to automatically decide the number of threads to be utilized from
each processor, depending upon the processor load.
miR-BAG Emerges as a Reliable PerformermiR-BAG was compared for performance with six existing tools
for miRNA precursor identification: Triplet-SVM [13], microPred
[34], CSHMM [16], MirEval [17], miRNA SVM [20] and
MiRPara [21]. The above mentioned human datasets were used.
The analyses suggested better performance by miR-BAG as shown
in Table 9.
Triplet-SVM [13] works with triplet structural elements,
considering position independent structural as well as sequence
based information. When tested, Triplet-SVM exhibited a
specificity value of 93.57% and a lower sensitivity value of
70.2%. Thus, the overall accuracy of Triplet-SVM was 83.02%
(Table 9). Almost the similar issue was apparent for miRNA SVM
[20], where the overall accuracy was ,71%. However, a huge
imbalance between its sensitivity (43.20%) and specificity (94.72%)
values was conspicuous. This suggested that miRNA SVM has an
inclination towards over-prediction of false negatives and overall
high prediction of negative instances. Almost the opposite was
apparent with CSHMM [16], where the tool was found more
inclined towards over-prediction for miRNA candidates. Fort the
same test set, CSHMM exhibited a sensitivity of 98.4% while
specificity took a dip at 24.05%, resulting into overall accuracy of
57.63%. CSHMM [16] applies memory backed context sensitive
HMM to model long distanced pairing between the bases in a
RNA secondary structure. However, as discussed above, it appears
that accurate identification of miRNA precursors relies more upon
measuring multiple model features instead of a few features.
Another tool, microPred [34], performed well (Sn: 90.44%, Sp:
77.72%) when tested over the same dataset which was used to
report its bench-marking results (Table 10). However, it exhibited
declined accuracy for other datasets (Table 9). For our
benchmarking dataset, microPred displayed 16.6% sensitivity,
67.54% specificity and 44.53% accuracy. microPred [34] consid-
ers different types of RNA families in its negative set, including
rRNAs, tRNAs and Y RNAs. It considers minimum free energy of
folded RNA for a fixed query length. It was found that microPred
was extremely sensitive towards the query length and a drastic
performance drop was noted if the input length was varied.
Variation in input length changed the structural and MFE
parameters, the properties upon which microPred relies immense-
ly. As already discussed above, free energy distribution does not
emerge as a strong discriminating feature, as a large amount of
negative and positive instances overlap with each other (Support-
ing Material S3). With this work, we suggest that the above
mentioned limitations of microPred could be fixed if the same
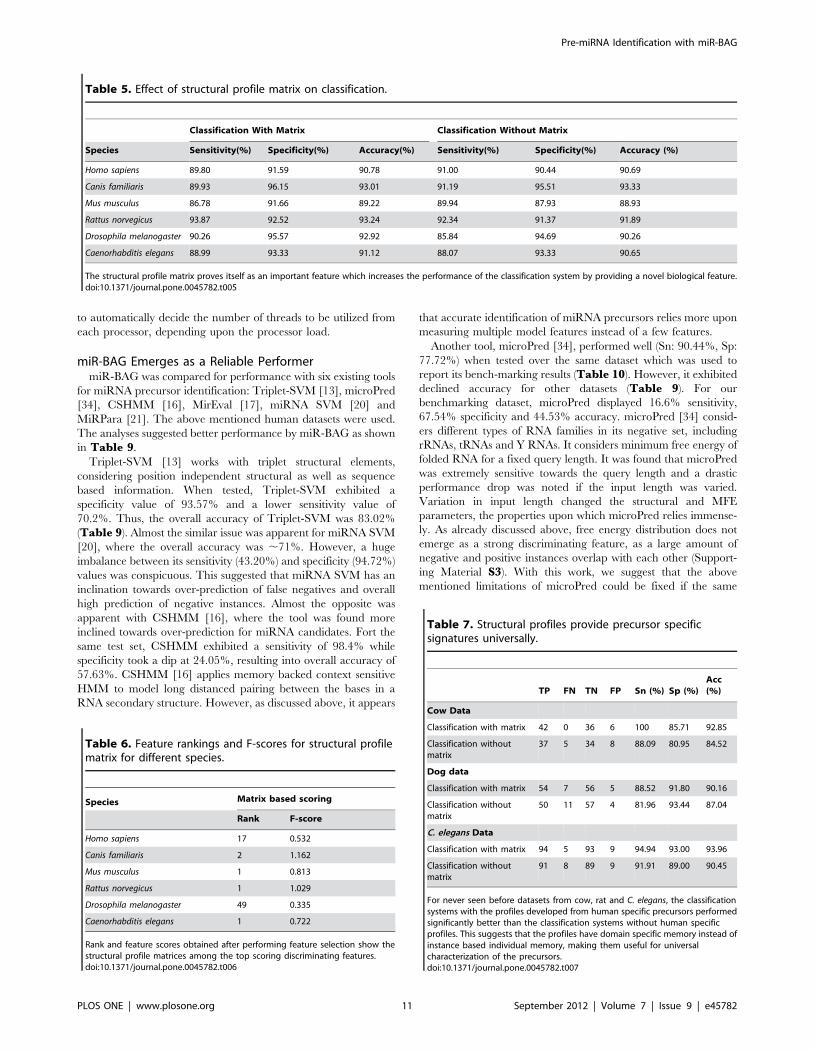
Table 5. Effect of structural profile matrix on classification.
Classification With Matrix Classification Without Matrix
Species Sensitivity(%) Specificity(%) Accuracy(%) Sensitivity(%) Specificity(%) Accuracy (%)
Homo sapiens 89.80 91.59 90.78 91.00 90.44 90.69
Canis familiaris 89.93 96.15 93.01 91.19 95.51 93.33
Mus musculus 86.78 91.66 89.22 89.94 87.93 88.93
Rattus norvegicus 93.87 92.52 93.24 92.34 91.37 91.89
Drosophila melanogaster 90.26 95.57 92.92 85.84 94.69 90.26
Caenorhabditis elegans 88.99 93.33 91.12 88.07 93.33 90.65
The structural profile matrix proves itself as an important feature which increases the performance of the classification system by providing a novel biological feature.doi:10.1371/journal.pone.0045782.t005
Table 6. Feature rankings and F-scores for structural profilematrix for different species.
Species Matrix based scoring
Rank F-score
Homo sapiens 17 0.532
Canis familiaris 2 1.162
Mus musculus 1 0.813
Rattus norvegicus 1 1.029
Drosophila melanogaster 49 0.335
Caenorhabditis elegans 1 0.722
Rank and feature scores obtained after performing feature selection show thestructural profile matrices among the top scoring discriminating features.doi:10.1371/journal.pone.0045782.t006
Table 7. Structural profiles provide precursor specificsignatures universally.
TP FN TN FP Sn (%) Sp (%)Acc(%)
Cow Data
Classification with matrix 42 0 36 6 100 85.71 92.85
Classification withoutmatrix
37 5 34 8 88.09 80.95 84.52
Dog data
Classification with matrix 54 7 56 5 88.52 91.80 90.16
Classification withoutmatrix
50 11 57 4 81.96 93.44 87.04
C. elegans Data
Classification with matrix 94 5 93 9 94.94 93.00 93.96
Classification withoutmatrix
91 8 89 9 91.91 89.00 90.45
For never seen before datasets from cow, rat and C. elegans, the classificationsystems with the profiles developed from human specific precursors performedsignificantly better than the classification systems without human specificprofiles. This suggests that the profiles have domain specific memory instead ofinstance based individual memory, making them useful for universalcharacterization of the precursors.doi:10.1371/journal.pone.0045782.t007
Pre-miRNA Identification with miR-BAG
PLOS ONE | www.plosone.org 11 September 2012 | Volume 7 | Issue 9 | e45782
process is done with sliding windows of some fixed length instead
of considering complete sequence at one go.
MiRPara [21] considers minimum fold energy of the query
sequence along with other parameters. This tool takes a realistic
approach while considering the dataset. It reasons that since the
submitted precursors might have incomplete sequence, structure of
precursor given in miRbase might differ from the actual one. Such
consideration looked genuine when MiRPara was tested over the
mentioned test set. Though the overall accuracy of MiRPara was
found lesser than Triplet-SVM by ,2%, the balance between its
specificity and sensitivity was found better than most of the tools
studied here, including Triplet-SVM. Also, MiRPara is available
as a stand-alone tool, thus it is useful for genome wide and large
scale analysis for miRNA identification (Table 9). Another tool,
MirEval [17], performed almost equally good and displayed
almost similar level of balance between its sensitivity (78.7%) and
specificity (80.6%). Its overall observed accuracy was 79.7%
(Table 9). MirEval [17] applies SVM, considering some structural
theories in combination with Triplet-SVM protocol. It delivered
sensitivity of 78.7%, specificity of 80.6% and overall accuracy of
79.7%. However, MirEval is available only as a webserver tool,
which limits its application for large scale analysis.
Compared to the mentioned tools, miR-BAG performed better
with overall accuracy of 90.78% and least difference was observed
between the values for sensitivity (89.8%) and specificity (91.59%).
An associated comparative ROC plotting has been made available
in Supporting Material S6. The sequences used for benchmarking
these tools are available in Supporting Material S1.
NGS Reads Guided Novel miRNA Discovery in the CowGenome
The Next Generation Sequencing data can detect even poorly
expressed RNAs, inluding coding as well as non-coding ones.
Recently, NGS read data has been used successfully in identifying
novel miRNAs [46]. Therefore, it becomes imperative for miRNA
discovery tools to provide an approach to detect miRNAs using
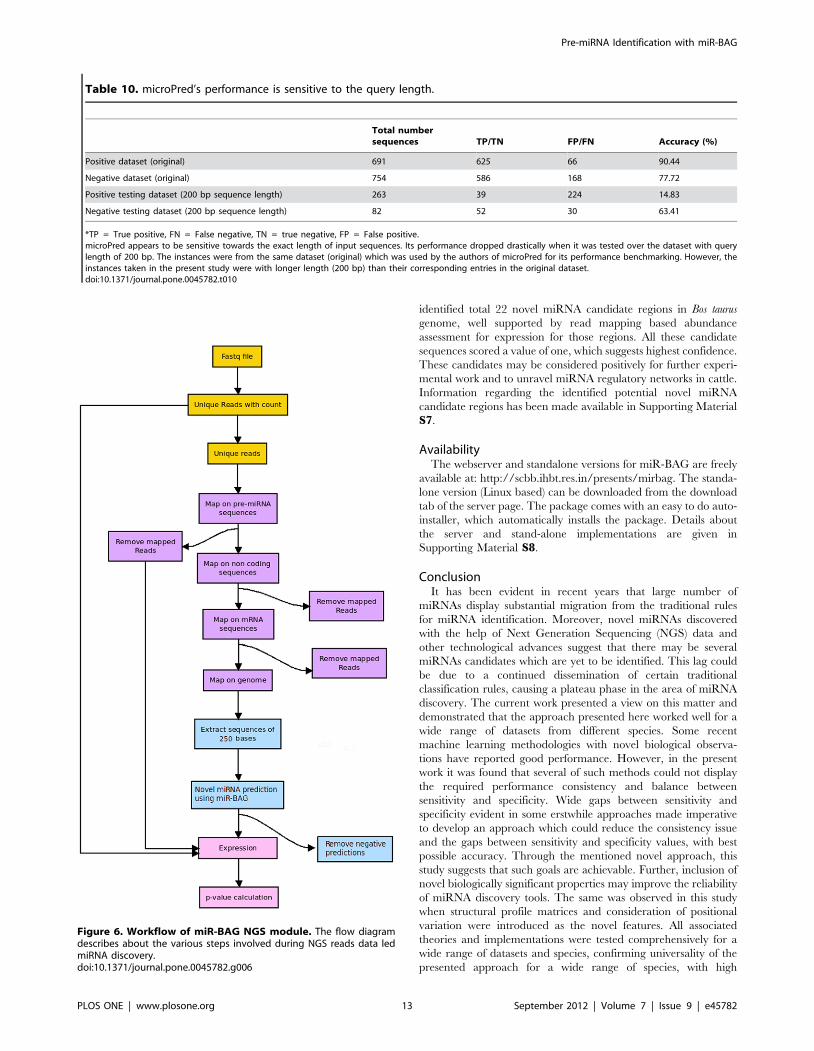
short read data. Considering this, miR-BAG provides an NGS
interface to identify miRNA candidates in genomes. This module
utilizes short read data directed reference mapping for guiding the
process of precursor identification. The working principle assumes
that within a 75 bp region in a given genomic sequence, a miRNA
candidate region would display two peaks for the mapped reads.
The NGS module of miR-BAG was used to discover novel
miRNA regions in Bos taurus genome. Bos taurus has a genome
sequence released with lesser number of known miRNAs
compared to extensively studied vertebrates like human and
mouse. It is an economically important species, which is also a
driving force for large scale industries like dairy. Apart from this,
its products are also used as a bioreactor for production of various
vaccines and other items [47,48]. Bos taurus has an average genome
size of 2,670,422,299 bp and a total of 31 chromosomes. The draft
assembly for Bos taurus was released in year 2009 [49]. Only 662
pre-miRNAs are reported for Bos taurus in miRBase version 18
[22]. Out of this, only 42 pre-miRNAs are specific to Bos taurus.
Using human model, miR-BAG-NGS module and Bos taurus
specific miR-seq reads data, miR-BAG correctly identified all 42
Bos taurus specific miRNA precursors, suggesting highly reliable
performance. The overall basic work-flow for miR-BAG NGS
module is explained in Figure 6.
Encouraged with this, Bos taurus genome was scanned for potential
novel miRNA candidate regions using available Illumina miRNA-
Seq read data. miR-BAG NGS module was applied for the same
purpose. Associated details are described in the implementation
section. Out of 7,434,705 unique reads, 7,332,970 reads were
mapped across the mRNA sequences of Bos taurus. Remaining
101,735 reads did not map to any mRNA. Such reads were mapped
across a number of noncoding RNA sequences downloaded from
Rfam. Only 34,253 reads mapped to Rfam sequences. Remaining
67,482 reads were searched against Bos taurus pre-miRNA sequences.
Total 1,952 reads were mapped on already known pre-miRNA
sequences from Bos taurus. Remaining 62,447 reads which did not
map to these non coding RNA sequences were mapped across the
genome for novel miRNA precursor discovery. Finally, miR-BAG
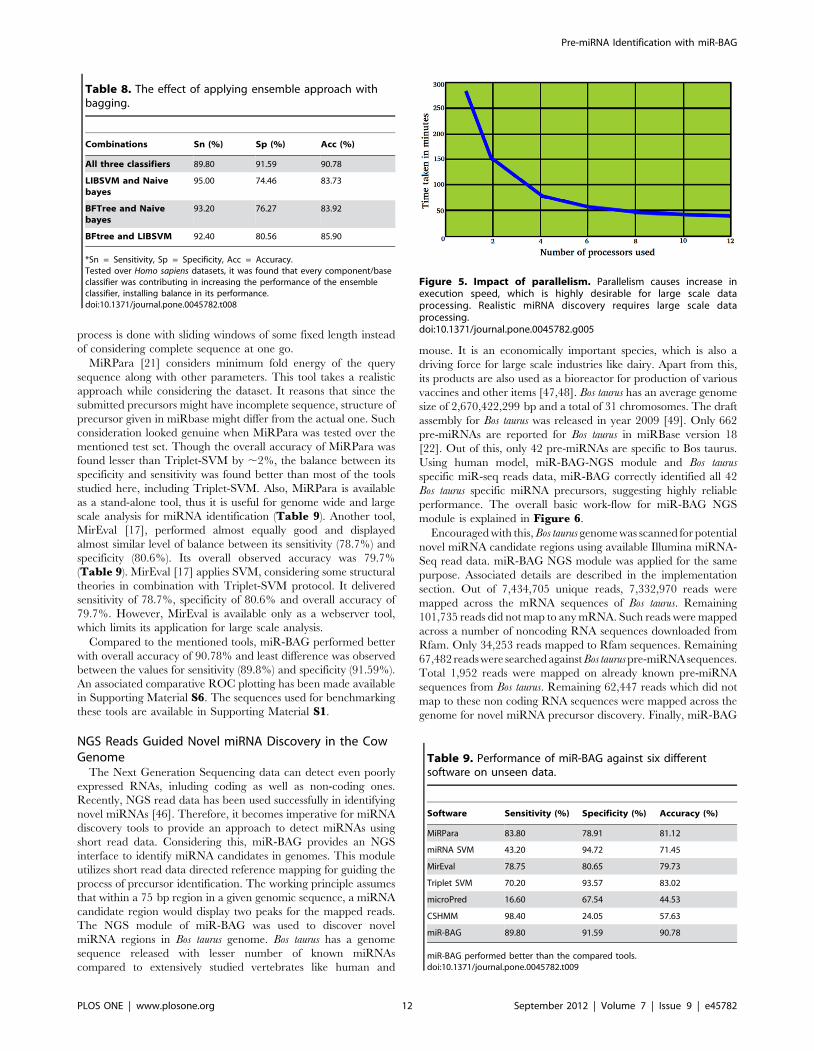
Table 8. The effect of applying ensemble approach withbagging.
Combinations Sn (%) Sp (%) Acc (%)
All three classifiers 89.80 91.59 90.78
LIBSVM and Naivebayes
95.00 74.46 83.73
BFTree and Naivebayes
93.20 76.27 83.92
BFtree and LIBSVM 92.40 80.56 85.90
*Sn = Sensitivity, Sp = Specificity, Acc = Accuracy.Tested over Homo sapiens datasets, it was found that every component/baseclassifier was contributing in increasing the performance of the ensembleclassifier, installing balance in its performance.doi:10.1371/journal.pone.0045782.t008
Figure 5. Impact of parallelism. Parallelism causes increase inexecution speed, which is highly desirable for large scale dataprocessing. Realistic miRNA discovery requires large scale dataprocessing.doi:10.1371/journal.pone.0045782.g005
Table 9. Performance of miR-BAG against six differentsoftware on unseen data.
Software Sensitivity (%) Specificity (%) Accuracy (%)
MiRPara 83.80 78.91 81.12
miRNA SVM 43.20 94.72 71.45
MirEval 78.75 80.65 79.73
Triplet SVM 70.20 93.57 83.02
microPred 16.60 67.54 44.53
CSHMM 98.40 24.05 57.63
miR-BAG 89.80 91.59 90.78
miR-BAG performed better than the compared tools.doi:10.1371/journal.pone.0045782.t009
Pre-miRNA Identification with miR-BAG
PLOS ONE | www.plosone.org 12 September 2012 | Volume 7 | Issue 9 | e45782
identified total 22 novel miRNA candidate regions in Bos taurus
genome, well supported by read mapping based abundance
assessment for expression for those regions. All these candidate
sequences scored a value of one, which suggests highest confidence.
These candidates may be considered positively for further experi-
mental work and to unravel miRNA regulatory networks in cattle.
Information regarding the identified potential novel miRNA
candidate regions has been made available in Supporting Material
S7.
AvailabilityThe webserver and standalone versions for miR-BAG are freely
available at: http://scbb.ihbt.res.in/presents/mirbag. The standa-
lone version (Linux based) can be downloaded from the download
tab of the server page. The package comes with an easy to do auto-
installer, which automatically installs the package. Details about
the server and stand-alone implementations are given in
Supporting Material S8.
ConclusionIt has been evident in recent years that large number of
miRNAs display substantial migration from the traditional rules
for miRNA identification. Moreover, novel miRNAs discovered
with the help of Next Generation Sequencing (NGS) data and
other technological advances suggest that there may be several
miRNAs candidates which are yet to be identified. This lag could
be due to a continued dissemination of certain traditional
classification rules, causing a plateau phase in the area of miRNA
discovery. The current work presented a view on this matter and
demonstrated that the approach presented here worked well for a
wide range of datasets from different species. Some recent
machine learning methodologies with novel biological observa-
tions have reported good performance. However, in the present
work it was found that several of such methods could not display
the required performance consistency and balance between
sensitivity and specificity. Wide gaps between sensitivity and
specificity evident in some erstwhile approaches made imperative
to develop an approach which could reduce the consistency issue
and the gaps between sensitivity and specificity values, with best
possible accuracy. Through the mentioned novel approach, this
study suggests that such goals are achievable. Further, inclusion of
novel biologically significant properties may improve the reliability
of miRNA discovery tools. The same was observed in this study
when structural profile matrices and consideration of positional
variation were introduced as the novel features. All associated
theories and implementations were tested comprehensively for a
wide range of datasets and species, confirming universality of the
presented approach for a wide range of species, with high
Table 10. microPred’s performance is sensitive to the query length.
Total numbersequences TP/TN FP/FN Accuracy (%)
Positive dataset (original) 691 625 66 90.44
Negative dataset (original) 754 586 168 77.72
Positive testing dataset (200 bp sequence length) 263 39 224 14.83
Negative testing dataset (200 bp sequence length) 82 52 30 63.41
*TP = True positive, FN = False negative, TN = true negative, FP = False positive.microPred appears to be sensitive towards the exact length of input sequences. Its performance dropped drastically when it was tested over the dataset with querylength of 200 bp. The instances were from the same dataset (original) which was used by the authors of microPred for its performance benchmarking. However, theinstances taken in the present study were with longer length (200 bp) than their corresponding entries in the original dataset.doi:10.1371/journal.pone.0045782.t010
Figure 6. Workflow of miR-BAG NGS module. The flow diagramdescribes about the various steps involved during NGS reads data ledmiRNA discovery.doi:10.1371/journal.pone.0045782.g006
Pre-miRNA Identification with miR-BAG
PLOS ONE | www.plosone.org 13 September 2012 | Volume 7 | Issue 9 | e45782
reliability. Through extensive and variable benchmarking steps,
we could conclude that miR-BAG’ performed better than the
compared tools. The area of miRNA discovery requires scanning
of large volume of sequences and reads data, making it essential to
develop new tools with high processing speed. Considering this,
two required but not so common features have been implemented
in the presented tool: A) Implementation of concurrency at all
levels B) Availability of miR-BAG as a web server as well as a
stand-alone user friendly GUI version. Besides this, miR-BAG has
an inbuilt next generation sequencing associated pipeline to
identify novel miRNAs across a genome. This all makes it an
important miRNA discovery tool and a desirable resource in the
field of miRNA biology and regulatory studies.
Supporting Information
Supporting Material S1 Total sequences used in trainingand testing datasets of miR-BAG for different speciesand benchmarking of various tools.(DOC)
Supporting Material S2 Implementation details forparallelism in miR-BAG.(DOC)
Supporting Material S3 Energy and Structural profilematrix score plots drawn between the positive andnegative instances for all target species, depicting thedistribution patterns for positive and negative instances.(DOC)
Supporting Material S4 The statistics of all conventionalfeatures used by previously existing tools.(XLS)
Supporting Material S5 The top 15 feature scores alongwith the feature names and type of the features obtainedafter feature selection for every species.
(DOC)
Supporting Material S6 Comparative ROC plots fordifferent precursor identification tools.
(TIFF)
Supporting Material S7 Sequence data for novel miRNAsidentified in Bos taurus genome, using the NGS moduleof miR-BAG.
(DOC)
Supporting Material S8 Web-server and standaloneimplementation details for miR-BAG.
(PDF)
Acknowledgments
MM is thankful to CSIR for her JRFship, RC is thankful to CSIR-
EMPOWER for his fellowship, AJ is thankful to DBT, India for his
fellowship, HRS is thankful to CSIR for his fellowship. We are grateful to
Dr. RD Singh for proofreading this MS. We thank Mr VN Rai and Mr BS
Chauhan for editing inputs. We are also thankful to the Director, IHBT for
supporting this study. Finally, we are very much grateful to the open source
and open access communities. The publication ID (CSIR-IHBT) for this
MS is: 2343.
Author Contributions
Conceived and designed the experiments: RS. Performed the experiments:
AJ RC MM HRS. Analyzed the data: AJ RC MM RS. Contributed
reagents/materials/analysis tools: AJ RC HRS MM. Wrote the paper:
MM RS.
References
1. Fabian MR, Sonenberg N, Filipowicz W (2010) Regulation of mRNA
translation and stability by microRNAs. Annu Rev Biochem 79: 351–379.
2. Winter J, Jung S, Keller S, Gregory RI, Diederichs S (2009) Many roads to
maturity: microRNA biogenesis pathways and their regulation. Nat Cell Biol
11(3): 228–234.
3. Smalheiser NR (2003) EST analyses predict the existence of a population of
chimeric microRNA precursor-mRNAtranscripts expressed in normal human
and mouse tissues. Genome Biol 4(7): 403.
4. Lee Y, Kim M, Han J, Yeom KH, Lee S, et al. (2004) MicroRNA genes are
transcribed by RNA polymerase II. EMBO J 23(20): 4051–4060.
5. Borchert GM, Lanier W, Davidson BL (2006) RNA polymerase III transcribes
human microRNAs. Nat Struct Mol Biol 13(12): 1097–1101.
6. Brownawell AM, Macara IG (2002) Exportin-5, a novel karyopherin, mediates
nuclear export of double-stranded RNA binding proteins. J Cell Biol 156(1): 53–
64.
7. Macrae IJ, Zhou K, Li F, Repic A, Brooks AN, et al. (2006) Structural basis for
double-stranded RNA processing by Dicer. Science 311(5758): 195–198.
8. Bentwich I, Avniel A, Karov Y, Aharonov R, Gilad S, et al. (2005) Identification
of hundreds of conserved and nonconserved human microRNAs. Nat Genet
37(7): 766–770.
9. Lim LP, Lau NC, Weinstein EG, Abdelhakim A, Yekta S, et al. (2003) The
microRNAs of Caenorhabditis elegans. Genes Dev 17(8): 991–1008.
10. Lai EC, Tomancak P, Williams RW, Rubin GM (2003) Computational
identification of Drosophila microRNA genes. Genome Biol 4(7): R42.
11. Berezikov E, Guryev V, van de Belt J, Wienholds E, Plasterk RH, et al. (2005)
Phylogenetic shadowing and computational identification of human microRNA
genes. Cell 120(1): 21–24.
12. Saetrom P, Snøve O, Nedland M, Grunfeld TB, Lin Y, et al. (2006) Conserved
microRNA characteristics in mammals. Oligonucleotides 16(2): 115–44.
13. Xue C, Li F, He T, Liu GP, Li Y, et al. (2005) Classification of real and pseudo
microRNA precursors using local structure-sequence features and support vector
machine. BMC Bioinformatics 6: 310.
14. Jiang P, Wu H, Wang W, Ma W, Sun X, et al. (2007) MiPred: classification of
real and pseudo microRNA precursors using random forest prediction model
with combined features. Nucleic Acids Res 35: W339–344.
15. Yousef M, Nebozhyn M, Shatkay H, Kanterakis S, Showe LC, et al. (2006)
Combining multi-species genomic data for microRNA identification using a
naıve Bayes classifier. Bioinformatics 22(11): 1325–1334.
16. Agarwal S, Vaz C, Bhattacharya A, Srinivasan A (2010) Prediction of novel
precursor miRNAs using a context-sensitive hidden Markov model (CSHMM).
BMC Bioinformatics 11.
17. Ritchie W, Theodule FX, Gautheret D (2008) MirEval: a web tool for simple
microRNA prediction in genome sequences. Bioinformatics 24(11): 1394–6.
18. Cooper SJ, Trinklein ND, Anton ED, Nguyen L, Myers RM (2006)
Comprehensive analysis of transcriptional promoter structure and function in
1% of the human genome. Genome Res 16(1): 1–10.
19. Tanzer A, Stadler PF (2006) Evolution of microRNAs. Methods Mol Biol 342:
335–350.
20. Helvik SA, Snove O, Saetrom P (2007) Reliable prediction of Drosha processing
sites improves microRNA gene prediction. Bioinformatics Genome Analysis 23:
142–149.
21. Wu Y, Wei B, Liu H, Li T, Rayner S (2011) MiRPara: a SVM-based software
tool for prediction of most probable microRNA coding regions in genome scale
sequences. BMC Bioinformatics 12: 107.
22. Kozomara A, Griffiths-Jones S (2011) miRBase: integrating microRNA
annotation and deep-sequencing data. Nucleic Acid Res 39: D152–D157.
23. Berezikov E, Thuemmler F, van Laake LW, Kondova I, Bontrop R, et al. (2006)
Diversity of microRNAs in human and chimpanzee brain. Nat Genet 38(12):
1375–1377.
24. Friedlander MR, Chen W, Adamidi C, Maaskola J, Einspanier R, et al. (2008)
Discovering microRNAs from deep sequencing data using miRDeep. Nat
Biotechnol 26: 407–415.
25. Ronen R, Gan I, Modai S, Sukacheov A, Dror G, et al. (2010) miRNAkey: a
software for microRNA deep sequencing analysis. Bioinformatics 26: 2615–
2616.
26. Hackenberg M, Sturm M, Langenberger D, Falcon-Perez JM, Aransay AM
(2009) miRanalyzer: a microRNA detection and analysis tool for next-generation
sequencing experiments. Nucleic Acid Res 37: W68–W76.
27. Mathelier A, Carbone A (2010) MIReNA: finding microRNAs with high
accuracy and no learning at genome scale and from deep sequencing data.
Bioinformatics 26: 2226–2234.
28. Kent WJ, Sugnet CW, Furey TS, Roskin KM, Pringle TH, et al. (2002) The
human genome browser at UCSC. Genome Res 12(6): 996–1006.
29. Flicek P, Amode MR, Barrell D, Beal K, Brent S, et al. (2011) Ensembl 2011.
Nucleic Acids Res 39: D800–D806.
Pre-miRNA Identification with miR-BAG
PLOS ONE | www.plosone.org 14 September 2012 | Volume 7 | Issue 9 | e45782
30. Jurka J, Kapitonov VV, Pavlicek A, Klonowski P, Kohany O, et al. (2005)
Repbase Update, a database of eukaryotic repetitive elements. Cytogenet andGenome Res 110: 462–467.
31. Hofacker IL, Fontana W, Stadler PF, Bonhoeffer S, Tacker M, et al. (1994) Fast
Folding and Comparison of RNA Secondary Structures. Monatshefte f. Chemie125: 167–188.
32. Abeel T, de Peer YV, Saeys Y (2009) Java-ML: A Machine Learning Library,JMLR 10: 931–934.
33. Hall M, Frank E, Holmes G, Pfahringer B, Reutemann P, et al. (2009) The
WEKA Data Mining Software: An Update. SIGKDD Explorations 11(1): 10–1834. Batuwita R, Palade V (2009) microPred: effective classification of pre-miRNAs
for human miRNA gene prediction. Bioinformatics 25(8): 989–995.35. Edgar R, Domrachev M, Lash AE (2002) Gene Expression Omnibus: NCBI
gene expression and hybridization array data repository. Nucleic Acids Res30(1): 207–210
36. Harhay GP, Smith TP, Alexander LJ, Haudenschild CD, Keele JW, et al. (2010)
An atlas of bovine gene expression reveals novel distinctive tissue characteristicsand evidence for improving genome annotation. Genome Biol 11(10): R102.
37. Gardner PP, Daub J, Tate JG, Nawrocki EP, Kolbe DL, et al. (2009) Rfam:updates to the RNA families database. Nucleic Acids Res 37: D136–140.
38. Langmead B, Trapnell C, Pop M, Salzberg SL (2009) Ultrafast and memory-
efficient alignment of short DNA sequences to the human genome. Genome Biol10: R25.
39. Ng KL, Mishra SK (2007) De novo SVM classification of precursor microRNAsfrom genomic pseudo hairpins using global and intrinsic folding measures.
Bioinformatics 23(11): 1321–1330.
40. Zhang BH, Pan XP, Cox SB, Cobb GP, Anderson TA (2006) Evidence that
miRNAs are different from other RNAs. Cell Mol Life Sci 63(2): 246–254.
41. Gardner PP, Giegerich R (2004) A comprehensive comparison of comparative
RNA structure prediction approaches. BMC Bioinformatics 5: 140.
42. Linsley PS, Schelter J, Burchard J, Kibukawa M, Martin MM, et al. (2007)
Transcripts targeted by the microRNA-16 family cooperatively regulate cell
cycle progression. Mol Cell Biol 27(6): 2240–2252.
43. Wang X, Wang X (2006) Systematic identification of microRNA functions by
combining target prediction and expression profiling. Nucleic Acids Res 34(5):
1646–1652.
44. Jha A, Mehra M, Shankar R (2011) The Regulatory Epicenter of microRNAs.
J Biosci 36(4): 621–638.
45. Keene JD (2007) RNA regulons: coordination of post-transcriptional events. Nat
Rev Genet 8: 533–543.
46. Jima DD, Zhang J, Jacobs C, Richards KL, Dunphy CH, et al. (2010) Deep
sequencing of the small RNA transcriptome of normal and malignant human B
cells identifies hundreds of novel microRNAs. Blood 116(23): e118–127.
47. Soler E, Thepot D, Rival-Gervier S, Jolivet G, Houdebine LM (2006)
Preparation of recombinant proteins in milk to improve human and animal
health. Reprod Nutr Dev 46(5): 579–588.
48. Niemann H, Kues WA (2003) Application of transgenesis in livestock for
agriculture and biomedicine. Anim Reprod Sci 79(3–4): 291–317.
49. Zimin AV, Delcher AL, Florea L, Kelley DR, Schatz MC, et al. (2009) A whole-
genome assembly of the domestic cow, Bos taurus. Genome Biol 10(4): R42.
Pre-miRNA Identification with miR-BAG
PLOS ONE | www.plosone.org 15 September 2012 | Volume 7 | Issue 9 | e45782