The miR-379/miR-410 cluster at the imprinted Dlk1-Dio3 domain controls neonatal metabolic adaptation
15
Article The miR-379/miR-410 cluster at the imprinted Dlk1-Dio3 domain controls neonatal metabolic adaptation Stéphane Labialle 1,2,† , Virginie Marty 1,2,† , Marie-Line Bortolin-Cavaillé 1,2 , Magali Hoareau-Osman 1,2 , Jean-Philippe Pradère 3,4 , Philippe Valet 3,4 , Pascal GP Martin 1,2,5,6 & Jérôme Cavaillé 1,2,* Abstract In mammals, birth entails complex metabolic adjustments essential for neonatal survival. Using a mouse knockout model, we identify crucial biological roles for the miR-379/miR-410 cluster within the imprinted Dlk1-Dio3 region during this metabolic transition. The miR-379/miR-410 locus, also named C14MC in humans, is the largest known placental mammal-specific miRNA cluster, whose 39 miRNA genes are expressed only from the maternal allele. We found that heterozygote pups with a maternal—but not paternal—deletion of the miRNA cluster display partially penetrant neonatal lethality with defects in the maintenance of energy homeostasis. This maladaptive metabolic response is caused, at least in part, by profound changes in the activation of the neonatal hepatic gene expression program, pointing to as yet unidentified regulatory pathways that govern this crucial metabolic transition in the newborn’s liver. Not only does our study highlight the physiological importance of miRNA genes that recently evolved in placental mammal lineages but it also unveils additional layers of RNA-mediated gene regulation at the Dlk1-Dio3 domain that impose parent-of-origin effects on metabolic control at birth and have likely contributed to mammal evolution. Keywords epigenetic; genomic imprinting; metabolic adaptation; microRNA; mouse model Subject Categories Development & Differentiation; Metabolism; RNA Biology DOI 10.15252/embj.201387038 | Received 30 September 2013 | Revised 2 July 2014 | Accepted 7 July 2014 Introduction MicroRNAs (miRNAs) are endogenously expressed, ~19–23 nt-long non-coding RNAs (ncRNA) that silence gene expression at the post-transcriptional level, mostly via imperfect base-pairing interac- tions that occur preferentially within the 3 0 untranslated regions (UTRs) of target mRNAs (Fabian & Sonenberg, 2012). Through their ability to target hundreds, perhaps even thousands of mRNAs, miRNAs are now considered as potent post-transcriptional regula- tors in an ever-growing list of developmental, physiological, or path- ological contexts (Bushati & Cohen, 2007). Most conclusions drawn so far for mammalian miRNAs rely on computational mRNA target predictions coupled to gain- or loss-of-function approaches conducted mostly in vitro using cellular models. Although informa- tive, these approaches do not undisputedly demonstrate the physio- logical significance of miRNAs. In that context, most miRNA knockout (KO) mice described so far do not exhibit overt abnormali- ties under classical mouse husbandry conditions, although defects can become apparent in physiologically challenging contexts (Leung & Sharp, 2010; Mendell & Olson, 2012). Accordingly, we still need to determine precisely, at the whole-organism level, the extent to which defects in miRNA-mediated regulation yield clear and inter- pretable phenotypic consequences (Park et al, 2010, 2012). In mammals, a subset of poorly conserved miRNA genes is subjected to genomic imprinting, a developmentally regulated form of epigenetic regulation that causes mono-allelic expression in a parent-of-origin dependent manner. That is, for a given gene, only one of the two parental alleles is transcriptionally competent (Barlow & Bartolomei, 2014). Most imprinted miRNA genes identi- fied so far are organized as large (~40–100 kb) non-protein-coding transcriptional arrays that generate a large number (~50–100) of RNA species of related sequences. These clustered, tandemly repeated miRNAs likely arose through segmental duplication followed by sequence diversification and are presumably co- expressed as, and processed from, a single (or a few) long primary non-coding transcript(s). Remarkably, this unusual mode of geno- mic organization and epigenetic regulation appears specific to imprinted loci (Labialle & Cavaille, 2011) and has been reported at 1 Laboratoire de Biologie Moléculaire Eucaryote, UPS, Université de Toulouse, Toulouse, France 2 CNRS, LBME, UMR5099, Toulouse, France 3 Institut National de la Santé et de la Recherche Médicale (INSERM), U1048, Toulouse, France 4 Institut des Maladies Métaboliques et Cardiovasculaires (I2MC), Université de Toulouse, Université Paul Sabatier, Toulouse, France 5 INRA, UMR1331, TOXALIM (Research Centre in Food Toxicology), Toulouse, France 6 Université de Toulouse, INP, UPS, TOXALIM, Toulouse, France *Corresponding author. Tel: +33 561335934; Fax: +33 561335886; E-mail: [email protected] † These authors contributed equally to this work ª 2014 The Authors The EMBO Journal 1
Transcript of The miR-379/miR-410 cluster at the imprinted Dlk1-Dio3 domain controls neonatal metabolic adaptation

Article
The miR-379/miR-410 cluster at the imprintedDlk1-Dio3 domain controls neonatalmetabolic adaptationStéphane Labialle1,2,†, Virginie Marty1,2,†, Marie-Line Bortolin-Cavaillé1,2, Magali Hoareau-Osman1,2,
Jean-Philippe Pradère3,4, Philippe Valet3,4, Pascal GP Martin1,2,5,6 & Jérôme Cavaillé1,2,*
Abstract
In mammals, birth entails complex metabolic adjustments essentialfor neonatal survival. Using a mouse knockout model, we identifycrucial biological roles for the miR-379/miR-410 cluster within theimprinted Dlk1-Dio3 region during this metabolic transition. ThemiR-379/miR-410 locus, also named C14MC in humans, is the largestknown placental mammal-specific miRNA cluster, whose 39 miRNAgenes are expressed only from the maternal allele. We found thatheterozygote pups with a maternal—but not paternal—deletion ofthe miRNA cluster display partially penetrant neonatal lethality withdefects in the maintenance of energy homeostasis. This maladaptivemetabolic response is caused, at least in part, by profound changesin the activation of the neonatal hepatic gene expression program,pointing to as yet unidentified regulatory pathways that govern thiscrucial metabolic transition in the newborn’s liver. Not only doesour study highlight the physiological importance of miRNA genesthat recently evolved in placental mammal lineages but it alsounveils additional layers of RNA-mediated gene regulation at theDlk1-Dio3 domain that impose parent-of-origin effects on metaboliccontrol at birth and have likely contributed to mammal evolution.
Keywords epigenetic; genomic imprinting; metabolic adaptation; microRNA;
mouse model
Subject Categories Development & Differentiation; Metabolism; RNA Biology
DOI 10.15252/embj.201387038 | Received 30 September 2013 | Revised 2 July
2014 | Accepted 7 July 2014
Introduction
MicroRNAs (miRNAs) are endogenously expressed, ~19–23 nt-long
non-coding RNAs (ncRNA) that silence gene expression at the
post-transcriptional level, mostly via imperfect base-pairing interac-
tions that occur preferentially within the 30 untranslated regions
(UTRs) of target mRNAs (Fabian & Sonenberg, 2012). Through their
ability to target hundreds, perhaps even thousands of mRNAs,
miRNAs are now considered as potent post-transcriptional regula-
tors in an ever-growing list of developmental, physiological, or path-
ological contexts (Bushati & Cohen, 2007). Most conclusions drawn
so far for mammalian miRNAs rely on computational mRNA target
predictions coupled to gain- or loss-of-function approaches
conducted mostly in vitro using cellular models. Although informa-
tive, these approaches do not undisputedly demonstrate the physio-
logical significance of miRNAs. In that context, most miRNA
knockout (KO) mice described so far do not exhibit overt abnormali-
ties under classical mouse husbandry conditions, although defects
can become apparent in physiologically challenging contexts (Leung
& Sharp, 2010; Mendell & Olson, 2012). Accordingly, we still need
to determine precisely, at the whole-organism level, the extent to
which defects in miRNA-mediated regulation yield clear and inter-
pretable phenotypic consequences (Park et al, 2010, 2012).
In mammals, a subset of poorly conserved miRNA genes is
subjected to genomic imprinting, a developmentally regulated form
of epigenetic regulation that causes mono-allelic expression in a
parent-of-origin dependent manner. That is, for a given gene, only
one of the two parental alleles is transcriptionally competent
(Barlow & Bartolomei, 2014). Most imprinted miRNA genes identi-
fied so far are organized as large (~40–100 kb) non-protein-coding
transcriptional arrays that generate a large number (~50–100) of
RNA species of related sequences. These clustered, tandemly
repeated miRNAs likely arose through segmental duplication
followed by sequence diversification and are presumably co-
expressed as, and processed from, a single (or a few) long primary
non-coding transcript(s). Remarkably, this unusual mode of geno-
mic organization and epigenetic regulation appears specific to
imprinted loci (Labialle & Cavaille, 2011) and has been reported at
1 Laboratoire de Biologie Moléculaire Eucaryote, UPS, Université de Toulouse, Toulouse, France2 CNRS, LBME, UMR5099, Toulouse, France3 Institut National de la Santé et de la Recherche Médicale (INSERM), U1048, Toulouse, France4 Institut des Maladies Métaboliques et Cardiovasculaires (I2MC), Université de Toulouse, Université Paul Sabatier, Toulouse, France5 INRA, UMR1331, TOXALIM (Research Centre in Food Toxicology), Toulouse, France6 Université de Toulouse, INP, UPS, TOXALIM, Toulouse, France
*Corresponding author. Tel: +33 561335934; Fax: +33 561335886; E-mail: [email protected]†These authors contributed equally to this work
ª 2014 The Authors The EMBO Journal 1

three evolutionarily distinct chromosomal regions: the eutherian-
specific Dlk1-Dio3 domain (Seitz et al, 2003), the primate-specific
C19MC region (Noguer-Dance et al, 2010), and the rodent-specific
Sfmbt2 cluster (Wang et al, 2011).
The ~1-Mbp eutherian-specific imprinted Dlk1-Dio3 chromo-
somal region on distal mouse chromosome 12 (orthologous to
human chromosome 14q32) expresses three paternally expressed
protein-coding genes (Dlk1, Rtl1, and Dio3) and several maternally
expressed non-protein-coding transcripts, including Gtl2 as well as
numerous box C/D small nucleolar (sno) RNAs and miRNAs (da
Rocha et al, 2008) (Fig 1A). Many of these small RNAs are embed-
ded within, and processed from, introns of poorly characterized long
ncRNAs: In the mouse, many snoRNAs and miRNAs are intron-
encoded within transcripts called Rian and Mirg, respectively. Most
miRNA genes are grouped into two main regions, the miR-127/
miR-136 cluster originating from an anti-Rtl1 transcript and the
1st targeting vector (110,926,959 -110,933,674)
2nd targeting vector (110,985,664 -110,993,205)
59.1 kb
P2
P1 P3
(3.6 kb) (3.1 kb) (4 kb) (3.5 kb)
Two independent homologous recombination events + in vivo Cre-mediated excision
Paternal inheritance
Maternal inheritance
M
400300200
100
WT Pat WT Mat
0.426 kb
0.288 kb~ 60 kb
P1
P1
P2
P3P1
P3
(KO allele)
(WT allele)P
05
1015202530
Mirg
exp
ress
ion
brain
heartkid
neyliver
lungspl
eenmusc
le
intest
ine WATov
aryskin
testis
uterus
brainhear
tkidney
liver
lungsplee
nmuscl
eintes
tine
WATovary
skin testis
uterus
brain
A
Mirg
Dlk1 Rtl1 Dio3
Gtl2 miR-127/miR-136 (anti-Rtl1)
C/D snoRNAs (Rian)
miR-379/miR-410 (Mirg)
MBII-48 MBII-78
Ig-DMRPat
Mat
B
C The miR-379/miR-410 cluster
miR-379/miR-410
let-7
Neo Hygro
Figure 1. Targeted deletion of the miR-379/miR-410 cluster at the imprinted Dlk1-Dio3 domain.
A Schematic representation of the ~1-Mbp imprinted Dlk1-Dio3 region on mouse distal chromosome 12. Paternally expressed protein-coding genes (Dlk1, Rtl1, and Dio3)are symbolized by blue rectangles, while maternally expressed miRNA and C/D snoRNA genes are depicted by pink stem loops and ovals, respectively. Gtl2 (pinkrectangle) is a long, maternally expressed non-coding RNA (ncRNA) gene. Anti-Rtl1, Rian, and Mirg correspond to poorly characterized maternally expressed ncRNAsfrom which some, but not all, miRNAs and C/D snoRNAs are processed. It should be noted, however, that some deposited RNA sequences may simply represent RNAspecies whose functionality, if any, remains questionable (Chiang et al, 2010). Arrows indicate the sense of transcription, with the horizontal broken line highlightingthe notion that Gtl2, anti-Rtl1, Rian, and Mirg may belong to the same transcription unit. Differentially methylated regions, including the imprinting center (Ig-DMR)that controls imprinted expression over the domain, are indicated by filled and open lollipops (methylated and un-methylated, respectively). The relative positions ofhairpin-like (pre-miRNA) structures within the miR-379/miR-410 cluster are indicated in the enlarged inset. Note that most pre-miRNA genes at the 30 end of thecluster are positioned within introns of Mirg (gray rectangles and dotted lines represent exons and splicing events, respectively).
B Top: The tissue-specific expression pattern of miRNAs was assayed by Northern blot analysis of adult mouse tissues as indicated on the panel, using a mixture of 32P-labelled oligonucleotides antisense to some miRNAs scattered along the cluster (miR-411, 323, 376b, 376a, 134, 154, and 410). The same membrane was probed with alet-7 oligo probe (gel loading control). Bottom: The tissue-specific expression pattern of Mirg host gene transcripts was assayed by RT–qPCR relative to Gapdh usingthe same set of tissues. Note that Mirg expression, but not that of miRNAs, is detected in testes, indicating that post-transcriptional regulation may occur in thistissue. WAT: white adipose tissue. Data are expressed as mean � s.e.m.
C Cre/loxP-mediated site-specific deletion of the miR-379/miR-410 cluster. Left: Targeting strategy for disrupting the miR-379/miR-410 cluster through two independenthomologous recombination events. Genome coordinates: UCSC Genome Browser, mouse, NCB137/mm9. Red and brown arrows indicate loxP and FRT recognition sitesfor the Cre and Flp site-specific recombinases, respectively. Right: PCR confirmation of the deletion using appropriate P1, P2, and P3 primers. The sequence of thedeleted region was further confirmed by DNA sequencing. DMat and DPat represent heterozygous individuals with maternally and paternally inherited deletions,respectively, while WT correspond to wild-type littermate controls. M: DNA ladder (bp).
Source data are available online for this figure.
The EMBO Journal ª 2014 The Authors
The EMBO Journal Imprinted miRNAs and metabolic control at birth Stéphane Labialle et al
2

miR-379/miR-410 cluster (also referred to as C14MC in human). A
few more are found scattered along the Dlk1-Dio3 region. The miR-
127/miR-136 cluster silences the paternally expressed Rtl1 mRNAs
through siRNA-like mechanisms (Seitz et al, 2003; Davis et al,
2005), and this trans-allelic RNAi-mediated regulation plays critical
roles in placental development (Sekita et al, 2008). Although numer-
ous functions for the miR-379/miR-410 cluster have been inferred
from aberrant expression in pathological contexts or from enforced
or knockdown expression experiments performed in vitro (Labialle
& Cavaille, 2011; Benetatos et al, 2012; Girardot et al, 2012), the
biological importance of this large miRNA cluster remains elusive.
Of note, several studies have pointed out regulatory roles in neuro-
nal functions, especially for miR-134 (Schratt et al, 2006; Fiore et al,
2009; Christensen et al, 2010; Gao et al, 2010; Jimenez-Mateos et al,
2012; Bicker et al, 2013; Rago et al, 2014). A correct dosage of
imprinted genes encoded at the mouse Dlk1-Dio3 genomic interval
is essential for embryonic growth and postnatal survival, as well as
for muscle, skeletal, placental, and neuronal development (da Rocha
et al, 2008). The functional significance of the corresponding
imprinted human genes at 14q32 is supported by human syndromes
of respiratory insufficiency, altered thoracic development, mental
retardation, obesity, growth retardation, and precocious puberty
(Kagami et al, 2008). The Dlk1-Dio3 genomic interval has also been
linked genetically to diabetes (Wallace et al, 2010; Kameswaran
et al, 2014). Whether the miR-379/miR-410 (C14MC) cluster
contributes to one (or several) of these physiological processes or
pathological contexts remains an open question.
Newly available epigenetically regulated arrays of miRNA genes
raise intriguing questions regarding the evolutionarily meaning of
their repeated structures in relation to their mono-allelic expression
patterns and the potential redundancy or divergence in the functions
of related miRNA genes within a given cluster (Labialle et al, 2011).
Studying these imprinted arrays of miRNA genes therefore provides
unique opportunities to address the physiological roles of lineage-
specific miRNAs, but also to evaluate how a large number of coordi-
nately expressed miRNAs can impact gene regulatory networks. To
elucidate the biological roles of the large miR-379/miR-410 cluster
at the Dlk1-Dio3 domain, we have used a constitutive mouse KO
model. Unexpectedly, a subset of miR-379/miR-410-deficient
neonates failed to maintain energy homeostasis and die shortly after
birth. These neonatal metabolic deficiencies—affecting both lipid
and glucose metabolism—are very likely caused, at least in part, by
defects in the temporal activation of a large set of metabolic genes
in the newborn’s liver. This is, to the best of our knowledge, the
first demonstration that miRNAs exert critical functions at the tran-
sition from fetal to postnatal life in mammals.
Results
Targeted disruption of the miR-379/miR-410 cluster
The imprinted Dlk1-Dio3 domain contains the largest eutherian-
specific miRNA cluster: The miR-379/miR-410 cluster (Fig 1A),
named C14MC in humans, believed to produce 77 and 63 mature
miRNAs in the mouse and humans, respectively (http://www.
mirbase.org/). In the adult mouse, miR-379/miR-410 expression is
mostly restricted to the brain (Fig 1B). In contrast, during
development and also at birth, these miRNAs are widely expressed in
many non-brain tissues (Fig 2A–C, and Supplementary Fig S4). To
assess the biological functions of miR-379/miR-410 in vivo, we created
a constitutive KO mouse model carrying a Cre/loxP-mediated ~59-kb-
long deletion (Fig 1C) that removes the entire miRNA cluster (denoted
as DmiR).
The miR-379/miR-410 cluster is regulated by genomic imprinting;
only the maternally inherited allele is competent for transcription
(Seitz et al, 2003). Accordingly, we analyzed DmiR mice generated
by two types of crosses: (i) wild-type females with heterozygous
males (paternal inheritance of the targeted deletion) and (ii) wild-
type males with heterozygous females (maternal inheritance of the
targeted deletion). These two reciprocal crosses are expected to
generate 50% wild-type and 50% heterozygous animals. In principle,
only heterozygotes having inherited the deletion from their mother
(denoted as DMat) are deficient for miR-379/miR-410 expression. In
contrast, heterozygotes having inherited the deletion from their
father (denoted as DPat) express the miRNA cluster normally. We
therefore analyzed DMat and DPat animals since these two classes of
heterozygotes are genetically comparable, thus alleviating any poten-
tial confounding effects due to differences in genetic background.
Wild-type littermates (denoted as WT) were also used as controls.
We first validated our KO model by demonstrating that, as
expected, upon maternal but not paternal inheritance, the targeted
miRNA genes were no longer expressed in embryo (E18.5), placenta
(E18.5), and adult brain (Fig 2A). More sensitive RT–qPCR experi-
ments revealed very weak, but still detectable, expression for some
individual miRNAs (Fig 2C) or for the Mirg host gene in the embryo
(Fig 2D), indicating that leaky expression (~5%) can occur on the
normally silenced paternal allele in some tissues. More importantly,
the level of expression of the surrounding imprinted ncRNA and
protein-coding genes (Fig 2D), as well as their imprinted status
(Supplementary Fig S1), remained unaffected, making it very
unlikely that DmiR removes important regulatory elements that
govern imprinted expression over the Dlk1-Dio3 genomic interval.
Genetic ablation of the miR-379/miR-410 cluster leads topartially penetrant neonatal lethality
After extensive breeding in the C57BL/6J genetic background, we
found that, upon maternal but not paternal inheritance, ~39% of
DMat animals were missing at 3–4 weeks of age (Table 1). This
alteration in the Mendelian ratio was likewise observed in crosses
where the dams inherited the deletion paternally or maternally, thus
excluding any grand-parental effects (Table 2). DmiR does not lead
to embryonic lethality since DMat concepti reached late gestation
(E18.5) at the expected Mendelian frequencies (Table 1) without
any obvious alteration in overall growth of the embryos or placenta
(Supplementary Fig S2). DMat pups were born alive, but half of
them died within ~15–40 h post-delivery (Table 3). Maternal care
was normal as were the weights and overall appearance of major
neonatal organs we examined (Supplementary Fig S2). Once
neonates overcame the fetal-to-postnatal transition, survivors did
not exhibit any significant increase in lethality over at least
8 months. However, upon maternal, but not paternal, inheritance,
both males and females were transiently growth-retarded ~3 weeks
after birth, coinciding with the suckling–weaning transition (Supple-
mentary Fig S2).
ª 2014 The Authors The EMBO Journal
Stéphane Labialle et al Imprinted miRNAs and metabolic control at birth The EMBO Journal
3

Genetic ablation of the miR-379/miR-410 cluster results inimpaired neonatal glucose homeostasis
Neonatal death can result from a large spectrum of physiological
defects (Turgeon & Meloche, 2009). In the absence of any apparent
morphological defects and due to the timing of lethality, we
hypothesized that DMat neonates may have deficiencies in
maintaining energy homeostasis. Indeed, birth entails major meta-
bolic challenges as the energy supply provided mostly as glucose
by placental nutrition suddenly ceases. To combat this naturally
occurring starvation episode, neonates first degrade their hepatic
glycogen store constituted during late embryogenesis (glycogeno-
lysis) and then activate gluconeogenesis, which is not active in the
immediate postnatal period (Girard et al, 1992). As shown in
0
0,5
1
1,5
2
Dlk1 Gtl2 Rian Mirg Dio3
WT
0
0,5
1
1,5
2
Dio3MirgRianGtl2Dlk1
WT
0
0,5
1
1,5
2
Dlk1 Gtl2 Rian Mirg Dio3
WT
Paternal inheritance
Maternal inheritance
M WT PatmiR-379/miR-410MBII-48
MBII-78
miR-127
Paternal inheritance
Maternal inheritance
M
Paternal inheritance
Maternal inheritance
M
A
D
0
1
2
3
4
5
6
7
miR-379 miR-410miR-376
WTMat WTMat
brain
heart
lungliv
erintes
tin BATmuscl
eskin
miR
exp
ress
ion
at P
0 (R
T-qP
CR
)
WTMat WTMat WTMat WTMat WTMat WTMat
E18.5 tissues
brain liver small intestine lung skin
WT Mat WT Mat WT Mat WT Mat WT Mat
B
C
Expr
essio
n m
RNA
level
Expr
essio
n m
RNA
level
Expr
essio
n m
RNA
level
WT Pat WT Pat WT Mat WT Mat WT Mat
miR-379/miR-410
tRNA-Tyr
Embryo (E18.5)
Placenta (E18.5)
Brain (Adult)
Embryo (E18.5) Placenta (E18.5) Brain (Adult)
Figure 2. Targeted deletion of the miR-379/miR-410 cluster does not affect the expression levels of flanking genes.
A Expression of the miR-379/miR-410 cluster and its flanking C/D snoRNA (MBII-78, MBII-48) and miRNA (miR-127) genes was assayed by Northern blot analysis of theindicated samples (two individuals per genotype).
B Expression of the miR-379/miR-410 cluster was assayed by Northern blot analysis of the dissected tissues indicated above the panels from WT or DMat E18.5embryos. A tRNA-specific probe was used as the internal loading control.
C Expression of selected miRNAs (miR-379, miR-376a, and miR-410) was assayed by RT–qPCR relative to U6 snRNA in P0 tissues prepared from WT or DMat individuals(n = 3 per genotype), as indicated below the histograms. BAT: brown adipose tissue. Data are expressed as mean � s.e.m.
D Expression of mRNAs (Dlk1 and Dio3) and mRNA-like transcripts (Gtl2, Rian, Mirg) was assayed by RT–qPCR relative to Gapdh mRNA in the indicated tissues. Blue andpink bars represent expression levels in DPat and DMat individuals, respectively (six individuals per genotype). Expression levels of WT were arbitrarily set to 1.
Source data are available online for this figure.
The EMBO Journal ª 2014 The Authors
The EMBO Journal Imprinted miRNAs and metabolic control at birth Stéphane Labialle et al
4

Fig 3A, blood glucose levels at P0 were reduced by ~20% in DMat
neonates relative to WT littermates while, as expected, blood sugar
concentration in DPat neonates was in the normal range. Interest-
ingly, the distribution of glycemic status at P1 revealed that a
subset of DMat neonates displayed severe hypoglycemia (defined
here arbitrarily as glucose levels < 30 mg/dl) while glucose levels
in the remaining mutants were only slightly lower than those of
WT (Fig 3A and Supplementary Fig S3). A careful tracking showed
that mutant dead pups collected between P0 and P1 together with
profoundly hypoglycemic individuals at P1 account for 37.7% of
DMat individuals (n = 17 litters, Table 4). Given the neonatal
death observed around birth (Table 3) and the deficit of DMat indi-
viduals at weaning (Table 1), most of these severely hypoglycemic
mutants are unlikely to survive the perinatal period, thus implying
that hypoglycemia contributes to neonatal death. To challenge this
assumption, WT and DMat neonates were systematically given
subcutaneous glucose injections (50 ll, 10%) shortly after birth
and then 4–6 h later (n = 10 litters). In order to avoid any bias
due to the incomplete penetrance of the lethality, we only consid-
ered litters without any dead pups at the time of the first injec-
tions. As reported in Fig 3G, glucose injections rescued, at least in
part, the neonatal lethality phenotypes since 25/31 (80.6%)
glucose-injected mutants survived birth transition, with 24/25 still
alive after weaning. In comparison, the perinatal survival rate of
DMat without glucose injections was 42% (Table 3). We next
sought to further appreciate the contribution of deficiencies in
glucose homeostasis by studying pups kept separated from their
mother and maintained in a moist, warm (32–35°C) atmosphere.
This procedure alleviates confounding variables in that external
sources of glucose cannot be provided by mother’s milk. In a first
pilot experiment during which we monitored continuously the fate
of neonates, no DMat (0/10) neonates survived starvation over a
10-h period while 60% of WT (11/18) were still alive over the
same time course (n = 4 litters; Fig 3H, left). In a second set of
experiments, we asked whether glucose injections may extend the
lifespan of DMat pups in such challenging metabolic environment.
For each litter, half of the pups were injected subcutaneously with
glucose, immediately after birth and then every 6 h over a period
of 12 h. The remaining 50% of pups were injected with NaCl
(50 ll, 0.9%) and used as controls (n = 5 litters). As shown in
Fig 3H (right), lethality of DMat neonates could be delayed since
7/7 (100%) mutants and 5/7 (71%) WT pups injected with glucose
survived up to 17 h. In comparison, all NaCl-injected control indi-
viduals were dead 17 h post-injection. The survival of 6/7 NaCl-
injected DMat neonates at t + 10 h reflects probably the notion that
hydration of pups contributes to their survival when no access
to mother’s milk is allowed. Altogether, these glucose rescue
Table 1. Maternally, but not paternally inherited DmiR, leads to altered Mendelian ratios 4 weeks after birth but not before birth (E18.5).
C57BL/6J (N6–N12)
4-week-old mice E18.5 embryos
Maternal inheritance Paternal inheritance Maternal inheritance Paternal inheritance
Total individuals 753 656 65 54
Litter (n) 148 108 11 8
Sex
Males 378 306 n.d. n.d.
Females 375 350 n.d n.d.
Observed genotypes
WT 468 346 33 27
Heterozygotes 285 310 32 27
P-values 2.57e�11 0.16 0.9 1.0
Table 2. The altered Mendelian ratio 4 weeks after birth is notcaused by the lack of expression of the miR-379/miR-410 cluster in thedams.
Parental origin of DmiR in the dams
Paternal (miRNAexpression)
Maternal (no miRNAexpression)
Total individuals 472 281
Litter (n) 92 56
Sex
Males 247 131
Females 225 150
Observed genotypes
WT 298 170
DMat 174 111
P-values 1.14e�8 4.32e�4
Table 3. DMat neonates are born alive but die within 15–40 h afterbirth.
Neonates (P0–P3)
Maternal inheritance
Total individuals 93
Litter (n) 14
Time after birth 0–14 h 15–40 h 41–96 h
Observed genotypes
WT 39 (6) 36 (3) 36 (0)
DMat 43 (5) 22 (21) 20 (2)
P-values 0.76 0.0002 n.d.
Numbers in parentheses represent dead pups, and P-values estimate thesignificance of the unequal number of dead pups in each genotype by thev2 test.
ª 2014 The Authors The EMBO Journal
Stéphane Labialle et al Imprinted miRNAs and metabolic control at birth The EMBO Journal
5

experiments demonstrate that dysregulation of glycemia is a major
early event linked to the neonatal lethality.
Genetic ablation of miR-379/miR-410 cluster alters neonatalglycogenolysis and gluconeogenesis
Because mobilization of glycogen stores is one of the very first
metabolic adaptive events, we assessed hepatic glycogen levels.
As shown in Fig 3C, DMat neonates at P0 had 40–50% higher
Table 4. The neonatal fate of WT and DMat pups between P0 and P1
Maternal inheritance(n = 17 litters)
DMat (n = 69) WT (n = 61)
Dead pups (P0–P1) 17 6
Hypoglycemic pups (P1)(glycemic status < 30 mg/dl)
9 2
Dead + hypoglycemic pups (%) 37.7 13.1
E F
mR
NA
lev
el
00,20,40,60,8
11,21,41,61,8
Pck1
E19.5 E19.5+4 P0 P1 E19.5+1
*
*
*
*
cesarean delivery
00,5
11,5
22,5
33,5
G6pc
E19.5 E19.5+4 P0 P1 E19.5+1cesarean delivery
mR
NA
lev
el
*
G
0200400600800
100012001400
P0
high low
*
high low
020406080
100120140
P0
H
I
0
10
20
30
40
50
E19.5 E19.5+1 E19.5+4
Glu
cose
(mg/
dl)
***
cesarean delivery
0
20
40
60
80
100
120
Gly
coge
n (m
g/g)
E19.5 E19.5+4
***
cesarean delivery0
20
40
60
80
100
120
Gly
coge
n (m
g/g)
P0 P1
***
0
20
40
60
80
100
120
0 1 2 3 4 5 6 7 8 9 10time (hours)
D
+ NaCl + Glucose
0
20
40
60
80
100
1206/6
6/7
0/70/6 0
20
40
60
80
100
120
5/7
7/7
5/7
7/7
t+10 t+17 t+10 t+17
A B C
% o
f neo
nata
l sur
viva
l
% o
f neo
ntal
sur
viva
l
Glu
cose
(mg/
dl)
01020304050607080
P0 P1
*
****
********
0102030405060708090
100
% o
f neo
ntal
sur
viva
l
+ Glucose
0200400600800
1000120014001600
cesarean delivery E19.5 E19.5+4 P0
Insu
lin (p
g/m
l)
Glu
cago
n (p
g/m
l)
cesarean delivery
0
50
100
150
200
E19.5 E19.5+4 P0
Figure 3. Maternal, but not paternal, deletion of the miR-379/miR-410 cluster impairs hepatic glycogenolysis and gluconeogenesis.
A–F Serum glucose (A, B), hepatic glycogen (C, D), insulin (E), glucagon (F) levels in WT (black), DMat (pink), severely hypoglycemic DMat (dark pink) or DPat (blue)neonates were measured in vaginally delivered neonates (P0, P1) or after cesarean delivery (E19.5, E19.5 + 1, E19.5 + 4). Insulin and glucagon levels of DMatindividuals in the same cohort with the highest and lowest glucose concentration, denoted as high (50.78 � 1.42 mg/dl) and low (27.38 � 3.72 mg/dl), respectively,are also shown in the histograms to the right (E and F). Numbers of individuals analyzed are indicated above the histograms.
G Glucose injections rescue the neonatal lethality phenotype. Dotted lines represent the % of DMat neonatal survival as observed from dead pups collectedperinatally (Table 3).
H Left: The lifespan of DMat neonates (pink line) is reduced relative to WT (black line) when P0 neonates were kept separated from their mother. Right: Glucoseinjections extend the lifespan of DMat neonates. Histograms show the survival rate of NaCl- or glucose-injected pups at 10 and 17 h post-injection.
I The temporal expression of the gluconeogenic Pck1 and G6pc genes in liver (relative to Gapdh) was assayed by RT–qPCR (6 individuals per genotype).
Data information: Data are expressed as mean � s.e.m.
The EMBO Journal ª 2014 The Authors
The EMBO Journal Imprinted miRNAs and metabolic control at birth Stéphane Labialle et al
6

hepatic glycogen contents than their WT littermates whereas, as
expected, hepatic glycogen stores were in the normal range in
DPat neonates. Given that glycogen appeared to be normally
degraded in mutant neonates at P1 regardless of their glycemic
status, we conclude that DMat neonates degrade glycogen at
lower rates. To verify this hypothesis, serum glucose and hepatic
glycogen levels were measured in embryos delivered by cesarean
sections at embryonic day 19.5 (E19.5). Serum glucose levels and
glycogen were measured one and four hours after embryo harvest
(denoted hereafter as E19.5 + 1 and E19.5 + 4, respectively). As
shown in Fig 3B and D, DMat neonates at E19.5 had glucose and
glycogen levels similar to WT, excluding any deficiencies in
trans-placental transfer of glucose and/or exacerbated accumula-
tion of hepatic glycogen. As expected, both WT and DMat
neonates displayed lower levels of glucose at E19.5 + 1. However,
DMat neonates were deficient in glucose production since they
failed to reach blood glucose levels comparable to WT at
E19.5 + 4 (Fig 3B). Interestingly, over the same time course, they
did not degrade their hepatic glycogen efficiently (Fig 3D), thus
corroborating our previous conclusions drawn from vaginally
delivered pups: DMat neonates inefficiently mobilize their
glycogen stores.
That some DMat neonates at P1 are severely hypoglycemic
while their glycogen stores are fully exhausted also argues for
defects in the proper initiation of gluconeogenesis during the
immediate perinatal period. To confirm this assumption, we moni-
tored expression of two key glucogenic factors whose expression
is known to be transcriptionally activated at birth: phosphoenol-
pyruvate carboxykinase 1 (Pck1) and glucose-6-phosphatase
(G6pc). Consistent with an activation of gluconeogenic pathways
at birth, Pck1 and G6pc mRNA levels were dramatically
up-regulated in WT neonate livers between E19.5 and E19.5 + 4
(Fig 3I, top and bottom). However, the neonatal induction of Pck1
was found to be partially defective in DMat pups, while
expression of G6pc appeared normal, albeit slightly decreased, at
earlier time points, but without reaching statistical significance.
Remarkably, expression of both Pck1 and G6pc genes was
enhanced in profoundly hypoglycemic mutants at P1 compared
with WT mice, strongly suggesting that their response to perinatal
fasting is not impaired (Yubero et al, 2004).
Neonatal metabolic adaptations are orchestrated by changes in
hormonal profiles, notably the decrease in the insulin/glucagon
ratio that provokes glucose output by triggering hepatic glycogeno-
lysis and transcriptional activation of key metabolic genes (Girard
et al, 1992). As shown in Fig 3E, insulin levels at E19.5 + 4 dropped
to the same range in both DMat and WT neonates relative to E19.5.
Over the same time course, glucagon levels did not change signifi-
cantly (Fig 3F), resulting in the decrease of insulin/glucagon ratios
in both WT and DMat neonates. In addition, when P0 DMat
neonates were arbitrarily split into two groups according to their
glycemia, individuals with lower glucose concentration had
decreased insulin contents (Fig 3E, right histogram). Glucagon
levels were in the same range (Fig 3F, right histogram). Although
we cannot formally rule out the possibility that the glucagon and/or
insulin signaling cascades are impaired in DMat newborn’s livers,
these data argue for a normal pancreatic hormonal release,
excluding hyperinsulinemia as a plausible cause for the neonatal
hypoglycemia.
Genetic ablation of the miR-379/miR-410 cluster alters ketonelevels in profoundly hypoglycemic mutants
The suckling period brings profound changes in nutrition since
mother’s milk consists of a high-fat diet. To face this sudden
increase in the availability of fatty acids, neonates activate lipid
oxidation pathways, mainly in the liver where fatty acids are also
used as precursors for the synthesis of ketone bodies—acetoacetate,
b-hydroxybutyrate and acetone—used as alternative fuel for main-
taining adequate energy supplies for vital organs such as the brain
(Girard et al, 1992). We next assessed ketone production (ketogene-
sis) by measuring b-hydroxybutyrate levels. As shown in Fig 4A,
b-hydroxybutyrate levels in DMat neonates at P0 were in the normal
range compared to WT, whereas, at P1, the most severely hypo-
glycemic mutants displayed lower levels. This decrease in b-hydroxy-butyrate levels was observed without any apparent change in the
availability of seric free fatty acids (Fig 4B) whereas triglyceride
levels at P1 were significantly diminished (Fig 4C). Moreover, no
significant changes in lipid contents were observed in mutant
newborn livers at P1 (Fig 4D–G).
We next checked the expression of the carnitine palmitoyl trans-
ferase (Cpt1a) and 3-methylglutaryl-CoA synthase 2 (Hmgcs2) genes
that control the entry of long-chain fatty acids into mitochondria
and catalyze the first and rate-limiting step in ketogenesis, respec-
tively. Expression of Cpt1a and Hmgcs2 was diminished in DMat
neonates at P1 regardless of their hypoglycemic status (Fig 4I),
suggesting that DMat neonates do not properly activate ketogenesis
pathways. Complete hepatic palmitate beta-oxidation activity
measured in DMat pups at P0, as judged by the release of CO2
(Fig 4J), was in the normal range as compared to WT. Of note,
DMat mutants with severe hypoglycemia at P1 had lower milk
content in their stomach (Fig 4H). Altogether, these results suggest
that a reduction in milk suckling and in subsequent fatty acid
supply, associated with defects in the expression of Cpt1a and
Hmgcs2, likely underlie the low concentration of circulating ketone
bodies. Alternatively, a decrease in ketone levels could also reflect
an increase in their utilization by peripheral tissues, perhaps as a
compensatory mechanism in the context of hypoglycemia.
Genetic ablation of the miR-379/miR-410 cluster affects theactivation of neonatal hepatic gene expression
The hepatic expression profile of the miR-379/miR-410 cluster is
relatively constant at the fetal–neonatal transition, yet it declines
thereafter with very low, if any, expression from P28 (Supplemen-
tary Fig S4). To identify disrupted gene regulatory pathways that
may contribute to deficiencies in maintaining neonatal energy
homeostasis, we carried out mRNA gene expression profiling on
WT and DMat livers dissected at E19.5, E19.5 + 4, and P0 (Supple-
mentary Figs S5 and S6). The impact of DmiR on the transcriptome
was relatively modest at E19.5 and E19.5 + 4, with only 13 and
139 mis-regulated genes, respectively, making it very unlikely that
the miR-379/miR-410 cluster contributes significantly to the prena-
tal hepatic differentiation program. This is in stark contrast to P0,
when important changes in gene expression were observed for as
many as 1,836 mis-expressed transcripts: Of those, five genes,
Cyp2e1, Acnat2, Ces3b, Hsd17b6, and as expected Mirg, were
deregulated at all tested stages (Fig 5A, top). A list of the top 30
ª 2014 The Authors The EMBO Journal
Stéphane Labialle et al Imprinted miRNAs and metabolic control at birth The EMBO Journal
7

up- and down-regulated protein-coding genes at P0 is given in
Fig 5A (bottom). Note that DmiR does not impact on the perinatal
expression of the surrounding imprinted genes (Supplementary
Fig S4). We conclude from these results that major gene deregula-
tion occurs in DMat livers at the developmentally regulated birth
transition.
In agreement with these microarray data, mRNA expression
levels of some selected genes were significantly reduced (Fig 5B,
left) or increased (Fig 5B, right) at P0 in neonatal DMat liver
compared to WT littermates. Their expression in DPat neonatal
livers remained mostly unaffected. Results of our analysis for the
enrichment of Gene Ontology (GO) Biological Processes and Kyoto
E19.5 P0 P10
0,2
0,4
0,6
0,8
1
1,2
1,4
6 6
11
8 β-
hydr
oxyb
utyr
ate
(mM
)
0
0,5
1
1,5
2
2,5
P0 P1
31 27
11 10
Trig
lyce
rides
(m
M)
7*
A B C
H
D E F
0
0,2
0,4
0,6
0,8
1
1,2
1,4
1,6
1,8
P0 P1
13 7FF
A (m
M)
14 12(0.050)
9*
Neu
tral l
ipid
s
(
nmol
/mg
liver
)
0
5
10
15
20
25
30
35
40 15 12
9
Tr
igly
cerid
es (n
mol
/mg
liver
)
0
5
10
15
20
25
30
15
9
C
hole
ster
ol(n
mol
/mg
liver
)
0123456789
15
12 9
E
ster
ified
cho
lest
erol
(nm
ol/m
g liv
er)
0
1
2
3
4
5
6
715
12
9
20 206
11
8
P1 P1 P1 P1
mR
NA
leve
l
0
0,5
1
1,5
2
2,5
00,20,40,60,8
11,21,41,61,8
E19.5 E19.5+4 P0 P1 E19.5 E19.5+4 P0 P1
Cpt1a Hmgcs2
*
**
* *
I J
0
0,2
0,4
0,6
0,8
1
1,2
1,4
1,6
Acc
umul
atio
n of
CO
2
P0
9
15
12
0
5
10
15
20
25
30
P0 P1
7
12
9
***
912
S
tom
ach+
milk
(m
g)
*
G
Figure 4. Maternal, but not paternal, deletion of the miR-379/miR-410 cluster impairs hepatic ketogenesis.
A–H Serum b-hydroxybutyrate (A), serum fatty acids (B), serum triglycerides (C), hepatic neutral lipids (D), hepatic triglycerides (E), hepatic cholesterol (F), hepaticesterified cholesterol (G), and stomach milk (H) levels were measured in WT (black), DMat (pink), severely hypoglycemic DMat (dark pink), or DPat (blue) individualsat E19.5 after cesarean delivery or P0 and P1 after vaginal delivery.
I Temporal expression of the ketogenic Cpt1a and Hmgcs2 genes was assayed in the liver (relative to Gapdh) by RT–qPCR (6 individuals per genotype).J The complete hepatic beta-oxidation of 14C-labelled palmitate at P0 was determined by the release of 14C-labelled CO2. Beta-oxidation activities for WT were set
to 1.
Data information: Data are expressed as mean � s.e.m.
The EMBO Journal ª 2014 The Authors
The EMBO Journal Imprinted miRNAs and metabolic control at birth Stéphane Labialle et al
8

Encyclopedia of Genes and Genomes (KEGG) pathways showed that
down-regulated genes are enriched for genes involved in metabolic
processes, notably lipid metabolism (Supplementary Fig S7; see GO
terms ‘cellular ketone metabolic process’, ‘lipid metabolism’, ‘fatty
acid metabolic process’, and KEGG pathways for ‘fatty acid metabo-
lism’, ‘peroxisome’, ‘PPAR signaling’, ‘bile secretion’, ‘metabolism
of xenobiotics by cytochrome P450’). Enrichment of functional cate-
gories among the up-regulated genes was less apparent. Among
down-regulated genes, Fibroblast growth factor 21 (Fgf21) has
recently emerged as a potent endocrine regulator of lipid metabo-
lism, notably in response to a ketogenic diet (Potthoff et al, 2012). It
also contributes to neonatal metabolic adaptation by controlling
thermogenic activation (Hondares et al, 2010). Nr0b2/SHP is an
orphan nuclear receptor that lacks a DNA-binding domain and plays
pleiotropic transcriptional regulatory roles in numerous biological
functions, notably in cholesterol, bile acid, and fatty acid metabo-
lism (Zhang et al, 2011). Cyp2e1, a member of the cytochrome P450
superfamily, catalyzes many reactions involved in drug metabolism,
including that of ethanol, as well as in the synthesis of steroids,
cholesterol, and other lipids (Cederbaum, 2010). Of note, Cyp2e1 is
also involved in ketone metabolism and participates in an alterna-
tive gluconeogenesis pathway (Gonzalez, 2007).
Importantly, we noticed that ~75% of the most significant mis-
expressed genes at P0 (fold-change > 1.7; 410/547) correspond to
down-regulated genes in DMat neonates. This also holds true at
E19.5 + 4, when this proportion reaches 90% (56/62). Moreover,
hierarchical clustering (Fig 5C) identifies two major clusters that
correspond to genes with increased (group 1) or decreased (group 2)
expression in mutant vs WT livers at P0. Within each cluster, sub-
clusters can be defined according to different temporal patterns of
changes in gene expression between E19.5 and P0: Sub-cluster A
corresponds to genes that exhibit major changes in expression in
DMat but not in WT mice between E19.5 and P0 (up-regulation for
cluster 1A and down-regulation for cluster 2A). Conversely, sub-
cluster B corresponds to genes with major changes in expression
between E19.5 and P0 in WT (up-regulation for cluster 1B and
down-regulation for cluster 2B), but not in DMat livers. Defects in
the temporal expression of some down-regulated genes belonging to
clusters 2A or 2B were further assayed by RT–qPCR. As reported in
Figure 5D, expression of Fgf21, Cyp2e1, Nr0b2, Dio1, Bdh1, Igf1,
and Slc17a2 was up-regulated at P0 in WT livers, whereas the
timing and/or magnitude of their up-regulation were significantly
affected in DMat livers.
Those data are consistent with a model according to which DmiR
causes a delayed transition in the activation of hepatic gene expres-
sion. Indeed, when mRNA profiling experiments were performed at
P1 by selecting DMat pups with mild and severe hypoglycemia, the
overall impact of DmiR was less pronounced than that reported at
P0 (Supplementary Figs S8 and S9). This reinforces the important
notion that the major impact of DmiR in the liver occurs precisely in
the narrow temporal window coinciding with birth transition. In
light of the partial penetrance of the metabolic phenotype, it is of
interest that hepatic transcriptome defects of DMat mutants with
mild hypoglycemia were largely resolved at P1 while profoundly
hypoglycemic mutants exhibited sustained alterations in gene
expression. Taken together, these unbiased genome-wide studies
uncover a liver-specific, miRNA-controlled gene expression program
whose sustained perturbation is very likely to underlie the metabolic
deficiencies and lethality observed in a subset of DMat neonates.
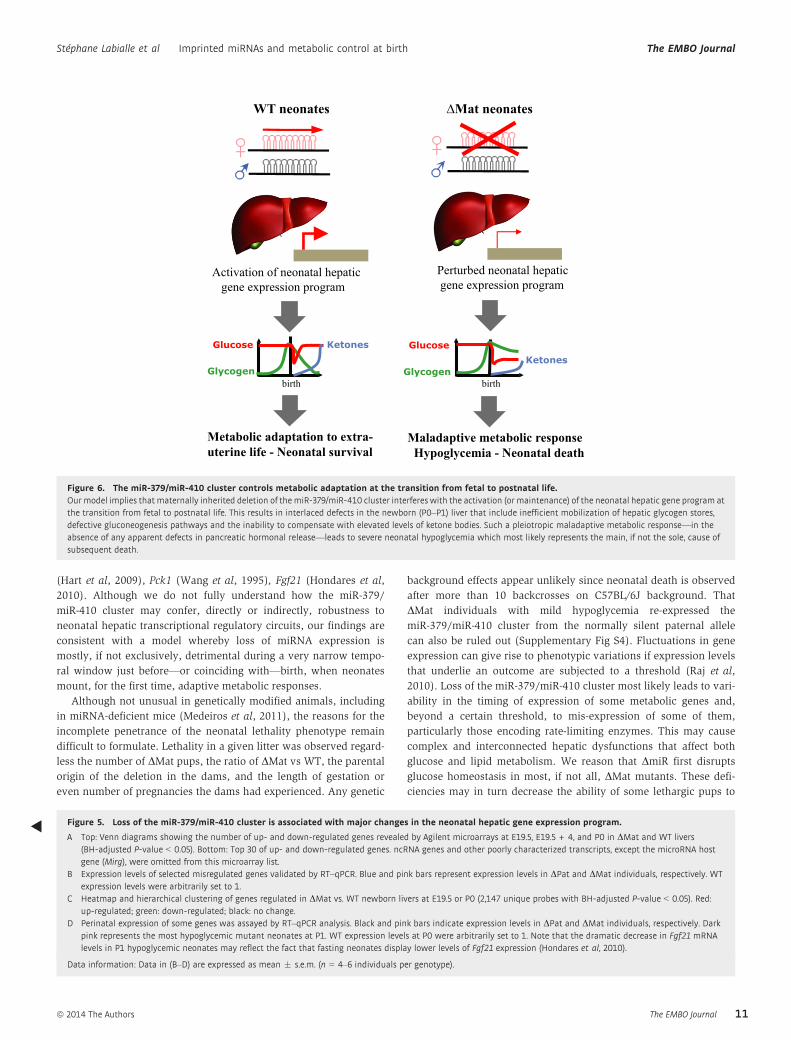
Accordingly, the miR-379/miR-410 cluster emerges as a potent
candidate regulator of the neonatal hepatic gene expression program
(Fig 6).
Discussion
Results of our study demonstrate, at the whole-organism level, that
the maternally expressed miR-379/miR-410 cluster plays essential
roles in neonatal survival. They provide, to the best of our knowl-
edge, the first demonstration that miRNAs can be implicated in the
balance of adaptive metabolic changes that occur at the transition
from prenatal to postnatal life: Newly born pups have to combat
neonatal hypoglycemia and must rapidly switch from the use of
glucose to that of lipids provided by mother’s milk (Girard et al,
1992). This illustrates another outstanding example of miRNAs as
part of regulatory systems that shape important developmental tran-
sitions, as already shown in C. elegans (Ambros, 2011), zebrafish
(Giraldez, 2010), and plants (Poethig, 2009). Our work also lends
further experimental support to the emerging notion that defects in
mammalian miRNA-mediated regulation yield phenotypic conse-
quences mostly under conditions of physiological, metabolic, and/
or environmental changes (Leung & Sharp, 2010; Mendell & Olson,
2012).
Genetic ablation of the miR-379/miR-410 cluster does not lead to
overt developmental abnormalities, ruling out any major contribu-
tion to embryonic lethality or even to reprogramming defects of
induced pluripotent stem cells, as previously observed in several
mouse models where all maternally expressed non-coding RNA
genes at the Dlk1-Dio3 region were silenced (Lin et al, 2003; da
Rocha et al, 2008; Liu et al, 2010; Stadtfeld et al, 2010). Impor-
tantly, nearly half of DMat neonates do not overcome the critical
immediate perinatal period because of severe metabolic abnormalities.
Appropriate dosage of the Dlk1 and Dio3 genes is also crucial for
metabolic and environmental adaptation when mice reach indepen-
dent feeding and temperature control (Charalambous et al, 2012).
Strikingly, DMat pups also display transient postnatal growth retarda-
tion. This coincides with the weaning transition, possibly reflecting a
role for the miR-379/miR-410 cluster in related physiological path-
ways that implicate its neighboring Dlk1 and Dio3 paternally
expressed protein-coding genes. Taken together, these findings
support the view that imprinted genes in general, and the Dlk1-Dio3
domain in particular, exert important postnatal metabolic functions,
in addition to their known roles in mammalian development
(Constancia et al, 2004; Charalambous et al, 2007, 2014; Frontera
et al, 2008).
The newborn’s liver ensures a crucial metabolic adaptation in
the immediate perinatal period in relation to nutritional, hormonal,
and/or environmental changes, but the transcriptional regulatory
circuitry that triggers glucose output and activates lipid oxidation
pathways remains poorly understood. Our observations that DMat
neonates fail to engage this switch in timely fashion demonstrate
that some—or all—of the deleted miRNA genes help regulate the
required underlying transcriptional response. This is exemplified by
delayed (or decreased) expression of hundreds of genes whose
expression must be turned on (or maintained) during the immediate
perinatal period, for example Cpt1a (Thumelin et al, 1994), Cyp2e1
ª 2014 The Authors The EMBO Journal
Stéphane Labialle et al Imprinted miRNAs and metabolic control at birth The EMBO Journal
9

mR
NA
leve
l
mR
NA
leve
l
00,20,40,60,81
1,21,41,61,8
E19 P0 P10
0,20,40,60,8
11,21,4
Fgf21
00,5
11,5
22,5
33,5
44,5
Cyp2e1 Nr0b2
00,51
1,52
2,53
3,54
E19 P0 P1
Dio1
00,20,40,60,8
11,21,41,61,8
2
mR
NA
leve
l
Bdh1
E19 P0 P1
E19 P0 P10
0,5
1
1,5
2
2,5
E19 P0 P1
E19 P0 P1
Igf1
00,20,40,60,8
11,21,41,6
E19 P0 P1
Slc17a2
mR
NA
leve
l
mR
NA
leve
l
mR
NA
leve
l
mR
NA
leve
l
Top30 up- and down-regulated genes in neonatal (P0) liver Up/logFC Down/logFC
Fibin 2.75Serpina3i 2.74Fam134b 2.21Cidea 2.17Lpin1 2.04Hamp 1.99Slco4c1 1.97Setdb2 1.96Sds 1.88Esrrg 1.80Map3k6 1.79Chac1 1.77Gpr88 1.71O3far1 1.61Got1 1.54
Cyp2e1 -3.27Prok1 -3.18Mirg -2.71Fgf21 -2.31Akr1c6 -2.27Nr0b2 -2.18Cyp2d37-ps -2.16Inhbe -2.09Acnat2 -2.02Cyp1a2 -2.01Akr1c20 -2.00Slc22a1 -1.95Sult1c2 -1.87Cyp2f2 -1.86Ugtb35 -1.81
Doc2b 1.52Zbtb16 1.51Ddit4 1.48Fam107a 1.48Adra2a 1.47Tmc7 1.47Ctsj 1.45Itgae 1.45trp53inp1 1.44Ppp1r3g 1.42Esm1 1.41Isg15 1.36Upp2 1.35Il1r2 1.33Sgk1 1.31
Ostb -1.81Cyp3a59 -1.81Acot3 -1.80Hsd3b4 -1.79Fgf1 -1.77Inmt -1.74Otc -1.73Dio1 -1.73Ces3b -1.70Mettl7b -1.68Acnat2 -1.66Slco1b2 -1.64Gpd1 - 1.64Crot -1.64Apol7a -1.63
ΔMat WT ΔMat WTIndividuals 1 2 3 4 5 1 2 3 4 1 2 3 1 2 3
P0 E19.5
group 1A
group 1B
group 2B
group 2A
*
**
****
***
**
*
***
*** **
FibinSetd
b2Cide
aHam
p TatEssr
g0
0,2
0,4
0,6
0,8
1
1,2
1,4
1,6
0
1
2
3
4
5
6
7
8
Fgf21
Prok1
Cyp2e
1
Hsd17b
6
C
rotFab
p1 Lipa
Acsm1 H
ao1
Igf1
Adra1b
Nr0b2
Sc5d
Cyp4a
10
Cyp2f2 Otc
Ces3aUtg2
bDio1 Bdh
1Twist
1
mR
NA
leve
l
mR
NA
leve
l*
*
**
**
*** ***
*****
****
**
****
** ****
***
*
****
****
****
**
*
***
***
***
*
E19.5 P0
E19.5+4
18
620
3
4
4
0
0
79
1178
30
0
0
0
5
E19.5 P0
E19.5+4
Up-regulated genes in ΔMat
Down-regulated genes in ΔMat
Cyp2e1Acnat2Ces3bHsdl17b6Mirg
WT
WT
A C
B
D
The EMBO Journal ª 2014 The Authors
The EMBO Journal Imprinted miRNAs and metabolic control at birth Stéphane Labialle et al
10
(Hart et al, 2009), Pck1 (Wang et al, 1995), Fgf21 (Hondares et al,
2010). Although we do not fully understand how the miR-379/
miR-410 cluster may confer, directly or indirectly, robustness to
neonatal hepatic transcriptional regulatory circuits, our findings are
consistent with a model whereby loss of miRNA expression is
mostly, if not exclusively, detrimental during a very narrow tempo-
ral window just before—or coinciding with—birth, when neonates
mount, for the first time, adaptive metabolic responses.
Although not unusual in genetically modified animals, including
in miRNA-deficient mice (Medeiros et al, 2011), the reasons for the
incomplete penetrance of the neonatal lethality phenotype remain
difficult to formulate. Lethality in a given litter was observed regard-
less the number of DMat pups, the ratio of DMat vs WT, the parental
origin of the deletion in the dams, and the length of gestation or
even number of pregnancies the dams had experienced. Any genetic
background effects appear unlikely since neonatal death is observed
after more than 10 backcrosses on C57BL/6J background. That
DMat individuals with mild hypoglycemia re-expressed the
miR-379/miR-410 cluster from the normally silent paternal allele
can also be ruled out (Supplementary Fig S4). Fluctuations in gene
expression can give rise to phenotypic variations if expression levels
that underlie an outcome are subjected to a threshold (Raj et al,
2010). Loss of the miR-379/miR-410 cluster most likely leads to vari-
ability in the timing of expression of some metabolic genes and,
beyond a certain threshold, to mis-expression of some of them,
particularly those encoding rate-limiting enzymes. This may cause
complex and interconnected hepatic dysfunctions that affect both
glucose and lipid metabolism. We reason that DmiR first disrupts
glucose homeostasis in most, if not all, DMat mutants. These defi-
ciencies may in turn decrease the ability of some lethargic pups to
WT neonates
Activation of neonatal hepatic gene expression program
Glycogen
Glucose Ketones
Glycogen
Glucose
Ketones
Metabolic adaptation to extra-uterine life - Neonatal survival
Maladaptive metabolic response Hypoglycemia - Neonatal death
Perturbed neonatal hepatic gene expression program
ΔMat neonates
birth birth
Figure 6. The miR-379/miR-410 cluster controls metabolic adaptation at the transition from fetal to postnatal life.Our model implies that maternally inherited deletion of the miR-379/miR-410 cluster interferes with the activation (or maintenance) of the neonatal hepatic gene program atthe transition from fetal to postnatal life. This results in interlaced defects in the newborn (P0–P1) liver that include inefficient mobilization of hepatic glycogen stores,defective gluconeogenesis pathways and the inability to compensate with elevated levels of ketone bodies. Such a pleiotropic maladaptive metabolic response—in theabsence of any apparent defects in pancreatic hormonal release—leads to severe neonatal hypoglycemia which most likely represents the main, if not the sole, cause ofsubsequent death.
Figure 5. Loss of the miR-379/miR-410 cluster is associated with major changes in the neonatal hepatic gene expression program.
A Top: Venn diagrams showing the number of up- and down-regulated genes revealed by Agilent microarrays at E19.5, E19.5 + 4, and P0 in DMat and WT livers(BH-adjusted P-value < 0.05). Bottom: Top 30 of up- and down-regulated genes. ncRNA genes and other poorly characterized transcripts, except the microRNA hostgene (Mirg), were omitted from this microarray list.
B Expression levels of selected misregulated genes validated by RT–qPCR. Blue and pink bars represent expression levels in DPat and DMat individuals, respectively. WTexpression levels were arbitrarily set to 1.
C Heatmap and hierarchical clustering of genes regulated in DMat vs. WT newborn livers at E19.5 or P0 (2,147 unique probes with BH-adjusted P-value < 0.05). Red:up-regulated; green: down-regulated; black: no change.
D Perinatal expression of some genes was assayed by RT–qPCR analysis. Black and pink bars indicate expression levels in DPat and DMat individuals, respectively. Darkpink represents the most hypoglycemic mutant neonates at P1. WT expression levels at P0 were arbitrarily set to 1. Note that the dramatic decrease in Fgf21 mRNAlevels in P1 hypoglycemic neonates may reflect the fact that fasting neonates display lower levels of Fgf21 expression (Hondares et al, 2010).
Data information: Data in (B–D) are expressed as mean � s.e.m. (n = 4–6 individuals per genotype).
◂
ª 2014 The Authors The EMBO Journal
Stéphane Labialle et al Imprinted miRNAs and metabolic control at birth The EMBO Journal
11

compete efficiently for suckling (hence low milk intake and low
ketone levels in mutants with severe hypoglycemia at P1). A ‘butter-
fly effect’ (Dorn, 2013) whose phenotypic consequences are mostly,
if not exclusively, observed at birth because it represents the first
drastic survival-challenging event might account for some aspects of
the incomplete penetrance we observe. We are speculating that the
ability ‘to suckle in time’ may also allow some DMat neonates to
recover and also perhaps to resolve their alterations in hepatic tran-
scriptome. Given the constitutive deletion of the miRNA cluster, we
cannot exclude the possibility that lack of miRNA expression in
other tissues not investigated in this study, for example, the
newborn’s brain, also impacts on this complex neonatal metabolic
phenotype.
The question of the identity of the repertoire of mRNAs that are
presumably silenced by the miR-379/miR-410 cluster remains
open. The large number of deleted miRNA genes renders illusory
—if not naıve—a concentration of too much effort on in silico
predictions: Assuming that all miRNAs are equally functional,
bioinformatics identify over 10,000 mRNA targets. As a case in
point, we could not find any statistical enrichment of binding sites
for the deleted miRNAs within the 30-UTR of up-regulated tran-
scripts in neonatal liver, as would have been expected if miRNAs
trigger significant RNA decay of their targets (Baek et al, 2008).
Moreover, because the miR-379/miR-410 cluster is only found in
eutherian species, this considerably limits further analysis that
would take into account the phylogenetic conservation of miRNA::
mRNA base-pairings between evolutionarily distant species.
Finally, we cannot rule out the possibility that miRNAs act
through pure translational repression mechanisms or regulate their
targets by non-canonical interactions (Helwak et al, 2013), hinder-
ing further in silico searches. More sensitive and unbiased
genome-wide approaches, including the study of temporally
induced, tissue-specific deletions, should help identify gene regula-
tory networks controlled by the miR-379/miR-410 cluster in the
most biologically relevant tissues.
Pathways deregulated in DMat neonates mostly relate, but are
not restricted, to aspects of lipid metabolism that are crucially
engaged when a suckling-based, lipid-rich diet is initiated. In marsu-
pials, milk composition changes gradually during the course of
lactation (Brennan et al, 2007). This is in striking opposition to
eutherians, which have to adapt to an abrupt transition in energy
substrates. From an evolutionary perspective, we speculate that,
once acquired at the Dlk1-Dio3 chromosomal domain and amplified
at the root of the eutherian lineage (Edwards et al, 2008), the
miR-379/miR-410 cluster may have functionally converged toward
postnatal regulatory roles at the transition from fetal to postnatal
life. This might have possibly extended to the weaning transition to
independent life, which also entails profound nutritional changes.
Acquisition of the miR-379/miR410 cluster in eutherian species may
have increased neonate fitness by improving their metabolic adapt-
ability upon profound changes in nutrition. If so, this may have
contributed to placental mammal evolution.
How the DMat phenotypes relate to the complex epigenetic
pathways that ultimately drive selection for the maternal expres-
sion of the miR-379/miR-410 cluster remains unknown. Although
still a matter of active and lively debate, several theories attempt
to explain the evolutionarily meaning of the emergence of pater-
nally and maternally expressed genes in mammals (Kaneko-Ishino
et al, 2003; Wilkins & Haig, 2003; Wolf & Hager, 2006), yet none
of them account for all consequences of imprinting of genes. One
of these explanations, the broadly discussed ‘conflict theory’,
states that paternally expressed genes favor acquisition of maternal
resources. In contrast, maternally expressed genes would tend to
counteract this effect by limiting the drain of resources in the
mother (Moore & Haig, 1991). While the silencing of the pater-
nally expressed Rtl1 gene in the placenta by the maternally
expressed miR-127/miR-136 cluster, also positioned at the Dlk1-
Dio3 domain, satisfies to some extent the predictions of the
conflict theory (Seitz et al, 2003; Davis et al, 2005; Lewis &
Redrup, 2005; Sekita et al, 2008), the lack of major developmental
defects and the postnatal phenotypes associated with full deletion
of the miR-379/miR-410 cluster do not easily fit with this simple
view. A better understanding of why imprinting has evolved is still
lacking to fully appreciate the significance of the mono-allelic
expression of the miR-379/miR-410 cluster. It should also be noted
that maternal expression of the miR-379/miR-410 cluster could
simply be an evolutionary remnant whose raison d’etre would
simply result from ‘bystander effects’ due to long-range epigenetic
regulations that orchestrate imprinted expression at the Dlk1-Dio3
chromosomal region (Labialle & Cavaille, 2011).
We have shown that the very first hours of extra-uterine life,
which are associated with unique metabolic adjustments, require
one or several—if not all—miRNAs encoded within the imprinted
miR-379/miR-410 cluster. Although we do not know whether addi-
tional defects occur elsewhere (including at earlier developmental
stages) and are then transduced to the changes we observe in the
transcriptional circuitry of the liver, it is clear that a maternally
inherited deficiency of the miR-379/miR-410 cluster is sufficient to
compromise implementation of the complex hepatic transcriptional
program that normally occurs at birth. Targeted deletions of one (or
a few) evolutionarily conserved miRNA gene(s) in the mouse have
revealed that only very few null mutants display full (or partially
penetrant) lethality phenotypes (Park et al, 2010, 2012). Our find-
ings that the eutherian-specific miR-379/miR-410 cluster plays
essential roles in neonatal survival and metabolic control at birth
therefore provide important insights into the biological importance
of recently evolved miRNA genes. In this context, it will be of inter-
est to study other lineage-specific miRNA loci—particularly the two
imprinted C19MC and Sfmbt2 clusters that are found only in
primates and rodents, respectively (Noguer-Dance et al, 2010; Wang
et al, 2011).
Materials and Methods
Mice housing, breeding, embryo harvest
All animal procedures were approved by the University of Toulouse
and CNRS Institutional Animal Care Committee (01503.01). The
animal housing facility met CNRS standards. Mice were housed in
standard plastic cages with access to food (rodent chow diet) and
water ad libitum in a temperature-controlled room, with a 12-h
light–dark cycle. Breeding was performed overnight. Female
breeders positive for copulation plugs in the morning were
considered embryonic day 0.5 (E0.5). Neonates were examined at
the premorbid stage (10–15 h post-delivery, denoted as P0) and
The EMBO Journal ª 2014 The Authors
The EMBO Journal Imprinted miRNAs and metabolic control at birth Stéphane Labialle et al
12

within the window of lethality (30–35 h post-delivery, denoted as
P1). For cesarean delivery, pups were immediately expelled and put
in a warm and moist box placed in a 37°C water bath. Pups’ mouths
and nostrils were gently cleaned with cotton swabs, which were
also used to stimulate breathing and motion by gentle massage.
Pups were continuously monitored during the course of the
experiment. All experiments were performed starting from the sixth
generation of backcrossing in the C57BL/6J genetic background.
Targeted disruption of the miR-379/miR-410 cluster
A mouse model carrying a large ~59-kb-long deletion overlapping
the entire miR-379/miR-410 cluster (DmiR) was generated by Cre/
loxP-mediated site-specific deletion at the MCI/ICS (Mouse Clinical
Institute, Illkirch, France). Briefly, two targeting vectors harboring
neomycin- and hygromycin-resistance expression cassettes were
introduced upstream and downstream, respectively, of the micro-
RNA cluster. This was achieved through two independent homolo-
gous recombination events in 129Sv-derived embryonic stem (ES)
cells. A positive ES cell with correct targeting on the same allele and
displaying normal karyotype was injected into C57BL/6J host blast-
ocysts, and chimeras were produced. Chimeric males that passed
the targeted allele to their offspring were mated with Cre-deleter
females (CMV-Cre), and the entire cluster was faithfully excised in
vivo. PCR genotyping was performed on genomic DNA prepared
from tails of embryonic, neonatal, or weaned mice, using the
Wizard SV Genomic DNA Purification System (Promega) kit. Wild-
type and targeted alleles were amplified using P1/P2 and P1/P3
oligonucleotide pairs, respectively (Fig 1C). Primer sequences are
listed in Supplementary Fig S10.
Blood and metabolic parameter analysis
Glucose levels were measured using a hand-held blood glucose
meter (Accu-check Performa, Roche Diagnostics). Samples below
the detection limit (10 mg/dl) were arbitrarily set to 9 mg/dl.
Hepatic glycogen was assayed by a direct enzymatic procedure.
Fresh or frozen livers were homogenized in 1N NaOH at 55°C and
then neutralized with 1 volume of 1N HCl. Samples were treated
with 50 U/ml amyloglucosidase (Sigma) in 0.2 M sodium acetate at
pH 4.8 for 1 h at 55°C to convert glycogen to glucose monomers.
Glucose was quantified using the Glucose (GO) Assay Kit (Sigma).
Circulating levels of ketone bodies were quantified using the
b-hydroxybutyrate (Ketone Body) Assay kit (Cayman Chemical
Company). Quantification of insulin and glucagon was performed
using the MILLIPLEX MAP Mouse Metabolic Disease Panel (Merck
Millipore) and analyzed with the Luminex 100 IS apparatus at the
IBISA-labeled Transgenesis, Zootechny and Functional Exploration
Core Facility of Toulouse (Anexplo/GenoToul). Serum-free fatty
acid and triglyceride analyses were also performed there with the
ABX PENTRA400 analyzer. Lipidomic analysis was performed at the
Toulouse INSERM Metatoul-Lipidomique Core Facility. Lipids corre-
sponding to 1 mg of tissue were extracted and analyzed by gas-
liquid chromatography on a FOCUS Thermo Electron system using
Zebron-1 Phenomenex-fused silica capillary columns (Barrans et al,
1994). For measurement of beta-oxidation, newborn’s livers were
minced and hepatocytes were isolated after collagenase digestion.
Isolated hepatocytes were then incubated with 0.5 lCi/ml of
14C-labelled palmitate, and complete fatty acid oxidation was deter-
mined by the release of 14C-labelled CO2 (Attane et al, 2012).
RNA extraction, quantitative real-time PCR, Northernblot analysis
Total RNA was extracted using TRI reagent (Euromedex) according
to the manufacturer’s instructions followed by RNase-free RQ1
DNAse (Promega) and proteinase K (Sigma) treatments or purifica-
tion with RNeasy column (Qiagen). mRNA expression was deter-
mined using the Go ScriptTM Reverse Transcriptase (Promega) kit,
and amplifications were performed using the IQTM Custom SYBR
Green Supermix (Bio-Rad) qPCR kit. miRNA expression was
measured using the miScript Reverse Transcription kit and the
miScript SYBR Green PCR kit (Qiagen), using specific primers
(Qiagen) and U6 RNA as an endogenous control. cDNAs were
amplified on an Analytik Jena Flexcycler. Primer sequences are
listed in Supplementary Fig S10. Total RNA (10 lg) was fractionated
by electrophoresis on a 15% acrylamide/7M urea denaturating gel.
Electrotransfer was performed onto nylon membranes (BrightStar
Plus membrane, Ambion), followed by UV-light irradiation. North-
ern blot hybridization was carried out with 50-32P-labeled DNA
oligonucleotide probes, with an overnight incubation at 50°C in
5× SSPE, 1% SDS, 5× Denhardt’s, and 150 lg/ml yeast tRNA.
Membranes were washed twice in 0.1% SSPE and 0.1% SDS at
room temperature before autoradiography.
Transcriptome analysis
mRNA gene expression profiles were performed at the GeT-Trix
facility (Toulouse) using Agilent Whole Mouse Genome microarrays
(8 × 60 k) according to the manufacturer’s instructions. Microarray
data and all experimental details are available in the Gene Expres-
sion Omnibus (GEO) database (accession numbers GSE47159 and
GSE57112).
Statistical methods
Results are expressed as mean � s.e.m. Comparison of two groups
was analyzed by a two-tailed Student’s unpaired t-test. Deviation
from Mendelian frequencies was analyzed by a v2 test. Statistically
significant differences between groups are indicated as *P < 0.05,
**P < 0.01, ***P < 0.001 and ****P < 0.0001.
Supplementary information for this article is available online:
http://emboj.embopress.org
AcknowledgementsThis work is dedicated to the memory of our colleague and friend E. Käs. We
thank Y. Henry for careful reading of the manuscript and A. Ferguson-Smith,
D. Langin, P. Ferré, L. Casteilla, J. Girard, A. Lorsignol, and F. Villarroyal for
informal discussions throughout this work. We are indebted to Jacques Auriol,
Séverine Ethuin and Frederic Luce (from the Zootechnie ABC) for their tech-
nical assistance during the week-end. We are also grateful to Y. Lippi, G.
Canal, and H. Seitz for help in microarray analyses, R software and the search
of miRNA targets, respectively. This work was supported by grants from
European Union (CallimiR), EMBO (EMBO Young Investigator Programme),
and ANR (ImpmiR).
ª 2014 The Authors The EMBO Journal
Stéphane Labialle et al Imprinted miRNAs and metabolic control at birth The EMBO Journal
13

Author contributionsSL and VM performed and analyzed most of the experiments. M-LB-C
performed some RT–qPCR and Northern blot experiments. MH-O initiated the
phenotypic characterization of miR mice. J-PP and PV contributed to the design
and analysis of fatty acid beta-oxidation in the newborn’s liver. PM supervised
transcriptomic experiments and interpreted the data. JC and SL conceived the
project and wrote the manuscript with some inputs from other authors.
Conflict of interestThe authors declare that they have no conflict of interest.
References
Ambros V (2011) MicroRNAs and developmental timing. Curr Opin Genet Dev
21: 511 – 517
Attane C, Foussal C, Le Gonidec S, Benani A, Daviaud D, Wanecq E,
Guzman-Ruiz R, Dray C, Bezaire V, Rancoule C, Kuba K, Ruiz-Gayo M,
Levade T, Penninger J, Burcelin R, Penicaud L, Valet P, Castan-Laurell I
(2012) Apelin treatment increases complete Fatty Acid oxidation,
mitochondrial oxidative capacity, and biogenesis in muscle of
insulin-resistant mice. Diabetes 61: 310 – 320
Baek D, Villen J, Shin C, Camargo FD, Gygi SP, Bartel DP (2008) The impact of
microRNAs on protein output. Nature 455: 64 – 71
Barlow DP, Bartolomei MS (2014) Genomic imprinting in mammals. Cold
Spring Harb Perspect Biol 6: pii: a018382 .
Barrans A, Collet X, Barbaras R, Jaspard B, Manent J, Vieu C, Chap H, Perret B
(1994) Hepatic lipase induces the formation of pre-beta 1 high density
lipoprotein (HDL) from triacylglycerol-rich HDL2. A study comparing liver
perfusion to in vitro incubation with lipases. J Biol Chem 269:
11572 – 11577
Benetatos L, Voulgaris E, Vartholomatos G (2012) DLK1-MEG3 imprinted
domain microRNAs in cancer biology. Crit Rev Eukaryot Gene Expr 22: 1 – 15
Bicker S, Khudayberdiev S, Weiss K, Zocher K, Baumeister S, Schratt G (2013)
The DEAH-box helicase DHX36 mediates dendritic localization of the
neuronal precursor-microRNA-134. Genes Dev 27: 991 – 996
Brennan AJ, Sharp JA, Digby MR, Nicholas KR (2007) The tammar wallaby: a
model to examine endocrine and local control of lactation. IUBMB Life 59:
146 – 150
Bushati N, Cohen SM (2007) microRNA functions. Annu Rev Cell Dev Biol 23:
175 – 205
Cederbaum AI (2010) Role of CYP2E1 in ethanol-induced oxidant stress, fatty
liver and hepatotoxicity. Dig Dis 28: 802 – 811
Charalambous M, da Rocha ST, Ferguson-Smith AC (2007) Genomic imprinting,
growth control and the allocation of nutritional resources: consequences
for postnatal life. Curr Opin Endocrinol Diabetes Obes 14: 3 – 12
Charalambous M, Ferron SR, da Rocha ST, Murray AJ, Rowland T, Ito M,
Schuster-Gossler K, Hernandez A, Ferguson-Smith AC (2012) Imprinted
gene dosage is critical for the transition to independent life. Cell Metab
15: 209 – 221
Charalambous M, da Rocha ST, Hernandez A, Ferguson-Smith AC (2014)
Perturbations to the IGF1 growth pathway and adult energy homeostasis
following disruption of mouse chromosome 12 imprinting. Acta Physiol
(Oxf) 210: 174 – 187
Chiang HR, Schoenfeld LW, Ruby JG, Auyeung VC, Spies N, Baek D, Johnston
WK, Russ C, Luo S, Babiarz JE, Blelloch R, Schroth GP, Nusbaum C, Bartel
DP (2010) Mammalian microRNAs: experimental evaluation of novel and
previously annotated genes. Genes & Development 24: 992 – 1009
Christensen M, Larsen LA, Kauppinen S, Schratt G (2010) Recombinant
adeno-associated virus-mediated microRNA delivery into the postnatal
mouse brain reveals a role for miR-134 in dendritogenesis in vivo. Front
Neural Circuits 3: 16
Constancia M, Kelsey G, Reik W (2004) Resourceful imprinting. Nature 432:
53 – 57
Davis E, Caiment F, Tordoir X, Cavaille J, Ferguson-Smith A, Cockett N,
Georges M, Charlier C (2005) RNAi-mediated allelic trans-interaction at
the imprinted Rtl1/Peg11 locus. Curr Biol 15: 743 – 749
Dorn GW 2nd (2013) MicroRNAs and the butterfly effect. Cell Cycle 12:
707 – 708
Edwards CA, Mungall AJ, Matthews L, Ryder E, Gray DJ, Pask AJ, Shaw G,
Graves JA, Rogers J, Dunham I, Renfree MB, Ferguson-Smith AC (2008) The
evolution of the DLK1-DIO3 imprinted domain in mammals. PLoS Biol 6:
e135
Fabian MR, Sonenberg N (2012) The mechanics of miRNA-mediated gene
silencing: a look under the hood of miRISC. Nat Struct Mol Biol 19:
586 – 593
Fiore R, Khudayberdiev S, Christensen M, Siegel G, Flavell SW, Kim TK,
Greenberg ME, Schratt G (2009) Mef2-mediated transcription of the
miR379-410 cluster regulates activity-dependent dendritogenesis by
fine-tuning Pumilio2 protein levels. EMBO J 28: 697 – 710
Frontera M, Dickins B, Plagge A, Kelsey G (2008) Imprinted genes, postnatal
adaptations and enduring effects on energy homeostasis. Adv Exp Med
Biol 626: 41 – 61
Gao J, Wang WY, Mao YW, Graff J, Guan JS, Pan L, Mak G, Kim D, Su SC, Tsai
LH (2010) A novel pathway regulates memory and plasticity via SIRT1 and
miR-134. Nature 466: 1105 – 1109
Giraldez AJ (2010) microRNAs, the cell’s Nepenthe: clearing the past during
the maternal-to-zygotic transition and cellular reprogramming. Curr Opin
Genet Dev 20: 369 – 375
Girard J, Ferre P, Pegorier JP, Duee PH (1992) Adaptations of glucose and fatty
acid metabolism during perinatal period and suckling-weaning transition.
Physiol Rev 72: 507 – 562
Girardot M, Cavaille J, Feil R (2012) Small regulatory RNAs controlled by
genomic imprinting and their contribution to human disease. Epigenetics
7: 1341 – 1348.
Gonzalez FJ (2007) The 2006 Bernard B. Brodie Award Lecture. Cyp2e1. Drug
Metab Dispos 35: 1 – 8
Hart SN, Cui Y, Klaassen CD, Zhong XB (2009) Three patterns of cytochrome
P450 gene expression during liver maturation in mice. Drug Metab Dispos
37: 116 – 121
Helwak A, Kudla G, Dudnakova T, Tollervey D (2013) Mapping the human
miRNA interactome by CLASH reveals frequent noncanonical binding. Cell
153: 654 – 665
Hondares E, Rosell M, Gonzalez FJ, Giralt M, Iglesias R, Villarroya F (2010)
Hepatic FGF21 expression is induced at birth via PPARalpha in response
to milk intake and contributes to thermogenic activation of neonatal
brown fat. Cell Metab 11: 206 – 212
Jimenez-Mateos EM, Engel T, Merino-Serrais P, McKiernan RC, Tanaka K,
Mouri G, Sano T, O’Tuathaigh C, Waddington JL, Prenter S, Delanty N,
Farrell MA, O’Brien DF, Conroy RM, Stallings RL, DeFelipe J, Henshall DC
(2012) Silencing microRNA-134 produces neuroprotective and prolonged
seizure-suppressive effects. Nat Med 18: 1087 – 1094
Kagami M, Sekita Y, Nishimura G, Irie M, Kato F, Okada M, Yamamori S,
Kishimoto H, Nakayama M, Tanaka Y, Matsuoka K, Takahashi T, Noguchi
M, Masumoto K, Utsunomiya T, Kouzan H, Komatsu Y, Ohashi H,
Kurosawa K, Kosaki K et al (2008) Deletions and epimutations affecting
The EMBO Journal ª 2014 The Authors
The EMBO Journal Imprinted miRNAs and metabolic control at birth Stéphane Labialle et al
14

the human 14q32.2 imprinted region in individuals with paternal and
maternal upd(14)-like phenotypes. Nat Genet 40: 237 – 242
Kameswaran V, Bramswig NC, McKenna LB, Penn M, Schug J, Hand NJ, Chen
Y, Choi I, Vourekas A, Won KJ, Liu C, Vivek K, Naji A, Friedman JR, Kaestner
KH (2014) Epigenetic regulation of the DLK1-MEG3 microRNA cluster in
human type 2 diabetic islets. Cell Metab 19: 135 – 145
Kaneko-Ishino T, Kohda T, Ishino F (2003) The regulation and biological
significance of genomic imprinting in mammals. J Biochem 133:
699 – 711
Labialle S, Cavaille J (2011) Do repeated arrays of regulatory small-RNA genes
elicit genomic imprinting?: Concurrent emergence of large clusters of
small non-coding RNAs and genomic imprinting at four evolutionarily
distinct eutherian chromosomal loci. Bioessays 33: 565 – 573
Labialle S, Vitali P, Cavaille J (2011) Imprinted Small Non-coding RNA Genes:
Time to Decipher their Physiological Functions. In Non Coding RNAs and
Epigenetic Regulation of Gene Expression- Drivers of Natural Selection,
Morris KV (ed.), pp. 47 – 75. Norfolk, UK: Caister Academic Press.
Leung AK, Sharp PA (2010) MicroRNA functions in stress responses. Mol Cell
40: 205 – 215
Lewis A, Redrup L (2005) Genetic imprinting: conflict at the Callipyge locus.
Curr Biol 15: R291 – 294
Lin SP, Youngson N, Takada S, Seitz H, Reik W, Paulsen M, Cavaille J,
Ferguson-Smith AC (2003) Asymmetric regulation of imprinting on the
maternal and paternal chromosomes at the Dlk1-Gtl2 imprinted cluster
on mouse chromosome 12. Nat Genet 35: 97 – 102
Liu L, Luo GZ, Yang W, Zhao X, Zheng Q, Lv Z, Li W, Wu HJ, Wang L, Wang XJ,
Zhou Q (2010) Activation of the imprinted Dlk1-Dio3 region correlates
with pluripotency levels of mouse stem cells. J Biol Chem 285:
19483 – 19490
Medeiros LA, Dennis LM, Gill ME, Houbaviy H, Markoulaki S, Fu D, White AC,
Kirak O, Sharp PA, Page DC, Jaenisch R (2011) Mir-290-295 deficiency in
mice results in partially penetrant embryonic lethality and germ cell
defects. Proc Natl Acad Sci USA 108: 14163 – 14168
Mendell JT, Olson EN (2012) MicroRNAs in stress signaling and human
disease. Cell 148: 1172 – 1187
Moore T, Haig D (1991) Genomic imprinting in mammalian development: a
parental tug-of-war. Trends Genet 7: 45 – 49
Noguer-Dance M, Abu-Amero S, Al-Khtib M, Lefevre A, Coullin P, Moore GE,
Cavaille J (2010) The primate-specific microRNA gene cluster (C19MC) is
imprinted in the placenta. Hum Mol Genet 19: 3566 – 3582
Park CY, Choi YS, McManus MT (2010) Analysis of microRNA knockouts in
mice. Hum Mol Genet 19: R169 – 175
Park CY, Jeker LT, Carver-Moore K, Oh A, Liu HJ, Cameron R, Richards H, Li Z,
Adler D, Yoshinaga Y, Martinez M, Nefadov M, Abbas AK, Weiss A, Lanier
LL, de Jong PJ, Bluestone JA, Srivastava D, McManus MT (2012) A resource
for the conditional ablation of microRNAs in the mouse. Cell Rep 1:
385 – 391
Poethig RS (2009) Small RNAs and developmental timing in plants. Curr Opin
Genet Dev 19: 374 – 378
Potthoff MJ, Kliewer SA, Mangelsdorf DJ (2012) Endocrine fibroblast growth
factors 15/19 and 21: from feast to famine. Genes Dev 26: 312 – 324
Rago L, Beattie R, Taylor V, Winter J (2014) miR379-410 cluster miRNAs
regulate neurogenesis and neuronal migration by fine-tuning N-cadherin.
EMBO J 33: 906 – 920
Raj A, Rifkin SA, Andersen E, van Oudenaarden A (2010) Variability in gene
expression underlies incomplete penetrance. Nature 463: 913 – 918
da Rocha ST, Edwards CA, Ito M, Ogata T, Ferguson-Smith AC (2008) Genomic
imprinting at the mammalian Dlk1-Dio3 domain. Trends Genet 24:
306 – 316
Schratt GM, Tuebing F, Nigh EA, Kane CG, Sabatini ME, Kiebler M, Greenberg
ME (2006) A brain-specific microRNA regulates dendritic spine
development. Nature 439: 283 – 289
Seitz H, Youngson N, Lin SP, Dalbert S, Paulsen M, Bachellerie JP,
Ferguson-Smith AC, Cavaille J (2003) Imprinted microRNA genes
transcribed antisense to a reciprocally imprinted retrotransposon-like
gene. Nat Genet 34: 261 – 262
Sekita Y, Wagatsuma H, Nakamura K, Ono R, Kagami M, Wakisaka N, Hino T,
Suzuki-Migishima R, Kohda T, Ogura A, Ogata T, Yokoyama M,
Kaneko-Ishino T, Ishino F (2008) Role of retrotransposon-derived
imprinted gene, Rtl1, in the feto-maternal interface of mouse placenta.
Nat Genet 40: 243 – 248
Stadtfeld M, Apostolou E, Akutsu H, Fukuda A, Follett P, Natesan S, Kono T,
Shioda T, Hochedlinger K (2010) Aberrant silencing of imprinted genes on
chromosome 12qF1 in mouse induced pluripotent stem cells. Nature 465:
175 – 181
Thumelin S, Esser V, Charvy D, Kolodziej M, Zammit VA, McGarry D, Girard J,
Pegorier JP (1994) Expression of liver carnitine palmitoyltransferase I and
II genes during development in the rat. Biochem J 300(Pt 2): 583 – 587
Turgeon B, Meloche S (2009) Interpreting neonatal lethal phenotypes in
mouse mutants: insights into gene function and human diseases. Physiol
Rev 89: 1 – 26
Wallace C, Smyth DJ, Maisuria-Armer M, Walker NM, Todd JA, Clayton DG
(2010) The imprinted DLK1-MEG3 gene region on chromosome 14q32.2
alters susceptibility to type 1 diabetes. Nat Genet 42: 68 – 71
Wang ND, Finegold MJ, Bradley A, Ou CN, Abdelsayed SV, Wilde MD, Taylor
LR, Wilson DR, Darlington GJ (1995) Impaired energy homeostasis in C/EBP
alpha knockout mice. Science 269: 1108 – 1112
Wang Q, Chow J, Hong J, Smith AF, Moreno C, Seaby P, Vrana P, Miri K, Tak J,
Chung ED, Mastromonaco G, Caniggia I, Varmuza S (2011) Recent
acquisition of imprinting at the rodent Sfmbt2 locus correlates with
insertion of a large block of miRNAs. BMC Genomics 12: 204
Wilkins JF, Haig D (2003) What good is genomic imprinting: the function of
parent-specific gene expression. Nat Rev Genet 4: 359 – 368
Wolf JB, Hager R (2006) A maternal-offspring coadaptation theory for the
evolution of genomic imprinting. PLoS Biol 4: e380
Yubero P, Hondares E, Carmona MC, Rossell M, Gonzalez FJ, Iglesias R, Giralt
M, Villarroya F (2004) The developmental regulation of peroxisome
proliferator-activated receptor-gamma coactivator-1alpha expression in
the liver is partially dissociated from the control of gluconeogenesis and
lipid catabolism. Endocrinology 145: 4268 – 4277
Zhang Y, Hagedorn CH, Wang L (2011) Role of nuclear receptor SHP in
metabolism and cancer. Biochim Biophys Acta 1812: 893 – 908
ª 2014 The Authors The EMBO Journal
Stéphane Labialle et al Imprinted miRNAs and metabolic control at birth The EMBO Journal
15