Paper Bag manufacturing - KVIC
23
PROJECT REPORT Of PAPER BAG PURPOSE OF THE DOCUMENT This particular pre-feasibility is regarding Paper Bag manufacturing unit. The objective of the pre-feasibility report is primarily to facilitate potential entrepreneurs in project identification for investment and in order to serve his objective; the document covers various aspects of the project concept development, start-up, marketing, finance and management. [We can modify the project capacity and project cost as per your requirement. We can also prepare project report on any subject as per your requirement.] M/s Inst A Unit o itute of Ind f M/s SAM KVIC Pa avilion, Ga Raj Gha at, New Del Website e: www.iid. Email: support@ii ustrial Dev ADHAN S ndhi Darsh hi 110002 org.in d.org.in elopment amiti an,
-
Upload
khangminh22 -
Category
Documents
-
view
0 -
download
0
Transcript of Paper Bag manufacturing - KVIC

PROJECT REPORT
Of
PAPER BAG
PURPOSE OF THE DOCUMENT
This particular pre-feasibility is regarding Paper Bag manufacturing unit.
The objective of the pre-feasibility report is primarily to facilitate potential entrepreneurs in project
identification for investment and in order to serve his objective; the document covers various aspects
of the project concept development, start-up, marketing, finance and management.
[We can modify the project capacity and project cost as per your requirement. We can also prepare
project report on any subject as per your requirement.]
M/s Inst
A Unit o
itute of Ind
f M/s SAM
KVIC Paavilion, Ga
Raj Ghaat, New Del
Websitee: www.iid.
Email: support@ii
uustrial Dev
AADHAN S
nndhi Darsh
hi 110002
oorg.in
dd.org.in
eelopment
aamiti
aan,

1
2
3
4 XXXXXXXX
Taluk/Block:District : XXXXXPin: XXXXX State: XXXXXE-Mail :Mobile XXXXX
5 Product and By Product :
6 Paper bag Unit
7 Cost of Project : Rs 15.06 Lacs
8 Means of FinanceRs. 5.17 Lacs
Rs. 3.89 Lacs
9 Debt Service Coverage Ratio : 3.22
10 Pay Back Period : 5 Years
11 Project Implementation Period : 6 Months
12 Break Even Point : 38.00%
13 Employment : 4 Persons
14 Power Requirement : 2 KWA
15 Major Raw materials :
16 Estimated Annual Sales Turnover : Rs 40.66 Lacs
16
COST OF PROJECT (Rs. In Lacs)Particulars Amount
Land Owned/ RentedPlant & Machinery 6.49 Furniture & Fixtures 0.40 Working Capital 8.17 Total 15.06
MEANS OF FINANCEParticulars Amount
Own Contribution 3.89 Bank Finance 5.17 Working Capital 6.00 Total 15.06
Father's/Spouce's Name XXXXXXXX
PROJECT AT A GLANCE
Name of the Entreprenuer XXXXXXX
Constitution (legal Status) :XXXXXXX
Unit Address :
XXXXX
Paper Bag
Name of the project / business activity proposed :
Brown Sheet Roll , Craft sheet
Detailed Cost of Project & Means of Finance
Term LoanKVIC Margin MoneyOwn Capital
As per Project Eligibility
PAPER BAG
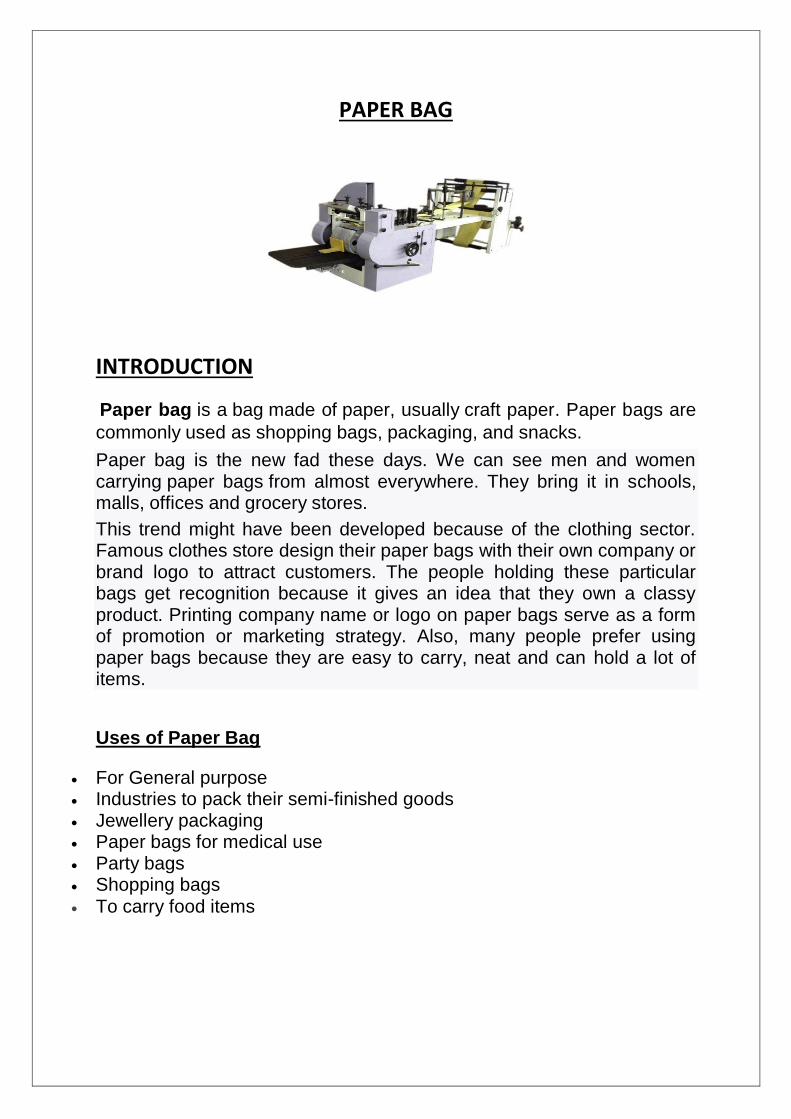
INTRODUCTION
Paper bag is a bag made of paper, usually craft paper. Paper bags are commonly used as shopping bags, packaging, and snacks.
Paper bag is the new fad these days. We can see men and women carrying paper bags from almost everywhere. They bring it in schools, malls, offices and grocery stores.
This trend might have been developed because of the clothing sector. Famous clothes store design their paper bags with their own company or brand logo to attract customers. The people holding these particular bags get recognition because it gives an idea that they own a classy product. Printing company name or logo on paper bags serve as a form of promotion or marketing strategy. Also, many people prefer using paper bags because they are easy to carry, neat and can hold a lot of items.
Uses of Paper Bag
• For General purpose• Industries to pack their semi-finished goods• Jewellery packaging• Paper bags for medical use• Party bags• Shopping bags• To carry food items

Importance of Paper Bag
Paper bags are gaining importance as these bags are 100% reusable, recyclable and biodegradable and at the same time environment friendly and pose less threat to wildlife. It requires less energy for paper bags to be recycled than plastic bags. Paper bags have come a long way since their beginnings in the mid-eighteenth century when some paper bag manufacturers started developing paper bags that are harder and long lasting.
1. Paper bags are environment friendly and can be recycled on the otherhand Plastic bags cause environmental damage such as increase the level of air pollution. Plastic bags not only have adverse effects on our natural habitats but leads to death of many animals.
2. Corporate are nowadays using paper bags for promotions, seminars,product packaging, and branding purposes as they are competitively priced.
3. You can also buy them at a very cheap price particularly if they arebought wholesale.
4. Possessing a paper bag is practical and you can use them to bringyour groceries and the premium quality paper bags can be used as paper gift bags.
5. Most people nowadays prefer using paper bags because they areeasy to carry, neat and can hold lot of items. It adds to your status symbol as they can be embossed and grained to enhance the look.
6. Paper bags are usually used extensively in malls and exhibitions fordelivering over the counter products as research shows that paper bags contain at least 35% recycled material.
Formulation
Paper Bags are formulated using batch or continuous process of paper roll making process. In this process a roll of 60 kg is loaded on the machine in an hour for the production of paper bag.
Maximum Capacity of the machine is 60 kg per hour.

Varieties of Paper Bag
Paper bags are available in the market in many varieties.
For example:
Paper shopping bags, brown paper bags, grocery bags, paper bread bags and other light duty bags. A variety of constructions and designs are also available. Many are printed with the names of stores and brands
Types of paper bag:
Laminated, Twisted, flat tap etc.
Description of Paper Bag Machine
Paper Bag Machines are used to produce Paper bag from the raw material. With the help of this machine the work of cutting, printing, sticking completes in a very short span. A controller is used to monitor & regulate the speed while operating the machine.
Paper Bag Current Market Analysis
Paper bags have several benefits including durability, eco-friendly nature and convenience which lead to increase in its market demand. The global paper bags market witnessed slow growth during the 2012-2016 timeline; however, it is projected to grow at a higher pace to register a moderate CAGR of 4.4% throughout the period of forecast. In 2017, the global market for paper bags is valued at around US$ 4500 Million and is estimated to touch a value of approximately US$ 7 Billion by the end of the year of assessment. Factors like strong and growing retail sector in developed regions, rising preference for paper bags across regions and increasing penetration of retail outlets in emerging economies are contributing to the growth of the global paper bags market.
The retail segment in the end use category is expected to largely contribute to the growth of the global market for paper bags. This segment is projected to grow at a value CAGR of 4.3% throughout the period of forecast. In 2017, the retail segment reflected a market share of 54.5%.

Paper Bag Manufacturing Process
Paper roll are fed to the without colour printing machine with attachment for the manufacturing of paper Bag wherein, these are cut, folded & stitched as per the size already adjusted accordingly through the controller into the machine.
Types of Machinery:
Scale type Cost
Large scale With Two Colour Flexo Printing facility 850000
Without Colour Flexo Printing facility 550000
Medium scale With Two Colour Flexo Printing facility 680000
Without Colour Flexo Printing facility 480000
Small Scale With Two Colour Flexo Printing facility 650000
Without Colour Flexo Printing facility 425000
*Cost of the machine is exclusive of GST.
*Machinery selected for financial project is Large scale without colourflexo printing facility.
Land &Building required:
Land required 450-500 Square Feet (approx.)
Approximate rent for the same is 10000 per Month
Labour Requirement:
2-3 Manpower are required for the Paper Bag unit.
Includes:
1 skilled Labour
1-2 Unskilled Labour
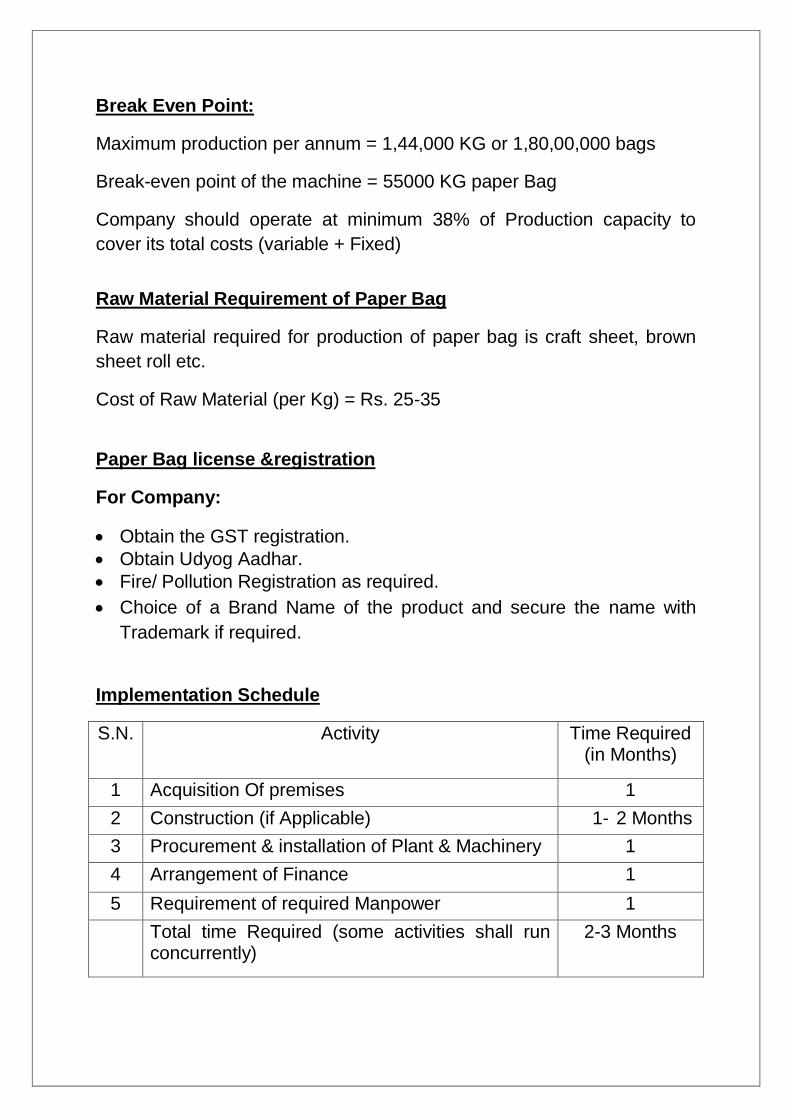
Break Even Point:
Maximum production per annum = 1,44,000 KG or 1,80,00,000 bags
Break-even point of the machine = 55000 KG paper Bag
Company should operate at minimum 38% of Production capacity to cover its total costs (variable + Fixed)
Raw Material Requirement of Paper Bag
Raw material required for production of paper bag is craft sheet, brown sheet roll etc.
Cost of Raw Material (per Kg) = Rs. 25-35
Paper Bag license ®istration
For Company:
• Obtain the GST registration. • Obtain Udyog Aadhar. • Fire/ Pollution Registration as required. • Choice of a Brand Name of the product and secure the name with
Trademark if required.
Implementation Schedule
S.N. Activity Time Required (in Months)
1 Acquisition Of premises 1
2 Construction (if Applicable) 1- 2 Months
3 Procurement & installation of Plant & Machinery 1
4 Arrangement of Finance 1
5 Requirement of required Manpower 1
Total time Required (some activities shall run concurrently)
2-3 Months

Conclusion:
After completion of manufacturing process, product is ready to sell in the market. Paper Bags are used for daily routine activities. This machine can be installed with low investment & one can earn a good Margin of profit by doing this business. Entrepreneur can choose paper bags with special properties that will seal the freshness and give an aesthetic look to their brand as offset and screen printing is possible.
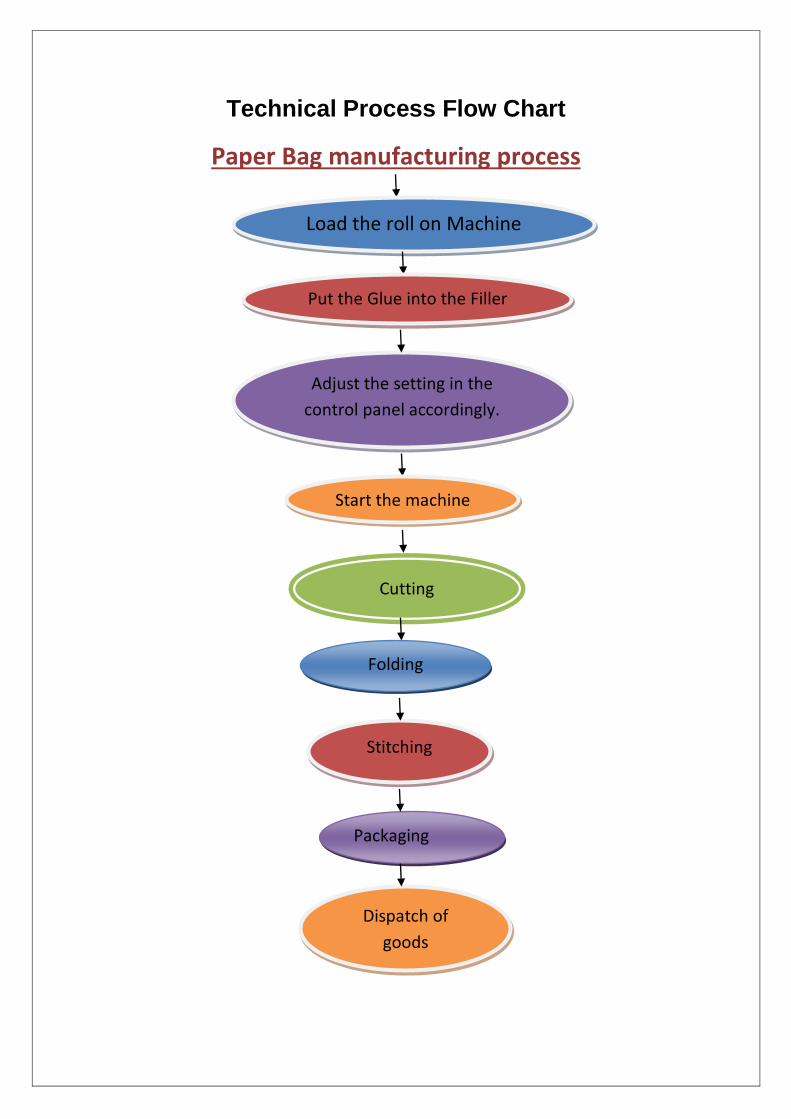
Technical Process Flow Chart
Paper Bag manufacturing process
Load the roll on Machine
Adjust the setting in the
control panel accordingly.
Dispatch of
goods
Put the Glue into the Filler
Cutting
Folding
Stitching
Packaging
Start the machine

Project Economics
FINANCIAL ASSISTANCE REQUIRED
Term Loan of Rs.5.17 Lacs and Working Capital limit of Rs. 6.00 Lacs
COST OF PROJECT PARTICULARS AMOUNT AMOUNT AMOUNT
Land
Building Civil Work
Plant & Machinery 6.49 1.62 4.87
Furniture & Fixtures and Other Assets 0.40 0.10 0.30
Margin for Working Capital 8.17 2.17 6.00
Total 15.06 3.89 11.17
MEANS OF FINANCE PARTICULARS AMOUNT
Own Contribution 3.89
Bank Loan 5.17
Working capital Limit 6.00
Total 15.06

COMPUTATION OF PRODUCTION OF PAPER BAG
Items to be Manufactured
Paper Bag
Machine Capacity 60 kg per hour
Paper roll required per day 480 KG
Raw Material Per Annum 144000 KG
Paper bag per kg 150 bags
paper bag per hour 9000 bags
paper bag per day 72000 bags
paper bag per annum 21600000 bags
Production of raw material
Production Capacity KG
1st year 75% 108,000
2nd year 78% 112,320
3rd year 80% 115,200
4th year 83% 119,520
5th year 86% 123,840
6th year 90% 129,600
CALULATION OF CONSUMPTION OF RAW MATERIAL
Item Name At Capacity Quantity of Raw Material
(kg)
Raw Material 100% 144,000

Paper roll Raw Material Consumed
Capacity utilization
Rate per KG
Amount in Lacs
1st year 75% 30.00 32.40
2nd year 78% 31.50 35.38
3rd year 80% 33.08 38.10
4th year 83% 34.73 41.51
5th year 86% 36.47 45.16
6th year 90% 38.29 49.62
Consumables (glue etc.)
Raw Material Consumed
Capacity utilization
Cost on per KG paper
Amount in Lacs
1st year 75% 3.00 3.24
2nd year 78% 3.15 3.54
3rd year 80% 3.31 3.81
4th year 83% 3.47 4.15
5th year 86% 3.65 4.52
6th year 90% 3.83 4.96
COMPUTATION OF SALE
Particulars 1st year 2nd year 3rd year 4th year 5th year 6th year
Op Stock - 9,000 9,360 9,600 9,960 10,320
Production 108,000 112,320 115,200 119,520 123,840 129,600 Less : Closing Stock 9,000 9,360 9,600 9,960 10,320 10,800
Net Sale 99,000 111,960 114,960 119,160 123,480 129,120
Sale price per KG 44.00 46.20 48.51 50.94 53.48 56.16
sale value 43.56 51.73 55.77 60.69 66.04 72.51

BREAK UP OF LABOUR CHARGES
Particulars Wages No of Total Per Month Employees Salary
skilled 12000 1 12000
unskilled 9000 2 18000
Total Salary Per Month 30,000
Total Annual Labour Charges (in Lacs) 3.60
BREAK UP STAFF CHARGES
Particulars Wages No of Total
Per Month Employees Salary
helper 6000 1 6000
Total Salary Per Month 6,000
Total Annual Labour Charges (in Lacs) 0.72
Utility Charges (per month)
Particulars value Description
Power connection required 3 KWH
consumption per day 24 units
Consumption per month 600 units
Rate per Unit 10 Rs.
power Bill per month 6000 Rs.

PROJECTED PROFITABILITY STATEMENT
PARTICULARS 1st year 2nd year 3rd year 4th year 5th year 6th year
Capacity Utilization % 75% 78% 80% 83% 86% 90%
SALES Gross Sale Paper bag 43.56 51.73 55.77 60.69 66.04 72.51
Total 43.56 51.73 55.77 60.69 66.04 72.51
COST OF SALES
Raw Material Consumed 32.40 35.38 38.10 41.51 45.16 49.62
Electricity Expenses 0.72 0.79 0.87 0.96 1.05 1.16
Repair & Maintenance 0.22 0.26 0.28 0.30 0.33 0.36
Labour & Wages 3.60 3.96 4.36 4.79 5.27 5.27
Depreciation 1.01 0.86 0.74 0.63 0.53 0.46
Consumables & others 3.24 3.54 3.81 4.15 4.52 4.96
Cost of Production 41.19 44.79 48.15 52.34 56.86 61.83
Add: Opening Stock /WIP - 3.43 3.73 4.01 4.36 4.74
Less: Closing Stock /WIP 3.43 3.73 4.01 4.36 4.74 5.15
Cost of Sales 37.76 44.49 47.87 51.99 56.49 61.42
GROSS PROFIT 5.80 7.23 7.89 8.70 9.55 11.09
Gross Profit % 13% 14% 14% 14% 14% 15%
staff 0.72 0.79 0.87 0.96 1.05 1.16
Interest on Term Loan 0.51 0.44 0.31 0.18 0.05 -
Interest on working Capital 0.66 0.66 0.66 0.66 0.66 0.66
rent 1.20 1.26 1.32 1.39 1.46 1.53
Selling & Adm Expenses Exp. 0.44 0.52 0.56 0.61 0.66 0.73
TOTAL 3.52 3.67 3.72 3.79 3.88 4.08
NET PROFIT 2.28 3.56 4.17 4.91 5.67 7.01
Taxation 0.57 0.89 1.04 1.23 1.42 1.75
PROFIT (After Tax) 1.71 2.67 3.13 3.68 4.25 5.26

PROJECTED BALANCE SHEET
PARTICULARS 1st year
2nd year
3rd year
4th year
5th year
6th year
Liabilities
Capital
Opening Balance - 4.60 6.17 7.80 9.29 10.94
Add:- Addition 3.89 - - - - -
Add:-Profit During the Year 1.71 2.67 3.13 3.68 4.25 5.26
Less:- Drawings 1.00 1.10 1.50 2.20 2.60 4.50
Closing Balance 4.60 6.17 7.80 9.29 10.94 11.70
Term Loan 4.57 3.37 2.17 0.97 - -
Working Capital Limit 6.00 6.00 6.00 6.00 6.00 6.00
Sundry Creditors 1.08 1.18 1.27 1.38 1.51 1.65
Provisions & Other Liab 0.30 0.33 0.36 0.40 0.44 0.48
TOTAL : 16.55 17.05 17.60 18.04 18.88 19.84
Assets
Fixed Assets ( Gross) 6.89 6.89 6.89 6.89 6.89 6.89
Gross Dep. 1.01 1.88 2.61 3.24 3.77 4.23
Net Fixed Assets 5.88 5.01 4.28 3.65 3.12 2.66
Current Assets Sundry Debtors 3.63 4.31 4.65 5.06 5.50 6.04
Stock in Hand 6.13 6.68 7.19 7.82 8.50 9.29
Cash and Bank 0.91 1.04 1.49 1.50 1.76 1.84
TOTAL : 16.55 17.05 17.60 18.04 18.88 19.84

PROJECTED CASH FLOW STATEMENT
PARTICULARS 1st year
2nd year
3rd year
4th year
5th year
6th year
SOURCES OF FUND
Own Margin 3.89 Net Profit 2.28 3.56 4.17 4.91 5.67 7.01
Depreciation & Exp. W/off 1.01 0.86 0.74 0.63 0.53 0.46
Increase in Cash Credit 6.00 - - - - -
Increase In Term Loan 5.17 - - - - -
Increase in Creditors 1.08 0.10 0.09 0.11 0.12 0.15
Increase in Provisions & Oth lib 0.30 0.03 0.03 0.04 0.04 0.04
TOTAL : 19.73 4.55 5.03 5.69 6.37 7.66
APPLICATION OF FUND Increase in Fixed Assets 6.89 - - - - -
Increase in Stock 6.13 0.55 0.51 0.63 0.68 0.79
Increase in Debtors 3.63 0.68 0.34 0.41 0.45 0.54
Repayment of Term Loan 0.60 1.20 1.20 1.20 0.97 -
Taxation 0.57 0.89 1.04 1.23 1.42 1.75
Drawings 1.00 1.10 1.50 2.20 2.60 4.50
TOTAL : 18.82 4.42 4.59 5.67 6.11 7.58
Opening Cash & Bank Balance - 0.91 1.04 1.49 1.50 1.76
Add : Surplus 0.91 0.13 0.44 0.02 0.25 0.08
Closing Cash & Bank Balance 0.91 1.04 1.49 1.50 1.76 1.84

COMPUTATION OF CLOSING STOCK & WORKING CAPITAL
PARTICULARS 1st year 2nd year 3rd year 4th year 5th year 6th year
Finished Goods
(1 months requirement) 3.43 3.73 4.01 4.36 4.74 5.15
Raw Material
(1 months requirement) 2.70 2.95 3.18 3.46 3.76 4.14
Closing Stock 6.13 6.68 7.19 7.82 8.50 9.29
COMPUTATION OF WORKING CAPITAL REQUIREMENT
TRADITIONAL METHOD
Particulars Amount Own Margin Bank Finance
Finished Goods & Raw Material Stock
6.13
Less : Creditors 1.08
Paid stock 5.05 25% 1.26 75% 3.79
Sundry Debtors 3.63 25% 0.91 75% 2.72
8.68 2.17 6.51
WORKING CAPITAL LIMIT DEMAND ( from Bank) 6.00
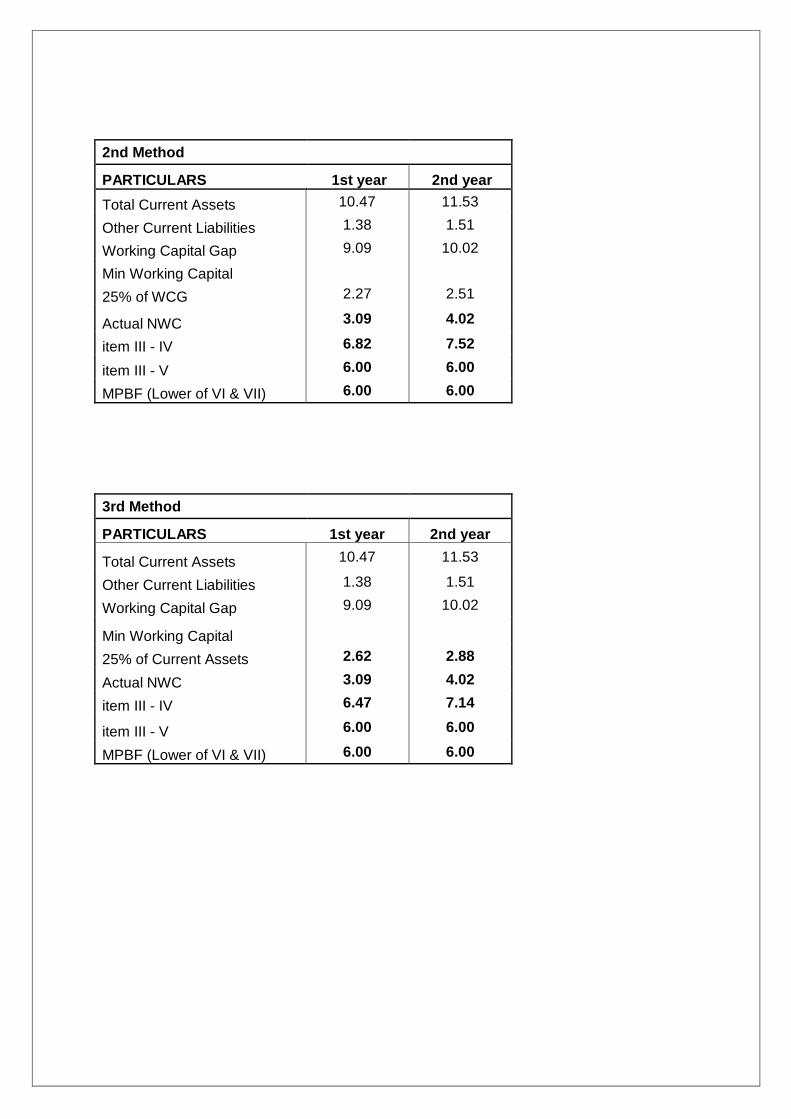
2nd Method
PARTICULARS 1st year 2nd year
Total Current Assets 10.47 11.53
Other Current Liabilities 1.38 1.51
Working Capital Gap 9.09 10.02
Min Working Capital
25% of WCG 2.27 2.51
Actual NWC 3.09 4.02
item III - IV 6.82 7.52
item III - V 6.00 6.00
MPBF (Lower of VI & VII) 6.00 6.00
3rd Method
PARTICULARS 1st year 2nd year
Total Current Assets 10.47 11.53
Other Current Liabilities 1.38 1.51
Working Capital Gap 9.09 10.02
Min Working Capital
25% of Current Assets 2.62 2.88
Actual NWC 3.09 4.02
item III - IV 6.47 7.14
item III - V 6.00 6.00
MPBF (Lower of VI & VII) 6.00 6.00
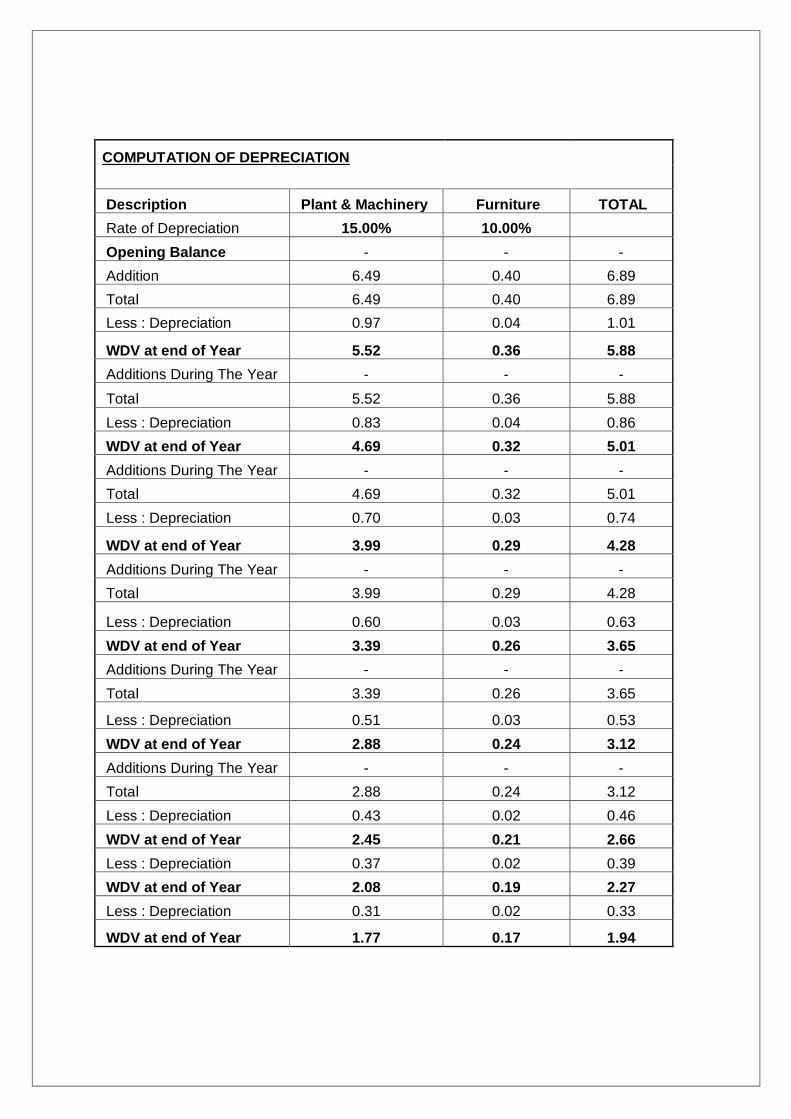
COMPUTATION OF DEPRECIATION
Description Plant & Machinery Furniture TOTAL
Rate of Depreciation 15.00% 10.00%
Opening Balance - - -
Addition 6.49 0.40 6.89
Total 6.49 0.40 6.89
Less : Depreciation 0.97 0.04 1.01
WDV at end of Year 5.52 0.36 5.88
Additions During The Year - - -
Total 5.52 0.36 5.88
Less : Depreciation 0.83 0.04 0.86
WDV at end of Year 4.69 0.32 5.01
Additions During The Year - - -
Total 4.69 0.32 5.01
Less : Depreciation 0.70 0.03 0.74
WDV at end of Year 3.99 0.29 4.28
Additions During The Year - - -
Total 3.99 0.29 4.28
Less : Depreciation 0.60 0.03 0.63
WDV at end of Year 3.39 0.26 3.65
Additions During The Year - - -
Total 3.39 0.26 3.65
Less : Depreciation 0.51 0.03 0.53
WDV at end of Year 2.88 0.24 3.12
Additions During The Year - - -
Total 2.88 0.24 3.12
Less : Depreciation 0.43 0.02 0.46
WDV at end of Year 2.45 0.21 2.66
Less : Depreciation 0.37 0.02 0.39
WDV at end of Year 2.08 0.19 2.27
Less : Depreciation 0.31 0.02 0.33
WDV at end of Year 1.77 0.17 1.94

CALCULATION OF D.S.C.R
PARTICULARS 1st year
2nd year
3rd year
4th year
5th year
CASH ACCRUALS
2.72
3.53
3.86
4.31
4.79
Interest on Term Loan
0.51
0.44
0.31
0.18
0.05
Total
3.23
3.98
4.17
4.49
4.84
REPAYMENT
Installment of Term Loan
0.60
1.20
1.20
1.20
0.97
Interest on Term Loan
0.51
0.44
0.31
0.18
0.05
Total
1.11
1.64
1.51
1.38
1.02
DEBT SERVICE COVERAGE RATIO 2.92 2.42 2.76 3.26 4.75
AVERAGE D.S.C.R.
3.22

REPAYMENT SCHEDULE OF TERM LOAN Interest 11.00%
Year Particulars Amount Addition Total Interest Repayment Closing Balance
1st Opening Balance
1st month - 5.17 5.17 - - 5.17 2nd month 5.17 - 5.17 0.05 - 5.17 3rd month 5.17 - 5.17 0.05 - 5.17 4th month 5.17 - 5.17 0.05 - 5.17 5th month 5.17 - 5.17 0.05 - 5.17 6th month 5.17 - 5.17 0.05 - 5.17 7th month 5.17 - 5.17 0.05 0.10 5.07 8th month 5.07 - 5.07 0.05 0.10 4.97 9th month 4.97 - 4.97 0.05 0.10 4.87
10th month 4.87 - 4.87 0.04 0.10 4.77 11th month 4.77 - 4.77 0.04 0.10 4.67 12th month 4.67 - 4.67 0.04 0.10 4.57
0.51 0.60
2nd Opening Balance
1st month 4.57 - 4.57 0.04 0.10 4.47 2nd month 4.47 - 4.47 0.04 0.10 4.37 3rd month 4.37 - 4.37 0.04 0.10 4.27 4th month 4.27 - 4.27 0.04 0.10 4.17 5th month 4.17 - 4.17 0.04 0.10 4.07 6th month 4.07 - 4.07 0.04 0.10 3.97 7th month 3.97 - 3.97 0.04 0.10 3.87 8th month 3.87 - 3.87 0.04 0.10 3.77 9th month 3.77 - 3.77 0.03 0.10 3.67
10th month 3.67 - 3.67 0.03 0.10 3.57 11th month 3.57 - 3.57 0.03 0.10 3.47 12th month 3.47 - 3.47 0.03 0.10 3.37
0.44 1.20
3rd Opening Balance
1st month 3.37 - 3.37 0.03 0.10 3.27 2nd month 3.27 - 3.27 0.03 0.10 3.17 3rd month 3.17 - 3.17 0.03 0.10 3.07 4th month 3.07 - 3.07 0.03 0.10 2.97 5th month 2.97 - 2.97 0.03 0.10 2.87 6th month 2.87 - 2.87 0.03 0.10 2.77 7th month 2.77 - 2.77 0.03 0.10 2.67 8th month 2.67 - 2.67 0.02 0.10 2.57 9th month 2.57 - 2.57 0.02 0.10 2.47
10th month 2.47 - 2.47 0.02 0.10 2.37 11th month 2.37 - 2.37 0.02 0.10 2.27 12th month 2.27 - 2.27 0.02 0.10 2.17
0.31 1.20
4th Opening Balance
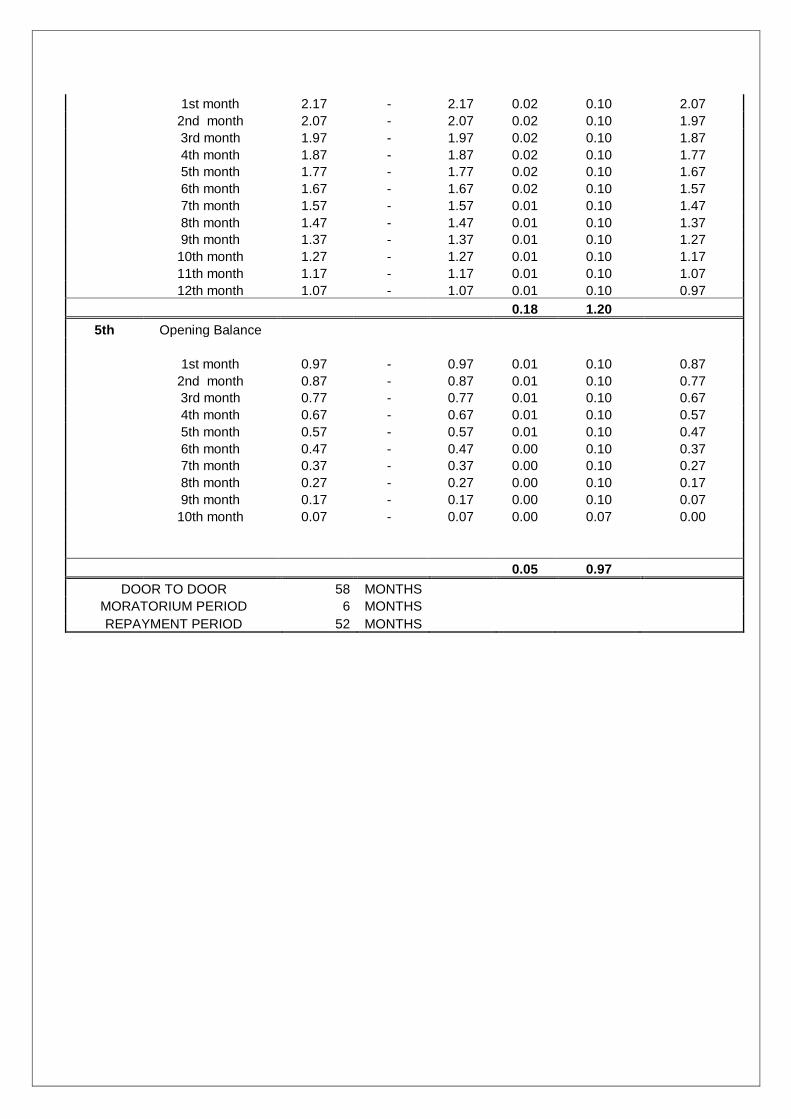
1st month 2.17 - 2.17 0.02 0.10 2.07 2nd month 2.07 - 2.07 0.02 0.10 1.97 3rd month 1.97 - 1.97 0.02 0.10 1.87 4th month 1.87 - 1.87 0.02 0.10 1.77 5th month 1.77 - 1.77 0.02 0.10 1.67 6th month 1.67 - 1.67 0.02 0.10 1.57 7th month 1.57 - 1.57 0.01 0.10 1.47 8th month 1.47 - 1.47 0.01 0.10 1.37 9th month 1.37 - 1.37 0.01 0.10 1.27
10th month 1.27 - 1.27 0.01 0.10 1.17 11th month 1.17 - 1.17 0.01 0.10 1.07 12th month 1.07 - 1.07 0.01 0.10 0.97
0.18 1.20
5th Opening Balance
1st month 0.97 - 0.97 0.01 0.10 0.87 2nd month 0.87 - 0.87 0.01 0.10 0.77 3rd month 0.77 - 0.77 0.01 0.10 0.67 4th month 0.67 - 0.67 0.01 0.10 0.57 5th month 0.57 - 0.57 0.01 0.10 0.47 6th month 0.47 - 0.47 0.00 0.10 0.37 7th month 0.37 - 0.37 0.00 0.10 0.27 8th month 0.27 - 0.27 0.00 0.10 0.17 9th month 0.17 - 0.17 0.00 0.10 0.07
10th month 0.07 - 0.07 0.00 0.07 0.00
0.05 0.97
DOOR TO DOOR 58 MONTHS MORATORIUM PERIOD 6 MONTHS REPAYMENT PERIOD 52 MONTHS

DISCLAIMER
The views expressed in this Project Report are advisory in nature. SAMADHAN assume no financial liability to anyone using the content for any purpose. All the materials and content
contained in Project report is for educational purpose and reflect the views of the industry
which are drawn from various research material sources from internet, experts, suppliers and
various other sources. The actual cost of the project or industry will have to be taken on case
to case basis considering specific requirement of the project, capacity and type of plant and
other specific factors/cost directly related to the implementation of project. It is intended for
general guidance only and must not be considered a substitute for a competent legal advice
provided by a licensed industry professional. SAMADHAN hereby disclaims any and all
liability to any party for any direct, indirect, implied, punitive, special, incidental or other
consequential damages arising directly or indirectly from any use of the Project Report
Content, which is provided as is, and without warranties.


![Awdrrtr]@ffi. - KVIC](https://static.fdokumen.com/doc/165x107/631d5607b8a98572c10d504e/awdrrtrffi-kvic.jpg)