Fast splice site detection using information content and feature reduction
Upload
independentCategory
view
4download
0
FEBS Letters 588 (2014) 1637–1643
journal homepage: www.FEBSLetters .org
Detection and quantification of alternative splice sites in Arabidopsisgenes AtDCL2 and AtPTB2 with highly sensitive surface enhanced Ramanspectroscopy (SERS) and gold nanoprobes
http://dx.doi.org/10.1016/j.febslet.2014.02.0610014-5793/Published by Elsevier B.V. on behalf of the Federation of European Biochemical Societies.
⇑ Corresponding author at: Department of Agricultural and Biological Engineer-ing, Purdue University, 225 South University Street, ABE 215, West Lafayette, IN47907, United States. Fax: +1 765 496 1115.
E-mail address: [email protected] (J. lrudayaraj).
Ulhas S. Kadam a,b,c, Burkhard Schulz b, Joseph lrudayaraj a,c,⇑a Agricultural and Biological Engineering, Purdue University, West Lafayette, IN 47907, United Statesb Horticulture and Landscape Architecture, Purdue University, West Lafayette, IN 47907, United Statesc Bindley Bioscience Center at Discovery Park, West Lafayette, IN 47907, United States
a r t i c l e i n f o
Article history:Received 31 January 2014Accepted 28 February 2014Available online 12 March 2014
Edited by Michael R. Sussman
Keywords:Raman spectroscopyAlternative splicingGold-nanoprobemRNAArabidopsis thaliana
a b s t r a c t
Alternative splicing (AS) increases the size of the transcriptome and proteome to enhance the phys-iological capacity of cells. We demonstrate surface enhanced Raman spectroscopy (SERS) in combi-nation with a DNA hybridization analytical platform to identify and quantify AS genes in plants. ASin AtDCL2 and AtPTB2 were investigated using non-fluorescent Raman probes using a ‘sandwichassay’. Utilizing Raman probes conjugated to gold nanoparticles we demonstrate the recognitionof RNA sequences specific to AtDCL2 and AtPTB2 splice junction variants with detection sensitivityof up to 0.1 fM.
Published by Elsevier B.V. on behalf of the Federation of European Biochemical Societies.
1. Introduction
Alternative splicing (AS) is a process which generates differentmature mRNAs from a single pre-mRNA by varying splice sites.AS expands the information content of eukaryotic genomes andcan affect the stability and translation efficiency of mRNA [1,2].AS has been implicated in diseases such as cancer [3]. In mammals,a number of genes undergo AS, which results in the expansion ofthe protein repertoire encoded by the respective genome. This pro-cess creates novel functions by affecting the structure of proteins.Additionally, interaction with different protein partners due to therearrangement of interactive surfaces can be modified by AS [4]. AShas been well studied in model animals as a post-transcriptionalgene regulation strategy to increase transcriptome and the prote-ome variability for added physiological function [5], but its rolein plants is less understood.
AS analysis in plants has been documented on only a few occa-sions [2,6–9], even though the first discovery of AS was reported 25
years ago in a rubisco activase gene [6]. Until now, most reportshave mapped AS in plant genes but have rarely explored it in aquantitative manner. The significance of AS in plants has been amatter of debate and the number of genes subjected to AS wereconsidered negligible by many researchers. Global gene expressionstudies using RNA-seq and the availability of transcriptome se-quence databases showed that AS in plants is highly significant[10,11]. Interestingly, reports on AS in plants have increased overthe last few years due to improved RNA analysis technology. From2003 [12] until 2012 [13], new technologies increased the detec-tion of AS from 1.2% to 61% of all genes of the Arabidopsis genome.The quantification of AS has improved due to read counts in RNA-seq experiments, but still depends on the depth of sequencing andthe efficiency of cDNA synthesis and sequencing [14].
The availability of EST databases has enabled scientists to iden-tify AS through alignments of ESTs to reference genomes [1,15].This procedure has been used for the generation of AS databasesfor many mammals [16]. However, Expressed Sequence Tags(EST) sequencing is often biased toward the 30 and 50 ends of mRNAtranscripts. Further, there is limited coverage of ESTs or cDNAs ofsequenced transcripts from certain cell or tissue types or under de-fined environmental conditions to infer occurrence of AS [4]. Somelimitations inherent in the analysis of EST/cDNA have been

1638 U.S. Kadam et al. / FEBS Letters 588 (2014) 1637–1643
overcome by the development of custom microarrays as well as bydifferential hybridization techniques, which permit large-scaleprofiling of AS [4,5,17]. AS microarrays are often based on sets ofanchored oligonucleotide probes, which typically combine probesspecific to individual exons and/or splice-junction sequencesformed by inclusion or skipping of exons and retention of introns.This format permitted the discovery of new AS events not previ-ously detected [17]. However, this approach cannot be appliedfor gene specific analysis of AS events in a quantitative manneras the sensitivity of microarray hybridization is very limited dueto the dependence on the fluorescence signal and the detectionmodality. Quantification of bound molecules is therefore only pos-sible for a limited range of detection. In addition, the distinction ofdifferent hybridized AS variant RNA molecules is sometimes notpossible as different AS variants contain identical sequencestretches that overlap.
To address these challenges, a SERS-based mRNA monitoringstrategy holds promise because of its flexibility in multiplexingand potential for highly sensitive detection of rare RNAs [18].The use of chemically characterized, non-fluorescent Ramanprobes makes accurate quantification of AS transcripts possible[19]. Raman nanoprobes can be designed for quantification dueto their high reproducibility and homogeneous surface enhance-ment. With current methods, nearly uniform enhancement is pos-sible and is a significant step in SERS-based quantification. Further,SERS-based quantification has the potential to be more sensitivethan fluorescence based assays [20–22].
Here, we integrate principles of nanotechnology, Raman spec-troscopy and genetics to develop a highly sensitive RNA detectionsystem for plants. The evidence for AS’s biological significance isbecoming stronger as more cases of AS are being reported in plants[2]. Conventional methods to assess and quantify AS rely on tech-nology that is less sensitive, such as RNA hybridization based onfluorescent readouts, or methods with cumulative error duringamplification steps via PCR, such as RNA-seq. We consider thehybridization step-based detection and quantification, which doesnot rely on enzymatic activities during amplification and sequenc-ing processes found in many RNA-seq approaches, an advantage interms of reliability of the method. Even new developments such asSingle Molecule Real-Time DNA Sequencing (SMRT DNA Sequenc-ing) found in the next generation sequencing methods from PacificBiosciences utilize (PacBio RS) immobilized DNA polymerases.SERS-based detection and quantification of AS and rare mRNAs willsignificantly enhance research in plant gene regulation. Quantifica-tion and testing of AS in plants in a multiplex format will also allowprocess automation to help address unanswered questions in plantbiology. SERS-based AS analysis is a promising method because ofmultiplexing capability, high specificity, and sensitivity. SingleSERS experiments allow targeted approaches, with ability to probea smaller number of genes and do not require a genome-wide ap-proach, which often produces a vast amount of data, which needsextensive analysis and an expert team of bioinformaticians. Theproposed method was developed using well-characterized SERS-substrates and non-fluorescent Raman probes with unique andnarrow spectral peaks. The narrow spectral widths are useful to re-duce the cross-talk among Raman probes, could resolve spectralinteractions to within 10 nm and hence could be exploited for mul-tiplex detection unlike fluorescent probes, whose peaks are verybroad. Recent progress in nanomaterials for SERS substrate synthe-sis using gold nanoparticles (AuNPs) and nano-conjugation strate-gies have made a highly uniform and reproducible enhancementpossible. SERS-based detection of DNA or RNA has been shown tobe highly specific and sensitive compared to fluorescence assays[21,23].
This innovative approach of SERS-based array format could cap-italize on the availability of numerous non-fluorescent probes with
distinct Raman spectra and the assay can be performed at a frac-tion of the cost of fluorescence assays. The Raman fingerprint iscapable of identifying each non-fluorescent label at a resolutionof 10 nm, whereas bandwidth of fluorescence spectra is 100–300 nm and that of quantum dots is 40–50 nm [24]. Quantificationat femto-molar concentration and single molecule sensitivity en-ables the detection of rare splice variants, which otherwise goundetected in traditional approaches.
We investigated AS in two genes, AtDCL2 and AtPTB2, which arehighly significant in plant developmental and RNA biology. DICER-LIKE (DCL) genes are dedicated to function in small RNA regulationvia RNA interference [25]. DCL2 is a regulator of siRNAs and has akey role in plant egg cell development. It guides mRNAs to nucle-ase digestion or translational inhibition. AtDCL2 acts as the triggerfor siRNA biogenesis or RNAi pathways in the egg cell and is re-quired for egg cell maturation, fertilization, and embryogenesis[26].
Polypyrimidine tract-binding protein (PTB) was identified as anuclear-localized splicing factor that specifically binds to polypy-rimidine tracts within pre-mRNA introns [27]. AtPTB2 influencessplice site selection and coordination of splicing events. We ana-lyzed AS of AtPTB2 and provide evidence of its auto-regulation ofAS [28]. Arabidopsis PTB homologues are subject to extensive auto-and cross-regulation via AS-coupled nonsense mediated decay,thereby establishing their significance in gene expression by regu-lating AS events [29,30]. PTB represents a regulatory link betweenRNAs and a variety of cellular factors in both, the nucleus and cyto-plasm. PTB is critical for growth, development, and reproductionincluding pollen germination. It functions as regulator of cell dif-ferentiation and development [31]. PTB is involved in RNA metab-olism and is the most studied regulator of AS. Additionally, PTBsappear to function as RNA chaperons, resulting in the attainmentof the correct functional conformation of IRES (internal ribosomeentry segment) [31,32]. PTB functions in site-specific intracellularlocalization and sorting of mRNA and in controlling the stabilityof mRNA via binding to pyrimidine tract binding sites within 50-and 30-untranslated regions [33].
2. Materials and methods
2.1. Chemicals
DNA oligonucleotides obtained from IDT-DNA (Coralville, IA).Gold(lll)-chloride trihydrate, tris(2-carboxyethyl)phosphinehydrochloride (TCEP), Tween-20, trisodium citrate dehydrate, Na-EDTA were obtained from Sigma–Aldrich (St. Louis, MO). Otherchemicals used in this study were obtained from Purdue Universitystores.
2.2. Hybridization of mRNA to ssDNA targets
Total RNA was extracted from 100 mg of leaf tissue from 4 to5 week old plants grown under greenhouse conditions. The qualityof extracted RNA was tested using 2% Agarose gel electrophoresis[34,35]. RNA quality was validated using the Agilent 2100 Bioana-lyzer (Agilent Technologies, Inc.). The total RNA was quantified andchecked for quality with a NanoDrop 2000c photometer (ThermoScientific, Wilmington, DE). To remove any DNA contaminationsthe DNA-Free RNA Kit (R1013) from Zymo Research, Irvine, CAwas used. Total RNA was incubated for 30 min at 37 �C with DNaseI component of the kit and cleaned up after incubation with Zymo-Spin IC columns according to the provided protocol. Successful re-moval of DNA contaminations was tested using intron-specificprimers via RT-PCR. A hybridization cocktail of 30 lL was preparedas follows: (20 lL of DNase-treated total-RNA, 9 lL of a 3�
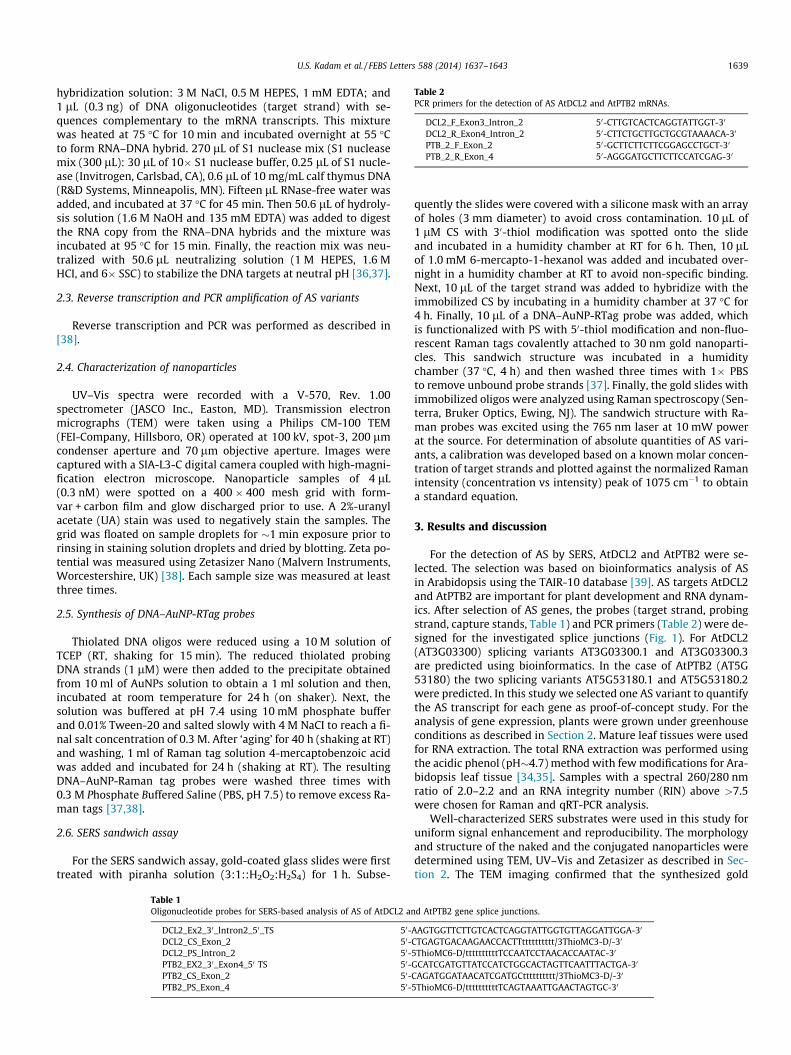
Table 2PCR primers for the detection of AS AtDCL2 and AtPTB2 mRNAs.
DCL2_F_Exon3_lntron_2 50-CTTGTCACTCAGGTATTGGT-30
DCL2_R_Exon4_Intron_2 50-CTTCTGCTTGCTGCGTAAAACA-30
PTB_2_F_Exon_2 50-GCTTCTTCTTCGGAGCCTGCT-30
PTB_2_R_Exon_4 50-AGGGATGCTTCTTCCATCGAG-30
U.S. Kadam et al. / FEBS Letters 588 (2014) 1637–1643 1639
hybridization solution: 3 M NaCI, 0.5 M HEPES, 1 mM EDTA; and1 lL (0.3 ng) of DNA oligonucleotides (target strand) with se-quences complementary to the mRNA transcripts. This mixturewas heated at 75 �C for 10 min and incubated overnight at 55 �Cto form RNA–DNA hybrid. 270 lL of S1 nuclease mix (S1 nucleasemix (300 lL): 30 lL of 10� S1 nuclease buffer, 0.25 lL of S1 nucle-ase (Invitrogen, Carlsbad, CA), 0.6 lL of 10 mg/mL calf thymus DNA(R&D Systems, Minneapolis, MN). Fifteen lL RNase-free water wasadded, and incubated at 37 �C for 45 min. Then 50.6 lL of hydroly-sis solution (1.6 M NaOH and 135 mM EDTA) was added to digestthe RNA copy from the RNA–DNA hybrids and the mixture wasincubated at 95 �C for 15 min. Finally, the reaction mix was neu-tralized with 50.6 lL neutralizing solution (1 M HEPES, 1.6 MHCI, and 6� SSC) to stabilize the DNA targets at neutral pH [36,37].
2.3. Reverse transcription and PCR amplification of AS variants
Reverse transcription and PCR was performed as described in[38].
2.4. Characterization of nanoparticles
UV–Vis spectra were recorded with a V-570, Rev. 1.00spectrometer (JASCO Inc., Easton, MD). Transmission electronmicrographs (TEM) were taken using a Philips CM-100 TEM(FEI-Company, Hillsboro, OR) operated at 100 kV, spot-3, 200 lmcondenser aperture and 70 lm objective aperture. Images werecaptured with a SIA-L3-C digital camera coupled with high-magni-fication electron microscope. Nanoparticle samples of 4 lL(0.3 nM) were spotted on a 400 � 400 mesh grid with form-var + carbon film and glow discharged prior to use. A 2%-uranylacetate (UA) stain was used to negatively stain the samples. Thegrid was floated on sample droplets for �1 min exposure prior torinsing in staining solution droplets and dried by blotting. Zeta po-tential was measured using Zetasizer Nano (Malvern Instruments,Worcestershire, UK) [38]. Each sample size was measured at leastthree times.
2.5. Synthesis of DNA–AuNP-RTag probes
Thiolated DNA oligos were reduced using a 10 M solution ofTCEP (RT, shaking for 15 min). The reduced thiolated probingDNA strands (1 lM) were then added to the precipitate obtainedfrom 10 ml of AuNPs solution to obtain a 1 ml solution and then,incubated at room temperature for 24 h (on shaker). Next, thesolution was buffered at pH 7.4 using 10 mM phosphate bufferand 0.01% Tween-20 and salted slowly with 4 M NaCI to reach a fi-nal salt concentration of 0.3 M. After ‘aging’ for 40 h (shaking at RT)and washing, 1 ml of Raman tag solution 4-mercaptobenzoic acidwas added and incubated for 24 h (shaking at RT). The resultingDNA–AuNP-Raman tag probes were washed three times with0.3 M Phosphate Buffered Saline (PBS, pH 7.5) to remove excess Ra-man tags [37,38].
2.6. SERS sandwich assay
For the SERS sandwich assay, gold-coated glass slides were firsttreated with piranha solution (3:1::H2O2:H2S4) for 1 h. Subse-
Table 1Oligonucleotide probes for SERS-based analysis of AS of AtDCL2 an
DCL2_Ex2_30_lntron2_50_TS 50-DCL2_CS_Exon_2 50-DCL2_PS_lntron_2 50-PTB2_EX2_30_Exon4_50 TS 50-PTB2_CS_Exon_2 50-PTB2_PS_Exon_4 50-
quently the slides were covered with a silicone mask with an arrayof holes (3 mm diameter) to avoid cross contamination. 10 lL of1 lM CS with 30-thiol modification was spotted onto the slideand incubated in a humidity chamber at RT for 6 h. Then, 10 lLof 1.0 mM 6-mercapto-1-hexanol was added and incubated over-night in a humidity chamber at RT to avoid non-specific binding.Next, 10 lL of the target strand was added to hybridize with theimmobilized CS by incubating in a humidity chamber at 37 �C for4 h. Finally, 10 lL of a DNA–AuNP-RTag probe was added, whichis functionalized with PS with 50-thiol modification and non-fluo-rescent Raman tags covalently attached to 30 nm gold nanoparti-cles. This sandwich structure was incubated in a humiditychamber (37 �C, 4 h) and then washed three times with 1� PBSto remove unbound probe strands [37]. Finally, the gold slides withimmobilized oligos were analyzed using Raman spectroscopy (Sen-terra, Bruker Optics, Ewing, NJ). The sandwich structure with Ra-man probes was excited using the 765 nm laser at 10 mW powerat the source. For determination of absolute quantities of AS vari-ants, a calibration was developed based on a known molar concen-tration of target strands and plotted against the normalized Ramanintensity (concentration vs intensity) peak of 1075 cm�1 to obtaina standard equation.
3. Results and discussion
For the detection of AS by SERS, AtDCL2 and AtPTB2 were se-lected. The selection was based on bioinformatics analysis of ASin Arabidopsis using the TAIR-10 database [39]. AS targets AtDCL2and AtPTB2 are important for plant development and RNA dynam-ics. After selection of AS genes, the probes (target strand, probingstrand, capture stands, Table 1) and PCR primers (Table 2) were de-signed for the investigated splice junctions (Fig. 1). For AtDCL2(AT3G03300) splicing variants AT3G03300.1 and AT3G03300.3are predicted using bioinformatics. In the case of AtPTB2 (AT5G53180) the two splicing variants AT5G53180.1 and AT5G53180.2were predicted. In this study we selected one AS variant to quantifythe AS transcript for each gene as proof-of-concept study. For theanalysis of gene expression, plants were grown under greenhouseconditions as described in Section 2. Mature leaf tissues were usedfor RNA extraction. The total RNA extraction was performed usingthe acidic phenol (pH�4.7) method with few modifications for Ara-bidopsis leaf tissue [34,35]. Samples with a spectral 260/280 nmratio of 2.0–2.2 and an RNA integrity number (RIN) above >7.5were chosen for Raman and qRT-PCR analysis.
Well-characterized SERS substrates were used in this study foruniform signal enhancement and reproducibility. The morphologyand structure of the naked and the conjugated nanoparticles weredetermined using TEM, UV–Vis and Zetasizer as described in Sec-tion 2. The TEM imaging confirmed that the synthesized gold
d AtPTB2 gene splice junctions.
AAGTGGTTCTTGTCACTCAGGTATTGGTGTTAGGATTGGA-30
CTGAGTGACAAGAACCACTTtttttttttt/3ThioMC3-D/-30
5ThioMC6-D/ttttttttttTCCAATCCTAACACCAATAC-30
GCATCGATGTTATCCATCTGGCACTAGTTCAATTTACTGA-30
CAGATGGATAACATCGATGCtttttttttt/3ThioMC3-D/-30
5ThioMC6-D/ttttttttttTCAGTAAATTGAACTAGTGC-30

Fig. 1. Structure of alternatively spliced Arabidopsis genes AtDCL2 (A) and AtPTB2 (B). AtDCL2 shows intron retention of the second intron (blue and marked with a redcircle). AtPTB2 shows exon skipping of the third exon (marked with a red circle). Exons are depicted as dark-green (AtDCL2) and light green (AtPTB2) boxes. Introns areindicated as black lines. 50 and 30 end of the mRNAs is indicated.
A. AuNP B. AuNP-DNA conjugates
Fig. 2. TEM images of gold nanoparticles before (A) and after (B) conjugation with thiolated ssDNA oligonucleotides.
1640 U.S. Kadam et al. / FEBS Letters 588 (2014) 1637–1643
nanoparticles used were spherical in shape and the size was pre-dominantly around 30 nm (Fig. 2). Further, 2% uranyl acetate-trea-ted AuNPs showed a clear white layer of 1–2 nm thickness ofthiolated ssDNA surrounding the particles (Fig. 2b). The UV–Visspectra of AuNPs before (peak at 530 nm) and after conjugationwith DNA (peak at 539 nm) was acquired to validate the conjuga-tion of DNA (Fig. SI1). The UV–visible spectrum shows a ‘red shift’as a function of increase in size and change in absorption. Addition-ally, Zeta-potential (f) of AuNPs was measured to confirm the cova-lent attachment of thiolated oligos. The stability and functionalityof AuNP–DNA complex can be assessed by measuring the surfacecharge and ionic conditions of the surrounding microenvironment.f is routinely used to assess nanoparticle stability and confirm itssuccessful conjugation. Therefore, it is important to quantifythe surface charge distribution of the AuNP–DNA conjugate. Forstable gold nanoparticle solution, a f-value of �15 to�40 is accept-able depending on the size and buffer solution. The nanoparticlesolution used in this study possessed a f-value of �21 mV and�36.5 mV before and after ssDNA conjugation, respectively. Thisconfirms the interaction of the conjugate with other substrates un-der study [40,41].
A description of the steps involved in SERS analysis of mRNAtranscripts is shown in Fig. 3. The detection of mRNAs is basedon three principles: (a) mechanism of DNA–RNA hybridization(‘Watson-Crick’ base-pairing) to capture mRNA transcripts, (b)degradation of un-hybridized ssDNA target probe and degradationof RNA molecules, and (c) biophysical basis of surface enhance-ment by nanoprobes (DNA–AuNP-RTag) to amplify the specific sig-nal. A calibration curve was constructed using gold-coated glassslides, thiolated oligos, and SERS nanoprobes to construct the‘sandwich structure’ with known target concentrations. The slideswere covered with silicone masks to make an array of trays(�3 mm diameter) to load the samples and avoid cross contamina-tion between samples. The thiolated capturing strand (10 nM) withsequence complementary to the downstream half of the targetstrand was immobilized to the well via strong ‘gold-sulfur’ cova-lent interaction [38,42]. Unbound gold slide surfaces were coveredwith a layer of the blocking agent 6-mercaptohexanol to avoidnon-specific binding of the Raman probes [36,37,43]. Subsequentlythe target strands were hybridized to capturing strands throughhydrogen bonding to complementary nucleotides. Finally, theprobing strand comprising of DNA–AuNP-RTag conjugate was

A.
B.
Fig. 3. Schematic representation of workflow of SERS-based quantification of AS variants in AtDCL2 and AtPTB2. (A) Substrates used in this assay: target strand, capturestrand, probing strand, AuNP (gold nanoparticle), and 4-mercaptobenzoic acid (Raman probe, shown as glow around AuNPs). (B) Steps involved in constructing ‘sandwichstructure’ and acquisition of Raman signal (1) total RNA extracted from leaves, (2) capture of target AS variants by formation RNA–DNA hybrid and digestion of the non-hybridized portion by S1 nuclease and RNA by alkaline hydrolysis, (3) representative AS variant (AtDCL2, target strand), (4) ‘‘array format sandwich structure’’ for SERSdetection, and (5) Raman signal.
0
2000
4000
6000
8000
10000
12000
14000y = 4.609ln(x) - 59.426
R² = 0.9182R
aman
Inte
nsity
(A.U
.)
Target ssDNA concentration (M)
Control 10-16 10-14 10-12 10-10 10-8
(AtDCL2 ssDNA target strand, in Molarity)
Fig. 4. The histogram shows the peak intensity at 1075 cm�1 (Raman shift) ofcontrol DNA ranging from 0.1 fM to 10 nM concentrations of target strands. Inset:calibration curve obtained for the quantification of target strands.
U.S. Kadam et al. / FEBS Letters 588 (2014) 1637–1643 1641
hybridized to the upstream half of the target strand to completethe sandwich structure.
A series of target strand concentrations, ranging from 10 nM to0.10 fM was used to develop a standard curve and to determine thedetection limit. 4-mercaptobenzoic acid, a non-fluorescent Ramantag was used. The Raman spectra of gold nanoprobes conjugated to4-mercaptobenzoic acid were acquired and a Raman shift peak of1075 cm�1 was chosen as a characteristic peak for further analysis(Fig. 4). After acquisition of the spectra, ‘baseline correction’ ofeach spectrum was performed using OPUS 6.0 software (BrukerOptics, Inc.). The plasmon–phonon band (180 to 230 cm�1) was ap-plied as a self-referencing internal standard [44]. The correctedcharacteristic peak (l1075) (Figs. 4 and 5) was normalized againstthe corrected plasmon–phonon band ðl�220Þ, i.e., jn ¼ l1075=l220. Asimilar normalization process was performed with control sampleswithout TS, the ln obtained for controls was subtracted from thesamples used in calibration. Such ‘plasmon–phonon’ based calibra-tion procedure corrects for individual nanoparticle distribution andaggregation variability. At least five spectral replications were usedfor each analysis and separately normalized. The data points werefitted (R2 = 0.91) with the signal from the MBA Raman probe at1075 cm�1 (Figs. 4 and 5). The calibration method for the ‘sand-wich assay’ compensates for all the factors, such as gold surfacefeatures, size dependency and RTag variations involved in samplepreparation and detection [44].
For the qualitative validation of these results, RT-PCR was usedto compare the expression of splice junctions in AtDCL2 andAtPTB2. Primers for these splice junctions were designed for spe-cific splice junction variants. The quantification results presentedin Table 3 show the detection of AS variants of AtDCL2 at 6.72pM and AtPTB2 34.67 pM, respectively. Though sensitivity of ourapproach is excellent, it heavily is dependent on prior knowledgeof target sequences. The quantification shows a higher expressionof AtPTB2 than AtDCL2, which confirms the results from micro-array hybridization expression profiles of respective genesavailable from the Genevestigator (For AT3G03300: 102.2 E.U.using array element 258863_AT; 248.3 E.U. using array element258848_AT and for AT5G53180: 328.9 E.U. using array element248304_AT) [45] and eFP Browser (73.2 E.U. for AT3G03300 and128.4 E.U. for AT5G53180) [46] databases.
Plant developmental processes such as flowering, circadianrhythms or hormonal responses are regulated by AS [47,48]. Thesame can be found for responses to temperature, light and patho-gens. It may be that a number of processes have not yet been iden-tified due to the insufficient sensitivity of detection methods forrare mRNA splice variants. However, the increased number of ASgenes signifies its impact in plant biology. Although the availabilityof EST and cDNA databases in plants has not yet reached the levelof coverage for animal systems [4,49], the number of cases of AShave increased with improved sequencing technology and withmore advanced data analysis tools [8–10,13,50]. Modifications ofthe described approach can also be used for the identificationand quantification of other regulatory RNAs such small RNAs andmicro-RNAs in plants at high sensitivity. Furthermore, our ap-proach could be adopted for specific target sequences from anyorganism including bacteria, viruses, animals, and fungi.

0
500
1000
1500
2000
2500
400 600 800 1000 1200 1400 1600
Ram
an In
tens
ity (a
.u.)
Raman Shift (cm-1)
DCL2
PTB2
1498
2141
DCL2 PTB2
Fig. 5. Illustrative Raman spectra of AS transcripts obtained for AtDCL2 (blue) and AtPTB2 (red) from Arabidopsis leaf tissue. The inset shows a comparison of the peaks at1075 cm�1.
Table 3Quantification of described AS variants in AtDCL2 and AtPTB2 from Arabidopsis.
AS target Raman Intensity (AU) Absolute concentration (pM)
AtDCL2 1498 � 63.29 6.72AtPTB2 2141 � 228.7 34.87
1642 U.S. Kadam et al. / FEBS Letters 588 (2014) 1637–1643
We present the first application of SERS for mRNA detection andquantification of AS in plants (Fig. 5 and Table 3). The SERS resultswere validated with RT-PCR. We show the application of a novelSERS-based biophysical assay to study AS genes in plants. Suchanalysis will help elucidate novel functions of AS genes and theregulation of gene expression by increasing the transcriptomeand proteome variability in plants. We believe that this approachcould be further developed for in vivo analysis of AS isoforms atsingle cell resolution.
Acknowledgements
Authors gratefully acknowledge the funding from NSF-EAGERDBI-0939906 Award to B.S. and J.l. The Bilsland DissertationFellowship was awarded to UK from Purdue University. We thankRosanne Altstatt for copy-editing.
Appendix A. Supplementary data
Supplementary data associated with this article can be found, inthe online version, at http://dx.doi.org/10.1016/j.febslet.2014.02.061.
References
[1] Stamm, S., Riethoven, J.J., Le Texier, V., Gopalakrishnan, C., Kumanduri, V.,Tang, Y., Barbosa-Morais, N.L. and Thanaraj, T.A. (2006) ASD: a bioinformaticsresource on alternative splicing. Nucleic Acids Res. 34, D46–D55.
[2] Syed, N.H., Kalyna, M., Marquez, Y., Barta, A. and Brown, J.W. (2012)Alternative splicing in plants – coming of age. Trends Plant Sci. 17, 616–623.
[3] van Doom, R., Dijkman, R., Vermeer, M.H., Starink, T.M., Willemze, R. andTensen, C.P. (2002) A novel splice variant of the Fas gene in patients withcutaneous T-cell lymphoma. Cancer Res. 62, 5389–5392.
[4] Johnson, J.M. et al. (2003) Genome-wide survey of human alternative pre-mRNA splicing with exon junction microarrays. Science 302, 2141–2144.
[5] Yeakley, J.M., Fan, J.B., Doucet, D., Luo, L., Wickham, E., Ye, Z., Chee, M.S. and Fu,X.D. (2002) Profiling alternative splicing on fiber-optic arrays. Nat. Biotechnol.20, 353–358.
[6] Werneke, J.M., Chatfield, J.M. and Ogren, W.L. (1989) Alternative mRNAsplicing generates the two ribulosebisphosphate carboxylase/oxygenaseactivase polypeptides in spinach and Arabidopsis. Plant Cell 1, 815–825.
[7] Kalyna, M. et al. (2012) Alternative splicing and nonsense-mediated decaymodulate expression of important regulatory genes in Arabidopsis. NucleicAcids Res. 40, 2454–2469.
[8] Ner-Gaon, H., Leviatan, N., Rubin, E. and Fluhr, R. (2007) Comparative cross-species alternative splicing in plants. Plant Physiol. 144, 1632–1641.
[9] Campbell, M.A., Haas, B.J., Hamilton, J.P., Mount, S.M. and Buell, C.R. (2006)Comprehensive analysis of alternative splicing in rice and comparativeanalyses with Arabidopsis. BMC Genomics 7, 327.
[10] Wang, B.B. and Brendel, V. (2006) Genomewide comparative analysis ofalternative splicing in plants. Proc. Natl. Acad. Sci. USA 103, 7175–7180.
[11] Filichkin, S.A., Priest, H.D., Givan, S.A., Shen, R., Bryant, D.W., Fox, S.E., Wong,W.K. and Mockler, T.C. (2010) Genome-wide mapping of alternative splicing inArabidopsis thaliana. Genome Res. 20, 45–58.
[12] Zhu, W., Schlueter, S.D. and Brendel, V. (2003) Refined annotation of theArabidopsis genome by complete expressed sequence tag mapping. PlantPhysiol. 132, 469–484.
[13] Marquez, Y., Brown, J.W., Simpson, C., Barta, A. and Kalyna, M. (2012)Transcriptome survey reveals increased complexity of the alternative splicinglandscape in Arabidopsis. Genome Res. 22, 1184–1195.
[14] Bryant, D.W., Priest, H.D. and Mockler, T.C. (2012) Detection andquantification of alternative splicing variants using RNA-seq. Methods Mol.Biol. 883, 97–110.
[15] Thanaraj, T.A., Stamm, S., Clark, F., Riethoven, J.J., Le Texier, V. and Muilu, J.(2004) ASD: the alternative splicing database. Nucleic Acids Res. 32, D64–D69.
[16] Lee, C., Atanelov, L., Modrek, B. and Xing, Y. (2003) ASAP: the alternativesplicing annotation project. Nucleic Acids Res. 31, 101–105.
[17] Pan, Q. et al. (2004) Revealing global regulatory features of mammalianalternative splicing using a quantitative microarray platform. Mol. Cell 16,929–941.
[18] Kadam, U., Moeller, C.A., Irudayaraj, J. and Schulz, B. (2014) Effect of T-DNAinsertions on mRNA transcript copy numbers upstream and downstream ofthe insertion site in Arabidopsis thaliana explored by surface enhanced Ramanspectroscopy. Plant Biotechnol. J., http://dx.doi.org/10.1111/pbi.12161.
[19] Kneipp, H., Kneipp, J. and Kneipp, K. (2006) Surface-enhanced Raman opticalactivity on adenine in silver colloidal solution. Anal. Chem. 78, 1363–1366.
[20] Graham, D., Thompson, D.G., Smith, W.E. and Faulds, K. (2008) Control ofenhanced Raman scattering using a DNA-based assembly process of dye-coded nanoparticles. Nat. Nanotechnol. 3, 548–551.
[21] Graham, D. and Faulds, K. (2008) Quantitative SERRS for DNA sequenceanalysis. Chem. Soc. Rev. 37, 1042–1051.
[22] Stokes, R.J., Macaskill, A., Lundahl, P.J., Smith, W.E., Faulds, K. and Graham, D.(2007) Quantitative enhanced Raman scattering of labeled DNA from gold andsilver nanoparticles. Small 3, 1593–1601.
[23] McKeating, K.S., Dougan, J.A. and Faulds, K. (2012) Nanoparticle assembly forsensitive DNA detection using SERRS. Biochem. Soc. Trans. 40, 597–602.
[24] Kadam, U.S., Lossie, A., Schulz, B. and Irudayaraj, J. (2013) Gene expressionanalysis using conventional and imaging methods. in: Nucleic AcidsNanotechnology in Medicine, pp. 141-162. Springer Publications Inc., http://dx.doi.org/10.1007/978-3-642-36853-0_6, ISBN 978-3-642-36853-0.
[25] Gasciolli, V., Mallory, A.C., Bartel, DP. and Vaucheret, H. (2005) Partiallyredundant functions of Arabidopsis DICER-like enzymes and a role for DCL4 inproducing transacting siRNAs. Curr. Biol. 15, 1494–1500.

U.S. Kadam et al. / FEBS Letters 588 (2014) 1637–1643 1643
[26] Takanashi, H., Ohnishi, T., Mogi, M., Hirata, Y. and Tsutsumi, N. (2011) DCL2 ishighly expressed in the egg cell in both rice and Arabidopsis. Plant Signal.Behav. 6, 604–606.
[27] Mitchell, S.A., Spriggs, K.A., Coldwell, M.J., Jackson, R.J. and Willis, A.E. (2003)The Apaf-1 internal ribosome entry segment attains the correct structuralconformation for function via interactions with PTB and unr. Mol. Cell 11,757–771.
[28] Stauffer, E., Westermann, A., Wagner, G. and Wachter, A. (2010)Polypyrimidine tract-binding protein homologues from Arabidopsis underlieregulatory circuits based on alternative splicing and downstream control.Plant J. 64, 243–255.
[29] Ruhl, C., Stauffer, E., Kahles, A., Wagner, G., Drechsel, G., Ratsch, G. andWachter, A. (2012) Polypyrimidine tract binding protein homologs fromArabidopsis are key regulators of alternative splicing with implications infundamental developmental processes. Plant Cell 24, 4360–4375.
[30] Wachter, A., Ruhl, C. and Stauffer, E. (2012) The role of polypyrimidine tract-binding proteins and other hnRNP proteins in plant splicing regulation. Front.Plant Sci. 3, 81.
[31] Wang, S. and Okamoto, T. (2009) Involvement of polypyrimidine tract-bindingprotein (PTB)-related proteins in pollen germination in Arabidopsis. Plant CellPhysiol. 50, 179–190.
[32] Yamamoto, Y.Y., Tsuhara, Y., Gohda, K., Suzuki, K. and Matsui, M. (2003) Genetrapping of the Arabidopsis genome with a firefly luciferase reporter. Plant J.35, 273–283.
[33] Xu, M. and Hecht, N.B. (2007) Polypyrimidine tract binding protein 2 stabilizesphosphoglycerate kinase 2 mRNA in murine male germ cells by binding to its30UTR. Biol. Reprod. 76, 1025–1033.
[34] Hartwig, T. et al. (2011) Brassinosteroid control of sex determination in maize.Proc. Natl. Acad. Sci. USA 108, 19814–19819.
[35] Hartwig, T., Corvalan, C., Best, N.B., Budka, J.S., Zhu, J.Y., Choe, S. and Schulz, B.(2012) Propiconazole is a specific and accessible brassinosteroid (BR)biosynthesis inhibitor for Arabidopsis and maize. PLoS One 7, e36625.
[36] Sun, L., Yu, C. and Irudayaraj, J. (2008) Raman multiplexers for alternative genesplicing. Anal. Chem. 80, 3342–3349.
[37] Sun, L., Yu, C. and Irudayaraj, J. (2007) Surface-enhanced Raman scatteringbased nonfluorescent probe for multiplex DNA detection. Anal. Chem. 79,3981–3988.
[38] Cao, Y.C., Jin, R. and Mirkin, C.A. (2002) Nanoparticles with Ramanspectroscopic fingerprints for DNA and RNA detection. Science 297, 1536–1540.
[39] Lamesch, P. et al. (2012) The Arabidopsis Information Resource (TAIR):improved gene annotation and new tools. Nucleic Acids Res. 40, D1202–D1210.
[40] Park, S., Sinha, N. and Hamad-Schifferli, K. (2010) Effective size andzeta potential of nanorods by Ferguson analysis. Langmuir 26, 13071–13075.
[41] Park, S. and Hamad-Schifferli, K. (2010) Enhancement of in vitro translation bygold nanoparticle�DNA conjugates. ACS Nano 4, 2555–2560.
[42] Faulds, K., Smith, W.E., Graham, D. and Lacey, R.J. (2002) Assessment of silverand gold substrates for the detection of amphetamine sulfate by surfaceenhanced Raman scattering (SERS). Analyst 127, 282–286.
[43] Sun, L. and Irudayaraj, J. (2009) Quantitative surface-enhanced Raman forgene expression estimation. Biophys. J. 96, 4709–4716.
[44] Ravindranath, S.P., Kadam, U.S., Thompson, D.K. and Irudayaraj, J. (2012)Intracellularly grown gold nanoislands as SERS substrates for monitoringchromate, sulfate and nitrate localization sites in remediating bacteriabiofilms by Raman chemical imaging. Anal. Chim. Acta 745, 1–9.
[45] Zimmermann, P., Hirsch-Hoffmann, M., Hennig, L. and Gruissem, W. (2004)GENEVESTIGATOR. Arabidopsis microarray database and analysis toolbox.Plant Physiol. 136, 2621–2632.
[46] Winter, D., Vinegar, B., Nahal, H., Ammar, R., Wilson, G.V. and Provart, N.J.(2007) An Electronic Fluorescent Pictograph browser for exploring andanalyzing large-scale biological data sets. PLoS One 2, e718.
[47] James, A.B. et al. (2012) Alternative splicing mediates responses ofthe Arabidopsis circadian clock to temperature changes. Plant Cell 24, 961–981.
[48] Kriechbaumer, V., Wang, P., Hawes, C. and Abell, B.M. (2012) Alternativesplicing of the auxin biosynthesis gene YUCCA4 determines its subcellularcompartmentation. Plant J. 70, 292–302.
[49] Sharov, A.A., Dudekula, D.B. and Ko, M.S. (2005) Genome-wide assemblyand analysis of alternative transcripts in mouse. Genome Res. 15, 748–754.
[50] Kim, E., Magen, A. and Ast, G. (2007) Different levels of alternative splicingamong eukaryotes. Nucleic Acids Res. 35, 125–131.
Copyright © 2022 FDOKUMEN