Corrigendum: Sarcoidosis is associated with a truncating splice site mutation in the gene BTNL2
9
Sarcoidosis is associated with a truncating splice site mutation in BTNL2 Ruta Valentonyte 1,11 , Jochen Hampe 1,2,11 , Klaus Huse 3 , Philip Rosenstiel 1 , Mario Albrecht 4 , Annette Stenzel 1,2 , Marion Nagy 5 , Karoline I Gaede 6,7 , Andre Franke 2 , Robert Haesler 1 , Andreas Koch 2 , Thomas Lengauer 4 , Dirk Seegert 8 , Norbert Reiling 6 , Stefan Ehlers 6 , Eberhard Schwinger 9 , Matthias Platzer 3 , Michael Krawczak 10 , Joachim Mu ¨ller-Quernheim 7 , Manfred Schu ¨rmann 9 & Stefan Schreiber 1,2 Sarcoidosis is a polygenic immune disorder with predominant manifestation in the lung. Genome-wide linkage analysis previously indicated that the extended major histocompatibility locus on chromosome 6p was linked to susceptibility to sarcoidosis. Here, we carried out a systematic three-stage SNP scan of 16.4 Mb on chromosome 6p21 in as many as 947 independent cases of familial and sporadic sarcoidosis and found that a 15-kb segment of the gene butyrophilin-like 2 (BTNL2) was associated with the disease. The primary disease-associated variant (rs2076530; P TDT 5 3 3 10 26 , P case-control 5 1.1 3 10 28 ; replication P TDT 5 0.0018, P case-control 5 1.8 3 10 26 ) represents a risk factor that is independent of variation in HLA-DRB1. BTNL2 is a member of the immunoglobulin superfamily and has been implicated as a costimulatory molecule involved in T-cell activation on the basis of its homology to B7-1. The G-A transition constituting rs2076530 leads to the use of a cryptic splice site located 4 bp upstream of the affected wild-type donor site. Transcripts of the risk-associated allele have a premature stop in the spliced mRNA. The resulting protein lacks the C-terminal IgC domain and transmembrane helix, thereby disrupting the membrane localization of the protein, as shown in experiments using green fluorescent protein and V5 fusion proteins. Sarcoidosis is a multisystemic immune disorder characterized by noncaseating granulomas and an exaggerated cellular immune response due to increased inflammatory activity of macrophages and CD4 helper T cells 1,2 . Typical sites of disease manifestation include the lung, lymph nodes, eyes and skin. The clinical presentation of the disease varies from subclinical inflammation with slowly progressing pulmonary fibrosis to an acute inflammatory syndrome (Loefgren syndrome). Although spontaneous resolution is observed in more than 50% of cases, the disease can also take a recalcitrant course with ultimate chronic respiratory failure. The prevalence of sarcoidosis ranges from 10 to 14 per 100,000 in central Europe and European Americans to 64 per 100,000 in Sweden. Familial clustering of the disease has been observed in several populations; estimates of the relative risk to first-degree relatives vary between 2.8 and 18 (ref. 3). In a recent genome screen of 63 families with sarcoidosis 4 , we identified linkage of the disease to chromosome 6p21. Several HLA markers have been investigated for association with the disease 5–8 but initial results conflicted; HLA-DRB1 was recently identified as a consistent risk factor for sarcoidosis 6,8 . Nevertheless, the population attributable risk of mutations in this gene is small (B10% for individuals of European descent) and, in view of the strong linkage signal obtained for 6p21, additional risk factors probably exist in the region. Some candidate genes have already been investigated 9,10 , but to search systematically for additional disease susceptibility variants, we carried out systematic three-stage SNP fine-mapping of 6p21. We recruited a combination of extended families, trios and single indivi- duals with sarcoidosis and carried out family-based (transmission disequilibrium test, TDT) and population-based (case-control) asso- ciation analyses in parallel. We used consistency between TDT results and case-control results as a pragmatic guide to the trustworthiness of individual association signals. RESULTS Stage-one SNP scan In the initial stage-one SNP scan, we genotyped individuals from the ‘basic’ sample (Table 1 and Supplementary Table 1 online) for 69 SNPs Published online 27 February 2005; doi:10.1038/ng1519 1 Institute for Clinical Molecular Biology and 2 Kiel Center of the German National Genotyping Platform, Christian-Albrechts-University Kiel, Universita ¨ tsklinikum Schleswig-Holstein, Campus Kiel, Schittenhelmstr. 12, 24105 Kiel, Germany. 3 Institute for Molecular Biotechnology, Beutenbergstrae 11, 07745 Jena, Germany. 4 Max-Planck-Institute for Informatics, Stuhlsatzenhausweg 85, 66123 Saarbru ¨cken, Germany. 5 Institute of Forensic Medicine, Charite University Hospital, Hannoversche Strae 6, 10115 Berlin, Germany. 6 Research Center Borstel, Parkallee 1-40, 23845 Borstel, Germany. 7 Department of Pneumology, University of Freiburg, Killian-Str.5, 79106 Freiburg, Germany. 8 Conaris Research Institute AG, Schauenburgerstr. 116, 24118 Kiel, Germany. 9 Institute of Human Genetics, University of Lu ¨ beck; Ratzeburger Allee 160, 23538 Lu ¨beck, Germany. 10 Institute of Medical Statistics and Informatics, Christian-Albrechts-University Kiel, Universita ¨tsklinikum Schleswig-Holstein, Campus Kiel, 24105 Kiel, Germany. 11 These authors contributed equally to this work. Correspondence should be addressed to J.H. ([email protected]). NATURE GENETICS VOLUME 37 [ NUMBER 4 [ APRIL 2005 357 ARTICLES ARTICLES © 2005 Nature Publishing Group http://www.nature.com/naturegenetics
-
Upload
fli-leibniz -
Category
Documents
-
view
1 -
download
0
Transcript of Corrigendum: Sarcoidosis is associated with a truncating splice site mutation in the gene BTNL2

Sarcoidosis is associated with a truncating splice sitemutation in BTNL2Ruta Valentonyte1,11, Jochen Hampe1,2,11, Klaus Huse3, Philip Rosenstiel1, Mario Albrecht4, Annette Stenzel1,2,Marion Nagy5, Karoline I Gaede6,7, Andre Franke2, Robert Haesler1, Andreas Koch2, Thomas Lengauer4,Dirk Seegert8, Norbert Reiling6, Stefan Ehlers6, Eberhard Schwinger9, Matthias Platzer3, Michael Krawczak10,Joachim Muller-Quernheim7, Manfred Schurmann9 & Stefan Schreiber1,2
Sarcoidosis is a polygenic immune disorder with predominant manifestation in the lung. Genome-wide linkage analysis previouslyindicated that the extended major histocompatibility locus on chromosome 6p was linked to susceptibility to sarcoidosis. Here,we carried out a systematic three-stage SNP scan of 16.4 Mb on chromosome 6p21 in as many as 947 independent cases offamilial and sporadic sarcoidosis and found that a 15-kb segment of the gene butyrophilin-like 2 (BTNL2) was associated withthe disease. The primary disease-associated variant (rs2076530; PTDT 5 3 3 1026, Pcase-control 5 1.1 3 1028; replicationPTDT 5 0.0018, Pcase-control 5 1.8 3 1026) represents a risk factor that is independent of variation in HLA-DRB1. BTNL2 is amember of the immunoglobulin superfamily and has been implicated as a costimulatory molecule involved in T-cell activationon the basis of its homology to B7-1. The G-A transition constituting rs2076530 leads to the use of a cryptic splice site located4 bp upstream of the affected wild-type donor site. Transcripts of the risk-associated allele have a premature stop in the splicedmRNA. The resulting protein lacks the C-terminal IgC domain and transmembrane helix, thereby disrupting the membranelocalization of the protein, as shown in experiments using green fluorescent protein and V5 fusion proteins.
Sarcoidosis is a multisystemic immune disorder characterized bynoncaseating granulomas and an exaggerated cellular immuneresponse due to increased inflammatory activity of macrophagesand CD4 helper T cells1,2. Typical sites of disease manifestationinclude the lung, lymph nodes, eyes and skin. The clinical presentationof the disease varies from subclinical inflammation with slowlyprogressing pulmonary fibrosis to an acute inflammatory syndrome(Loefgren syndrome). Although spontaneous resolution is observed inmore than 50% of cases, the disease can also take a recalcitrant coursewith ultimate chronic respiratory failure. The prevalence of sarcoidosisranges from 10 to 14 per 100,000 in central Europe and EuropeanAmericans to 64 per 100,000 in Sweden. Familial clustering of thedisease has been observed in several populations; estimates of therelative risk to first-degree relatives vary between 2.8 and 18 (ref. 3).
In a recent genome screen of 63 families with sarcoidosis4, weidentified linkage of the disease to chromosome 6p21. Several HLAmarkers have been investigated for association with the disease5–8 butinitial results conflicted; HLA-DRB1 was recently identified as a
consistent risk factor for sarcoidosis6,8. Nevertheless, the populationattributable risk of mutations in this gene is small (B10% forindividuals of European descent) and, in view of the strong linkagesignal obtained for 6p21, additional risk factors probably exist in theregion. Some candidate genes have already been investigated9,10, but tosearch systematically for additional disease susceptibility variants, wecarried out systematic three-stage SNP fine-mapping of 6p21. Werecruited a combination of extended families, trios and single indivi-duals with sarcoidosis and carried out family-based (transmissiondisequilibrium test, TDT) and population-based (case-control) asso-ciation analyses in parallel. We used consistency between TDT resultsand case-control results as a pragmatic guide to the trustworthiness ofindividual association signals.
RESULTSStage-one SNP scanIn the initial stage-one SNP scan, we genotyped individuals from the‘basic’ sample (Table 1 and Supplementary Table 1 online) for 69 SNPs
Published online 27 February 2005; doi:10.1038/ng1519
1Institute for Clinical Molecular Biology and 2Kiel Center of the German National Genotyping Platform, Christian-Albrechts-University Kiel, UniversitatsklinikumSchleswig-Holstein, Campus Kiel, Schittenhelmstr. 12, 24105 Kiel, Germany. 3Institute for Molecular Biotechnology, Beutenbergstra�e 11, 07745 Jena, Germany.4Max-Planck-Institute for Informatics, Stuhlsatzenhausweg 85, 66123 Saarbrucken, Germany. 5Institute of Forensic Medicine, Charite University Hospital,Hannoversche Stra�e 6, 10115 Berlin, Germany. 6Research Center Borstel, Parkallee 1-40, 23845 Borstel, Germany. 7Department of Pneumology, University ofFreiburg, Killian-Str.5, 79106 Freiburg, Germany. 8Conaris Research Institute AG, Schauenburgerstr. 116, 24118 Kiel, Germany. 9Institute of Human Genetics,University of Lubeck; Ratzeburger Allee 160, 23538 Lubeck, Germany. 10Institute of Medical Statistics and Informatics, Christian-Albrechts-University Kiel,Universitatsklinikum Schleswig-Holstein, Campus Kiel, 24105 Kiel, Germany. 11These authors contributed equally to this work. Correspondence should be addressedto J.H. ([email protected]).
NATURE GENETICS VOLUME 37 [ NUMBER 4 [ APRIL 2005 35 7
A R T I C L E SA R T I C L E S
©20
05 N
atur
e P
ublis
hing
Gro
up
http
://w
ww
.nat
ure.
com
/nat
ureg
enet
ics

in an interval surrounding the position with the maximum nonpara-metric lod score in the original genome screen4 (Fig. 1a; NationalCenter for Biotechnology Information (NCBI) release 32 map co-ordinates 27.8–44.1 Mb). Defined by a decrease in nonparametriclod score by 1.5 units or less, this interval represented an approximate99% confidence region for linkage. To achieve sufficient power toidentify loci associated with sarcoidosis, we adopted a P value of 0.001as a threshold for significance in both the TDT and the case-control analyses of three-locus SNP haplotypes (Fig. 1b,c). This thresh-
old corresponds to a global significance level of 5% follow-ing Bonferroni correction for the number of SNPs investigated in theregion. Applying this criterion, only the BTNL2 subregion gave aconsistent association signal. A second peak in the MICB subregionyielded a P value o0.001 in the case-control analysis but not in theTDT analysis (P ¼ 0.3). We investigated this second putative region ofassociation further by genotyping markers rs1063635, rs3134900,rs3130062, rs1041981 and rs1799964 in the ‘extension’ sample(Table 1), together with BTNL2 markers rs2076523, hCV2455668,hCV2455646 and rs7192. Logistic regression analysis of genotypes,applying likelihood ratio–based forward inclusion at the 5% signifi-cance level, resulted in a model that included only two markers fromthe BTNL2 region (rs2076523 and rs7192) and no markers from theMICB region. Furthermore, we observed substantial long-range linkagedisequilibrium (LD) between markers in the BTNL2 and MICB regions,with D¢ values as high as 0.94. Therefore, we confined all subsequentmapping efforts to the BTNL2 region.
BTNL2 gene region and stage-two SNP scanIn stage two, we genotyped 48 SNPs from the 440-kb region ofassociation around BTNL2 (NCBI release 32 map coordinates 32.177–32.616 Mb) in the ‘basic’ and ‘extension’ samples. We identified SNPsfrom the Applied Biosystems myScience database, the Applied Bio-systems SNP-Browser, dbSNP or by direct genomic sequencing of47 individuals with sarcoidosis. Mutation screening of these indivi-duals covered all exon and adjacent intron sequences of the revisedBTNL2 model. We also identified SNPs in the genes C6orf10 andHLA-DRA (including the promoter, which had not previously beenanalyzed for SNPs) and in some noncoding sequence telomeric of
Table 1 Individuals with sarcoidosis used in association analysis
Sample
Sampling unit Basic Extension Replication Full
Affected sibling pairs (2 siblings) 70 9 10 89
Affected sibling pairs (3 siblings) 8 – – 8
Complex families 11 5 – 16
Trios (complete) 153 72 203 428
Trios (one parent missing) 10 79 62 151
Single cases 13 65 177 255
Total number of independent cases 265 230 452 947
Total number of patients (male/female) 372 (163/209) 248 (123/125) 462 (175/287) 1,082 (461/621)
Average age at diagnosis (s.d.) in years 34.7 (10.3) 37.2 (11.4) 37.3 (11.3) 36.4 (11.1)
Experiment Initial SNP screen Differentiation of
SNP fine mapping Replication HLA-DRB1–BTNL2 effects
The subphenotype composition of these samples is given in Supplementary Table 1. For case-control analysis, one case individual was extracted randomly from each family.The total number of independent cases equals the sum of the sampling units in the upper part. A group of 447 regionally, age- and sex-matched healthy individuals of Germandescent was used as a control in the initial SNP screen and SNP fine mapping experiments. For the replication experiment, an independent sample of 879 age- and sex-matchedcontrol individuals was used.
212 cM
30.0 35.0 40.0
0.0001
0.001
0.01
0.1
1
P v
alue
NP
L sc
ore
Chromosomal coordinate (Mb)
44.1 Mb
1
2
3
0
27.8 Mb
P v
alue
BTNL2 region MICB region
BTNL2 regionMICB region
30.0 35.0 40.0
0.0001
0.001
0.01
0.1
1
a
b
cFigure 1 Graphical representation of the stage I SNP screen on chromosome
6p21. The genomic interval corresponds to the genes from RFP to CAPN11.
(a) Nonparametric lod (NPL) score curve from the original genome scan4.
An approximate 99% c.i. for linkage is marked in gray. (b) Results of a
three-locus haplotype TDT using TRANSMIT38. (c) Results of a three-locushaplotype case-control analysis using HAPMAX40. In both panels, the
P value is plotted against the physical map position (NCBI coordinates)
of the most telomeric marker of each haplotype. Using a cut-off of
P ¼ 0.001, two potential lead regions (MICB and BTNL2 regions) were
identified (marked by arrows).
3 58 VOLUME 37 [ NUMBER 4 [ APRIL 2005 NATURE GENETICS
A R T I C L E S©
2005
Nat
ure
Pub
lishi
ng G
roup
ht
tp://
ww
w.n
atur
e.co
m/n
atur
egen
etic
s

BTNL2. We obtained consistent results in the two tests for a region ofB15 kb at the 3¢ end of BTNL2 (markers hCV2488476–rs2294878).P values for this region were two to three orders of magnitude smallerthan those for the other regions (Fig. 2).
Functional and structural effects of BTNL2 mutationsWe examined the structure of BTNL2, as logged in public sequencedatabases, by cDNA cloning. When the gene was first reported11, nocontiguous cDNA amplification was achieved for exons 1–4 and 5–6,suggesting that two different genes exist at this locus. We identifiedthree additional exons (one 5¢ and two 3¢) and excluded originalexon 3 from the gene model. Overlapping RT-PCR confirmed thepresence of a single transcript and, thereby, corroborated the validityof the revised gene model.
The 15-kb segment most strongly associated with sarcoidosiscontains four functional SNPs (amino acid substitutions P299Q,M286I and P285L and rs2076530), which together yielded P valuesof 1.9 � 10�7 in a four-locus TDT and 8.2 � 10�7 in a case-controlhaplotype analysis (single-point results are given in Fig. 2c). Most ofthe association signal was due to rs2076530, with a P value of 0.04 forthe inclusion of the other three markers in a genotype-based logisticregression analysis of the case-control sample. The neighboring non-functional SNPs rs2076529 and hCV2488476 are in strong pairwiseLD with rs2076530 (D¢ ¼ 1.0) and, therefore, provide efficient tagging
SNPs for the risk haplotype, which may contain additional, albeit rare,susceptibility variants. We verified the strong association betweensarcoidosis and rs2076530 in an independent stage-three ‘replication’sample (Table 1) of German cases and 876 independent Germancontrols (TDT: w2 ¼ 9.7, degrees of freedom (d.f.) ¼ 1, P ¼ 0.0018;case-control w2 ¼ 26.4, d.f. ¼ 1, P ¼ 1.8 � 10�6).
According to the previously reported gene model11, rs2076530would be predicted to cause an amino acid exchange, but in reality,the SNP is located at position �1 of a donor splice site (Fig. 3). A 4-bpcDNA deletion observed in cloned RT-PCR products from the genemodel verification can be explained by the fact that rs2076530 altersthe anatomy of the splice site. Guanine is present at position �1 of77% of donor sites12,13, and so the G-A transition of rs2076530results in the recruitment of an alternative splice site located 4 bpupstream. We confirmed genotype-specific splicing by RT-PCR ofDNA-cDNA pairs from lymphoblastoid cell lines and peripheral bloodsamples (Table 2) and in bronchoalveolar lavage (BAL) samples fromaffected individuals (Fig. 4). The loss of four bases from the cDNAtranscribed from the A allele causes a frameshift and a premature stopin the downstream exon. In the corresponding protein product, the118 C-terminal residues in the nontruncated protein are replaced byfive different amino acids.
We investigated the effects of the disease-associated variant on thestructure of the BTNL2 protein in silico. The BTN (butyrophilin-like)
HLA
-DR
AH
LA-D
RB
1H
LA- D
QA
BT
NL2
C6o
rf10
AG
ER
a b c d
0.01
0.04 0.21
0.18 0.03 0.07
0.02 0.00 0.20 0.01
0.01 0.22 0.08 0.00 0.06
0.02 0.11 0.03 0.00 0.01 0.00
0.02 0.11 0.03 0.00 0.01 0.00 0.99
0.02 0.11 0.03 0.00 0.01 0.00 0.98 1.00
0.02 0.11 0.03 0.00 0.01 0.00 0.99 0.98 0.97
0.05 0.00 0.01 0.00 0.00 0.09 0.41 0.44 0.43 0.41
0.00 0.02 0.16 0.01 0.07 0.01 0.02 0.02 0.02 0.02 0.17
0.02 0.02 0.07 0.01 0.19 0.02 0.01 0.01 0.01 0.01 0.09 0.01
0.00 0.03 0.00 0.01 0.03 0.05 0.02 0.02 0.01 0.02 0.01 0.02 0.00
0.02 0.00 0.00 0.00 0.02 0.01 0.26 0.25 0.25 0.25 0.50 0.15 0.28 0.02
0.00 0.01 0.01 0.13 0.01 0.00 0.04 0.04 0.04 0.04 0.01 0.01 0.01 0.00 0.01
0.00 0.01 0.05 0.00 0.01 0.00 0.03 0.03 0.03 0.03 0.00 0.01 0.08 0.01 0.06 0.00
0.02 0.00 0.02 0.00 0.00 0.01 0.10 0.09 0.09 0.09 0.36 0.16 0.07 0.05 0.51 0.02 0.25
0.00 0.01 0.04 0.00 0.01 0.00 0.02 0.03 0.03 0.02 0.00 0.01 0.08 0.01 0.06 0.00 0.97 0.25
0.00 0.01 0.04 0.00 0.01 0.00 0.02 0.02 0.02 0.02 0.00 0.01 0.07 0.01 0.05 0.00 0.86 0.21 0.90
0.00 0.00 0.01 0.01 0.01 0.00 0.00 0.00 0.00 0.00 0.00 0.00 0.00 0.00 0.00 0.00 0.02 0.01 0.00 0.00
0.00 0.02 0.05 0.00 0.01 0.00 0.03 0.03 0.03 0.03 0.00 0.01 0.08 0.01 0.06 0.00 1.01 0.26 0.98 0.86 0.02
0.00 0.01 0.05 0.00 0.01 0.00 0.03 0.03 0.03 0.03 0.00 0.01 0.08 0.01 0.06 0.00 0.95 0.23 0.94 0.89 0.01 0.95
0.00 0.01 0.04 0.00 0.01 0.00 0.02 0.02 0.02 0.02 0.00 0.01 0.08 0.01 0.06 0.00 0.97 0.23 0.95 0.87 0.01 0.97 0.96
0.02 0.00 0.02 0.01 0.00 0.01 0.10 0.09 0.09 0.09 0.36 0.14 0.07 0.05 0.50 0.02 0.24 0.97 0.24 0.20 0.01 0.24 0.22 0.22
0.00 0.04 0.00 0.00 0.01 0.00 0.02 0.02 0.02 0.02 0.01 0.02 0.01 0.00 0.01 0.00 0.00 0.01 0.00 0.00 0.00 0.00 0.00 0.00 0.02
0.02 0.00 0.02 0.00 0.00 0.01 0.09 0.08 0.09 0.09 0.36 0.16 0.07 0.05 0.50 0.02 0.25 1.00 0.25 0.21 0.01 0.26 0.23 0.23 0.97 0.01
0.03 0.00 0.01 0.00 0.00 0.01 0.08 0.08 0.08 0.08 0.33 0.12 0.05 0.05 0.45 0.02 0.19 0.86 0.21 0.19 0.00 0.20 0.18 0.18 0.83 0.02 0.85
0.00 0.01 0.00 0.02 0.00 0.07 0.02 0.03 0.03 0.03 0.01 0.01 0.05 0.00 0.09 0.00 0.00 0.05 0.00 0.00 0.00 0.00 0.00 0.00 0.05 0.00 0.05 0.04
0.03 0.00 0.00 0.00 0.02 0.01 0.25 0.25 0.24 0.24 0.49 0.15 0.28 0.02 1.00 0.01 0.06 0.50 0.06 0.05 0.00 0.06 0.06 0.06 0.49 0.01 0.50 0.45 0.09
0.00 0.00 0.00 0.00 0.00 0.02 0.04 0.05 0.04 0.04 0.03 0.01 0.05 0.01 0.03 0.00 0.16 0.02 0.14 0.14 0.04 0.16 0.16 0.16 0.01 0.00 0.02 0.10 0.00 0.03
0.02 0.00 0.00 0.00 0.02 0.04 0.12 0.11 0.11 0.12 0.30 0.07 0.11 0.04 0.67 0.01 0.00 0.52 0.00 0.00 0.01 0.00 0.00 0.00 0.50 0.01 0.52 0.64 0.06 0.66 0.18
0.00 0.00 0.00 0.01 0.00 0.02 0.04 0.04 0.04 0.04 0.03 0.02 0.05 0.01 0.03 0.00 0.13 0.01 0.14 0.14 0.00 0.13 0.14 0.14 0.01 0.00 0.01 0.11 0.00 0.03 0.90 0.15
0.00 0.00 0.00 0.01 0.00 0.02 0.04 0.04 0.04 0.04 0.03 0.02 0.05 0.01 0.03 0.00 0.14 0.01 0.15 0.14 0.00 0.14 0.14 0.14 0.01 0.00 0.01 0.11 0.00 0.03 0.90 0.16 0.97
0.00 0.00 0.00 0.01 0.00 0.02 0.04 0.04 0.04 0.04 0.03 0.02 0.05 0.01 0.03 0.00 0.13 0.01 0.14 0.14 0.00 0.13 0.14 0.14 0.01 0.00 0.01 0.10 0.00 0.03 0.90 0.16 0.96 0.98
0.00 0.00 0.00 0.00 0.00 0.00 0.01 0.01 0.01 0.01 0.01 0.01 0.01 0.00 0.01 0.00 0.11 0.03 0.12 0.13 0.00 0.11 0.11 0.11 0.03 0.00 0.03 0.03 0.00 0.01 0.21 0.04 0.22 0.23 0.23
0.02 0.16 0.02 0.00 0.02 0.01 0.45 0.48 0.47 0.46 0.25 0.00 0.02 0.03 0.31 0.02 0.11 0.05 0.10 0.09 0.00 0.11 0.11 0.11 0.05 0.03 0.05 0.04 0.02 0.32 0.04 0.15 0.04 0.04 0.04 0.01
0.00 0.04 0.01 0.01 0.05 0.01 0.04 0.04 0.04 0.04 0.02 0.07 0.02 0.03 0.15 0.07 0.24 0.00 0.25 0.22 0.00 0.24 0.24 0.24 0.01 0.01 0.01 0.00 0.00 0.15 0.01 0.10 0.01 0.01 0.01 0.00 0.30
0.00 0.04 0.01 0.01 0.05 0.01 0.04 0.04 0.04 0.04 0.02 0.07 0.02 0.03 0.15 0.07 0.24 0.00 0.25 0.22 0.00 0.24 0.24 0.24 0.01 0.01 0.01 0.00 0.00 0.15 0.01 0.10 0.01 0.01 0.01 0.00 0.30 1.00
0.00 0.04 0.01 0.01 0.04 0.01 0.04 0.04 0.04 0.04 0.02 0.07 0.02 0.03 0.15 0.07 0.24 0.00 0.25 0.22 0.00 0.24 0.24 0.24 0.01 0.01 0.00 0.00 0.01 0.15 0.01 0.09 0.01 0.01 0.01 0.00 0.28 0.98 0.98
0.00 0.00 0.01 0.00 0.00 0.01 0.02 0.02 0.02 0.02 0.01 0.05 0.01 0.00 0.01 0.00 0.13 0.03 0.14 0.11 0.00 0.13 0.14 0.13 0.03 0.00 0.03 0.03 0.00 0.01 0.27 0.05 0.29 0.31 0.30 0.00 0.02 0.06 0.06 0.05
0.03 0.14 0.01 0.00 0.01 0.01 0.43 0.45 0.44 0.43 0.24 0.01 0.02 0.03 0.31 0.02 0.12 0.04 0.12 0.11 0.00 0.13 0.12 0.12 0.04 0.03 0.04 0.03 0.02 0.31 0.06 0.13 0.06 0.06 0.06 0.01 0.93 0.32 0.32 0.32 0.02
0.00 0.02 0.05 0.00 0.09 0.00 0.12 0.12 0.12 0.12 0.08 0.12 0.00 0.01 0.23 0.04 0.22 0.00 0.24 0.22 0.00 0.23 0.22 0.22 0.00 0.01 0.00 0.00 0.02 0.23 0.10 0.05 0.11 0.12 0.11 0.03 0.44 0.64 0.64 0.65 0.04 0.48
0.02 0.08 0.00 0.00 0.03 0.06 0.31 0.33 0.32 0.32 0.24 0.05 0.01 0.01 0.27 0.04 0.00 0.26 0.00 0.00 0.00 0.00 0.00 0.00 0.24 0.02 0.25 0.22 0.03 0.27 0.09 0.08 0.08 0.09 0.08 0.02 0.52 0.07 0.07 0.07 0.03 0.57 0.23
0.02 0.07 0.01 0.00 0.01 0.05 0.23 0.25 0.25 0.24 0.20 0.02 0.00 0.01 0.23 0.04 0.00 0.20 0.00 0.00 0.01 0.00 0.00 0.00 0.19 0.01 0.20 0.17 0.02 0.23 0.11 0.06 0.09 0.10 0.09 0.02 0.44 0.09 0.09 0.09 0.04 0.49 0.14 0.86
0.02 0.06 0.00 0.00 0.01 0.05 0.26 0.27 0.27 0.25 0.22 0.02 0.00 0.01 0.24 0.04 0.00 0.21 0.00 0.00 0.01 0.00 0.00 0.00 0.20 0.01 0.21 0.17 0.02 0.24 0.12 0.06 0.10 0.10 0.11 0.02 0.44 0.09 0.08 0.09 0.04 0.50 0.14 0.86 0.96
0.01 0.02 0.10 0.01 0.04 0.01 0.17 0.18 0.17 0.17 0.09 0.06 0.07 0.01 0.09 0.00 0.00 0.09 0.00 0.00 0.01 0.00 0.00 0.00 0.10 0.01 0.09 0.06 0.01 0.09 0.07 0.02 0.05 0.06 0.06 0.04 0.19 0.12 0.12 0.11 0.01 0.20 0.02 0.34 0.38 0.39
0.01 0.01 0.15 0.03 0.04 0.02 0.00 0.00 0.00 0.00 0.04 0.25 0.07 0.02 0.07 0.01 0.01 0.09 0.01 0.01 0.00 0.01 0.02 0.01 0.09 0.01 0.09 0.10 0.00 0.07 0.00 0.06 0.00 0.00 0.00 0.03 0.00 0.04 0.04 0.04 0.01 0.00 0.07 0.01 0.02 0.02 0.03
Marker Gene TDT(T:U)f P (TDT) P (CC) OR (hom) OR (het)
rs2070600 AGER 0.03 15:12 0.5637 0.27416858 1.12 n/ars1800624 AGER 0.30 112:110 0.8932 0.76397140 1.17 1.19rs2071287 NOTCH4 0.43 119:130 0.4857 0.44026615 1.27 1.08rs384247 NOTCH4 0.13 59:56 0.7797 0.61647834 1.46 1.10rs915894 NOTCH4 0.38 118:122 0.7963 0.13053632 1.49 1.26rs436845 0.25 94:97 0.8282 0.21553508 1.58 1.12rs560505 SH2BP1 0.43 142:117 0.1203 0.00305638 1.88 1.77rs485774 SH2BP1 0.44 148:120 0.0872 0.00423170 1.85 1.73rs552339 SH2BP1 0.44 117:141 0.1351 0.00896527 1.78 1.64rs761187 SH2BP1 0.44 138:115 0.1482 0.00354380 1.82 1.79rs2073044 SH2BP1 0.25 100:67 0.0107 0.00036575 2.31 1.58rs2050190 SH2BP1 0.33 94:118 0.0993 0.02699471 1.66 1.04rs2073045 SH2BP1 0.36 113:112 0.9468 0.04634492 1.63 1.27AL034394_T26355G 0.07 37:45 0.3770 0.50674722 2.08 1.21AL034394_A26270C 0.26 78:97 0.1509 0.00025948 1.51 1.14AL034394_C20283T 0.03 17:15 0.7237 0.09681643 9.68 3.97AL034394_C16965T 0.15 46:76 0.0066 0.00044654 4.51 2.73hCV2488476 0.41 92:154 0.0001 0.00000001 3.02 1.55AL034394_C12339T 0.15 43:76 0.0025 0.00044392 4.14 2.43AL034394_T10552C 0.14 73:41 0.0027 0.00072349 5.65 3.46BTNL2_E360Amb BTNL2 0.004 4:2 0.4142 0.98847432 1.01 1.01BTNL2_P299Q BTNL2 0.15 45:80 0.0013 0.00022372 4.56 2.68BTNL2_M286I BTNL2 0.15 76:42 0.0008 0.00007531 4.60 2.56BTNL2_P285L BTNL2 0.15 80:43 0.0001 0.00001890 13.91 8.00rs2076530 BTNL2 0.42 158:102 0.0009 0.00000001 2.75 1.60BTNL2_S240L BTNL2 0.02 14:8 0.2008 0.20022583 n/a n/ars2076529 BTNL2 0.41 157:96 0.0001 0.00000002 2.99 1.57rs2294878 BTNL2 0.44 145:95 0.0012 0.00000023 2.86 1.60BTNL2_i4_A239T BTNL2 0.03 12:12 1.0000 0.81880970 1.19 1.06rs2076524 BTNL2 0.26 100:75 0.0588 0.00027246 1.52 1.12BTNL2_i3_C1900T BTNL2 0.08 40:45 0.5876 0.94281428 1.05 1.06rs2076523 BTNL2 0.35 90:111 0.1385 0.00044759 1.66 1.00BTNL2_i3_A1837G BTNL2 0.08 45:36 0.3173 0.92094324 1.36 1.01BTLIIW94R BTNL2 0.08 37:36 0.9068 0.91835959 1.37 1.00BTLIIH60H BTNL2 0.08 35:38 0.7255 0.93407468 1.32 1.33BTNL2_i1_G1717T BTNL2 0.02 9:8 0.8084 0.51977447 1.89 1.23hCV2455668 0.42 119:138 0.2359 0.05015249 1.64 1.38DRAp_231 HLA-DRA 0.30 114:114 1.0000 0.39942081 1.01 1.18DRAp_224 HLA-DRA 0.30 116:111 0.7400 0.45150999 1.04 1.14DRAp_196 HLA-DRA 0.31 117:114 0.8435 0.45176511 1.10 1.07DRAp_127 HLA-DRA 0.02 15:19 0.4927 0.97169447 1.02 1.01rs14004 HLA-DRA 0.42 110:131 0.1761 0.04116544 1.66 1.38hCV2455646 HLA-DRA 0.39 139:134 0.7622 0.91955476 1.05 1.03rs8084 HLA-DRA 0.44 168:123 0.0083 0.00012918 2.20 1.46rs7192 HLA-DRA 0.42 121:176 0.0014 0.00010441 2.14 1.63rs2213584 HLA-DRA 0.41 107:161 0.0010 0.00005522 2.21 1.66rs2395182 HLA-DRA 0.21 94:110 0.2626 0.00070591 2.09 1.55rs707952 HLA-DQA1 0.28 132:94 0.0115 0.02805484 1.64 1.33
BT
NL2
23
45
67
81
Figure 2 Graphical representation of the stage II SNP screen of the combined ‘basic’ and ‘extension’ samples. (a) Gene map of the analyzed 440-kb
region on human chromosome 6p21. (b) Equidistance plot of pairwise LD (r2) between all markers in the analyzed region. Fields are color-coded
according to LD strength (blue, r2 ¼ 0.0; red, r2 ¼ 1.0). (c) Results of disease-association tests. f, allele frequency of the minor allele in controls;
TDT (T:U), numbers of transmitted versus untransmitted alleles; P (TDT), single-point P value reported by GENEHUNTER 2.1, color-coded as white(P Z 0.01), yellow (0.01 r P o 0.05), orange (0.001 r P o 0.01) or red (P o 0.001); P (CC), P value from a genotype-based w2 test of case-control
data, color-coded as white (P Z 0.01), yellow (0.001 r P o 0.01), orange (10�6 r P o 0.001) or red (P o 10�6); OR (hom) and OR (het), OR for
homozygous and heterozygous risk allele carriers, respectively. (d) Revised exon-intron structure of BTNL2.
NATURE GENETICS VOLUME 37 [ NUMBER 4 [ APRIL 2005 35 9
A R T I C L E S©
2005
Nat
ure
Pub
lishi
ng G
roup
ht
tp://
ww
w.n
atur
e.co
m/n
atur
egen
etic
s
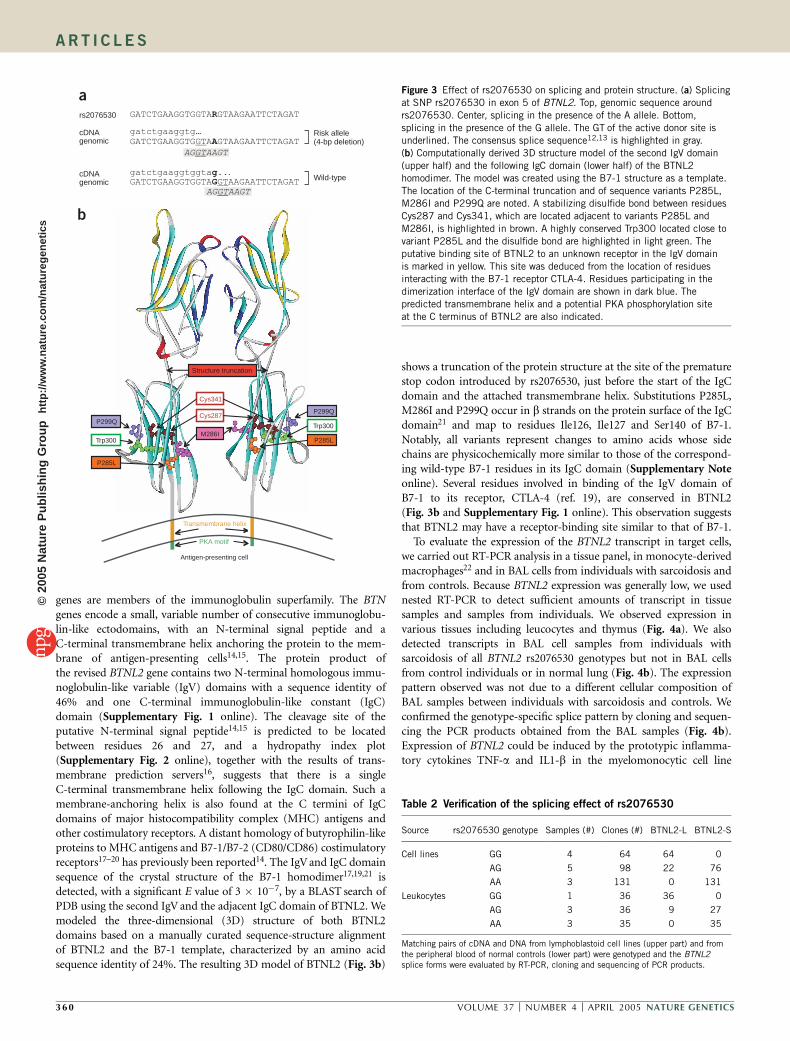
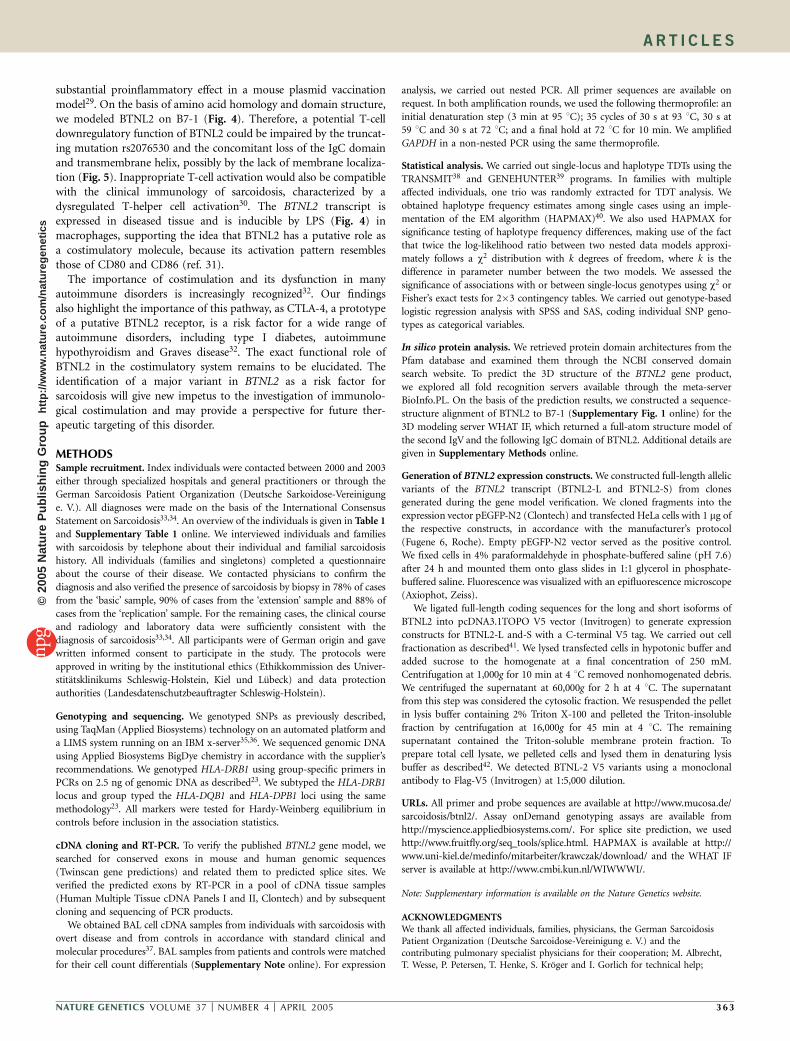
genes are members of the immunoglobulin superfamily. The BTNgenes encode a small, variable number of consecutive immunoglobu-lin-like ectodomains, with an N-terminal signal peptide and aC-terminal transmembrane helix anchoring the protein to the mem-brane of antigen-presenting cells14,15. The protein product ofthe revised BTNL2 gene contains two N-terminal homologous immu-noglobulin-like variable (IgV) domains with a sequence identity of46% and one C-terminal immunoglobulin-like constant (IgC)domain (Supplementary Fig. 1 online). The cleavage site of theputative N-terminal signal peptide14,15 is predicted to be locatedbetween residues 26 and 27, and a hydropathy index plot(Supplementary Fig. 2 online), together with the results of trans-membrane prediction servers16, suggests that there is a singleC-terminal transmembrane helix following the IgC domain. Such amembrane-anchoring helix is also found at the C termini of IgCdomains of major histocompatibility complex (MHC) antigens andother costimulatory receptors. A distant homology of butyrophilin-likeproteins to MHC antigens and B7-1/B7-2 (CD80/CD86) costimulatoryreceptors17–20 has previously been reported14. The IgV and IgC domainsequence of the crystal structure of the B7-1 homodimer17,19,21 isdetected, with a significant E value of 3 � 10�7, by a BLAST search ofPDB using the second IgV and the adjacent IgC domain of BTNL2. Wemodeled the three-dimensional (3D) structure of both BTNL2domains based on a manually curated sequence-structure alignmentof BTNL2 and the B7-1 template, characterized by an amino acidsequence identity of 24%. The resulting 3D model of BTNL2 (Fig. 3b)
shows a truncation of the protein structure at the site of the prematurestop codon introduced by rs2076530, just before the start of the IgCdomain and the attached transmembrane helix. Substitutions P285L,M286I and P299Q occur in b strands on the protein surface of the IgCdomain21 and map to residues Ile126, Ile127 and Ser140 of B7-1.Notably, all variants represent changes to amino acids whose sidechains are physicochemically more similar to those of the correspond-ing wild-type B7-1 residues in its IgC domain (Supplementary Noteonline). Several residues involved in binding of the IgV domain ofB7-1 to its receptor, CTLA-4 (ref. 19), are conserved in BTNL2(Fig. 3b and Supplementary Fig. 1 online). This observation suggeststhat BTNL2 may have a receptor-binding site similar to that of B7-1.
To evaluate the expression of the BTNL2 transcript in target cells,we carried out RT-PCR analysis in a tissue panel, in monocyte-derivedmacrophages22 and in BAL cells from individuals with sarcoidosis andfrom controls. Because BTNL2 expression was generally low, we usednested RT-PCR to detect sufficient amounts of transcript in tissuesamples and samples from individuals. We observed expression invarious tissues including leucocytes and thymus (Fig. 4a). We alsodetected transcripts in BAL cell samples from individuals withsarcoidosis of all BTNL2 rs2076530 genotypes but not in BAL cellsfrom control individuals or in normal lung (Fig. 4b). The expressionpattern observed was not due to a different cellular composition ofBAL samples between individuals with sarcoidosis and controls. Weconfirmed the genotype-specific splice pattern by cloning and sequen-cing the PCR products obtained from the BAL samples (Fig. 4b).Expression of BTNL2 could be induced by the prototypic inflamma-tory cytokines TNF-a and IL1-b in the myelomonocytic cell line
GATCTGAAGGTGGTA GTAAGAATTCTAGATR
GATCTGAAGGTGGTA AAGAATTCTAGATGGT
AG AAGTGT
AG AAGTGT
GATCTGAAGGTG A GTAAGAATTCTAGATGT A
gatctgaaggtggtag...
gatctgaaggtg...genomic
rs2076530
genomic
cDNA Risk allele(4-bp deletion)
Wild-typecDNA
P299Q
P285LM286I
P299Q
P285L
Structure truncation
Transmembrane helix
Antigen-presenting cell
Trp300
Trp300
Cys287
Cys341
PKA motif
a
b
Figure 3 Effect of rs2076530 on splicing and protein structure. (a) Splicing
at SNP rs2076530 in exon 5 of BTNL2. Top, genomic sequence around
rs2076530. Center, splicing in the presence of the A allele. Bottom,
splicing in the presence of the G allele. The GT of the active donor site is
underlined. The consensus splice sequence12,13 is highlighted in gray.
(b) Computationally derived 3D structure model of the second IgV domain
(upper half) and the following IgC domain (lower half) of the BTNL2
homodimer. The model was created using the B7-1 structure as a template.
The location of the C-terminal truncation and of sequence variants P285L,
M286I and P299Q are noted. A stabilizing disulfide bond between residues
Cys287 and Cys341, which are located adjacent to variants P285L and
M286I, is highlighted in brown. A highly conserved Trp300 located close to
variant P285L and the disulfide bond are highlighted in light green. The
putative binding site of BTNL2 to an unknown receptor in the IgV domain
is marked in yellow. This site was deduced from the location of residuesinteracting with the B7-1 receptor CTLA-4. Residues participating in the
dimerization interface of the IgV domain are shown in dark blue. The
predicted transmembrane helix and a potential PKA phosphorylation site
at the C terminus of BTNL2 are also indicated.
Table 2 Verification of the splicing effect of rs2076530
Source rs2076530 genotype Samples (#) Clones (#) BTNL2-L BTNL2-S
Cell lines GG 4 64 64 0
AG 5 98 22 76
AA 3 131 0 131
Leukocytes GG 1 36 36 0
AG 3 36 9 27
AA 3 35 0 35
Matching pairs of cDNA and DNA from lymphoblastoid cell lines (upper part) and fromthe peripheral blood of normal controls (lower part) were genotyped and the BTNL2splice forms were evaluated by RT-PCR, cloning and sequencing of PCR products.
3 60 VOLUME 37 [ NUMBER 4 [ APRIL 2005 NATURE GENETICS
A R T I C L E S©
2005
Nat
ure
Pub
lishi
ng G
roup
ht
tp://
ww
w.n
atur
e.co
m/n
atur
egen
etic
s

THP-1 (Fig. 4b and real-time PCR data in Supplementary Fig. 3online). Mycobacterium tuberculosis and lipopolysaccharide (LPS)induced BTNL2 in monocyte-derived macrophages, as shown bynon-nested PCR analysis (Fig. 4c)22.
We cloned BTNL2 transcripts from both the deletion allele(BTNL2-S) and the wild-type allele (BTNL2-L) into a mammalianexpression vector with a C-terminal fusion green fluorescent protein.In transfection experiments of HeLa and HEK cells (data not shown),these constructs showed different subcellular localization. In contrastto BTNL2-L, which showed membrane localization, the mutantBTNL2-S protein was contained in cytoplasmic vesicular structures(Fig. 5a,b). The high expression levels characteristic of transfectionexperiments do not reflect the physiological concentration of theprotein in immunoregulatory cells, where nested PCR was necessaryto detect the transcript. Therefore, the abundant vesicle formation andhigh expression level of BTNL2-L in all membranes probably resultedfrom in vitro overexpression. We confirmed the differential localiza-tion of the allelic protein variants by western blotting of subcellularfractions of HeLa cells transiently transfected with V5-tagged BTNL2-Land BTNL2-S constructs (Fig. 5c).
Independence of BTNL2 and HLA effectsThe truncating allele, A, of rs2076530 predisposes for sarcoidosis(Table 3). The marginal odds ratio (OR) estimates were 2.75 (95%confidence interval (c.i.) ¼ 1.86–4.05) for AA versus GG genotypesand 1.60 (95% c.i. ¼ 1.10–2.32) for AG versus GG genotypes.The difference between the two values was highly significant(w2 ¼ 16.886, d.f. ¼ 1, P ¼ 3.9 � 10�5), arguing in favor of amultiplicative effect on risk by the truncating allele. Nevertheless,BTNL2 is located close (B200 kb) to HLA-DRB1, which, togetherwith other HLA loci (HLA-DQB1 and HLA-DPB1), is implicated in theetiology of sarcoidosis5,6,8. Group typing of HLA-DRB1 alleles in ourthree samples23 confirmed the disease association of allele HLA-DRB1*11 (Supplementary Table 2 online). When HLA-DRB1 alleleswith ORs 41.3 were jointly coded as R (risk) and alleles with ORs o1.3were coded as N (nonrisk), marginal OR estimates were 2.19 (95% c.i.¼ 1.43–3.36) for RR versus NN genotypes and 1.70 (95% c.i. ¼ 1.32–2.19) for NR versus NN genotypes. Because the difference between thetwo ORs was not statistically significant (w2 ¼ 1.192, d.f. ¼ 1, P ¼ 0.27),we considered the R allele to be dominant and grouped genotypes RRand NR together as high risk genotypes in subsequent analyses.
Bra
in
Hea
rt
Kid
ney
Live
r
Lung
Pan
crea
s
Pla
cent
a
Ske
let.
mus
cle
Col
on
Ova
ry
Leuk
ocyt
es
Pro
stat
e
Sm
all i
ntes
tine
Spl
een
Test
is
Thy
mus
Wat
er c
ontr
ol
511 bp
511 bp
a b
c
511 bp
983 bp
368 bpβ2M
BTNL2
983 bp
TH
P-1
uns
timul
ated
Mφ
uns
timul
ated
TH
P-1
plu
sTN
F-α
BA
L co
ntro
l
BA
L co
ntro
l
BA
L co
ntro
l
BA
L co
ntro
l
BA
L sa
rcoi
dosi
s G
G
BA
L sa
rcoi
dosi
s G
G
BA
L sa
rcoi
dosi
s A
G
BA
L sa
rcoi
dosi
s A
G
BA
L sa
rcoi
dosi
s A
G
BA
L sa
rcoi
dosi
s A
G
BA
L sa
rcoi
dosi
s A
A
BA
L sa
rcoi
dosi
s A
A
BA
L sa
rcoi
dosi
s A
A
BA
L sa
rcoi
dosi
s A
A
BA
L sa
rcoi
dosi
s A
A
BA
L sa
rcoi
dosi
s A
A
Wat
er c
ontr
olW
ater
con
trol
Mφ
LPS
Mφ
M. t
uber
culo
sis
Figure 4 Expression pattern of BTNL2, as analyzed by nested RT-PCR in the Human Multiple Tissue cDNA Panels
(Clontech, a) and in THP-1 cells (native and after a 4-h incubation with 10 ng ml�1 TNF-a) and BAL cells of
individuals with sarcoidosis and normal controls (b). Genotype at rs2076530 of the individuals with sarcoidosis
is indicated. BTNL2 PCR products from the THP-1 cells and BAL samples were cloned, and 24 clones were
sequenced. THP-1 cells and samples from individuals with sarcoidosis with genotype GG contained only the
BTNL2-L transcript, whereas samples from individuals with sarcoidosis with genotype AA contained only BTNL2-S.
In heterozygotes, both forms were seen. Results from the corresponding GAPDH RT-PCR are shown below the
BTNL2 results. (c) Monocyte-derived macrophages (Mfs) were stimulated with live M. tuberculosis (Strain H37Rv,
10:1 mycobacteria:macrophage) or LPS (Salmonella enterica, serovar friedenau H909; 10 ng ml�1) for 4 h as
described22. Expression of BTNL2 transcript was assayed by a non-nested RT-PCR using the second-round primers
of the nested PCR. The b2-microglobulin control is shown below.
Table 3 Association analysis between sarcoidosis and joint HLA-DRB1 BTNL2 genotype
HLA-DRB1
NN NR RR Total
BTNL2 Controls Cases Controls Cases Controls Cases Controls Cases
AA 43 99 66 223 25 97 134 419
AG 127 188 84 190 10 25 221 403
GG 59 68 12 14 1 0 72 82
Total 229 355 162 427 36 122 427 904
ORa 1.56 (1.00–2.43) 1.54 (1.08–2.18) 1.54b (1.19–2.01)
aOR of BTNL2 genotypes AA versus AG, stratified by HLA-DRB1 genotype, with 95% c.i. given in parentheses. ORs of genotypes AA versus GG are 2.00 (95% c.i. ¼ 1.18–3.40) for NNand 3.27 (95% c.i. ¼ 1.39–7.68) for NR or RR. ORs of genotypes AG versus GG are 1.28 (95% c.i. ¼ 0.83–1.99) for NN and 2.12 (95% c.i. ¼ 0.90–5.02) for NR or RR. bMantel-Haenzselestimate of common OR.
NATURE GENETICS VOLUME 37 [ NUMBER 4 [ APRIL 2005 36 1
A R T I C L E S©
2005
Nat
ure
Pub
lishi
ng G
roup
ht
tp://
ww
w.n
atur
e.co
m/n
atur
egen
etic
s

In a single-locus, allele-based test of association, HLA-DRB1, HLA-DQB1 and HLA-DPB1 yielded P values of 2.4 � 10�5, 1.3 � 10�3 and2.9 � 10�5, respectively, compared with 1.1 � 10�8 for rs2076530. Toassess the extent of possible confounding of the rs2076530 associationby the HLA loci, we repeated the disease association analysis, stratify-ing the data each time according to genotype at one of the HLA loci.When stratified by HLA-DRB1 genotype, the OR estimates ofrs2076530 genotypes AA versus AG were virtually identical (1.54 forhigh-risk, 1.56 for NN). The number of individuals carrying HLA-DRB1 high-risk genotypes but lacking rs2076530 risk allele A was toosmall to allow for a statistically robust comparison of HLA-DRB1–stratified ORs involving BTNL2 genotype GG (i.e., AA versus GG andAG versus GG). Although the respective estimates seemed to be higherfor high-risk than for NN genotypes, the confidence intervals asso-ciated with these values overlapped widely (Table 3).
DISCUSSIONWe carried out a three-stage SNP mapping experiment on chromo-some 6p21 to localize genetic variants that predispose to sarcoidosis.To interpret the association results, we used logistic regression analysisas a formal tool to differentiate primary from secondary effects. Thisanalysis resulted in a model that included only two markers from theBTNL2 region (rs2076523 and rs7192) and no markers from the MICBregion. In addition, we used the consistency of TDT and case-controlresults as a pragmatic guide to judge the credibility of associationsignals, a procedure that also implicated the BTNL2 region. Theobserved discordance between the significance levels of TDT andcase-control association tests probably reflects the different statistical
power of the two methods. Their efficiency depends on the specificregional LD structure, the population of origin, the samplecomposition and the mode of inheritance of the risk factor24. Long-range LD has also been a matter of concern in mapping studies ofchromosome 6p. But integration of our data with those in a recentlypublished study25 uncovered no relevant long-range LD betweenthe BTNL2-associated haplotype block and other HLA subregions(Supplementary Fig. 4 online).
We identified a disease-associated SNP (rs2076530) in the 3¢ regionof BTNL2 that exerted most, if not all, of its predisposing influenceindependently of the neighboring HLA loci. ORs of homozygosityversus heterozygosity for the truncating allele (A) were the same,irrespective of HLA-DRB1 genotype, and differences involving homo-zygosity with respect to the functional allele (G) were insignificantthroughout. Furthermore, the minor discrepancies observed weremainly due to an unusually small OR (0.93) of the high-risk HLA-DRB1 genotype (NR and RR) versus genotype NN among BTNL2 GGindividuals. This genotype-specific lack of association may imply thatHLA-DBR1 is a risk factor for sarcoidosis only in the presence of thetruncating BTNL2 allele, a result that would be particularly importantgiven the functional relatedness of costimulation and antigen pre-sentation. Answering this and other questions about the possibleinteraction of specific HLA-DRB1 alleles on different BTNL2 back-grounds requires larger number of observations than are currentlyavailable, especially in individuals carrying genotype GG plus NR orRR. Alternatively, the small HLA-DRB1–related OR could be anunderestimate, implying that the apparent modification of theBTNL2 risk by HLA-DRB1 genotype was merely due to samplingvariation. Accordingly, no statistically significant confounding of theBTNL2 risk by HLA-DRB1 became apparent when we analyzed jointhaplotypes for disease association (Supplementary Table 2 online) orwhen we assessed disease risks by genotype-based logistic regression.For the latter type of analysis, we modeled the presence or absence ofthe high-risk HLA-DRB1 genotype (NR or RR) as a dichotomousvariable and for BTNL2, considered the dosage of the A allele (i.e., 0, 1or 2). Both genes were significant risk factors at the 1% significancelevel, but their interaction was not significant (P ¼ 0.44). Finally,we carried out group genotyping for the HLA-DPB1 and HLA-DQB1loci, resolving alleles with frequencies 45% in the Germanpopulation (Supplementary Table 3 online). Joint analyses withBTNL2 yielded results similar to HLA-DRB1.
The susceptibility allele of rs2076530 is characterized by ORs of1.60 in heterozygotes and 2.75 in homozygotes. The SNP thereforehas moderate influence on individual disease risk but makes a sub-stantial contribution at the population level (population attributablerisk ¼ 23% for heterozygotes and homozygotes). This is notable giventhe profound impact of the SNP on BTNL2 protein structure andfunction, an apparent discrepancy that may be explained by a highlyredundant system of costimulatory molecules, including the products ofthe butyrophilin gene cluster, B7-1 and other, as yet unknown membersof the same functional class of proteins. The human BTN gene clusterwas recently localized to chromosome 6p22 (ref. 14), B6 Mb telomericof BTNL2. For completeness, we also genotyped six markers from theBTN cluster in the combined ‘basic’ and ‘extended’ samples but foundno evidence for disease association (data not shown).
One of the principal costimulatory pathways for naive T cellsis initiated when CTLA-4 and CD28 engage B7 class molecules inthe context of a primary signal, delivered through the TCR26. TheB7-1 protein (encoded by CD80) is a costimulatory molecule withknown anti-inflammatory activity mediated through interaction withCTLA-4 (refs. 27,28). Deletion of the IgC domain in CD80 had a
a b
*BTNL2-L
BTNL2-S
Total cell lysate
BTNL2-L V5
BTNL2-S V5
Mock V5 –+
–––
– ++–
kDa
50
30
BTNL2-L
BTNL2-S
Membrane fraction
BTNL2-L V5
BTNL2-S V5
Mock V5 –+
–––
– ++–
kDa
50
30
c
Figure 5 Subcellular localization of the long and truncated forms of BTNL2
protein. (a,b) Fluorescence images of HeLa cells transiently transfected with
allelic BTNL2-GFP fusion proteins. (a) BTNL-L: long, untruncated protein
(G allele at rs2076530). (b) BTNL-S: short, truncated protein (A allele with
4-bp deletion). The truncated protein is not localized in membranes but
rather in vesicular structures in the cytoplasm. The long, untruncated protein
shows a ubiquitous membrane distribution in the nuclear envelope, in
vesicular membranes and a fine granular pattern at the plasma membrane.
(c) Western blots (using antibody to Flag-V5) of total cell lysates (right top
panel) and Triton-soluble membrane fractions (left bottom panel) of HeLacells transiently transfected with BTNL2-V5 constructs. Transfection with
vectors containing mock V5 tag, BTNL2-L and BTNL2-S is indicated below
each blot. The asterisk indicates an unspecific band detected by the
V5 antibody.
3 62 VOLUME 37 [ NUMBER 4 [ APRIL 2005 NATURE GENETICS
A R T I C L E S©
2005
Nat
ure
Pub
lishi
ng G
roup
ht
tp://
ww
w.n
atur
e.co
m/n
atur
egen
etic
s
substantial proinflammatory effect in a mouse plasmid vaccinationmodel29. On the basis of amino acid homology and domain structure,we modeled BTNL2 on B7-1 (Fig. 4). Therefore, a potential T-celldownregulatory function of BTNL2 could be impaired by the truncat-ing mutation rs2076530 and the concomitant loss of the IgC domainand transmembrane helix, possibly by the lack of membrane localiza-tion (Fig. 5). Inappropriate T-cell activation would also be compatiblewith the clinical immunology of sarcoidosis, characterized by adysregulated T-helper cell activation30. The BTNL2 transcript isexpressed in diseased tissue and is inducible by LPS (Fig. 4) inmacrophages, supporting the idea that BTNL2 has a putative role asa costimulatory molecule, because its activation pattern resemblesthose of CD80 and CD86 (ref. 31).
The importance of costimulation and its dysfunction in manyautoimmune disorders is increasingly recognized32. Our findingsalso highlight the importance of this pathway, as CTLA-4, a prototypeof a putative BTNL2 receptor, is a risk factor for a wide range ofautoimmune disorders, including type I diabetes, autoimmunehypothyroidism and Graves disease32. The exact functional role ofBTNL2 in the costimulatory system remains to be elucidated. Theidentification of a major variant in BTNL2 as a risk factor forsarcoidosis will give new impetus to the investigation of immunolo-gical costimulation and may provide a perspective for future ther-apeutic targeting of this disorder.
METHODSSample recruitment. Index individuals were contacted between 2000 and 2003
either through specialized hospitals and general practitioners or through the
German Sarcoidosis Patient Organization (Deutsche Sarkoidose-Vereinigung
e. V.). All diagnoses were made on the basis of the International Consensus
Statement on Sarcoidosis33,34. An overview of the individuals is given in Table 1
and Supplementary Table 1 online. We interviewed individuals and families
with sarcoidosis by telephone about their individual and familial sarcoidosis
history. All individuals (families and singletons) completed a questionnaire
about the course of their disease. We contacted physicians to confirm the
diagnosis and also verified the presence of sarcoidosis by biopsy in 78% of cases
from the ‘basic’ sample, 90% of cases from the ‘extension’ sample and 88% of
cases from the ‘replication’ sample. For the remaining cases, the clinical course
and radiology and laboratory data were sufficiently consistent with the
diagnosis of sarcoidosis33,34. All participants were of German origin and gave
written informed consent to participate in the study. The protocols were
approved in writing by the institutional ethics (Ethikkommission des Univer-
stitatsklinikums Schleswig-Holstein, Kiel und Lubeck) and data protection
authorities (Landesdatenschutzbeauftragter Schleswig-Holstein).
Genotyping and sequencing. We genotyped SNPs as previously described,
using TaqMan (Applied Biosystems) technology on an automated platform and
a LIMS system running on an IBM x-server35,36. We sequenced genomic DNA
using Applied Biosystems BigDye chemistry in accordance with the supplier’s
recommendations. We genotyped HLA-DRB1 using group-specific primers in
PCRs on 2.5 ng of genomic DNA as described23. We subtyped the HLA-DRB1
locus and group typed the HLA-DQB1 and HLA-DPB1 loci using the same
methodology23. All markers were tested for Hardy-Weinberg equilibrium in
controls before inclusion in the association statistics.
cDNA cloning and RT-PCR. To verify the published BTNL2 gene model, we
searched for conserved exons in mouse and human genomic sequences
(Twinscan gene predictions) and related them to predicted splice sites. We
verified the predicted exons by RT-PCR in a pool of cDNA tissue samples
(Human Multiple Tissue cDNA Panels I and II, Clontech) and by subsequent
cloning and sequencing of PCR products.
We obtained BAL cell cDNA samples from individuals with sarcoidosis with
overt disease and from controls in accordance with standard clinical and
molecular procedures37. BAL samples from patients and controls were matched
for their cell count differentials (Supplementary Note online). For expression
analysis, we carried out nested PCR. All primer sequences are available on
request. In both amplification rounds, we used the following thermoprofile: an
initial denaturation step (3 min at 95 1C); 35 cycles of 30 s at 93 1C, 30 s at
59 1C and 30 s at 72 1C; and a final hold at 72 1C for 10 min. We amplified
GAPDH in a non-nested PCR using the same thermoprofile.
Statistical analysis. We carried out single-locus and haplotype TDTs using the
TRANSMIT38 and GENEHUNTER39 programs. In families with multiple
affected individuals, one trio was randomly extracted for TDT analysis. We
obtained haplotype frequency estimates among single cases using an imple-
mentation of the EM algorithm (HAPMAX)40. We also used HAPMAX for
significance testing of haplotype frequency differences, making use of the fact
that twice the log-likelihood ratio between two nested data models approxi-
mately follows a w2 distribution with k degrees of freedom, where k is the
difference in parameter number between the two models. We assessed the
significance of associations with or between single-locus genotypes using w2 or
Fisher’s exact tests for 2�3 contingency tables. We carried out genotype-based
logistic regression analysis with SPSS and SAS, coding individual SNP geno-
types as categorical variables.
In silico protein analysis. We retrieved protein domain architectures from the
Pfam database and examined them through the NCBI conserved domain
search website. To predict the 3D structure of the BTNL2 gene product,
we explored all fold recognition servers available through the meta-server
BioInfo.PL. On the basis of the prediction results, we constructed a sequence-
structure alignment of BTNL2 to B7-1 (Supplementary Fig. 1 online) for the
3D modeling server WHAT IF, which returned a full-atom structure model of
the second IgV and the following IgC domain of BTNL2. Additional details are
given in Supplementary Methods online.
Generation of BTNL2 expression constructs. We constructed full-length allelic
variants of the BTNL2 transcript (BTNL2-L and BTNL2-S) from clones
generated during the gene model verification. We cloned fragments into the
expression vector pEGFP-N2 (Clontech) and transfected HeLa cells with 1 mg of
the respective constructs, in accordance with the manufacturer’s protocol
(Fugene 6, Roche). Empty pEGFP-N2 vector served as the positive control.
We fixed cells in 4% paraformaldehyde in phosphate-buffered saline (pH 7.6)
after 24 h and mounted them onto glass slides in 1:1 glycerol in phosphate-
buffered saline. Fluorescence was visualized with an epifluorescence microscope
(Axiophot, Zeiss).
We ligated full-length coding sequences for the long and short isoforms of
BTNL2 into pcDNA3.1TOPO V5 vector (Invitrogen) to generate expression
constructs for BTNL2-L and-S with a C-terminal V5 tag. We carried out cell
fractionation as described41. We lysed transfected cells in hypotonic buffer and
added sucrose to the homogenate at a final concentration of 250 mM.
Centrifugation at 1,000g for 10 min at 4 1C removed nonhomogenated debris.
We centrifuged the supernatant at 60,000g for 2 h at 4 1C. The supernatant
from this step was considered the cytosolic fraction. We resuspended the pellet
in lysis buffer containing 2% Triton X-100 and pelleted the Triton-insoluble
fraction by centrifugation at 16,000g for 45 min at 4 1C. The remaining
supernatant contained the Triton-soluble membrane protein fraction. To
prepare total cell lysate, we pelleted cells and lysed them in denaturing lysis
buffer as described42. We detected BTNL-2 V5 variants using a monoclonal
antibody to Flag-V5 (Invitrogen) at 1:5,000 dilution.
URLs. All primer and probe sequences are available at http://www.mucosa.de/
sarcoidosis/btnl2/. Assay onDemand genotyping assays are available from
http://myscience.appliedbiosystems.com/. For splice site prediction, we used
http://www.fruitfly.org/seq_tools/splice.html. HAPMAX is available at http://
www.uni-kiel.de/medinfo/mitarbeiter/krawczak/download/ and the WHAT IF
server is available at http://www.cmbi.kun.nl/WIWWWI/.
Note: Supplementary information is available on the Nature Genetics website.
ACKNOWLEDGMENTSWe thank all affected individuals, families, physicians, the German SarcoidosisPatient Organization (Deutsche Sarcoidose-Vereinigung e. V.) and thecontributing pulmonary specialist physicians for their cooperation; M. Albrecht,T. Wesse, P. Petersen, T. Henke, S. Kroger and I. Gorlich for technical help;
NATURE GENETICS VOLUME 37 [ NUMBER 4 [ APRIL 2005 36 3
A R T I C L E S©
2005
Nat
ure
Pub
lishi
ng G
roup
ht
tp://
ww
w.n
atur
e.co
m/n
atur
egen
etic
s

P. Croucher and S. Jenisch for discussions and providing reagents; C. Manasterfor database support; and H. Brade for providing the LPS. This study wassupported by the German National Genome Research Network, the GermanHuman Genome Project, the German Research Council, the BioSapiensNoE of the EU, the POPGEN population project, MucosaimmunologieForschungsgesellschaft, Applied Biosystems and a SUR grant from IBM.
AUTHORS’ CONTRIBUTIONSR.V. helped to develop the SNP, HLA-DRB1, HLA-DQB1 and HLA-DPB1 assaysand carried out genotyping, mutation detection and basic data analysis. J.H.prepared the manuscript and performed the data analysis, experimental planning,strategy and method development. K.H. and M.P. carried out cDNA cloning andsplice assays. P.R. and D.S. carried out expression analysis and transfectionexperiments. A.S. and A.K. helped to develop the SNP assay. M.N.: helped todesign the HLA-DRB1, HLA-DQB1 and HLA-DPB1 assays. A.F. carried outgenotyping of HLA-DRB1, HLA-DQB1 and HLA-DPB1. K.I.G. carried out BALcDNA work. R.H. carried out expression analysis. M.K. helped with data analysisand preparation of the manuscript. M.A. and T.L. helped with preparation of themanuscript and in silico analysis. E.S., M.S. and J.M.Q. helped with experimentaldesign, patient recruitment, clinical characterization and preparation of themanuscript. N.R. and S.E. carried out induction experiments in monocytes.S.S. helped with experimental strategy and preparation of the manuscript.
COMPETING INTERESTS STATEMENTThe authors declare competing financial interests (see the Nature Genetics websitefor details).
Received 18 June 2004; accepted 12 January 2005
Published online at http://www.nature.com/naturegenetics/
1. Newman, L.S., Rose, C.S. & Maier, L.A. Sarcoidosis. N. Engl. J. Med. 336, 1224–1234 (1997).
2. Ziegenhagen, M. & Muller-Quernheim, J. The cytokine network in sarcoidosis and itsclinical relevance. J. Intern. Med. 253, 18–30 (2003).
3. Rybicki, B.A. et al. Familial aggregation of sarcoidosis. A case-control etiologicstudy of sarcoidosis (ACCESS). Am. J. Respir. Crit. Care Med. 164, 2085–2091(2001).
4. Schurmann, M. et al. Results from a genome-wide search for predisposing genesin sarcoidosis. Am. J. Respir. Crit. Care. Med. 164, 840–846 (2001).
5. Sato, H. et al. HLA-DQB1*0201: a marker for good prognosis in British andDutch patients with sarcoidosis. Am. J. Respir. Cell. Mol. Biol. 27, 406–412(2002).
6. Foley, P.J. et al. Human leukocyte antigen-DRB1 position 11 residues are acommon protective marker for sarcoidosis. Am. J. Respir. Cell. Mol. Biol. 25, 272–277 (2001).
7. Rybicki, B.A. et al. The major histocompatibility complex gene region and sarcoidosissusceptibility in african americans. Am. J. Respir. Crit. Care Med. 167, 444–449(2003).
8. Rossman, M.D. et al. HLA-DRB1*1101: a significant risk factor for sarcoidosis inblacks and whites. Am. J. Hum. Genet. 73, 720–735 (2003).
9. Grutters, J.C. et al. Increased frequency of the uncommon tumor necrosis factor -857Tallele in British and Dutch patients with sarcoidosis. Am. J. Respir. Crit. Care. Med.165, 1119–1124 (2002).
10. Abdallah, A. et al. Inhibitor kappa B-alpha (IkappaB-alpha) promoter polymorphisms inUK and Dutch sarcoidosis. Genes Immunity 4, 450–454 (2003).
11. Stammers, M., Rowen, L., Rhodes, D., Trowsdale, J. & Beck, S. BTL-II: a polymorphiclocus with homology to the butyrophilin gene family, located at the border of the majorhistocompatibility complex class II and class III regions in human and mouse.Immunogenetics 51, 373–382 (2000).
12. Krawczak, M., Reiss, J. & Cooper, D.N. The mutational spectrum of single base-pairsubstitutions in mRNA splice junctions of human genes: causes and consequences.Hum. Genet. 90, 41–54 (1992).
13. Long, M. & Deutsch, M. Association of intron phases with conservation at splice sitesequences and evolution of spliceosomal introns. Mol. Biol. Evol. 16, 1528–1534(1999).
14. Rhodes, D.A., Stammers, M., Malcherek, G., Beck, S. & Trowsdale, J. The cluster ofBTN genes in the extended major histocompatibility complex. Genomics 71, 351–362(2001).
15. Sharpe, A.H. & Freeman, G.J. The B7-CD28 superfamily. Nat. Rev. Immunol. 2,116–126 (2002).
16. Albrecht, M., Domingues, F.S., Schreiber, S. & Lengauer, T. Identification of mamma-lian orthologs associates PYPAF5 with distinct functional roles. FEBS Lett. 538,173–177 (2003).
17. Ikemizu, S. et al. Structure and dimerization of a soluble form of B7-1. Immunity 12,51–60 (2000).
18. Schwartz, J.C., Zhang, X., Fedorov, A.A., Nathenson, S.G. & Almo, S.C. Structuralbasis for co-stimulation by the human CTLA-4/B7-2 complex. Nature 410, 604–608(2001).
19. Stamper, C.C. et al. Crystal structure of the B7-1/CTLA-4 complex that inhibitshuman immune responses. Nature 410, 608–611 (2001).
20. Zhang, X., Schwartz, J.C., Almo, S.C. & Nathenson, S.G. Crystal structure of thereceptor-binding domain of human B7-2: insights into organization and signaling.Proc. Natl. Acad. Sci. USA 100, 2586–2591 (2003).
21. Bajorath, J. Structural biology of T-cell costimulatory proteins: New insights, moresurprises. J. Mol. Graph. Model. 19, 619–623 (2001).
22. Reiling, N., Blumenthal, A., Flad, H.D., Ernst, M. & Ehlers, S. Mycobacteria-inducedTNF-alpha and IL-10 formation by human macrophages is differentially regulated atthe level of mitogen-activated protein kinase activity. J. Immunol. 167, 3339–3345(2001).
23. Hampe, J. et al. A non-electrophoretic method for high-throughput HLA-DRB1 groupgenotyping. Biotechniques 36, 148–151 (2004).
24. Morton, N.E. & Collins, A. Tests and estimates of allelic association in complexinheritance. Proc. Natl. Acad. Sci. USA 95, 11389–11393 (1998).
25. Stenzel, A. et al. Patterns of linkage disequilibrium in the MHC region on humanchromosome 6p. Hum. Genet. 114, 377–385 (2004).
26. Walunas, T.L., Bakker, C.Y. & Bluestone, J.A. CTLA-4 ligation blocks CD28-dependentT cell activation. J. Exp. Med. 183, 2541–2550 (1996).
27. Borriello, F. et al. B7-1 and B7-2 have overlapping, critical roles in immunoglobulinclass switching and germinal center formation. Immunity 6, 303–313 (1997).
28. Collins, A.V. et al. The interaction properties of costimulatory molecules revisited.Immunity 17, 201–210 (2002).
29. Agadjanyan, M.G. et al. Costimulatory molecule immune enhancement in a plasmidvaccine model is regulated in part through the Ig constant-like domain of CD80/86.J. Immunol. 171, 4311–4319 (2003).
30. Zissel, G. et al. Human alveolar epithelial cells type II are capable of regulating T-cellactivity. J. Investig. Med. 48, 66–75 (2000).
31. Hoebe, K. et al. Upregulation of costimulatory molecules induced by lipopolysacchar-ide and double-stranded RNA occurs by Trif-dependent and Trif-independent path-ways. Nat. Immunol. 4, 1223–1229 (2003).
32. Ueda, H. et al. Association of the T-cell regulatory gene CTLA4 with susceptibilityto autoimmune disease. Nature 423, 506–511 (2003).
33. Costabel, U. & Hunninghake, G.W. ATS/ERS/WASOG statement on sarcoidosis. Sar-coidosis Statement Committee. American Thoracic Society. European RespiratorySociety. World Association for Sarcoidosis and Other Granulomatous Disorders.Eur. Respir. J. 14, 735–737 (1999).
34. Statement on sarcoidosis. Joint Statement of the American Thoracic Society (ATS), theEuropean Respiratory Society (ERS) and the World Association of Sarcoidosis andOther Granulomatous Disorders (WASOG) adopted by the ATS Board of Directors andby the ERS Executive Committee. Am. J. Respir. Crit. Care Med. 160, 736–755(1999).
35. Hampe, J. et al. Evidence for a NOD2-independent susceptibility locus for inflamma-tory bowel disease on chromosome 16p. Proc. Natl. Acad. Sci. USA 99, 321–326(2002).
36. Hampe, J. et al. An integrated system for high throughput TaqMan based SNPgenotyping. Bioinformatics 17, 654–655 (2001).
37. Hunninghake, G.W., Gadek, J.E., Kawanami, O., Ferrans, V.J. & Crystal, R.G. Inflam-matory and immune processes in the human lung in health and disease: evaluation bybronchoalveolar lavage. Am. J. Pathol. 97, 149–206 (1979).
38. Clayton, D. & Jones, H. Transmission/disequilibrium tests for extended markerhaplotypes. Am. J. Hum. Genet. 65, 1161–1169 (1999).
39. Kruglyak, L., Daly, M.J., Reeve Daly, M.P. & Lander, E.S. Parametric and nonpara-metric linkage analysis: a unified multipoint approach. Am. J. Hum. Genet. 58, 1347–1363 (1996).
40. Krawczak, M. et al. Allelic association of the cystic fibrosis locus and two DNA markers,XV2c and KM19, in 55 German families. Hum. Genet. 80, 78–80 (1988).
41. Legouis, R. et al. Basolateral targeting by leucine-rich repeat domains in epithelialcells. EMBO Rep. 4, 1096–1102 (2003).
42. Rosenstiel, P. et al. TNF-alpha and IFN-gamma regulate the expression of the NOD2(CARD15) gene in human intestinal epithelial cells. Gastroenterology 124, 1001–1009 (2003).
3 64 VOLUME 37 [ NUMBER 4 [ APRIL 2005 NATURE GENETICS
A R T I C L E S©
2005
Nat
ure
Pub
lishi
ng G
roup
ht
tp://
ww
w.n
atur
e.co
m/n
atur
egen
etic
s

CORR IGENDA
Corrigendum: Sarcoidosis is associated with a truncating splice site muta-tion in the gene BTNL2R Valentonyte, J Hampe, K Huse, P Rosenstiel, M Albrecht, A Stenzel, M Nagy, K I Gaede, A Franke, R Haesler, A Koch, T Lengauer, D Seegert, N Reiling, S Ehlers, E Schwinger, M Platzer, M Krawczak, J Müller-Quernheim, M Schürmann & S SchreiberNat. Genet. 37, 357–364 (2005).
In the version of Supplementary Table 3 initially published online, the nomenclature of DQB and DPB alleles was partly incorrect. The errors have now been corrected and Supplementary Table 3 has been replaced. Neither the stratified analyses that highlighted the independence of the BTNL2 effect from the two HLA loci (Supplementary Table 3 online) nor any other conclusions of the manuscript were affected by these mistakes.
AOP ADVANCE ONLINE PUBLICATION NATURE GENETICS
©20
05 N
atur
e P
ublis
hing
Gro
up
http
://w
ww
.nat
ure.
com
/nat
ureg
enet
ics