Corrigendum to “Unveiling the hydrothermal mineralogy of the Chapi Chiara gold prospect, Peru,...
17
Unveiling the hydrothermal mineralogy of the Chapi Chiara gold prospect, Peru, through reflectance spectroscopy, geochemical and petrographic data Thais Andressa Carrino a , Alvaro Penteado Crósta a, ⁎, Catarina Labouré Bemfica Toledo b,1 , Adalene Moreira Silva b,2 a Institute of Geosciences, University of Campinas, R. João Pandiá Calógeras, 51, 13083-870 Campinas, São Paulo, Brazil b Institute of Geosciences, University of Brasília, Campus Universitário Darcy Ribeiro S/n, Asa Norte, Brasília, DF 70910-900, Brazil abstract article info Article history: Received 22 April 2014 Received in revised form 10 July 2014 Accepted 16 July 2014 Available online 25 July 2014 Keywords: Epithermal system Reflectance spectroscopy Sequential indicator simulation Mineralogy Geochemistry Southern Peru Southern Peru contains important epithermal Au–Ag (±base metals) deposits, such as Canahuire, Tucari, Santa Rosa, Caylloma, Shila and Paula. The Chapi Chiara gold prospect is located in this region and is part of a paleo- stratovolcano of the Upper Miocene–Pliocene. The hydrothermal alteration of the prospect was characterized based on spectroradiometric data, geochemistry and petrography. The mineralogical data, interpreted based on reflectance spectroscopy, were spatialized using the sequential indicator simulation technique for producing probabilistic maps of alteration. The inner part of the paleo-stratovolcano (SW sector) is marked by three main cores of advanced argillic alteration (AAA) (quartz–alunite supergroup minerals–kaolinite–dickite ± topaz ± pyrophyllite ± diaspore) associated with topographic highs. The AAA1 core is surrounded by argillic alteration (quartz–illite–paragonitic illite–smectite ± pyrite) and propylitic alteration (quartz–plagioclase–chlorite– calcite–epidote–smectite ± kaolinite ± pyrite ± chalcopyrite ± magnetite). The central sector of the prospect, situated in the NE flank of the paleo-stratovolcano, is characterized by hydrothermal breccias struc- tured towards N65E. The main mineral phases comprise quartz and abundant pyrite, sometimes with traces of As. Anomalous geochemical values of Ag, As, Bi, Hg, Se, Sb and Te coincide with high gold contents in this sector of the prospect. Jarosite and goethite are evidence of a subsequent supergene event. Based on the mineralogical characterization, we conclude the existence of a high sulfidation epithermal system in Chapi Chiara. Hypogene minerals of higher temperature in the SW sector of the prospect, such as diaspore, pyrophyllite and topaz in the AAA zone, and epidote in the propylitic alteration zone, can reveal that the system is currently in a relatively deep erosion level, suggesting its proximity in relation to the interface between a deep epithermal system and a mesothermal system. © 2014 Elsevier B.V. All rights reserved. 1. Introduction Peru is characterized by a series of metallogenetic belts oriented par- allel to the Andean Cordillera. These belts were formed in metallogenetic times ranging from Paleozoic to Cenozoic (de la Cruz, 1998). The origin of the mineralization is due to orogenesis associated with the formation of the Andean Cordillera which, in turn, favored the occurrence of metallogenetic processes for the concentration of metals, with the forma- tion of deposits such as the epithermal- and porphyry-type ones (Clark et al., 1990). The belts responsible for most of the Peruvian gold production are the Epithermal Au–Ag Belt of Miocene, which crosses the entire cenozo- ic volcanic domain of the Western Cordillera, and the Epithermal Au–Ag Belt of Miocene–Pliocene, restricted to the south-central part of the Peruvian Cordillera (12°30′S–18°00′S) (Fig. 1A) (Acosta et al., 2008; Carlotto et al., 2009; Quispe et al., 2008). In southern Peru, magmatism and metallogenetic belts were con- trolled by NW–SE, E–W and N–S fault systems. The epithermal Au and/or Ag (±base metals) deposits are characterized by ages between ~18 and ~4 Ma. Examples of low to intermediate sulfidation deposits include Caylloma (~18 Ma—Echavarria et al., 2006), Selene (~14 Ma— Acosta et al., 2008; Palácios et al., 2004), Shila and Paula (~10 Ma— Cassard et al., 2000; Chauvet et al., 2006), Arcata (~5 Ma—Candiotti Ore Geology Reviews 64 (2015) 299–315 ⁎ Corresponding author at: Institute of Geosciences/University of Campinas, R. João Pandiá Calógeras, 51, 13083-970, Campinas-São Paulo, Brazil. Tel.: +55 19 35215120. E-mail addresses: [email protected] (T.A. Carrino), [email protected] (A.P. Crósta), [email protected] (C.L.B. Toledo), [email protected] (A.M. Silva). 1 Tel.: +55 61 3107 6969. 2 Tel.: +55 61 3107 6984. http://dx.doi.org/10.1016/j.oregeorev.2014.07.012 0169-1368/© 2014 Elsevier B.V. All rights reserved. Contents lists available at ScienceDirect Ore Geology Reviews journal homepage: www.elsevier.com/locate/oregeorev
Transcript of Corrigendum to “Unveiling the hydrothermal mineralogy of the Chapi Chiara gold prospect, Peru,...

Ore Geology Reviews 64 (2015) 299–315
Contents lists available at ScienceDirect
Ore Geology Reviews
j ourna l homepage: www.e lsev ie r .com/ locate /oregeorev
Unveiling the hydrothermal mineralogy of the Chapi Chiara goldprospect, Peru, through reflectance spectroscopy, geochemical andpetrographic data
Thais Andressa Carrino a, Alvaro Penteado Crósta a,⁎,Catarina Labouré Bemfica Toledo b,1, Adalene Moreira Silva b,2
a Institute of Geosciences, University of Campinas, R. João Pandiá Calógeras, 51, 13083-870 Campinas, São Paulo, Brazilb Institute of Geosciences, University of Brasília, Campus Universitário Darcy Ribeiro S/n, Asa Norte, Brasília, DF 70910-900, Brazil
⁎ Corresponding author at: Institute of Geosciences/UPandiá Calógeras, 51, 13083-970, Campinas-São Paulo, Br
E-mail addresses: [email protected] (T.A. Carrin(A.P. Crósta), [email protected] (C.L.B. Toledo), adale
1 Tel.: +55 61 3107 6969.2 Tel.: +55 61 3107 6984.
http://dx.doi.org/10.1016/j.oregeorev.2014.07.0120169-1368/© 2014 Elsevier B.V. All rights reserved.
a b s t r a c t
a r t i c l e i n f oArticle history:Received 22 April 2014Received in revised form 10 July 2014Accepted 16 July 2014Available online 25 July 2014
Keywords:Epithermal systemReflectance spectroscopySequential indicator simulationMineralogyGeochemistrySouthern Peru
Southern Peru contains important epithermal Au–Ag (±base metals) deposits, such as Canahuire, Tucari, SantaRosa, Caylloma, Shila and Paula. The Chapi Chiara gold prospect is located in this region and is part of a paleo-stratovolcano of the Upper Miocene–Pliocene. The hydrothermal alteration of the prospect was characterizedbased on spectroradiometric data, geochemistry and petrography. The mineralogical data, interpreted basedon reflectance spectroscopy, were spatialized using the sequential indicator simulation technique for producingprobabilistic maps of alteration. The inner part of the paleo-stratovolcano (SW sector) is marked by three maincores of advanced argillic alteration (AAA) (quartz–alunite supergroup minerals–kaolinite–dickite ± topaz ±pyrophyllite ± diaspore) associated with topographic highs. The AAA1 core is surrounded by argillic alteration(quartz–illite–paragonitic illite–smectite ± pyrite) and propylitic alteration (quartz–plagioclase–chlorite–calcite–epidote–smectite ± kaolinite ± pyrite ± chalcopyrite ± magnetite). The central sector of theprospect, situated in the NE flank of the paleo-stratovolcano, is characterized by hydrothermal breccias struc-tured towards N65E. The main mineral phases comprise quartz and abundant pyrite, sometimes with traces ofAs. Anomalous geochemical values of Ag, As, Bi, Hg, Se, Sb and Te coincide with high gold contents in this sectorof the prospect. Jarosite and goethite are evidence of a subsequent supergene event. Based on the mineralogicalcharacterization, we conclude the existence of a high sulfidation epithermal system in Chapi Chiara. Hypogeneminerals of higher temperature in the SW sector of the prospect, such as diaspore, pyrophyllite and topaz inthe AAA zone, and epidote in the propylitic alteration zone, can reveal that the system is currently in a relativelydeep erosion level, suggesting its proximity in relation to the interface between a deep epithermal system and amesothermal system.
© 2014 Elsevier B.V. All rights reserved.
1. Introduction
Peru is characterized by a series of metallogenetic belts oriented par-allel to the Andean Cordillera. These belts were formed inmetallogenetictimes ranging from Paleozoic to Cenozoic (de la Cruz, 1998). The originof the mineralization is due to orogenesis associated with the formationof the Andean Cordillera which, in turn, favored the occurrence of
niversity of Campinas, R. Joãoazil. Tel.: +55 19 35215120.o), [email protected]@unb.br (A.M. Silva).
metallogenetic processes for the concentration ofmetals, with the forma-tion of deposits such as the epithermal- and porphyry-type ones (Clarket al., 1990).
The belts responsible for most of the Peruvian gold production arethe Epithermal Au–Ag Belt ofMiocene, which crosses the entire cenozo-ic volcanic domain of theWestern Cordillera, and the Epithermal Au–AgBelt of Miocene–Pliocene, restricted to the south-central part of thePeruvian Cordillera (12°30′S–18°00′S) (Fig. 1A) (Acosta et al., 2008;Carlotto et al., 2009; Quispe et al., 2008).
In southern Peru, magmatism and metallogenetic belts were con-trolled by NW–SE, E–W and N–S fault systems. The epithermal Auand/or Ag (±base metals) deposits are characterized by ages between~18 and ~4 Ma. Examples of low to intermediate sulfidation depositsinclude Caylloma (~18 Ma—Echavarria et al., 2006), Selene (~14 Ma—Acosta et al., 2008; Palácios et al., 2004), Shila and Paula (~10 Ma—Cassard et al., 2000; Chauvet et al., 2006), Arcata (~5 Ma—Candiotti

Fig. 1. Location of the Chapi Chiara prospect in relation to themain epithermal Au–Ag belts of southern Peru (A) (modified fromCarlotto et al., 2009). A simplified geological map of ChapiChiara is shown in (B) (Rodríguez et al., 2000), including the location of the rock samples analyzed for reflectance spectroscopy, petrography, semiquantitative mineral chemistry (SEM-EDS) and whole rock geochemistry (determination of Ag, As, Au, Bi, Hg, Mo, Sb, Se, and Te contents using ICP-MS).
300 T.A. Carrino et al. / Ore Geology Reviews 64 (2015) 299–315
et al., 1990), Canahuire (Santos et al., 2011); examples of highsulfidation deposits include Poracota (~14 Ma—Sarmiento et al.,2010), Santa Rosa (~7 Ma) and Tucari (~4 Ma) (Barreda et al., 2004 inCarlotto et al., 2009; Loayza et al., 2004), as well as the CerroMillo pros-pect (~11 Ma—Hennig et al., 2008) (Fig. 1A).
The high sulfidation systems are preferentially located in theextreme southern Peru, near the boundary of Puno and Moqueguaprovinces (Fig. 1A), and are related to the volcanism of the UpperMiocene–Pliocene. The volcanic events are temporally associatedwith the Quechua compressive phases of the Andean Orogeny(Benavides-Cáceres, 1999).
In the Quechua Phase I (~17 Ma), deformational events occurredin southern Peru, registered by open folds and reactivation of faultsformed during the Peruvian (84–79 Ma: NW–SE faults) and Incaic(59–22 Ma: NE–SW, E–W and NW–SE faults) compressive phasesin pre-existing sedimentary and volcanic rocks (Benavides-Cáceres,1999). After this phase, erosion events and a shallow lacustrine envi-ronment predominated. In this episode, between ~11 and 8 Ma, sed-imentary rocks (e.g., limestone, sandstone, mudstone, siltstone),interlayered with lava and tuffs of trachyandesitic, dacitic and rhyo-litic composition, were formed (Benavides-Cáceres, 1999; Palácios,1995; Sánchez and León, 1995). These rocks comprise the MaureGroup and the Capillune Formation, both occurring in the studyarea (Fig. 1B).
Between the compressive phases Quechua II (~8–7 Ma) and III(~5–4 Ma), the volcanic sequence of the Barroso Group was formed.It is characterized by andesite and trachyandesite, in addition to tuffswith similar composition and, less commonly, with rhyolitic compo-sition (Benavides-Cáceres, 1999; Marocco and Del Pino, 1966;Palácios, 1995; Sánchez and León, 1995). Rhyolitic tuffs are predom-inant in the Sencca Formation, which is interpreted as a contempo-rary unit to the Barroso Group (Sánchez and León, 1995). Currentrecords of well-preserved paleo-stratovolcanoes, as in Cerro Millo, areevidence of volcanic activity from this period. The migration of theBarroso magmatic arc towards the Peru–Chile trench resulted in thecurrent active volcanism to the west of the high sulfidation epithermalsystems above mentioned (Benavides-Cáceres, 1999; Mamani et al.,2010).
The Chapi Chiara gold prospect, recently investigated by Gold FieldsInc. and Vena Resources Inc., is located next to Canahuire, Tucari andSanta Rosa deposits, as well as San Antonio de Esquilache (an oldmine exploited for Cu, Pb, Ag, Zn and Au since colonial times)(Canchaya and Aranda, 1995) and Cerro Millo (a gold-bearing highsulfidation epithermal system) (Hennig et al., 2008) (Fig. 1A andTable 1).
Chapi Chiara is the focus of this study,which is based on the integrat-ed analysis of reflectance spectroscopy, geochemical and petrographicdata. The goal is to determine the mineralogy and chemistry of the

Table1
Synthe
sisof
thege
olog
ical
characteristicsof
somehigh
sulfida
tion
epithe
rmal
depo
sits
andprospe
ctassociated
withvo
lcan
icrocksof
theMau
rean
d/or
BarrosoGroup
sin
southe
rnPe
ru.
Dep
ositor
prospe
ctMineralizationag
eHostrock
(s)
Hyd
roterm
alalteration
Mainoremineral(s)
Mainga
ngue
minerals
Referenc
e
SantaRo
saan
dTu
caride
posits
(Au)
~7.00
Ma(San
taRo
sade
posit)
and~4.00
Ma(Tuc
arid
eposit)
BarrosoGroup
rock
s(~
8.00
–6.00
Ma):
paleo-stratovo
lcan
oesmarke
dby
trachy
ande
site
andda
cite
domes.
Cond
orom
a–Ca
yllomafaultsystem
andminor
E–W
faults
favo
redthe
emplacem
entof
theserock
s
Core
ofmassive
silic
aan
dvu
ggyqu
artz;q
uartz–
alun
ite
zone
occu
rsin
thedistal
parts
Pyrite
anden
argite.M
oraine
and
collu
vium
ofthesouthe
rnpa
rtsh
owgo
ldco
nten
tof
2g/t
(highe
rco
nten
tthan
ofprim
ary
origin:1
g/t)
Qua
rtz,su
lfatesan
dclay
minerals
Barred
aet
al.
(200
4)in
Carlotto
etal.(20
09);
Loay
zaet
al.(20
04)
CerroMilloprospe
ct(A
u(C
u,Ag))
10.80±
0.90
Ma(A
r–Arda
ting
ofhy
poge
nealun
ite)
Pred
ominan
ceof
ande
site,trach
yand
esite,
dacite,latitean
dpy
roclasticrock
sof
Mau
rean
d/or
Barrosogrou
ps(1
1,00
±0.50
Ma—
Ar–Arda
ting
ofbiotitefrom
ande
site
toda
cite
lava
withpo
rphy
ritictexture)
Core
ofad
vanc
edargillicalteration
(vug
gyqu
artz
andalun
ite),p
assing
toargillic(kao
linite–
smectite–qu
artz)
andprop
ylitic
(chlorite–
calcite–
epidote–
quartz)alteration
s.Po
ssible
porphy
ry-typ
esystem
atde
pth
Pyrite
Qua
rtz,su
lfatesan
dclay
minerals
Hen
niget
al.(20
08) Table 2
Parameters selected for the semivariogram generation of the most abundant mineralphases identified in the 671 spectroradiometric data.
Indicator's variable Azimuth Lags Lag size(m)
Width tolerance(m)
Angulartolerance
Kaolinite 90 Az. 15 200 10 45°180 Az. 17 200 10 45°
Alunite group minerals 50 Az. 20 160 20 45°320 Az. 20 150 20 45°
Smectite 90 Az 17 250 10 45°180 Az. 15 250 15 45°
Dickite 280 Az. 20 160 25 45°190 Az. 20 150 25 45°
Jarosite 60 Az. 17 200 20 45°150 Az. 15 210 20 45°
K-bearing alunite 45 Az. 20 165 15 45°135 Az. 18 155 20 45°
Na-bearing alunite 270 Az. 18 150 20 45°360 Az. 18 160 20 45°
301T.A. Carrino et al. / Ore Geology Reviews 64 (2015) 299–315
alteration zones of this hydrothermal system, and to assess its potentialfor gold.
2. Materials
We used 671 reflectance spectroscopy measurements of rocksacquiredwith the TerraSpec™ spectroradiometer,manufactured byAn-alytical Spectral Devices (Fig. 1B). This instrument has a set of 512silicon detectors in the spectral range from 350 to 1000 nm (VNIR)and two other sets of InGaAs detectors related to the spectral rangefrom 1000 to 1800 nm (SWIR1) and from 1800 to 2500 nm(SWIR2), amounting to 2151 channels (TerraSpec Explorer,2011). A field of view of 2 cm in diameter was employed for themeasurements.
In addition, we conducted petrographic analysis of 37 thin sectionsof rock samples collected during the field stage in September 2011(Fig. 1B) to allow the characterization of the hydrothermal mineralogy,thus complementing the reflectance spectroscopy measures.
Table 3Parameters adopted for the semivariogrammodeling stage, in reference to themost abundant mineral phases identified in the 671 spectroradiometric data.
Indicator's variable Structure Model Range (Max./Med/Min.)(m)
Sill
Kaolinite 1 Nugget – 0.0452 Spherical 2754/2244/0 0.0803 Spherical 2992/2244/0 0.020
Alunite group minerals 1 Nugget – 0.0502 Spherical 1425/487/0 0.0203 Spherical 3750/3750/900 0.120
Smectite 1 Nugget – 0.0502 Spherical 4250/4250/2422 0.0103 Spherical 3315/2252/0 0.150
Dickite 1 Nugget – 0.0152 Spherical 4000/1680/0 0.0033 Spherical 4000/4000/0 0.050
Jarosite 1 Nugget – 0.0122 Spherical 3400/1530/0 0.0103 Spherical 3400/3400/1020 0.014
K-bearing alunite 1 Nugget – 0.0132 Spherical 2070/1759/1449 0.0903 Spherical 2028/869/869 0.070
Na-bearing alunite 1 Nugget – 0.0212 Spherical 1663/1188/0 0.0013 Spherical 1900/1533/1188 0.040
-

Fig. 2. Regional maps of mineral phases generated from the images of themean of 500 realizations for kaolinite, dickite, alunite groupminerals, jarosite and smectite, considering the fol-lowing probabilities of occurrence of theseminerals:≥25% (A),≥30% (B) and≥40% (C). The SWand central sectors of the prospect are indicated, aswell as examples of fresh volcanic rocksamples (CC-05 and CC-08).
302 T.A. Carrino et al. / Ore Geology Reviews 64 (2015) 299–315
Elemental analyses related to 506 rock samples (Fig. 1B) were obtainedin the ALS Chemex Laboratory (Peru) through the inductively coupledplasma mass spectrometry, after aqua regia digestion. Ag, As, Au, Bi,
Fig. 3. Simulated image of the alunite composition (probability of occurrence≥25%) integratedadvanced argillic (AAA) (black lines), argillic (red lines) and propylitic (white lines) alteration zalso indicated. (For interpretation of the references to color in this figure legend, the reader is
Hg, Mo, Sb, Se, and Te data were selected for this study. Semiquantita-tive chemical microanalyses were conducted using Zeiss LEO 430i andZeiss EVO MA15 scanning electron microscopes (SEM) coupled with
with the digital elevation data from ASTER GDEM and rock sampling points related to theones. The highest gold occurrences and the geomorphology of the paleo-stratovolcano arereferred to the web version of this article.)

Table 4Eigenvector matrix and eigenvalues derived from the application of the PCA technique to geochemical data associated with the central and SW sectors of the Chapi Chiara prospect.
Ag As Au Bi Hg Mo Sb Se Te Eigenvalue (%)
Central sector of the Chapi Chiara prospect (n = 184)PC1 0.626 0.674 0.812 0.624 0.737 0.413 0.725 0.823 0.710 47.942PC2 0.560 0.079 −0.206 −0.184 0.198 0.303 −0.516 −0.336 0.362 11.516PC3 −0.128 0.123 −0.229 0.227 −0.423 0.795 0.107 0.024 −0.103 10.757PC4 0.117 −0.454 −0.081 0.642 −0.005 −0.097 −0.020 −0.152 0.114 7.599PC5 0.335 −0.477 0.272 −0.269 −0.015 0.215 0.187 0.040 −0.265 7.109PC6 0.210 0.258 −0.109 0.162 0.201 −0.047 0.108 −0.221 −0.483 5.389PC7 −0.315 −0.115 0.103 0.030 0.405 0.216 −0.180 −0.023 −0.094 4.184PC8 −0.054 −0.086 −0.284 −0.118 0.173 0.026 0.325 −0.094 0.140 3.001PC9 −0.081 0.061 0.249 −0.006 −0.070 0.022 0.109 −0.356 0.095 2.503
SW sector of the Chapi Chiara prospect (n = 322)PC1 0.855 0.340 0.832 0.049 0.744 0.776 0.899 0.428 0.354 42.362PC2 −0.457 0.204 −0.400 0.168 0.337 −0.020 −0.073 0.710 0.489 14.468PC3 −0.009 0.458 −0.095 0.821 −0.143 −0.005 0.168 −0.051 −0.362 11.941PC4 0.076 −0.743 0.121 0.521 0.105 −0.117 −0.001 0.042 0.162 9.950PC5 −0.004 0.238 0.107 0.139 −0.111 −0.117 −0.045 −0.466 0.678 8.813PC6 0.127 0.145 0.171 −0.019 0.379 −0.557 −0.127 0.008 −0.110 6.092PC7 0.105 0.040 0.200 −0.014 −0.381 −0.171 −0.006 0.298 0.071 3.567PC8 0.007 0.049 0.164 0.067 0.038 0.178 −0.371 0.032 −0.023 2.295PC9 0.163 0.004 −0.126 0.005 −0.007 0.002 −0.052 0.013 0.023 0.512
303T.A. Carrino et al. / Ore Geology Reviews 64 (2015) 299–315
an energy dispersive X-ray spectrometer (EDS). The operating condi-tions included accelerating voltage and current flow of approximately20 kV and 3 nA, respectively.
Additionally, digital elevationmodel (DEM) data generated from theASTER sensor (ASTER GDEM), with spatial resolution of 30 m, wereobtained on the website http://gdem.ersdac.jspacesystems.or.jp/. Thesedata were used for generating the three-dimensional representation ofthe alteration systems presented in this paper.
3. Methods
3.1. Spectroradiometric data
The spectroradiometric data were analyzed visually and also withthe software The Spectral GeologistTM Professional (TSG PRO), version7.1.0.019, using the algorithm The Spectral Assistant (TSA) for compar-ison of the spectral curves of the rock samples with the spectral curvesfrom the reference library. The most abundant mineral phases recog-nized were: alunite group minerals, comprising alunite (or K-alunite),natroalunite (or Na-alunite) and alunite with intermediate composi-tion, as well as kaolinite, dickite, jarosite, goethite and smectite. Addi-tionally, illite, topaz, diaspore, chlorite, epidote, ammonium-bearing mineral, pyrophyllite and Ca-alunite (huangite) were alsoidentified.
To generatemaps showing the spatial distribution of alterationmin-erals, we used the sequential indicator simulation (SIS) technique. TheSIS is a stochastic technique that preserves the statistics of the originaldata, including the probabilistic reproduction of the variability of the re-gionalized variable, respecting the local probability distribution func-tion (pdf) of the original data and the semivariogram. The latter isnecessary for investigating the spatial continuity of the variable studiedin preferred directions (anisotropy) or in all directions (isotropy)(Goovaerts, 1997).
It is considered that the simulation of a categorical attribute z in Nnodes uj′ of a grid conditional to the data of the indicator's variableI(zk), with k = 1, …, K, follows these steps (Goovaerts, 1997):
(1) on each node u′, the parameters (mean and variance) of thecumulative distribution function F{(u′; zk (n))} are determinedusing the indicator kriging technique based on the semivariogrammodel (previously produced) of the indicator's variable. Theconditional information n comprises the original data of
the indicator's variable and those previously simulated {z(l)
(uj′); j = 1, …, N};(2) from this process, the simulated value z(l)(u′) is obtained,
which is added to the data set;(3) then, the next node is proceeded, repeating steps 1 to 2.
In this case study, the following mineral phases, previouslyinterpreted from the reflectance spectroscopy, were selected by theamount of sample points: kaolinite (102), alunite group minerals(100), smectite (191), dickite (48) and jarosite (65). For each of theseminerals, indicator's variables [0, 1] were generated, where 1 meanspresence of the investigated mineral phase at the sampling points and0 means absence of alteration or presence of other hydrothermal min-erals. This relationship is shown in Eq. (1):
I zkð Þ ¼ 1; if zk ¼ investigated mineral phase0; if zk≠investigated mineral phase ; ð1Þ
where I(zk) is the indicator's variable and zk is the mineral phase of thegiven k-th data (k = 1,…, 671).
From the generation of experimental semivariograms in twodirections (anisotropy) (Table 2) and their mathematical modeling(Table 3), we proceeded to produce 500 realizations (simulated im-ages), considering a gridwith cell size of 50m. Based on the 500 realiza-tions, we produced the image of the mean, indicating a probabilitybetween 0 and 100% of occurrence of the mineral indicator's variables.
The images of the mean of the 500 realizations were analyzedthrough probability cut-offs greater than, or equal to 25, 30 and 40%,and the mineral classes were combined on pixel-by-pixel basis andspatialized in a georeferenced information system (GIS). These resultsallowed to perform a regional probabilistic analysis of potential areasfor the occurrence of alunite groupminerals, kaolinite, dickite, smectite,jarosite and their mixtures (Fig. 2).
Alunite spectral data were also used for interpreting occurrencesof alunite bearing some K and/or Na, considering the occurrences ofsamples marked by the pure end-member (K- or Na-alunite), of mix-tures of both Na- and K-endmembers in the same sample, as well as oc-currences of alunite with intermediate compositions (Swayze et al.,2014). Thus, two indicator's variables were produced, associated with:(a) sampling points with K-bearing alunite [1], and sampling pointswith absence of alteration or presence of other hydrothermal minerals[0]; (b) sampling points with Na-bearing alunite [1], and sampling pointswith absence of alteration or presence of other hydrothermal minerals

Fig. 4. Field aspects (A) and thin section (transmitted light/crossed nicols) of porphyriticandesite (sample CC-08) showing plagioclase (Pl) and clinopyroxene (Cpx) phenocrystssurrounded by a fine-grained groundmass (B). Tuff and lapilli tuff outcrop of rhyoliticcomposition is shown in (C).
304 T.A. Carrino et al. / Ore Geology Reviews 64 (2015) 299–315
[0]. Next, the stages of semivariogramproduction (Table 2) andmodeling(Table 3) were employed to generate 500 simulated images for eachindicator's variable, and to calculate their mean images. The images ofthe probability of occurrence greater than or equal to 25% of K-, and ofNa-bearing alunite were combined in GIS, and the result is shown inFig. 3, integrated with elevation data from ASTER GDEM and representa-tive sampling points of the hydrothermal alteration zones.
3.2. Geochemical data
Geochemical data comprising Ag, As, Au, Bi, Hg, Mo, Sb, Se, andTe, commonly employed in the study of hydrothermal deposits(Hedenquist et al., 2000; White and Hedenquist, 1995), were statis-tically analyzed using the principal component analysis (PCA) tech-nique (Hotelling, 1933).
PCA allows the determination of uncorrelated linear combinations ofthe geochemical data set. Thus, specific information can be separated
from different targets by using eigenvectors. These comprise weightedand linear combinations of the original geochemical data in the princi-pal components (PCs) that are calculated by algebraic methods to com-pute the variance–covariance matrix (Mather, 2004). Eigenvectoranalysis is essential for the interpretation and selection of the PC con-taining the geochemical information of interest. The evaluation of theeigenvector signs, in turn, allows the understanding of how this infor-mation will be shown (high or low values of the scores generated).The PCs are presented in descending order of variability, and the lastcomponent is characterized by its lower contribution to explain thetotal variability of the original data. This variability is called eigenvalue(Hair et al., 1998).
Table 4 shows the eigenvector matrices and the eigenvalues ofnine PCs generated from 184 and 322 geochemical sampling pointsavailable, respectively, in the central and SW sectors of the ChapiChiara prospect.
4. Results and discussion
The mineral probability maps shown in Figs. 2 and 3 depict thespatial distributions of themost abundant hydrothermalmineral phasesrecognized in Chapi Chiara. The analysis of these maps allows thefollowing hydrothermal alteration zones to be recognized: (a) SWsector, characterized by large proximal alteration cores marked by ad-vanced argillic alteration (AAA) (alunite and kaolinite group minerals);(b) central sector, marked by the predominance of clayminerals (smec-tite and kaolinite); (c) eastern sector, also devoid of large proximal al-teration, characterized by outcrops of fresh volcanic rocks (e.g., CC-05and CC-08 points).
All these sectors are characterized in detail and discussed below.
4.1. Fresh volcanic rocks
Andesite outcrops with a low degree of alteration are visible in theeastern sector of the prospect (Fig. 2) and reflect the occurrence oferuption processes that generated lava domes and flows. The andesitesare porphyritic, leucocratic and, occasionally, have preserved flowstructures (Fig. 4A) andmultiple fractures. These rocks are composedpre-dominantly of subeuhedral and euhedral phenocrysts of clinopyroxeneand plagioclase, wrapped by fine-grained groundmass formed mostlyby plagioclase (Fig. 4B).
Extensive outcrops of rhyolitic tuff also occur close to porphyriticandesite. These rocks are fine-grained and white in color, sometimeswith gradual planar-parallel stratification characterized by volcanicfragments, such as pumice, which can exceed 5 cm in diameter(lapilli tuff). This increase in granulometry may have been derivedfrom the selection process, by gravity, of the pyroclastic fragmentsthrown into the air during explosive magmatic eruptions, or it canbe associated with the deposition on an aquatic environment that,in the present case, could be a lake, if these rocks belong to theMaure Group.
Ruiniform structures produced by wind erosion are also notable(Fig. 4C), and were previously observed in this region by Marocco andDel Pino (1966).
4.2. Hydrothermal alteration zones in the SW sector
The SW sector is part of the extinct volcanic center (Fig. 3), whereadvanced argillic, argillic and propylitic alteration zoneswere identified,as described below.
4.2.1. Advanced argillic alteration zoneThree main AAA cores were identified in the SW sector of the Chapi
Chiara prospect, from the integration of the simulated mineralogy andASTER GDEM data (Fig. 3). The paragenesis is characterized by theabundance of hypogene minerals of the alunite group (K-alunite, Na-

Fig. 5.Hydrothermal breccia in the advanced argillic alteration zone (A), and SEM image of tabular alunite crystals and small aggregated crystals of topaz in sample CC-56 (B); SEM imagesof alunite supergroup minerals in samples CC-37 (C) and CC-32 (D) are also shown. Alu = alunite; APS = aluminum–phosphate–sulfate minerals; Dck = dickite; Qtz = quartz; and Tpz =topaz.
305T.A. Carrino et al. / Ore Geology Reviews 64 (2015) 299–315
alunite and alunite with intermediate composition), dickite and kao-linite (Figs. 5, 6A and B). Less commonly, it also contains topaz inmixture with alunite group minerals and/or pyrophyllite and dickite(samples CC-56, 107665, 107669, CC-33 and CC-34—Figs. 5B, 6C and7A), Ca-rich alunite (e.g., sample CC-43—Fig. 6A), APS (aluminum–
phosphate–sulfate) minerals (samples CC-37 and CC-32—Fig. 5C andD), and diaspore (sample 108707—Fig. 7B). The concentration of thismineralogy predominantly in higher topographic sectors, i.e. in excessof 5000 m.a.s.l. (cf., Fig. 3), may reflect the greater resistance of residualquartz in relation to erosional processes (Hedenquist et al., 2000).
Alunite group minerals are characterized by the general chemicalformula AM3(SO4)2(OH)6, where A is often a monovalent cation(e.g., K+, Na+) and M is a trivalent cation (Al3+). The structure is alsoformed by SO4
2+ tetrahedrons and MO2(OH)4 octahedrons (Baylisset al., 2010; Bishop and Murad, 2005). The outcrops are marked by ox-idation (goethite) and alunite crystals are fine-grained and white incolor, fully or partially fulfilling vugs or forming the groundmass in hy-drothermal breccias, as noted in sample CC-56 (Fig. 5A).
In spectroradiometry, these minerals are diagnosed mainly throughabsorption features located at approximately 1370–1510 nm (derivedfrom the vibrational process of the O–H bond), and at 2172, 2210–2215and 2325 nm as a result of the vibrational process of the Al–OH bond.In addition, there is also an absorption feature next to 2400 nm due tothe vibrational process of the S–O bond (Bishop and Murad, 2005;Cloutis et al., 2006; Hunt, 1979) (Fig. 6A and C).
The discrimination between K-alunite and Na-alunite is done byobserving the shifts of the absorption features, in the order of a fewnanometers, with features shifted toward longer wavelengths as Nacontents increase (Chang et al., 2011; Pontual et al., 2008b; Swayzeet al., 2014; Thompson et al., 1999). For this purpose, the spectralrange of 1370–1510 nm is used because the absence of influence of pos-sible overlaps with absorption features from other minerals. The ab-sorption features are located at approximately 1434 and 1496 nm inthe case of Na-alunite, while the features centered at approximately1430 and 1479 nm indicate the presence of K-alunite (Figs. 6A and C)(Kerr et al., 2011; Pontual et al., 2008b; Swayze et al., 2014;Thompson et al., 1999). According to Stoffregen and Cygan (1990),Na-alunite may be associated with formation conditions of highertemperatures in relation to K-alunite.
Mixtures of Na- and K-alunite were identified (e.g., sample CC-56—Fig. 6C), besides alunite with intermediate composition, recognizedfrom the absorption feature located in the intermediate wavelength,as reported by Swayze et al. (2014). Intermediate absorptions, such asat ~1486 nm, are observed in samples CC-55, CC-37 and 107669(Figs. 6A and 7A). Less commonly, the occurrence of huangite was ver-ified, based on the characteristic absorption features located at ~1370,1510 and 2377 nm (Fig. 6A), thus reflecting a Ca-rich composition asdescribed by Swayze et al. (2014) in Cuprite. Additionally, rare APSminerals coexist with phases of alunite groupminerals in a same crystal(Fig. 5C and D).

Fig. 6. Spectra of advanced argillic alteration zone in the range between 1400 and 2200 nm showing: (A) the main absorption features of alunite, including the indication of the mainshifted absorption wavelengths depending on the K- and Na-composition; (B) diagnostic features of dickite and kaolinite; and (C) absorption features of topaz mixed with K-aluniteand/or Na-alunite. Dickite, kaolinite, K-alunite, Na-alunite and topaz spectra from Clark et al. (2007) are shown for comparison.
306 T.A. Carrino et al. / Ore Geology Reviews 64 (2015) 299–315
Crystals of the alunite supergroup mineral phases are tabular,euhedral to subeuhedral. Their sizes vary from approximately 50 to150 μmwhen coexistingwith topaz (Fig. 5B), amineral that is indicativeof high temperature (above ~250–260 °C) and low pH conditions(Hedenquist et al., 2000; Thompson and Thompson, 1996; Whiteand Hedenquist, 1995). In other parts of the prospect, alunite ismarked by tabular crystals of approximately 10 up to ~70 μm (cf.,Fig. 5C and D).
Topaz appears predominantly as anahedral aggregated crystals.They have variable sizes, between approximately 3.5 and 35 μm, andare locally disseminated in the interstices of alunite crystals (Fig. 5B).This mineral is also discriminated by spectroradiometric data. Two in-tense absorption features, arising from the vibrational processes of theO–H bond, are clearly diagnostic of topaz and occur at approximately
1403 and 2085 nm (Kerr et al., 2011; Pontual et al., 2008b) (Figs. 6Cand 7A).
Restricted occurrences of pyrophyllite were identified based on theintense absorptions features centered at ~1394 and ~2168 nm, arisingfrom the vibrational processes of the O–H and Al–OH bonds, respective-ly, and at ~2320 nm (Al–OH) (Kerr et al., 2011; Pontual et al., 2008b).When mixed with stacked large crystals of dickite (Fig. 5C) and/or alu-nite, pyrophyllite can be identified by the typical sharp absorption fea-ture located at 2168 nm (Fig. 7A). Pyrophyllite is formed underconditions of acidic pH and temperatures above ~200–250 up to350 °C (Thompson and Thompson, 1996).
Another mineral formed under high temperature conditions(N200–230 °C) and acidic pH is diaspore (Hedenquist et al., 2000;Thompson and Thompson, 1996; White and Hedenquist, 1995),

Fig. 7. Spectral characterization of: (A) samples CC-37 and 107669marked by absorption features of pyrophyllitemixedwith alunite, topaz and dickite; and (B) sample 108707marked byspectral features in the visible-near infrared (VNIR) associated with goethite, and short-wave infrared (SWIR) spectra showing absorption features related to diaspore. Pyrophyllite anddiaspore spectra from Clark et al. (2007) are shown for comparison.
307T.A. Carrino et al. / Ore Geology Reviews 64 (2015) 299–315
identified locally in the AAA zone through the broad absorption fea-ture located between approximately 1600 and 2250 nm (Fig. 7B). Inthis spectral range, there is a pronounced absorption feature cen-tered at approximately 1800 nm, derived from the vibrational pro-cesses of the O–H bonds (Hunt and Ashley, 1979; Pontual et al.,2008b).
Dickite and kaolinite appear as the main mineral phases (Fig. 6B) orthey coexist with pyrophyllite and/or topaz and alunite groupmineralsFig. 6A, C, 7A). They are easily identified mainly by the double absorp-tion features centered at ~1383 and ~1414 nm (dickite) and at ~1395and ~1414 nm (kaolinite), caused by the vibrational processes of theO–H bond. Other main features appear at ~2180 and ~2206 nm(dickite) and at ~2160 and ~2206 nm (kaolinite), resulting from the
vibrational process of the Al–OH bond (Hunt, 1979; Pontual et al.,2008b) (Fig. 6B). Kaolinite is formed under temperature conditionsbelow ~200 °C, while the genesis of dickite occurs under higher tem-perature conditions (~200 to 250 °C). For both minerals, pH conditionsaround 3 to 4 are required (Thompson and Thompson, 1996).
4.2.2. Argillic alteration zoneRestricted occurrences of minerals such as smectite and illite
(e.g., sample CC-52) and paragonitic illite (e.g., samples CC-24 and106928) were recognized in the lower topographic relief sector(~4930 m.a.s.l.), around the AAA1 core (Fig. 3). This mineral paragene-sis is formed under pH conditions tending to neutral and temperaturebelow ~200 °C (smectite) and between ~200 and 300 °C (illite)

Fig. 8. Spectral curves characterized by smectite, illite, paragonitic illite and ammonium, in addition to buddingtonite observed north of the Chapi Chiara prospect (A). Photomicrograph(transmitted light/crossed nicols) of sample CC-52 (B) shows small illite crystals overgrowing on plagioclase. Semiquantitative chemical analyses using SEM-EDS are shown in (C). Ilm=ilmenite; Ilt = illite; Py = pyrite; and Qtz = quartz.
308 T.A. Carrino et al. / Ore Geology Reviews 64 (2015) 299–315
(Hedenquist et al., 2000; Thompson and Thompson, 1996; White andHedenquist, 1995).
The mineralogy of the argillic alteration zone is marked by absorp-tion features derived from the vibrational processes of the O–H bondand/or molecular water (illite, smectite) at ~1400 and ~1900 nm, andby features centered at ~2205 (illite and smectite), ~2195 (paragoniticillite), and at ~2330–2340 and ~2440–2445 nm(paragonitic illite/illite),resulting from the vibrational process of the Al–OH bond (Fig. 8A)(Pontual et al., 2008b).
Sample CC-52 is a typical example of the argillic alteration zone,composed by an association of smectite, illite and quartz replacing pla-gioclase (Fig. 8B). Disseminated pyrite, characterized by subeuhedral toanhedral crystals with variable size, between approximately 18 and50 μm, is also observed (Fig. 8C). Supergene processes resulted in incip-ient jarosite from the weathering of pyrite, as verified in the semiquan-titative chemical analysis by SEM-EDS, marked by the presence of K, Na(possible natrojarosite) and O (Fig. 8C). This characterization was alsocorroborated by the diagnostic absorption feature of jarosite centeredat ~430 nm (Fig. 8C), derived from the electronic transition process offerric iron ions (Bishop and Murad, 2005; Hunt and Ashley, 1979;Pontual et al., 2008b). In addition, oxides such as ilmenite also appearas trace constituents of these rocks.
Occasional ammonium-bearing minerals (e.g., samples 106928 andCC-24) occur in the argillic alteration zone. The presence of the
ammonium is indicated by absorption features centered at approxi-mately 1411, 1914, 2010–2020 and 2112–2118 nm (Fig. 8A) As previ-ously mentioned in literature (Pontual et al., 2008b; Soechting et al.,2008), the features centered at ~2020 and ~2118 nmare not ambiguouswith other minerals, allowing the accurate identification of ammoniumin rock samples. In the case of samples 106928 and CC-24, the featurescentered at ~2195, ~2330 and ~2443 nm are related to the occurrenceof paragonitic illite, and the absorption features of smectite are verifiedmainly by the deep and asymmetric feature at ~1900 nm (absorptionfeature of molecular water). In addition, buddingtonite was also identi-fied to the north, outside the prospect area, as shown by the spectralcurve of sample 105744 in Fig. 8A.
Ammonium (NH4+) has an ionic radius similar to that of K+ and can
replace it in the structure ofminerals such as feldspar, micas, jarosite, al-unite, among others (Godeas and Litvak, 2006; Krohn et al., 1993;Ridgway et al., 1990). The source of ammonium is generally related tothe interaction of hydrothermal fluids (meteoric andmagmatic compo-nents)with organic matter-bearing sedimentary rocks, and at tempera-ture conditions of at least 150 °C for the release of NH4
+ in the solution(Phoebe Hauff personal communication in Godeas and Litvak, 2006).
Gold values greater than 0.050 ppm, reaching a maximum value of0.194ppm, occur locally in the SWsector of theprospect and are accom-panied mostly by high contents of Ag, Hg, Mo and Sb, whose inter-elementary relations were synthesized through statistical analysis
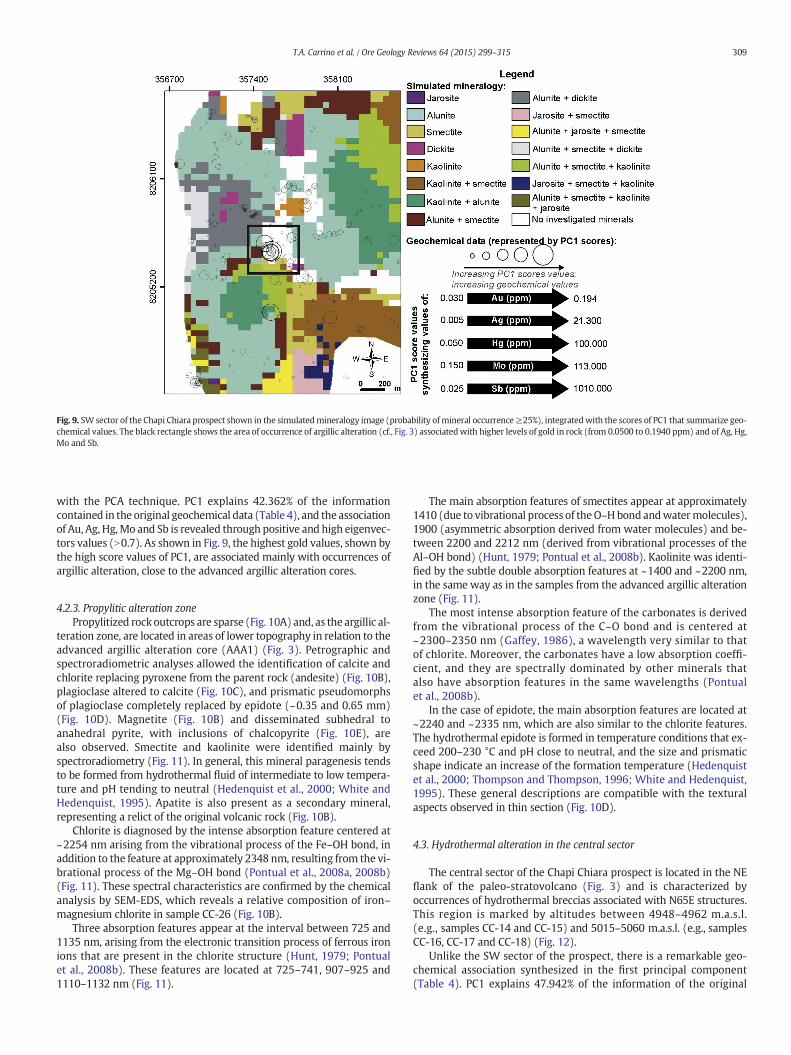
Fig. 9. SW sector of the Chapi Chiara prospect shown in the simulatedmineralogy image (probability ofmineral occurrence≥25%), integratedwith the scores of PC1 that summarize geo-chemical values. The black rectangle shows the area of occurrence of argillic alteration (cf., Fig. 3) associatedwith higher levels of gold in rock (from 0.0500 to 0.1940 ppm) and of Ag, Hg,Mo and Sb.
309T.A. Carrino et al. / Ore Geology Reviews 64 (2015) 299–315
with the PCA technique. PC1 explains 42.362% of the informationcontained in the original geochemical data (Table 4), and the associationof Au, Ag, Hg,Mo and Sb is revealed through positive and high eigenvec-tors values (N0.7). As shown in Fig. 9, the highest gold values, shown bythe high score values of PC1, are associated mainly with occurrences ofargillic alteration, close to the advanced argillic alteration cores.
4.2.3. Propylitic alteration zonePropylitized rockoutcrops are sparse (Fig. 10A) and, as the argillic al-
teration zone, are located in areas of lower topography in relation to theadvanced argillic alteration core (AAA1) (Fig. 3). Petrographic andspectroradiometric analyses allowed the identification of calcite andchlorite replacing pyroxene from the parent rock (andesite) (Fig. 10B),plagioclase altered to calcite (Fig. 10C), and prismatic pseudomorphsof plagioclase completely replaced by epidote (~0.35 and 0.65 mm)(Fig. 10D). Magnetite (Fig. 10B) and disseminated subhedral toanahedral pyrite, with inclusions of chalcopyrite (Fig. 10E), arealso observed. Smectite and kaolinite were identified mainly byspectroradiometry (Fig. 11). In general, this mineral paragenesis tendsto be formed from hydrothermal fluid of intermediate to low tempera-ture and pH tending to neutral (Hedenquist et al., 2000; White andHedenquist, 1995). Apatite is also present as a secondary mineral,representing a relict of the original volcanic rock (Fig. 10B).
Chlorite is diagnosed by the intense absorption feature centered at~2254 nm arising from the vibrational process of the Fe–OH bond, inaddition to the feature at approximately 2348 nm, resulting from the vi-brational process of the Mg–OH bond (Pontual et al., 2008a, 2008b)(Fig. 11). These spectral characteristics are confirmed by the chemicalanalysis by SEM-EDS, which reveals a relative composition of iron–magnesium chlorite in sample CC-26 (Fig. 10B).
Three absorption features appear at the interval between 725 and1135 nm, arising from the electronic transition process of ferrous ironions that are present in the chlorite structure (Hunt, 1979; Pontualet al., 2008b). These features are located at 725–741, 907–925 and1110–1132 nm (Fig. 11).
The main absorption features of smectites appear at approximately1410 (due to vibrational process of theO–Hbond andwatermolecules),1900 (asymmetric absorption derived from water molecules) and be-tween 2200 and 2212 nm (derived from vibrational processes of theAl–OH bond) (Hunt, 1979; Pontual et al., 2008b). Kaolinite was identi-fied by the subtle double absorption features at ~1400 and ~2200 nm,in the same way as in the samples from the advanced argillic alterationzone (Fig. 11).
The most intense absorption feature of the carbonates is derivedfrom the vibrational process of the C–O bond and is centered at~2300–2350 nm (Gaffey, 1986), a wavelength very similar to thatof chlorite. Moreover, the carbonates have a low absorption coeffi-cient, and they are spectrally dominated by other minerals thatalso have absorption features in the same wavelengths (Pontualet al., 2008b).
In the case of epidote, the main absorption features are located at~2240 and ~2335 nm, which are also similar to the chlorite features.The hydrothermal epidote is formed in temperature conditions that ex-ceed 200–230 °C and pH close to neutral, and the size and prismaticshape indicate an increase of the formation temperature (Hedenquistet al., 2000; Thompson and Thompson, 1996; White and Hedenquist,1995). These general descriptions are compatible with the texturalaspects observed in thin section (Fig. 10D).
4.3. Hydrothermal alteration in the central sector
The central sector of the Chapi Chiara prospect is located in the NEflank of the paleo-stratovolcano (Fig. 3) and is characterized byoccurrences of hydrothermal breccias associated with N65E structures.This region is marked by altitudes between 4948–4962 m.a.s.l.(e.g., samples CC-14 and CC-15) and 5015–5060 m.a.s.l. (e.g., samplesCC-16, CC-17 and CC-18) (Fig. 12).
Unlike the SW sector of the prospect, there is a remarkable geo-chemical association synthesized in the first principal component(Table 4). PC1 explains 47.942% of the information of the original

Fig. 10. General aspects of the propylitic alteration zone: (A) outcrop of propylitized andesite; (B) SEM image of calcite, and chlorite and its semiquantitative compositional estimation;(C) photomicrographs (transmitted light/crossed nicols) of plagioclase altered to calcite, and (D) plagioclase altered to epidote; (E) SEM image of pyrite with inclusions of chalcopyrite.Ap = apatite; Cal = calcite; Ccp = chalcopyrite; Chl = chlorite; Ep = epidote; Mag = magnetite; Py = pyrite; and Qtz = quartz.
310 T.A. Carrino et al. / Ore Geology Reviews 64 (2015) 299–315
geochemical data and represents the association of high contents of Auwith high contents of Ag, As, Bi, Hg, Sb, Se, and Te, as indicated by therespective eigenvectors which are positive and greater than 0.6. ThePC1 scores plotted on the alteration map of the central sector of theprospect follow the N65E structure of two main outcrops of hydrother-mal breccias (Fig. 12). The high concentration of gold ranges from0.0500 to 0.3220 ppm.
The outcrops of the hydrothermal breccias are characterized bylengths of a few meters, and they consist of fragments of altered rocksrich in quartz and clayminerals. Vuggy texture is present, characterizedby the typical bordering of subhedral recrystallized quartz (Fig. 13A andB). The cavities are filled by very fine-grained quartz and subhedral toanhedral pyrite crystals with variable sizes (~5 to N300 μm)(Fig. 13C). Clay minerals, comprising kaolinite and smectite, are recog-nized through absorption features located at the region of 1400 and
2200 nm, and at 1900 nm (in the smectite case) (Fig. 14A), and con-firmed by petrography and semiquantitative chemical analyses(e.g., samples CC-18 and CC-14—Fig. 13D and F). Less defined absorp-tion features centered at 1900 nm may indicate the presence of waterin the form of inclusions in silica, as well as a broad feature in the2200 nm region (Pontual et al., 2008a) that attenuates the absorptionfeature intensities of kaolinite, smectite and jarosite, as verified in theFig. 14A (spectra of samples CC-16, CC-17 and CC-18).
Pyrite, sometimes featuring trace amounts of arsenic, was foundabundantly and its irregular shape and textural variation may reflectthe occurrence of more than one hydrothermal event. The occurrenceof supergene process is indicated by the presence of jarosite in smallamounts derived from the weathering process of pyrites, as shown bythe diagnostic absorption features at ~430 and ~905–940 nm (derivedfrom electronic transition process of ferric iron ions), at ~1470 and

Fig. 11. Spectral curves of the propylitic alteration zone, with predominance of spectral features of chlorite.
311T.A. Carrino et al. / Ore Geology Reviews 64 (2015) 299–315
~2210 nm (derived from vibrational process of the O–H bond), at and~2270 nm (derived from the vibrational process of the Fe–OH bond)(Bishop and Murad, 2005; Cloutis et al., 2006; Hunt and Ashley, 1979;Pontual et al., 2008b) (Fig. 14A). This evidence was corroborated bysemiquantitative chemical analyses carried out on pyrites of samplesCC-18 (Fig. 13D) and CC-14 (Fig. 13E).
Dickite and kaolinite were locally recognized in sample CC-15,through the double absorption features located at 1400 and 2200 nmspectral regions (Fig. 14B), besides barite (e.g., sample CC-14—Fig. 13F).
4.4. Discussions on the hydrothermal system
The paleo-stratovolcano of which the Chapi Chiara prospect is partwas possibly formed between 11.00 and 4.00 Ma (relative age rangeof volcanism in the CerroMillo prospect and the formation of the Tucarideposit—Table 1), with concomitant hydrothermal activity. In this sameperiod, Tucari and Santa Rosa deposits were formed, which, unlike theolder deposits located northwest (e.g., Caylloma, Selene, Shila, Paula),are of the high sulfidation epithermal type, with similarities of hostrock (context of the Maure and/or Barroso groups) and hydrothermalzoning in relation to both, the Chiara Chapi and the Cerro Millo pros-pects (cf., Fig. 1A and Table 1).
The hypogene mineralogy verified on Chapi Chiara is composedof residual quartz, alunite supergroup minerals, dickite, kaolinite(±topaz, pyrophyllite, diaspore) (advanced argillic alteration) presentin three main cores associated with topographic highs. In the distalparts, there is the presence of illite and smectite (argillic alteration),and of chlorite, calcite, epidote and clayminerals (propylitic alteration).In the case of the mineralogy of the argillic alteration, there wasalso the formation of ammonium-bearing minerals due to the in-teraction of the fluid(s) with sedimentary rocks containing organicmatter. These rocks possibly belong to the Maure Group and/or theCapillune Formation.
Reactive hypogene fluids (high temperature and acidic pH) favoredleaching processes, leaving only residual silica (vuggy quartz). This wasfollowed by the successive decrease in reactivity of the fluids with thehost rocks, as indicated by the advanced argillic alteration minerals,
passing to argillic and propylitic alteration in the distal parts. This typeof mineral zoning is characteristic of high sulfidation epithermal events,marked by the presence of oxidized S. These events take place in conti-nental arc environments and are related to the emplacement of calc-alkaline magma at a depth that contributes with heat, fluids, volatilesand metals (Hedenquist et al., 2000; Sillitoe and Hedenquist, 2003). Inthe epithermal model, the initial hypogene fluid comes from themagma degassing process, with the release of oxidized magmatic vola-tiles (e.g., SO2, HCl, H2S) that are, in general, hot and with low salinity.With the rise to shallower levels, these volatiles are absorbed by mete-oric fluids favoring reactions that form sulfuric (H2SO4) and sulfidric(H2S) acids at temperature conditions ≤400 °C (disproportionationreaction of SO2), and dissociation reactions of predominantly acidicspecies (HCl, H2SO4) at temperatures ≤300 °C, producing a fluid withlow pH (b2) and high temperature (~300 °C) (Arribas, 1995;Hedenquist et al., 2000; Sillitoe and Hedenquist, 2003; White andHedenquist, 1995). The leaching process of magmatic apatites bythe initial reactive fluid may have been the fundamental mecha-nism mainly for the release of P necessary for the formation ofAPS minerals present in the advanced argillic alteration zone(Stoffregen and Alpers, 1987).
The generation of secondary porosity and permeability (vugs) wasrequired for the passage of late fluid(s) associated with the origin ofminerals such as pyrites that fill these cavities (e.g., Fig. 13C). Thistype offluid is characterized, in general, by low contribution ofmagmat-ic volatiles, which makes it less oxidized and acid (Arribas, 1995;Hedenquist et al., 2000; Sillitoe and Hedenquist, 2003), although amore specific characterization in the study area was not attempted. Ascurrently verified in the central sector of the prospect, hydrothermalbreccias structured toward N65E represent favorable exploitation tar-gets as suggested by the occurrence of dozens of gold anomalies inrock (with Ag and other related metals) associated with abundantpyrite filling cavities (Fig. 13C, D, and E).
After the termination of the Barroso volcanism, with consequentmi-gration of the volcanic arc to the west, erosion started to take place,generating the current geomorphologic configuration of the paleo-stratovolcanoes (e.g., Fig. 3). With the increase of local tectonic stability

312 T.A. Carrino et al. / Ore Geology Reviews 64 (2015) 299–315
and occurrence of weathering, supergene minerals were originated,comprising goethite, and jarosite arising from the weathering activityin pyrite.
A possible genetic association of high sulfidation epithermal systemwith the porphyry system at depth, such as observed in the mining dis-tricts of Yanacocha (Northern Peru) and Pueblo Viejo (Dominican Re-public) (Chang et al., 2012), can be inferred for Chapi Chiara. Thispossibility has already been proposed by Hennig et al. (2008) for theCerro Millo prospect (Table 1). Additionally, located between ChapiChiara and CerroMillo, there is San Antonio de Esquilache, placed in an-other contemporary paleo-stratovolcano. This target is characterized bythe current exposure at surface of diorite associatedwith occurrences ofCu, Zn, Ag and other metals (Canchaya and Aranda, 1995), revealing acontext of deeper erosion (Fig. 1A). Thus, San Antonio de Esquilacherepresents the most concrete evidence of the potential for mineraliza-tion associated with diorite at levels below those currently exposed inChapi Chiara and Cerro Millo.
5. Conclusions
Chapi Chiara prospect is located in a paleo-stratovolcano of theUpper Miocene–Pliocene and comprises a high sulfidation epithermal
Fig. 12. Central sector of the Chapi Chiara prospect shown in the simulated mineralogy imagehighest values are represented by the highest PC1 scores.
system. Porphyritic andesite, tuff and lapilli tuff of rhyolitic compositioncomprise the main volcanic rocks identified at this prospect.
Three main cores of advanced argillic alteration are characterized,comprising quartz, alunite supergroup minerals (mainly K-alunite, Na-alunite and alunite with intermediate composition), kaolinite groupminerals andmore restricted occurrences of topaz, pyrophyllite and di-aspore. In the distal parts of the system, thismineralogy tends to argillicand propylitic alteration types. In the central sector of the prospect,the mineral paragenesis is mainly composed of vuggy quartz and abun-dant pyrite, related to hydrothermal breccias structured towards N65E,containing the highest gold levels recorded, among 0.0500 and0.3220 ppm, accompanied by anomalies of Ag, As, Bi, Hg, Sb, Se andTe. The occurrence of a supergene event is revealed by the presence ofjarosite and goethite.
In the SW sector, the superficial display of minerals formed underhigh temperature conditions observed mainly in the AAA1 core and sur-rounding areas, such as topaz, diaspore, pyrophyllite and epidote, lean to-wards a deep level into the epithermal system, marked by the proximityof the epithermal–mesothermal domain limit (Corbett and Leach, 1998).This context is consistent with the possible proximity of dioriticintrusion(s) near the surface, as shown by the current exposure ofintrusions at the surface in the contemporaneous and analogouspaleo-stratovolcano of San Antonio de Esquilache.
(probability of mineral occurrence ≥25%), integrated with geochemical data, whose the
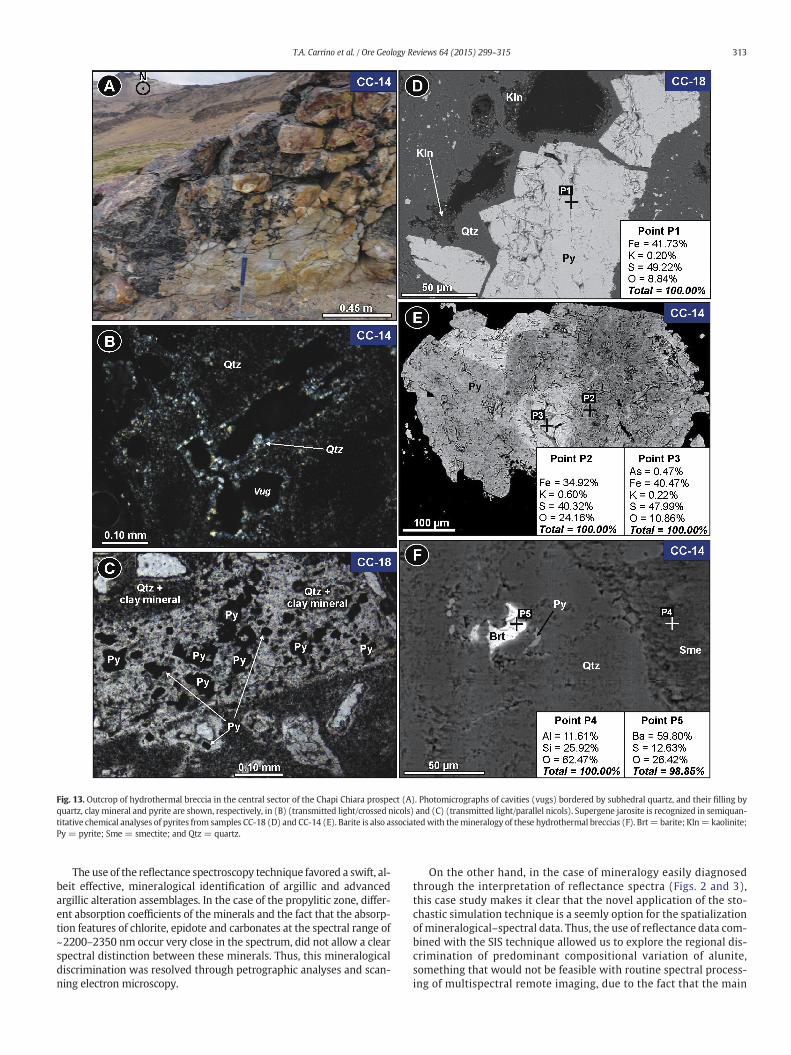
Fig. 13. Outcrop of hydrothermal breccia in the central sector of the Chapi Chiara prospect (A). Photomicrographs of cavities (vugs) bordered by subhedral quartz, and their filling byquartz, clay mineral and pyrite are shown, respectively, in (B) (transmitted light/crossed nicols) and (C) (transmitted light/parallel nicols). Supergene jarosite is recognized in semiquan-titative chemical analyses of pyrites from samples CC-18 (D) and CC-14 (E). Barite is also associatedwith themineralogy of these hydrothermal breccias (F). Brt= barite; Kln= kaolinite;Py = pyrite; Sme = smectite; and Qtz = quartz.
313T.A. Carrino et al. / Ore Geology Reviews 64 (2015) 299–315
The use of the reflectance spectroscopy technique favored a swift, al-beit effective, mineralogical identification of argillic and advancedargillic alteration assemblages. In the case of the propylitic zone, differ-ent absorption coefficients of the minerals and the fact that the absorp-tion features of chlorite, epidote and carbonates at the spectral range of~2200–2350 nm occur very close in the spectrum, did not allow a clearspectral distinction between these minerals. Thus, this mineralogicaldiscrimination was resolved through petrographic analyses and scan-ning electron microscopy.
On the other hand, in the case of mineralogy easily diagnosedthrough the interpretation of reflectance spectra (Figs. 2 and 3),this case study makes it clear that the novel application of the sto-chastic simulation technique is a seemly option for the spatializationof mineralogical–spectral data. Thus, the use of reflectance data com-bined with the SIS technique allowed us to explore the regional dis-crimination of predominant compositional variation of alunite,something that would not be feasible with routine spectral process-ing of multispectral remote imaging, due to the fact that the main

Fig. 14. Representative spectra of the central sector of the Chapi Chiara prospect: diagnostic absorption features of kaolinite, smectite and jarosite (A), and, locally, of dickite mixed withkaolinite (B).
314 T.A. Carrino et al. / Ore Geology Reviews 64 (2015) 299–315
diagnostic features on alunite composition are associated with smallshifts of the absorption wavelength, in the order of a few nanome-ters. In the remote imaging case, a large number of spectral bands(hyperspectral imaging), combined with high spatial resolutionand high signal/noise ratio are required to resolve the alunite com-position with adequate accuracy.
Acknowledgments
The authorswould like to thankGold Fields Inc., especially geologistsFrancisco Azevedo, Teresa Guevara, Shirley Custodio, AuriMorroMuñozand Mariela Reyes, for supporting the development of this project. Wealso acknowledge the Institute of Geosciences and the Faculty of Me-chanical Engineering at the University of Campinas for providing accessto analytical facilities, in particular Dr. Erica Martini Tonetto, for the ac-quisition of SEM-EDS data, and the Espaço da Escrita—CoordenadoriaGeral da Universidade Estadual de Campinas—for the translationservices provided. T.A. Carrino acknowledges the State of São Paulo Re-search Foundation (FAPESP) for providing a doctoral scholarship (grant2011/00106-8). A.P. Crósta and A.M. Silva thank the National Council forScientific and Technological Development (CNPq) for the respective re-search grants.We also express our appreciation to Dr. Franco Pirajno forhis editorial handling of this paper, and to an anonymous reviewer,whose comments and suggestion contributed for improving a previousversion of the manuscript.
References
Acosta, J.,Quispe, J., Santisteban, A.,Acosta, H., 2008. Épocas metalogenéticas y tipos deyacimientos metálicos en la margen occidental del sur del Perú: latitudes 14°S–18°S. CPG 2008: Resúmenes del XIV Congreso Peruano de Geología; 2008 Sep 29–Oct 3; Lima, Peru. Sociedad Geológica del Peru, Lima, pp. 1–6.
Arribas, A., 1995. Characteristics of high-sulfidation epithermal deposits, and their rela-tion to magmatic fluid. In: Thompson, J.F.H. (Ed.), Magmas, Fluids, and Ore Deposits.Mineralogical Association of Canadá, Nepean, pp. 419–454.
Barreda, J.,Loayza, D., Juarez, P.,Torres, R., 2004. Depósitos epitermales de alta sulfuraciónen el distrito minero Aruntani, Moquegua. CPG 2004: Resúmenes Extendidos del XIICongreso Peruano de Geología; 2004 Oct 26–29; Lima, Peru. Sociedad Geológica delPeru, Lima (1 p.).
Bayliss, P.,Kolitsch, U.,Nickel, E.H.,Pring, A., 2010. Alunite supergroup: recommended no-menclature. Mineral. Mag. 74, 919–927.
Benavides-Cáceres, V., 1999. Orogenic evolution of the Peruvian Andes: the Andean cycle.In: Skinner, B.J. (Ed.), Geology of Ore Deposits of the Central Andes. Society of Eco-nomic Geologists, Boulder, pp. 61–107.
Bishop, J.L.,Murad, E., 2005. The visible and infrared spectral properties of jarosite and al-unite. Am. Mineral. 90, 1100–1107.
Canchaya, S., Aranda, A., 1995. Geologia económica. In: Palácios, O.M., Sánchez, A.F.,Herrera, F.R. (Eds.), Geología del Peru. Boletín n° 55, Série A. Fimart S.A.—Editores &Impresores, Lima, pp. 131–161.
Candiotti, H.,Noble, D.C.,McKee, E.H., 1990. Geologic setting and epithermal silver veins ofthe Arcata District, southern Peru. Econ. Geol. 85, 1473–1490.
Carlotto, V., Quispe, J., Acosta, H., Rodríguez, R., Romero, D., Cerpa, L.,Mamani, M., Díaz-Martínez, E., Navarro, P., Jaimes, F., Velarde, T., Lu, S., Cueva, E., 2009. Domíniosgeotectónicos y metalogénesis del Peru. Bol. Soc. Geol. Peru, 103, pp. 1–89.
Cassard, D.,Chauvet, A.,Bailly, L.,Llosa, F.,Rosas, J.,Marcoux, E.,Lerouge, C., 2000. Structuralcontrol and K/Ar dating of the Au–Ag epithermal veins in the Shila Cordillera, south-ern Peru. C. R. Acad. Sci. IIA Earth Planet. Sci. 330, 23–30.
Chang, A., Hedenquist, J.W.,White, N.C., Cooke, D.R., Roach, M., Deyell, C.L., Garcia Jr., J.,Gemmel, J.B.,McKnight, S., Cuison, A.L., 2011. Exploration tools for linked porphyry
315T.A. Carrino et al. / Ore Geology Reviews 64 (2015) 299–315
and epithermal deposits: example from the Mankayan intrusion-centered Cu–AuDisctrict, Luzon, Philippines. Econ. Geol. 106, 1365–1398.
Chang, Z.,Hedenquist, J.W.,White, N.C.,Cooke, D.R., 2012. High-sulfidation epithermal de-posits: recent development in exploration methods. PGC & SEG 2012: Proceedings ofthe 16th Peruvian Geological Congress & SEG 2012 Conference; 2012 Sep 23–26;Lima, Peru. Sociedad Geológica del Peru & SEG, Lima (2 p.).
Chauvet, A.,Bailly, L.,André, A.S.,Monié, P., Cassard, D., Tajada, F.L.,Vargas, J.R., Tuduri, J.,2006. Internal vein texture and vein evolution of the epithermal Shila-Paula district,southern Peru. Miner. Depos. 41, 387–410.
Clark, A.H., Farrar, E., Kontak, D.J., Langridge, R.J., Arenas, F.,M.J., France, L.J.,McBride, S.L.,Woodman, P.L.,Wasteneys, H.A.,Sandeman, H.A.,Archibald, D.A., 1990. Geologic andgeochronologic constraints on the metallogenic evolution of the Andes of southeast-ern Peru. Econ. Geol. 85, 1520–1583.
Clark, R.N.,Swayze, G.A.,Wise, R.,Livo, E.,Hoefen, T.,Kokaly, R.,Sutley, S.J., 2007. USGS dig-ital spectral library splib06a: U.S. Geological Survey, Digital Data Series 231. http://speclab.cr.usgs.gov/spectral.lib06 (Access: 09/27/2013).
Cloutis, E.A.,Hawthorne, F.C.,Merrtzman, S.A.,Krenn, K.,Craig, M.A.,Marcino, D.,Methot, M.,Strong, J.,Mustard, J.F.,Blaney, D.L.,Bell III, J.F.,Vilas, F., 2006. Detection and discrimi-nation of sulfate minerals using reflectance spectroscopy. Icarus 184, 121–157.
Corbett, G., Leach, T., 1998. Southwest Pacific rim gold–copper systems: structure,alteration andmineralization. Special Publication number 6Society of Economic Geol-ogists Inc., Bookcrafters, Chelsea.
de la Cruz, P.H.T., 1998. Yacimientos de minerales metálicos del Peru. Rev. Inst. Investig.Fac. Ing. Geol. Min. Metal. Geogr. 1, 43–66.
Echavarria, L.,Nelson, E.,Humphrey, J.,Chavez, J., Escoberdo, L., Iriondo, A., 2006. Geologicevolution of the Caylloma, epithermal vein district, southern Peru. Econ. Geol. 101,843–863.
Gaffey, S.J., 1986. Spectral reflectance of carbonate minerals in the visible and near infra-red (0.35–2.55 microns): calcite, aragonite, and dolomite. Am. Mineral. 71, 151–162.
Godeas, M., Litvak, V.D., 2006. Indetificación de anomalías de amônio por espectrometríade reflectância: implicâncias para la exploración minera. Rev. Asoc. Geol. Argent. 61,438–443.
Goovaerts, P., 1997. Assessment of spatial uncertainty. In: Goovaerts, P. (Ed.), Geostatisticsfor Natural Resources Evaluation. Oxford University Press, London, pp. 369–436.
Hair, J.F.,Tatham, R.L.,Anderson, R.E.,Black, W., 1998. Introduction. In: Hair, J.F., Tatham, R.L., Anderson, R.E., Black, W. (Eds.), Multivariate Data Analysis. Pearson Education Inc.,New Jersey, pp. 23–45.
Hedenquist, J.W., Arribas, A., Gonzalez-Urien, E., 2000. Exploration for epithermal golddeposits. Soc. Econ. Geol. Rev. 13, 245–277.
Hennig, D., Lehmann, B., Burgess, R.,Tak, M.A.N., 2008. Geology, geochemistry and 40Ar/39Ar ages of the Cerro Millo epithermal high-sulfidation gold prospect, southernPeru. Ore Geol. Rev. 34, 304–316.
Hotelling, H., 1933. Analysis of a complex of statistical variables into principal compo-nents. J. Educ. Psychol. 24, 498–520.
Hunt, G.R., 1979. Near-infrared (1.3–2.4 μm) spectra of alteration minerals—potential foruse in remote sensing. Geophysics 44, 1974–1986.
Hunt, G.R., Ashley, R.P., 1979. Spectral of altered rocks in the visible and near infrared.Econ. Geol. 74, 1613–1629.
Kerr, A.,Rafuse, H.,Sparkes, G.,Hinchey, J.,Sandeman, H., 2011. Visible/infrared spectrosco-py (VIRS) as a research tool in economic geology: background and pilot studies fromNewfoundland and Labrador. Current Research Newfoundland and Labrador Depart-ment of Natural Resources, Geological Surveys, report 11-1, p.145–166.
Krohn, M.D.,Kendall, C.,Evans, J.R.,Fries, T.L., 1993. Relations of ammoniumminerals at sev-eral hydrothermal systems in the western U.S. J. Volcanol. Geotherm. Res. 56, 401–413.
Loayza, D.,Barreda, J.,Crósta, A.,Hedenquist, J.,Morche, W.,Hedenquist, J., 2004. Late Miocenehigh sulfidation epithermal gold deposits of the Aruntani district, southern Peru. In:Muhling, J. (Ed.), SEG 2004—Predictive Mineral Discovery Under Cover. University ofWestern Australia and Centre for Global Metallogeny Publication, Perth, pp. 212–215.
Mamani, M.,Wörner, G.,Sempere, T., 2010. Geochemical variations in igneous rocks of theCentral Andean orocline (13°S to 18°S): tracing crustal thickening andmagma gener-ation through time and space. Geol. Soc. Am. Bull. 122, 162–182.
Marocco, R.,Del Pino, M., 1966. Geología del cuadrángulo de Ichuña. Boletin n° 14, Série A,Carta Geológica NacionalInstituto Geológico Minero y Metalúrgico, Lima.
Mather, P.M., 2004. Image transforms. In: Mather, P.M. (Ed.), Computer processing ofremotely-sensed images. An introduction. John Wiley & Sons Ltd, Chichester, pp.136–179.
Palácios, O.M., 1995. Estratigrafía. In: Palácios, O.M., Sánchez, A.F., Herrera, F.R. (Eds.),Geología del Peru. Boletín n° 55, Série A. Fimart S.A.—Editores & Impresores, Lima,pp. 45–86.
Palácios, C., Dietrich, A., Nelson, E.P., 2004. Geologic setting and characteristics of thevolcanic-hosted explorador quartz–Ag–Au vein system, Selene Mining District,Apurimac, southern Peru. GSA 2004: Proceedings of the 36th Geological Society ofAmerica Annual Meeting; 2004 Nov 7–10; Denver, USA. GSA, Denver, p. 354.
Pontual, S.,Merry, N.,Gamson, P., 2008a. Spectral Analysis Guides for Mineral Exploration.Epithermal Alteration Systems, third ed. AusSpec International Ltd., Victoria.
Pontual, S.,Merry, N.,Gamson, P., 2008b. Spectral Analysis Guides for Mineral Exploration.Spectral Interpretation. Field Manual, third ed. AusSpec International Ltd., Victoria.
Quispe, J.,Carlotto, V.,Acosta, J.,Macharé, J.,Chirif, H.,Rivera, R.,Romero, D.,Huanacuni, D.,Rodríguez, R., 2008. Mapa metalogenético del Perú 2008. CPG 2008: Resúmenes delXIV Congreso Peruano de Geología; 2008 Sep 29–Oct 3; Lima, Peru. SociedadGeológica del Peru, Lima (6 p.).
Ridgway, J.,Appleton, J.D., Levinson, A.A., 1990. Ammonium geochemistry in mineral ex-ploration—a comparison of results from the American cordilleras and the southwestPacific. Appl. Geochem. 5, 475–489.
Rodríguez, R.,Palomino, F.,Cuellar, E., 2000. Mapa geológico del cuadrángulo de Pichacani.Instituto Geológico, Minero y Metalúrgico, Lima.
Sánchez, A.F.,León, W.L., 1995. Rocas ígneas. In: Palácios, O.M., Sánchez, A.F., Herrera, F.R.(Eds.), Geología del Peru. Boletín n° 55, Série A. Fimart S.A.—Editores & Impresores,Lima, pp. 87–130.
Santos, A., Baumgartner, R.,Gaibor, A.,Dusci, M.,Azevedo, F.,Gradim, R.,Dunkley, P.,Boer,D.D., Valer, R., 2011. Geology and mineralisation of the Au–Cu–Ag Canahuireepithermal deposit, Chucapaca Project, southern Peru. In: Barra, F., Reich, M.,Campos, E., Tornos, F. (Eds.), Let's talk ore deposits. SGA 2011: Proceedings of the11th Society for Geology Applied to Mineral Deposits Biennial Meeting; 2011 Sep26–29; Antofagasta, Chile, pp. 1–4.
Sarmiento, J.C.,Castroviejo, R.,Tassinari, C.,Vidal, C.R., 2010. Inclusiones fluidas e isótoposde plomo em Chipmo y Poracota, región minera de Orcopampa—Peru, implicânciaspara la exploración. CPG 2010: Resúmenes Extendidos del XV Congreso Peruano deGeología; 2010 Sep 27–Oct 1; Cusco, Peru. Sociedad Geológica del Peru, Lima, pp.644–649.
Sillitoe, R.H.,Hedenquist, J.W., 2003. Linkages between volcanotectonic settings, ore fluidcompositions, and epithermal precious metal deposits. Soc. Econ. Geol. Newsl. Spec.Publ. 10, 315–343.
Soechting, W.,Rubinstein, N.,Godeas, M., 2008. Identification of ammonium-bearing min-erals by shortwave infrared reflectance spectroscopy at the Esquel gold deposit,Argentina. Econ. Geol. 103, 865–869.
Stoffregen, R.E., Alpers, C.N., 1987. Woodhouseite and svanbergite in hydrothermal oredeposits: products of apatite destruction during advanced argillic alteration. Can.Mineral. 25, 201–211.
Stoffregen, R.E., Cygan, G.L., 1990. An experiment study of Na–K exchange betweenalunite and aqueous sulfate solutions. Am. Mineral. 75, 209–220.
Swayze, G.A.,Clark, R.N.,Goetz, A.F.H.,Livo, K.E.,Breit, G.N.,Kruse, F.A.,Sutley, S.J.,Snee, L.W.,Lowers, H.A.,Post, J.L.,Stoffregen, R.E.,Ashley, R.P., 2014. Mapping advanced argillic al-teration at Cuprite, Nevada, using imaging spectroscopy. Econ. Geol. 109, 1179–1221.
TerraSpec Explorer, 2011. User Manual. ASD Document 600549-A.Thompson, A.J.B., Thompson, J.F.H., 1996. Atlas of Alteration. A Field and Petrographic
Guide to Hydrothermal Alteration Minerals. Alpine Press Limited, Vancouver.Thompson, A.J.B., Hauff, P.L., Robitaille, A.J., 1999. Alteration mapping in exploration:
application of short-wave infrared (SWIR) spectroscopy. Soc. Econ. Geol. Newsl. 39,15–17.
White, N.C.,Hedenquist, J.W., 1995. Epithermal gold deposits: styles, characteristics andexploration. Soc. Econ. Geol. Newsl. 23, 9–13.