Differential susceptibility to effects of maternal sensitivity? A study of candidate plasticity...
22
Differential susceptibility to effects of maternal sensitivity? A study of candidate plasticity genes JAY BELSKY, a DANIEL A. NEWMAN, b KEITH F. WIDAMAN, a PHIL RODKIN, b MICHAEL PLUESS, c R. CHRIS FRALEY, b DANIEL BERRY, b JONATHAN L. HELM, a AND GLENN I. ROISMAN d a University of California, Davis; b University of Illinois at Urbana–Champaign; c Kings College London; and d University of Minnesota Abstract Here we tested whether there was genetic moderation of effects of early maternal sensitivity on social–emotional and cognitive–linguistic development from early childhood onward and whether any detected Gene Environment interaction effects proved consistent with differential-susceptibility or diathesis–stress models of PersonEnvironment interaction (N ¼ 695). Two new approaches for evaluating models were employed with 12 candidate genes. Whereas maternal sensitivity proved to be a consistent predictor of child functioning across the primary-school years, candidate genes did not show many main effects, nor did they tend to interact with maternal sensitivity/insensitivity. These findings suggest that the developmental benefits of early sensitive mothering and the costs of insensitive mothering look more similar than different across genetically different children in the current sample. Although acknowledgement of this result is important, it is equally important that the generally null GeneEnvironment results reported here not be overgeneralized to other samples, other predictors, other outcomes, and other candidate genes. The differential-susceptibility hypothesis, which stipulates that some individuals are more susceptible than others to both positive and negative environmental effects, perhaps most especially parenting, has received substantial attention and empirical support in recent years (Belsky, Bakermans- Kranenburg, & van IJzendoorn, 2007; Belsky & Pluess, 2013; Ellis, Boyce, Belsky, Bakermans-Kranenburg, & van IJzendoorn, 2011; Pluess & Belsky, 2009, 2010), including in research on Gene Environment (G E) interaction (Ba- kermans-Kranenburg & van IJzendoorn, 2011; Belsky et al., 2009; Belsky & Pluess, 2009; Berry, Deater-Deckard, McCartney, Wang, & Petrill, 2013). Here we test the specific proposition that a set of 12 candidate “plasticity genes,” se- lected principally on the basis of prior reviews of relevant research (Belsky et al., 2009; Belsky & Pluess, 2009), will moderate the effects of maternal sensitivity on children’s social–emotional and cognitive–linguistic development in a manner consistent with the differential-susceptibility hypothe- sis. Toward this end, we employ two new statistical methods, applying them to longitudinal data collected from the National Institute of Child Health and Human Development Study of Early Child Care and Youth Development (NICHD SECCYD; NICHD Early Child Care Research Network [ECCRN], 2005), in response to questions raised about the adequacy and appro- priateness of existing statistical criteria for evaluating differen- tial susceptibility (Belsky, Pluess, & Widaman, 2013; Roisman et al., 2012; Widaman et al., 2012). The application of appro- priate analytic criteria for differential susceptibility is necessary to minimize Type 1 errors and failures to replicate that have fru- strated previous work on candidate genes and broad phenotypes of human cognition, personality, and social behavior (Charney & English, 2012; Deary, 2012; Wacker, Mueller, Hennig, & Stemmler, 2012). Theories of Socialization and Maternal Sensitivity A central assumption of many developmental perspectives on socialization, whether based, for example, on theories of at- tachment (Ainsworth, 1973; Sroufe, 2000), social learning (Patterson, 1986), or evolution (Belsky, Steinberg, & Draper, 1991), is that parenting matters when it comes to how children develop. Although a myriad of parenting constructs are mea- sured in socialization research, including, for example, author- itative parenting (Baumrind, 1967, 1991), coercive parenting (Patterson, 1986), and mutually responsive relationships (Ko- chanska, 2002), the focus in the present report is on sensitive parenting, a construct emphasized in attachment theory. Ac- Address correspondence and reprint requests to: Jay Belsky, Department of Human Ecology, University of California, Davis, 1331 Hart Hall, One Shields Avenue, Davis, CA 95616; E-mail: [email protected]. Extraction and genotyping for the NICHD SECCYD was performed at the Genome Core Facility in the Huck Institutes for Life Sciences at Penn State University under the direction of Deborah S. Grove, Director for Genetic Analysis. Genotyping was principally supported by a Research Board grant from the University of Illinois at Urbana–Champaign (to P.R. and G.I.R.). This work was also supported by NSF Grant BCS-0720538 (to G.I.R. and R.C.F.) and by NICHD Grant R01 HD064687 to Rand Conger, which are gratefully acknowledged. Finally, we dedicate this work to the memory of our friend and coauthor Phil Rodkin. In addition to his major contributions to this manuscript, Phil fully embodied the collaborative and collegial spirit that ultimately birthed this contribution to the literature. Development and Psychopathology, 2014, page 1 of 22 # Cambridge University Press 2014 doi:10.1017/S0954579414000844 1
-
Upload
independent -
Category
Documents
-
view
2 -
download
0
Transcript of Differential susceptibility to effects of maternal sensitivity? A study of candidate plasticity...
Differential susceptibility to effects of maternal sensitivity?A study of candidate plasticity genes
JAY BELSKY,a DANIEL A. NEWMAN,b KEITH F. WIDAMAN,a PHIL RODKIN,b MICHAEL PLUESS,c
R. CHRIS FRALEY,b DANIEL BERRY,b JONATHAN L. HELM,a AND GLENN I. ROISMANd
aUniversity of California, Davis; bUniversity of Illinois at Urbana–Champaign; cKings College London; and dUniversityof Minnesota
Abstract
Here we tested whether there was genetic moderation of effects of early maternal sensitivity on social–emotional and cognitive–linguistic developmentfrom early childhood onward and whether any detected Gene�Environment interaction effects proved consistent with differential-susceptibility ordiathesis–stress models of Person�Environment interaction (N¼ 695). Two new approaches for evaluating models were employed with 12 candidate genes.Whereas maternal sensitivity proved to be a consistent predictor of child functioning across the primary-school years, candidate genes did not show manymain effects, nor did they tend to interact with maternal sensitivity/insensitivity. These findings suggest that the developmental benefits of early sensitivemothering and the costs of insensitive mothering look more similar than different across genetically different children in the current sample. Althoughacknowledgement of this result is important, it is equally important that the generally null Gene�Environment results reported here not be overgeneralized toother samples, other predictors, other outcomes, and other candidate genes.
The differential-susceptibility hypothesis, which stipulatesthat some individuals are more susceptible than others toboth positive and negative environmental effects, perhapsmost especially parenting, has received substantial attentionand empirical support in recent years (Belsky, Bakermans-Kranenburg, & van IJzendoorn, 2007; Belsky & Pluess,2013; Ellis, Boyce, Belsky, Bakermans-Kranenburg, & vanIJzendoorn, 2011; Pluess & Belsky, 2009, 2010), includingin research on Gene�Environment (G�E) interaction (Ba-kermans-Kranenburg & van IJzendoorn, 2011; Belskyet al., 2009; Belsky & Pluess, 2009; Berry, Deater-Deckard,McCartney, Wang, & Petrill, 2013). Here we test the specificproposition that a set of 12 candidate “plasticity genes,” se-lected principally on the basis of prior reviews of relevantresearch (Belsky et al., 2009; Belsky & Pluess, 2009), willmoderate the effects of maternal sensitivity on children’ssocial–emotional and cognitive–linguistic development in a
manner consistent with the differential-susceptibility hypothe-sis. Toward this end, we employ two new statistical methods,applying them to longitudinal data collected from the NationalInstitute of Child Health and Human Development Study ofEarly Child Care and Youth Development (NICHD SECCYD;NICHD Early Child Care Research Network [ECCRN], 2005),in response to questions raised about the adequacy and appro-priateness of existing statistical criteria for evaluating differen-tial susceptibility (Belsky, Pluess, & Widaman, 2013; Roismanet al., 2012; Widaman et al., 2012). The application of appro-priate analytic criteria for differential susceptibility is necessaryto minimize Type 1 errors and failures to replicate that have fru-strated previous work on candidate genes and broad phenotypesof human cognition, personality, and social behavior (Charney& English, 2012; Deary, 2012; Wacker, Mueller, Hennig, &Stemmler, 2012).
Theories of Socialization and Maternal Sensitivity
A central assumption of many developmental perspectives onsocialization, whether based, for example, on theories of at-tachment (Ainsworth, 1973; Sroufe, 2000), social learning(Patterson, 1986), or evolution (Belsky, Steinberg, & Draper,1991), is that parenting matters when it comes to how childrendevelop. Although a myriad of parenting constructs are mea-sured in socialization research, including, for example, author-itative parenting (Baumrind, 1967, 1991), coercive parenting(Patterson, 1986), and mutually responsive relationships (Ko-chanska, 2002), the focus in the present report is on sensitiveparenting, a construct emphasized in attachment theory. Ac-
Address correspondence and reprint requests to: Jay Belsky, Departmentof Human Ecology, University of California, Davis, 1331 Hart Hall, OneShields Avenue, Davis, CA 95616; E-mail: [email protected].
Extraction and genotyping for the NICHD SECCYD was performed at theGenome Core Facility in the Huck Institutes for Life Sciences at Penn StateUniversity under the direction of Deborah S. Grove, Director for GeneticAnalysis. Genotyping was principally supported by a Research Board grantfrom the University of Illinois at Urbana–Champaign (to P.R. and G.I.R.).This work was also supported by NSF Grant BCS-0720538 (to G.I.R. andR.C.F.) and by NICHD Grant R01 HD064687 to Rand Conger, which aregratefully acknowledged. Finally, we dedicate this work to the memory ofour friend and coauthor Phil Rodkin. In addition to his major contributionsto this manuscript, Phil fully embodied the collaborative and collegial spiritthat ultimately birthed this contribution to the literature.
Development and Psychopathology, 2014, page 1 of 22# Cambridge University Press 2014doi:10.1017/S0954579414000844
1
cording to Ainsworth (1969), sensitive parenting involvesreading the child’s cues accurately and responding in a timelyand appropriate fashion. However, this conceptualization hasbeen operationalized in a number of ways, perhaps most clearlychronicled in De Wolf and van IJzendoorn’s (1997) meta-anal-ysis of the effects of sensitivity on attachment security, wherediverse measures of warmth, responsiveness, expressions ofpositive affect, and interactional synchrony all proved to func-tion similarly when it came to predicting attachment security.
Early sensitivity is not only clearly and causally related tothe development of attachment security (for meta-analysis,see Bakermans-Kranenburg, van IJzendoorn, & Juffer,2003) but also predicts a diverse array of developmental out-comes (e.g., Jaafari-Bimmel, Juffer, van IJzendoorn, Baker-mans-Kranenburg, & Mooijaart, 2006; Sroufe, Egeland,Carlson, & Collins, 2005). In the NICHD SECCYD, for ex-ample, a composite measure of sensitivity averaged across theearly childhood years proved consistently predictive of vir-tually every developmental outcome investigated, whethersocioemotional or cognitive–linguistic in character, andmore so than any measure of childcare experience (Belskyet al., 2007; Fraley, Roisman, & Haltigan, 2013; Haltigan,Roisman, & Fraley, 2013; NICHD ECCRN, 2006; Vandellet al., 2010). This program of research was not genetically in-formed and thus not positioned to discount or illuminate thepossible genetic basis of the presumptive environmental ef-fects chronicled (but see Roisman & Fraley, 2012). Thesame limitation should be acknowledged with regard to theresearch reported here.
Central to most theories of socialization (whether they em-phasize sensitive-responsiveness, coercive dyadic exchanges,authoritative parenting, or mutually reciprocal relationships)is the implicit if not explicit assumption that most if not allchildren are susceptible to the developmental benefits of sup-portive rearing and/or the adverse consequences of unsuppor-tive parenting. For example, Baumrind’s (1967) theory ofparenting does not presume that some children reap the re-wards of authoritative parenting more than others; and thesame is true of Patterson’s (1982) view of the antisocial con-sequences of coercive parenting that inadvertently rewardschildren’s angry, disputatious behavior. Nor is it the casethat Ainsworth (1973) theorized that sensitive parentingwould foster secure attachment in only some children andnot others or more so in some than others. Belsky et al.(1991) raised this possibility in advancing their evolutionarytheory of socialization, but only in passing.
The Diathesis–Stress Framework
The notion that individuals differ in their susceptibility toenvironmental effects has a long history in psychiatry andpsychology (Belsky & Pluess, 2009). Sameroff’s (1983)transactional model of development raised the possibilitythat, for example, certain children already at risk for develop-mental difficulties for organismic reasons (e.g., prematurebirth) would be especially likely to be adversely affected by
contextual sources of development risk, including problem-atic parenting. Furthermore, this view has been central to alarge body of work on Temperament�Parenting interactions(for a review, see Rothbart & Bates, 2006) and psychopathol-ogy (Gottesman & Shields, 1967; Zuckerman, 1999). Implic-itly or explicitly, the diathesis–stress conceptual frameworkhas guided much developmental and clinical inquiry.
Central to the diathesis–stress framework is the view thatcertain individuals are especially vulnerable to contextual ad-versity (e.g., problematic parenting) as a result of endogenouscharacteristics (Gottesman & Shields, 1967; Zuckerman,1999), most notably, genetic makeup, the focus of this report.Diathesis–stress thinking spawned some of the first G� Einteraction research examining the co-action of putative “vul-nerability genes” or “risk alleles” and child maltreatment inpredicting young adults’ antisocial behavior (Caspi et al.,2002). As another example, diathesis–stress thinking alsoyielded predictions that prenatal smoking would result in ele-vated attention-deficit/hyperactivity disorder symptoms whenchildren carried a particular risk allele, the 7 repeat of the do-pamine receptor D4 polymorphism (DRD4; Neuman et al.,2007), as it did.
The Differential-Susceptibility Framework
What was not apparently entertained in the first wave of hu-man G�E research or in developmental research on sociali-zation was that some individuals would not just prove moresusceptible to the developmental costs of unsupportive rear-ing (or other forms of contextual adversity), but that thesame putatively “vulnerable” individuals would be especiallylikely to reap the developmental benefits of supportive par-enting (or other forms of contextual support). Yet this is ex-actly what the differential-susceptibility hypothesis predicts:individual differences in developmental plasticity (Belsky,1997, 2005; Belsky et al., 2007, 2010; Belsky & Pluess,2009, 2013; Ellis et al., 2011). That is, some children will bemore affected by their parenting experiences than others, forbetter and for worse (Belsky et al., 2007), as a result of theirown temperamental, physiological, and/or genetic makeup,although it is the latter that is of central concern to thisreport. This evolutionary perspective on parenting effects(and other environmental experiences and exposures) wasfounded on the view that, because the future is inherentlyuncertain, parents’ and children’s inclusive fitness wouldnot be optimized if every child were equally developmentallymalleable or plastic.
The logic of this view is that regulating future functioningbased on developmental experiences would pay off princi-pally when the future was tolerably consistent with the past,but this would not be the case when the world the childcame to live in as she or he grew up diverged markedly fromthat of childhood (Belsky, 1997, 2005; Ellis et al., 2011). Inother words, differential susceptibility to rearing (and otherenvironmental experiences and exposures) could functionas a means by which children and parents hedged their inclu-
J. Belsky et al.2

sive-fitness bets. The biologic here is exactly the same as thatwhich recommends diversification of economic investments.Because one can never know whether an investment offeringa fixed and predictable return will lose value over time due toinflation exceeding that figure, and because one can neverknow whether a particular equity’s value will increase or de-crease over time, portfolio theory stipulates hedging bets bynot putting all eggs in one basket.
There is a large body of recent evidence that seems to in-dicate that children vary in their susceptibility to rearing ef-fects, and in a for better and for worse manner, and that thisis so whether one considers temperamental, physiological,or genetic factors as moderators of environmental effectsand thus markers of greater and lesser developmental plastic-ity (for reviews, see Belsky, 2005; Belsky & Pluess, 2009,2013; Obradovic & Boyce, 2009; Pluess & Belsky, 2009,2010). That this appears to be the case for some polymor-phisms long regarded as “vulnerability genes” or “risk al-leles” served as the impetus for the proposal that they be re-conceptualized as “plasticity genes” (Belsky et al., 2009).Consider in this regard the following very recent and illustra-tive findings pertaining to the genetic moderation of parent-ing effects by each of 3 (of 12) putative plasticity genes exam-ined in the current report:
1. Hankin et al. (2011) observed that positive parenting wasmore strongly associated with the positive affect of 8- to12-year-olds (in a for better and for worse fashion) inthe case of children carrying short alleles on the serotonintransporter linked polymorphic region gene (5-HTTLPR)than for those carrying other versions of this gene.
2. Knafo, Israel, and Ebstein (2011) reported that mother’sfailure to explain her reasons for punishing the child pre-dicted preschoolers’ observed prosocial behavior, again ina differential-susceptibility related manner, and thus onlyin the case of those carrying the DRD4 7-repeat allele.
3. Finally, Suzuki et al. (2011) found that retrospectively re-ported parental rearing predicted the personality trait ofself-directedness more strongly in those homozygous forthe methionine allele on the brain-derived neurotrophicfactor Val66Met polymorphism (BDNF) than thosehomozygous for the valine allele, such that the formerscored highest and lowest on self-directedness as a func-tion of whether they experienced more and less supportiverearing, respectively.
Despite such evidence for plasticity genes, questions canbe raised about the interpretation of findings (Roismanet al., 2012). When Belsky (2005) first reviewed evidenceon temperament (and later physiology) and G�E interactionthat routinely had been interpreted in diathesis–stress termsbut appeared to reflect differential susceptibility (Belskyet al., 2009; Belsky & Pluess, 2009), he and his associates re-lied on a very simple method of evaluation: visual inspection ofgraphic displays of crossover interactions reflecting environ-mental factor and moderator in predicting some phenotypic
measurement. Thus, a liberal criterion was established to raisethe prospect of differential susceptibility; more specifically,the predictor–outcome relation had to be stronger and graphi-cally steeper in one subgroup than another once a significantstatistical interaction was decomposed.
In attempt to refine the evaluation of differential suscepti-bility, Belsky et al. (2007) delineated more specific and de-manding statistical criteria. In addition to the detection of asignificant crossover interaction between the environmentalpredictor (e.g., parenting) and the plasticity or moderatingfactor (e.g., candidate gene), also required was evidencethat the slope reflecting the predictor–outcome associationbe significant in the case of one subset of research partici-pants but not the other or that the slope of the former be sig-nificantly greater than that of the latter. Two independentteams (Belsky et al., 2013; Roisman et al., 2012; Widamanet al., 2012) recently offered even more exacting criteriathat must be met for a conclusion of differential susceptibilityto be embraced. Each is discussed in turn, because each willbe employed in the research reported herein when testing theproposition that children carrying specific alleles of candidategenetic plasticity markers will be more susceptible thanothers to sensitive and insensitive parenting.
The Roisman and Colleagues Approach
Roisman et al. (2012) proposed a set of recommendations toovercome four limitations of existing methods used to evalu-ate differential susceptibility. One recommendation is thatinvestigators conduct regions of significance (RoS) tests todetermine the full range of values of the moderator for whichthe regression of the outcome on the predictor (X ) is statisti-cally significant. Although these tests, first used by Ko-chanska, Kim, Barry, and Philibert (2011) in relation to thedifferential susceptibility hypothesis, can be employed to ex-amine the values of the moderator (M ) for which the associa-tion between X and Y is significant, these tests can also beused to examine the values of the predictor for which theassociation between M and Y is significant.
Roisman et al. (2012) recommend that the difference be-tween those with and without (or high vs. low on) the mod-erator should be significant both on the low end of X and onthe high end of X before concluding that results are consis-tent with differential-susceptibility predictions. Becausethe difference can be significant at values of X that arenot represented in the sample (e.g., at 14 SD below themean), Roisman et al. further recommended that investiga-tors conduct RoS tests using common regions of interest(i.e., the range of X for the RoS on X test should be boundedby +2 SD).
The second recommendation by Roisman et al. (2012) is touse new metrics specifically designed to index disordinal-interaction effects. Roisman et al. proposed two closely re-lated indices that take advantage of the crossover point ofthe interaction providing a natural way to conceptualize thepoint at which an effect of Z on Y can change from “for better”
G�E maternal sensitivity 3
to “for worse.” The first metric, labeled the proportion ofinteraction (PoI) index, represents the proportion of the totalarea between the lines of an interaction plot, bounded by +2SD on X, that is above the crossover point. In a prototypicalinteraction plot for differential susceptibility, the lines willcross over near the mean of X; as a result, 50% of the areabounded by the regression lines in such a plot would representthe for better region. In a prototypical case of diathesis–stress(i.e., an ordinal interaction), the crossover point will be on thefar right side of the plot and 0% of the total area will representthe for better region.
The second index, labeled the proportion affected or thepercentage above (PA) index, is similar to the PoI, but it is de-signed to quantify the proportion of all people in the samplewho fall above the crossover point for the interaction. Thisvalue is an estimate of the number of people in the samplewho are differentially affected “for the better.” In a prototypi-cal differential susceptibility situation, 50% of people will bedifferentially affected for the better by Z (e.g., difficult tem-perament) as a function of X (e.g., parenting). In a prototypicaldiathesis–stress situation, 0% of people will be differentiallyaffected for the better by Z as a function of X. When used inthis manner, Roisman et al. (2012) recommend that differen-tial susceptibility is highly consistent with PoI values between40% and 60%, or PA values equal to or greater than 16%.
The third recommendation involves testing for nonlinear-ity; thus, before investigators conclude in favor of differentialsusceptibility, they first demonstrate that neither X2, ZX2, northe combination of X2 and ZX2 is statistically significant; andif one or more of these terms is significant, then a researchermust demonstrate that the interaction between X and Z holdswhen these nonlinear terms are statistically controlled. Thiscan be useful because, if predictor X (e.g., maternal sensitiv-ity) has a quadratic association with outcomes, but only whenZ is low, it is possible to find evidence suggesting that someindividuals experience beneficial effects of Z (e.g., difficulttemperament) when they do not.
Roisman et al.’s (2012) fourth recommendation is thatinvestigators attend to Type I error rates when examiningmultiple interactions in multiwave data sets. They thus of-fered two ways of solving this problem: use multilevel modelsto examine differential susceptibility across the entire devel-opmental course under investigation (i.e., an intercepts as out-comes model) and adjust alpha when multiple comparisonsare considered.
The Widaman and Colleagues Approach
In an independent contribution, Widaman et al. (2012;Belsky et al., 2013) offered a model-comparison approachfor evaluating whether interactions reflect differential suscep-tibility or diathesis–stress. In contrast to Roisman et al.(2012), it does not require a statistically significant G� Einteraction before proceeding to evaluate the form of theinteraction, though formal statistical indices are used to selectthe best fitting model.
Under diathesis–stress theorizing, the predicted interactionshould be ordinal in form. Consider a biallelic polymorphismwith three possible genotypes, containing 0, 1, or 2 putativerisk alleles. According to diathesis–stress, a regression modelwith a Linear G�Linear E interaction should reveal four out-comes: a small or zero effect of the environment for the (re-silient) group with 0 risk alleles; a stronger, significant effectof the environment for the group with 2 risk alleles; a mid-dling outcome by the group with 1 risk allele; and a crossoverpoint of the linear functions at or near the most positive valuefor the environment.
Differential susceptibility leads to a contrasting predictionregarding the form of the G�E interaction. The alternate al-leles under differential susceptibility are recast as plasticityand nonplasticity alleles, rather than risk and resilience al-leles, respectively. The predicted interaction would stillhave a small (or nil) effect of the environment for the least-plastic group, a stronger, significant effect of the environmentfor the plastic group, and a moderate effect for the moderatelyplastic group. The crossover point of these three linear func-tions would be near the middle of the distribution of scores onthe environmental variable, thus revealing a “for better andfor worse” pattern (Belsky et al., 2007), with “better” out-comes (i.e., greater social competence) predicted for themost-plastic group under more favorable environmental con-ditions and “worse” outcomes (i.e., less social competence)for the most-plastic group under less favorable ones.
The location of the crossover point for the predicted out-comes is therefore the crucial parameter that distinguishespredictions for the G�E interaction for the competing diath-esis–stress and differential-susceptibility positions. Widamanet al. (2012) proposed a reparameterized regression modelthat makes the crossover point one of the parameters to be es-timated. One major benefit of the reparameterization is thatthe point estimate of the crossover point is accompanied bya standard error, so that an interval estimate can be calculated.Among other things, the reparameterized model allowsmodel fit under differential-susceptibility and diathesis–stressconditions to be statistically contrasted, with the better fittingmodel offered as the optimal representation of the data.
Widaman et al. (2012; Belsky et al., 2013) highlightedfour reparameterized models that can provide tests of key pa-rameters consistent with (a) weak and (b) strong differential-susceptibility and (c) weak and (d) strong diathesis–stresspredictions. Whereas strong models presume that some indi-viduals are not at all susceptible to environmental effects (i.e.,zero-order association between predictor and outcome), weakmodels presume that all are susceptible but that some aremore so than others. As with the Roisman et al. (2012) ap-proach, Widaman et al. (2012; Belsky et al., 2013) stressedthat an initial screening should be done to discount the pre-sence of nonlinearities in relations among variables in themodel. By the same token, given the model-testing approachcentral to Widaman et al. (2012; Belsky et al., 2013), only ifthe nature of the interactions being evaluated prove consistentwith the a priori predictions on which the modeling is based
J. Belsky et al.4
would the fit of any model be regarded as meaningful andthus interpretable.
The Current Study
In the current study we employed both of the new statisticalapproaches just outlined for evaluating differential suscepti-bility. In particular, we used the six diagnostics for disordinalinteractions (e.g., differential susceptibility) described inTable 1. The first four diagnostics and the crossover point re-flect the Roisman et al. (2012) approach, whereas the finaltwo reflect the Widaman et al. (2012) approach. We usedthese diagnostics to evaluate the proposition that maternalsensitivity/insensitivity, measured repeatedly across theopening years of life, differentially predicts, depending onthe child’s genotype, socioemotional and cognitive–linguis-tic functioning measured repeatedly from as early as age 24months to as late as 15 years. More specifically, we focusedon 12 candidate plasticity markers to determine whetherthey moderated the parenting/child-development associationsunder investigation in a for better and for worse, differential-susceptibility related manner. With two exceptions, the can-didate plasticity markers selected for consideration are theones to which Belsky and Pluess (2009) called attention intheir review of G�E evidence seemingly consistent with dif-ferential susceptibility. Table 2 delineates the candidate plas-ticity genes that are the focus of inquiry, whether they werehighlighted in the aforementioned review, and which allelesare expected to identify children who are more rather thanless susceptible to the effects of maternal sensitivity in a dif-ferential-susceptibility related manner; listed in the table aswell are some reports that chronicled differential susceptibil-ity using the genes in question.
Because virtually all of these 12 genes are implicated in thefunctioning of the dopaminergic and/or serotonergic neuro-transmitter systems in ways discussed and reviewed by Belskyand Pluess (2009), in the interests of space we do not considerhere possible biological mechanisms by which these genesmay come to moderate the parenting effects under investigation.This also seems reasonable because absolutely no mechanism-related measurements are included in this inquiry, meaning thatany and all discussion of how the candidate plasticity genes un-der investigation might moderate the effects of parenting wouldbe entirely speculative. The question we ask is simply whethergenetic moderation in a manner consistent with differential sus-ceptibility proves evident, not why this is the case mechanisti-cally. Moreover, we appreciate that the candidate polymor-phisms considered in this report are likely just markers forcomplex, multigenetic, and multilevel processes, so breathing“mechanistic meaning” into them risks implying that they aremuch more than proxies for complex biological processesthat remain unmeasured (see Charney & English, 2012).
Table 2 is organized to highlight three candidate genes wewere most confident would moderate effects of maternal sen-sitivity in a differential-susceptibility related manner and nineothers we were less confident about, divided into two sub-
groups for reasons articulated below. The three polymor-phisms in the top tier are 5-HTTLPR, DRD4, and BDNF.Not only were the first two highlighted in the research re-viewed by Belsky and Pluess (2009), but also multiple addi-tional G� E studies have emerged since the preparation ofthat review indicating that these polymorphisms operatelike plasticity genes (e.g., 5-HTTLPR; Brody et al., 2011;Carver, Johnson, Joorman, Kim, & Nam, 2011; Hankin, Jen-ness, et al., 2011; Hankin, Nederohof, et al., 2011; Kuepperet al., 2012; DRD4: Fortuna et al., 2011; Knafo et al., 2011;Park, Sher, Todorov, & Heath, 2011; Verschoor & Markus,2011). The same appears true of BDNF, a candidate genethat was not included in the Belsky and Pluess (2009) review,because it is only in the time since that review was preparedthat G�E evidence has emerged repeatedly suggesting thatBDNF also operates as a plasticity gene (Hayden et al.,2012; Juhasz et al., 2011; Mata, Thompson, & Gotlib,2010; Suzuki et al., 2011).
The second set of markers in Table 2 forms the “secondtier” because G�E research emerging since the Belsky andPluess (2009) review was prepared has not continued to high-light these genes as plasticity genes to the same extent as istrue for those in the first tier. The third tier includes twopolymorphisms that, like BDNF, were not included in the in-itial review, though they have not yet garnered as much evi-dence as BDNF that they function as plasticity genes. To beclear, polymorphisms listed in the second and third tiersmay have ended up there simply because they are less oftenthe focus of attention in G�E research than those polymor-phisms in the first tier. Nevertheless, the judgments regardingthe categorization of the two sets of genes are based on theauthors’ reading of the empirical literature on G�E.
Method
Participants
Families were recruited for the NICHD SECCYD in 1991 fromhospitals located in or near Little Rock, Arkansas; OrangeCounty, California; Lawrence, Kansas; Boston, Massachusetts;Pittsburgh, Pennsylvania; Philadelphia, Pennsylvania; Char-lottesville, Virginia; Seattle, Washington; Morganton, NorthCarolina; and Madison, Wisconsin. During selected 24-hr sam-pling periods, 8,986 women who gave birth were screened,5,416 of whom met the eligibility criteria for the study. Familieswere excluded if (a) the mother was younger than 18 years ofage, (b) the family planned to move, (c) there was a multiplebirth, (d) the infant had a known disability or remained in thehospital more than 7 days, (e) the mother acknowledged sub-stance abuse, (f) the mother did not speak English, and/or (g)the mother lived more than an hour from the laboratory siteor in an extremely unsafe neighborhood, as determined by localpolice. From that group, 1,364 families became study partici-pants upon completing an interview when their infants were 1month old. Details about recruitment and selection proceduresare available in prior publications from the study (see NICHD
G�E maternal sensitivity 5
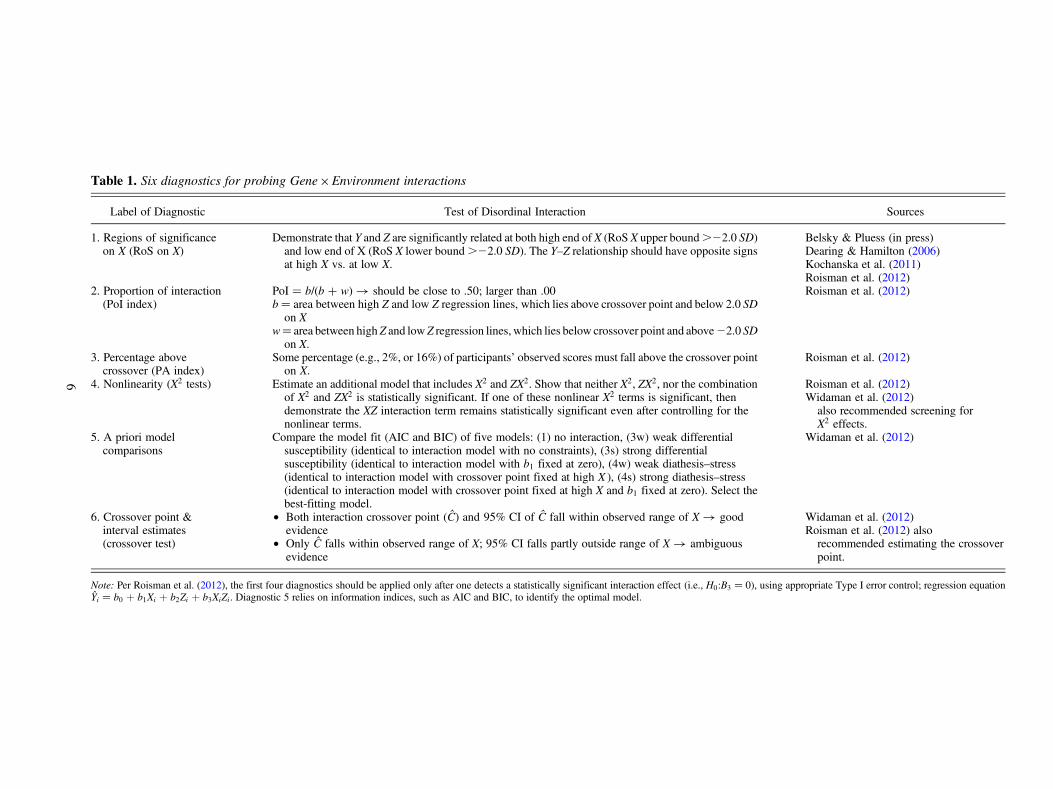
Table 1. Six diagnostics for probing Gene×Environment interactions
Label of Diagnostic Test of Disordinal Interaction Sources
1. Regions of significanceon X (RoS on X)
Demonstrate that Y and Z are significantly related at both high end of X (RoS X upper bound .22.0 SD)and low end of X (RoS X lower bound .22.0 SD). The Y–Z relationship should have opposite signsat high X vs. at low X.
Belsky & Pluess (in press)Dearing & Hamilton (2006)Kochanska et al. (2011)Roisman et al. (2012)
2. Proportion of interaction(PoI index)
PoI ¼ b/(b + w) � should be close to .50; larger than .00b ¼ area between high Z and low Z regression lines, which lies above crossover point and below 2.0 SD
on Xw¼ area between high Z and low Z regression lines, which lies below crossover point and above 22.0 SD
on X.
Roisman et al. (2012)
3. Percentage abovecrossover (PA index)
Some percentage (e.g., 2%, or 16%) of participants’ observed scores must fall above the crossover pointon X.
Roisman et al. (2012)
4. Nonlinearity (X2 tests) Estimate an additional model that includes X2 and ZX2. Show that neither X2, ZX2, nor the combinationof X2 and ZX2 is statistically significant. If one of these nonlinear X2 terms is significant, thendemonstrate the XZ interaction term remains statistically significant even after controlling for thenonlinear terms.
Roisman et al. (2012)Widaman et al. (2012)
also recommended screening forX2 effects.
5. A priori modelcomparisons
Compare the model fit (AIC and BIC) of five models: (1) no interaction, (3w) weak differentialsusceptibility (identical to interaction model with no constraints), (3s) strong differentialsusceptibility (identical to interaction model with b1 fixed at zero), (4w) weak diathesis–stress(identical to interaction model with crossover point fixed at high X ), (4s) strong diathesis–stress(identical to interaction model with crossover point fixed at high X and b1 fixed at zero). Select thebest-fitting model.
Widaman et al. (2012)
6. Crossover point &interval estimates(crossover test)
† Both interaction crossover point (C) and 95% CI of C fall within observed range of X � goodevidence
† Only C falls within observed range of X; 95% CI falls partly outside range of X � ambiguousevidence
Widaman et al. (2012)Roisman et al. (2012) also
recommended estimating the crossoverpoint.
Note: Per Roisman et al. (2012), the first four diagnostics should be applied only after one detects a statistically significant interaction effect (i.e., H0:B3 ¼ 0), using appropriate Type I error control; regression equationYi ¼ b0 þ b1Xi þ b2Zi þ b3XiZi. Diagnostic 5 relies on information indices, such as AIC and BIC, to identify the optimal model.
6
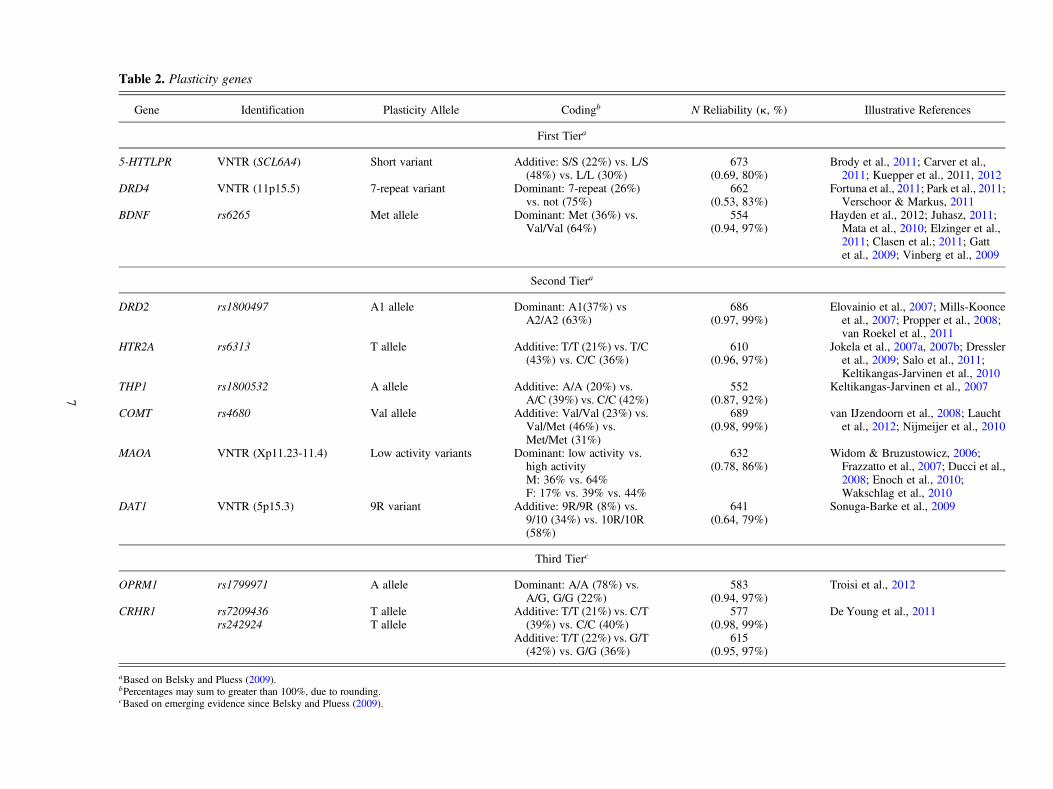
Table 2. Plasticity genes
Gene Identification Plasticity Allele Codingb N Reliability (k, %) Illustrative References
First Tiera
5-HTTLPR VNTR (SCL6A4) Short variant Additive: S/S (22%) vs. L/S(48%) vs. L/L (30%)
673(0.69, 80%)
Brody et al., 2011; Carver et al.,2011; Kuepper et al., 2011, 2012
DRD4 VNTR (11p15.5) 7-repeat variant Dominant: 7-repeat (26%)vs. not (75%)
662(0.53, 83%)
Fortuna et al., 2011; Park et al., 2011;Verschoor & Markus, 2011
BDNF rs6265 Met allele Dominant: Met (36%) vs.Val/Val (64%)
554(0.94, 97%)
Hayden et al., 2012; Juhasz, 2011;Mata et al., 2010; Elzinger et al.,2011; Clasen et al.; 2011; Gattet al., 2009; Vinberg et al., 2009
Second Tiera
DRD2 rs1800497 A1 allele Dominant: A1(37%) vsA2/A2 (63%)
686(0.97, 99%)
Elovainio et al., 2007; Mills-Koonceet al., 2007; Propper et al., 2008;van Roekel et al., 2011
HTR2A rs6313 T allele Additive: T/T (21%) vs. T/C(43%) vs. C/C (36%)
610(0.96, 97%)
Jokela et al., 2007a, 2007b; Dressleret al., 2009; Salo et al., 2011;Keltikangas-Jarvinen et al., 2010
THP1 rs1800532 A allele Additive: A/A (20%) vs.A/C (39%) vs. C/C (42%)
552(0.87, 92%)
Keltikangas-Jarvinen et al., 2007
COMT rs4680 Val allele Additive: Val/Val (23%) vs.Val/Met (46%) vs.Met/Met (31%)
689(0.98, 99%)
van IJzendoorn et al., 2008; Lauchtet al., 2012; Nijmeijer et al., 2010
MAOA VNTR (Xp11.23-11.4) Low activity variants Dominant: low activity vs.high activityM: 36% vs. 64%F: 17% vs. 39% vs. 44%
632(0.78, 86%)
Widom & Bruzustowicz, 2006;Frazzatto et al., 2007; Ducci et al.,2008; Enoch et al., 2010;Wakschlag et al., 2010
DAT1 VNTR (5p15.3) 9R variant Additive: 9R/9R (8%) vs.9/10 (34%) vs. 10R/10R(58%)
641(0.64, 79%)
Sonuga-Barke et al., 2009
Third Tierc
OPRM1 rs1799971 A allele Dominant: A/A (78%) vs.A/G, G/G (22%)
583(0.94, 97%)
Troisi et al., 2012
CRHR1 rs7209436rs242924
T alleleT allele
Additive: T/T (21%) vs. C/T(39%) vs. C/C (40%)
Additive: T/T (22%) vs. G/T(42%) vs. G/G (36%)
577(0.98, 99%)
615(0.95, 97%)
De Young et al., 2011
aBased on Belsky and Pluess (2009).bPercentages may sum to greater than 100%, due to rounding.cBased on emerging evidence since Belsky and Pluess (2009).
7
ECCRN, 2005) and http://secc.rti.org. Note that, althoughlarge, demographically diverse, and methodologically rich,the SECCYD was not designed to be a nationally representativestudy.
Analysis sample
Analyses for this report are based on the subset of 695 of theparticipants in the NICHD SECCYD for whom buccal cheekcells were acquired when participants were 15 years old andwhose mothers received at least one maternal sensitivity rat-ing when participants were observed interacting with theirmaternal caregivers at 6, 15, 24, and 36 months of age. (A to-tal of 711 SECCYD participants provided DNA samplesat age 15, although 4 of these participants did not have anyearly maternal sensitivity data and 12 additional participants’samples did not produce valid genotypic data on any of thecandidate genes examined in this report.) Sample sizes foranalyses varied further as a function of the availability of ge-notypic data for each polymorphism. For all modeling analy-ses described below, multiple imputation (m ¼ 20 imputa-tions) was used with raw case-level analytic data as input,to produce less biased and more efficient and consistent pa-rameter estimates than techniques such as pairwise or listwisedeletion for longitudinal missing data (Newman, 2003; Ru-bin, 1987; Schafer, 1997; Schafer & Graham, 2002). Theseanalyses are identical to the multiple imputation approach de-scribed by Roisman et al. (2012), which is similar to the mul-tiple imputation approach used by Pluess and Belsky (2009,2010). The only exception to the multiple imputation proce-dure was that, for the current study, we chose not to imputeany genetic data. To generate RoS on Z, RoS on X, PoI, thecrossover point for the interaction, and the PA indexes weused a web-based program developed by author Fraley. Theapplication is freely available at http://www.yourpersonality.net/interaction/ and can also be used to generate and exploreinteraction plots and to conduct simple slopes tests.
Measures
The measures are presented in four sets corresponding to theirfunction in the analytic plan, as follows: (a) variables used tocreate a composite, early maternal-sensitivity measure, re-flecting the observed quality of participants’ experiencewith caregivers in the first 3 years of life; (b) measures of so-cial competence, as assessed by primary caregivers and teach-ers through the latest assessment for which these data wereavailable (mother: age 15; teacher: Grade 6); (c) measuresof academic skills, as rated by teachers and assessed usingstandardized tests through the latest assessment for which rel-evant data were acquired (teacher reports: Grade 6; standard-ized assessments: age 15); and (d) reports of total problem be-havior, as assessed by primary caregivers and teachers fromthe first through the latest assessment for which these datawere available (mother: age 15; teacher: Grade 6). In all cases
we selected variables that were measured multiple times bymultiple reporters using standard assessment tools.
Early maternal sensitivity. Mother–child interactions were vi-deotaped during 15-min semistructured tasks at 6, 15, 24, and36 months. A number of scales were used to rate the mothers’behavior from these videotapes. More specifically, at 6months, mothers and children were instructed to play to-gether, first with toys available in the home (or none at all)and then with a standard set of toys. At 15, 24, and 36 months,mothers were asked to show their children age-appropriatetoys in three containers in a set order. As in prior studies ofthis sample (e.g., NICHD ECCRN, 2001), observations ofmaternal sensitivity from the first 3 years of life (6, 15, 24,and 36 months) were standardized and averaged to create acomposite of the observed early sensitivity. Note that at 6,15, and 24 months, the a priori maternal sensitivity compos-ites were constructed by summing ratings for sensitivity tonondistress, positive regard, and intrusiveness (reversed).At 36 months the supportive presence, respect for autonomy,and hostility (reversed) scales were composited (as reportedin NICHD ECCRN, 2001, internal consistencies of compos-ites were 0.75, 0.70, 0.79, and 0.78 for the 6, 15, 24, and 36month composites, respectively, and intercoder reliabilitieson scales . .80). Within-age composites showed stabilityover time (rs ¼ .30–.48; standardized a for composite mea-sure ¼ 0.73).
Total problem symptomatology. Symptoms of psychopathol-ogy from childhood to adolescence were assessed with the to-tal problem scale of the Child Behavior Checklist (CBCL)obtained using the parent (CBCL) and Teacher Report(TRF) versions (Achenbach, 1991; Achenbach & Edelbrock,1986; Achenbach, Edelbrock, & Howell, 1987). We used Tscores. In the current study, maternal reports on the CBCLwere used from the following assessment points: a mean com-posite of the 24- and 36-month CBCL (r ¼ .73, p , .01); 54months; kindergarten; Grades 1, 3, 4, 5, and 6; and age 15.Teacher reports were used from the following assessmentpoints: kindergarten and Grades 1, 2, 3, 4, 5, and 6. The totalproblem behavior scale showed adequate reliability acrosstime and had a coefficient a averaging 0.93 for maternal re-ports and 0.96 for teacher reports across all assessments.
Social competence. Mothers completed the 38-item SocialSkills Questionnaire from the Social Skills Rating System(SSRS; Gresham & Elliott, 1990) when children were age 54months; in kindergarten; in Grades 1, 3, 4, 5, and 6; and atage 15, indexing general social competence with adults andother children. To obtain a standardized measure of total socialskills, an a priori scale was created by summing all items that in-dex social competence with other children, with higher scoresindicating more socially skilled children (as ¼ 0.87–0.91, M¼ 0.89). In a parallel fashion, teachers completed the 30-itemschool version of the Social Skills Questionfrom the SSRSwhen children were in kindergarten as well as in Grades 1, 2,
J. Belsky et al.8
3, 4, 5, and 6. As with the mother reports, a standardized totalsocial skills scale was created by summing items indexing so-cial competence (as ¼ 0.93–0.94, M ¼ 0.94).
Academic skills. Teachers also used the SSRS to rate partici-pants’ academic skills when children were in kindergarten,and in Grades 1, 2, 3, 4, and 5 (as ¼ 0.94–0.95, M ¼
0.95). For use in this study, an a priori, standardized academiccompetence scale was created by summing items indexingacademic success. In addition, in order to examine a relativelyobjective assessment of academic skills we used Woodcock–Johnson Psycho-Educational Battery—Revised (WJ-R;Woodcock, 1990; Woodcock & Johnson, 1989) scores at54 months; in Grades 1, 3, and 5; and at age 15. Note thatfor the WJ-R, a slightly different subset of scales was usedat each assessment point. For purposes of this analysis, weaveraged the W (standard) scores for all available subscalesat each time point (within time as ¼ 0.81–0.91, M ¼ 0.87).
Control variables. Although a large number of potential con-trol variables were considered, we selected four that we haveexamined in previous research (e.g., Fraley et al., 2013; Rois-man, Booth-LaForce, Cauffman, Spieker, & the NICHDEarly Child Care Research Network, 2009; Roisman, Sus-man, et al., 2009) and that are known to correlate with mater-nal sensitivity and the outcomes examined in this report: childgender, child ethnicity, maternal education, and family in-come to needs ratio. Child gender was coded in a binary fash-ion (1¼ female, 0¼male). Because the majority of the chil-dren in the sample were White/non-Hispanic, we created abinary variable to represent ethnicity (1 ¼ White/non-His-panic, 0 otherwise). Maternal education was coded on an or-dered metric representing the number of years of education/highest degree. Family financial resources were operational-ized as an income to needs ratio. Income to needs was com-puted separately within each of four assessment waves (6, 15,24, and 36 months) and averaged to create a mean income toneeds index for early childhood. Each of these variables wasentered into all analyses reported below.
Genotyping and DNA reliability
DNA extraction and genotyping for the SECCYD was per-formed at the Genome Core Facility in the Huck Institutesfor Life Sciences at Penn State University under the directionof Deborah S. Grove, Director for Genetic Analysis. For thisanalysis, on the basis of prior studies that have demonstratedsome evidence of genetic differential susceptibility, we se-lected a fairly comprehensive set of 12 genetic markersfrom 59 single nucleotide polymorphisms (SNPs) and 4 vari-able number tandem repeats (VNTRs) currently available onthe SECCYD. See Table 2 for details regarding the specificmarkers examined in this study as well as the proposedrisk/plasticity alleles based on prior findings. See also imme-diately below, where higher values were assigned to hypoth-esized risk/plasticity variants of the markers examined. With
little data available with regard to functional differences be-tween additive versus dominant specifications of our geneticmarkers, our genetic codings were informed by the extant lit-erature. When codings varied across studies, we adopted themost common coding and/or the most substantively or em-pirically plausible specification. When too few theoreticalor empirical data were available, we erred on the side of addi-tive codings. Frequency distributions for the DRD2 andCOMT SNP did not depart significantly from the Hardy–Weinberg equilibrium (HWE). However, the remaining did:BDNF rs6265, x2 ¼ 5.33, p , .05; TPH1 rs1800532, x2 ¼
19.50, p , .001; HTR2A rs6818, x2 ¼ 9.95, p , .01;OPRM1 rs1799971, x2 ¼ 23.59, p , .001; CRHR1rs242924, x2 ¼ 12.97, p , 001; and CRHR1 rs7209436,x2 ¼ 19.82, p , .001. We conducted similar analyses forthe VNTRs, using exact tests estimated using Markov chains(GENEPOP 4.2; Raymond & Rousset, 1995). All tests wereconducted with the same allele codings as those used in thesubstantive analyses (e.g., DRD4 ¼ 7-repeat allele vs. anyother allele). HWE tests for the MAOA marker were con-ducted only for females. Three VNTRs showed statisticallysignificant deviations from HWE, DRD4 ( p , .01), DAT1( p ¼ .03), and MAO ( p ¼ .002). The 5-HTT VNTR didnot deviate from HWE.
Deviation from HWE can reflect population admixturesand other substantive explanations (e.g., nonrandom matingor protective allele) that are not accounted for in our analyses(Hartl & Clark, 1989). However, it could also reflect potentialgenotyping errors. As an attempt to empirically evaluate po-tential genotyping errors, we conducted reliability analysesfor both the SNPs and the VNTRs. Specifically, reliabilitywas ascertained by genotyping n ¼ 72 (�10% of full N ¼695) samples twice, with all discrepancies resolved via a thirdgenotyping. For DRD2 rs1800497 (CC ¼ 0; CT or TT [i.e.,A1 þ ] ¼ 1), 1.3% of available samples could not be geno-typed in this subsample (N ¼ 695) and 99% agreement.For COMT rs4680 (AA ¼ 0; AG ¼ 1; GG ¼ 2), 0.9% ofavailable samples could not be genotyped in this subsampleand 99% agreement. For BDNF rs6265 (GG ¼ 0; AG orAA ¼ 1 [i.e., positive for met allele]), 13.4% of availablesamples could not be genotyped and 97% agreement. ForTPH1 rs1800532 (CC ¼ 0; AC ¼ 1; AA ¼ 2), 13.7% ofavailable samples could not be genotyped in this subsampleand 92% agreement. For HTR2A rs6313 (CC ¼ 0; CT ¼ 1;TT ¼ 2), 5.3% of available samples could not be genotypedin this subsample and 97% agreement. For OPRM1rs1799971 (GG or AG¼ 0; AA¼ 1, although some findingssuggest G variant is risk/plasticity allele, see Way, Taylor, &Eisenberger, 2009), 9.2% of available samples could not begenotyped in this subsample and 97% agreement. ForCRHR1 rs242924 (GG¼ 0; GT¼ 1; TT¼ 2), 4.6% of avail-able samples could not be genotyped in this subsample and99% agreement. Finally, for CRHR1 rs7209436 (CC ¼ 0;CT ¼ 1; TT ¼ 2), 10.1% of available samples could not begenotyped in this subsample and 97% agreement. (Notethat, because BDNF rs6265, TPH1 rs1800532, HTR2A
G�E maternal sensitivity 9
rs6313, OPRM1 rs1799971, CRHR1 rs242924, and CRHR1rs7209436 were assayed during a second round of genotyp-ing, there was an additional set of cases in the N ¼ 695 sub-sample that were by that time unusable and for which geno-typing on these SNP was not attempted; n ¼ 48, 6.9%.)
To the extent possible, we genotyped each sample for thefour VNTRs twice. A third genotyping was conducted to re-solve discrepancies. However, we defaulted to the originalgenotype if a sample could not be genotyped a second timeor if we were unable to identify a single genotype for a givensample (in some cases, samples were exhausted or degradedsuch that calls on a given VNTR were no longer possible).For DRD4 VNTR (not 7 repeat carrier ¼ 0; 7 repeat carrier¼ 1), 4.7% of available samples could not be genotyped inthis subsample and 83% agreement. For 5-HTT VNTR (L/L¼ 0; S/L ¼ 1; S/S ¼ 2), 3.2% of available samples couldnot be genotyped and 80% agreement. For DAT1 VNTR(10/10 ¼ 0; 9/10 ¼ 1; 9/9 ¼ 2), 2.3% of available samplescould not be genotyped and 79% agreement. (Note that asmall number [5.5%] of individuals who did not receive finalgenotypes of 9/9, 9/10, or 10/10 [the more common DAT1genotypes] were dropped from the analysis of DAT1 andfrom the reliability data above.) For MAOA (3.5/3.5 or 4/4¼ 0; 3/3.5 or 3/5 ¼ 0.5 [females only]; 3/3 ¼ 1), 2.4% ofavailable samples could not be genotyped and p , .001,86% agreement. (As with DAT1, a small number [3%] ofindividuals who had low base rate genotypes for MAOAwere dropped from the analysis of MAOA and in the reliabil-ity data above. We also identified a small number [3.6%] ofmale participants genotyped as heterozygous for MAOA anddropped them as well due to their biological implausibilitygiven that XY males are hemizygous for MAOA.) Analysesfor MAOA were conducted within sex.
Collectively, although we cannot rule out “reliable” geno-typing errors, the prototypically reasonable reliabilities acrossboth the SNPs and VNTRs suggest that deviation from HWEis likely not a strong indicator of genotyping error in the pres-ent data. Thus, given this, as well as simulation work sug-gesting that genotyping error may reduce statistical power,but have rather minimal effects on Type 1 error (Fardo,Becker, Bertram, Tanzi, & Lange, 2009; Yong Zou & Don-ner, 2006), we felt it reasonable to conduct analyses withall markers, despite some deviations from HWE. For addi-tional details regarding extraction and genotyping, see theonline only Supplemental Materials (http://journals.cambridge.org/dpp).
Results
We first report the results of the analyses informed by theRoisman et al. (2012) approach. These are followed by resultsof analyses informed by the Widaman et al. (2012; Belskyet al., 2013) approach. With regard to the latter, we focus inmost detail on places where the two approaches yielded dif-ferent findings. We adopt this approach not because we privi-lege one approach over the other but solely in the interests
of space. Detailed results of each approach are displayed inTable 3. Finally, because of reasonable concerns raised by re-viewers of potential problems associated with analyzing amultiracial/ethnic sample, we conduct additional analysesusing only the Caucasian subsample.
Roisman et al. approach
Each row in Table 3 represents a single intercepts as outcomesmultilevel model, in which the interaction of early MaternalSensitivity� Genetic Marker predicts the time intercept ofeach outcome variable.1 For example, the first row of Table 3displays the regression of mother-reported CBCL (i.e., thetime intercept of CBCL across the 15-year period) onto theinteraction of Early Maternal Sensitivity � 5-HTT VNTR.The multilevel models were specified with random time inter-cepts and random time slopes, although only random time in-tercepts were used as criterion variables, to be consistentwith Roisman et al. (2012). The time variable was centeredat fifth grade, following Pluess and Belsky (2010) andRoisman et al. (2012).
In Table 3, we see arrayed all six of the interaction effectdiagnostics that were described in the introductory and listedin Table 1: RoS on X, PoI, PA, X2 tests, a priori model com-parisons, and crossover test. To explain these six diagnostics,we refer to the row in Table 3 in which DRD4 VNTR was themoderator and teacher-rated academic skills were the out-come. The first four columns in Table 3 give the traditionalregression estimates from the model Y ¼ b0 þ b1X þ b2Zþ b3XZ, where X ¼ early maternal sensitivity and Z ¼ sus-ceptibility gene DRD4 VNTR 7. These first four columnsshow that the interaction effect from the regression model isstatistically significant (b3 ¼ 0.71, DR2 ¼ .010 for the inter-action term XZ, and p ¼ .03).2
The second four columns give the interaction diagnostics rec-ommended by Roisman et al. (2012). For the RoS on X test, wesee that the Y–Z relationship (i.e., the relationship betweenDRD4 VNTR 7 and academic skills) is statistically significantin the range above X ¼ 1.74 (i.e., at high maternal sensitivity)and is also statistically significant in the opposite direction inthe range below X¼ –2.81 (i.e., at low maternal sensitivity). Be-cause the lower bound for the RoS on X (X¼ –2.81) falls outside
1. Only the time-intercept effects are reported here. Results of additionalanalyses of differential susceptibility for each time point of each outcomevariable are available upon request. These separate analyses involve over600 different tests of single time-point differential susceptibility; we be-lieved that interpreting these single time-point effects from such a largenumber of analyses risks capitalizing on chance.
2. We also carefully note that, after applying the Benjamini–Hochberg(1995) procedure to control Type I error across multiple tests (as recom-mended and described in detail by Roisman et al., 2012), we find that ap value of .03 is not statistically significant after holding the overall false-discovery rate at ? ¼ 0.05 across all six tests that involved the DRD4VNTR 7 gene (the subscript † denotes interaction effects that passedthe conservative Benjamini-Hochberg procedure). That is, given thatwe conducted multiple tests of the DRD4 VNTR 7 gene, the overall Type Ierror rate exceeds 0.05 in this case.
J. Belsky et al.10
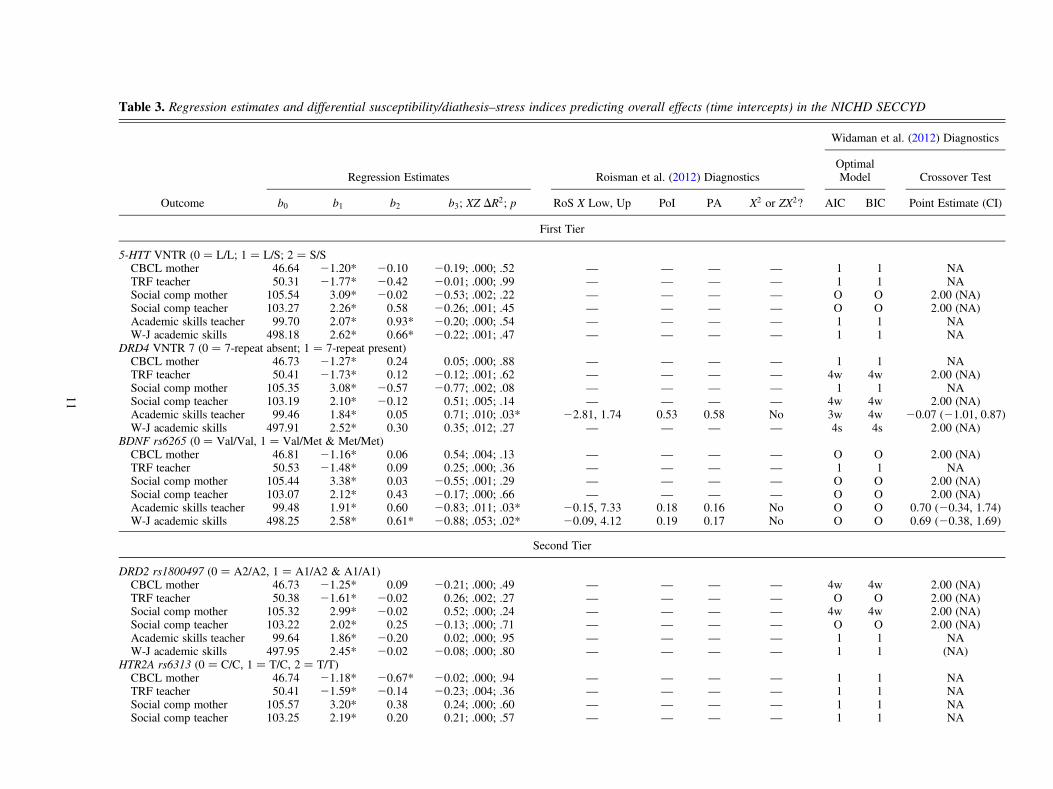
Table 3. Regression estimates and differential susceptibility/diathesis–stress indices predicting overall effects (time intercepts) in the NICHD SECCYD
Widaman et al. (2012) Diagnostics
Regression Estimates Roisman et al. (2012) DiagnosticsOptimalModel Crossover Test
Outcome b0 b1 b2 b3; XZ DR2; p RoS X Low, Up PoI PA X2 or ZX2? AIC BIC Point Estimate (CI)
First Tier
5-HTT VNTR (0 ¼ L/L; 1 ¼ L/S; 2 ¼ S/SCBCL mother 46.64 21.20* 20.10 20.19; .000; .52 — — — — 1 1 NATRF teacher 50.31 21.77* 20.42 20.01; .000; .99 — — — — 1 1 NASocial comp mother 105.54 3.09* 20.02 20.53; .002; .22 — — — — O O 2.00 (NA)Social comp teacher 103.27 2.26* 0.58 20.26; .001; .45 — — — — O O 2.00 (NA)Academic skills teacher 99.70 2.07* 0.93* 20.20; .000; .54 — — — — 1 1 NAW-J academic skills 498.18 2.62* 0.66* 20.22; .001; .47 — — — — 1 1 NA
DRD4 VNTR 7 (0 ¼ 7-repeat absent; 1 ¼ 7-repeat present)CBCL mother 46.73 21.27* 0.24 0.05; .000; .88 — — — — 1 1 NATRF teacher 50.41 21.73* 0.12 20.12; .001; .62 — — — — 4w 4w 2.00 (NA)Social comp mother 105.35 3.08* 20.57 20.77; .002; .08 — — — — 1 1 NASocial comp teacher 103.19 2.10* 20.12 0.51; .005; .14 — — — — 4w 4w 2.00 (NA)Academic skills teacher 99.46 1.84* 0.05 0.71; .010; .03* 22.81, 1.74 0.53 0.58 No 3w 4w 20.07 (21.01, 0.87)W-J academic skills 497.91 2.52* 0.30 0.35; .012; .27 — — — — 4s 4s 2.00 (NA)
BDNF rs6265 (0 ¼ Val/Val, 1 ¼ Val/Met & Met/Met)CBCL mother 46.81 21.16* 0.06 0.54; .004; .13 — — — — O O 2.00 (NA)TRF teacher 50.53 21.48* 0.09 0.25; .000; .36 — — — — 1 1 NASocial comp mother 105.44 3.38* 0.03 20.55; .001; .29 — — — — O O 2.00 (NA)Social comp teacher 103.07 2.12* 0.43 20.17; .000; .66 — — — — O O 2.00 (NA)Academic skills teacher 99.48 1.91* 0.60 20.83; .011; .03* 20.15, 7.33 0.18 0.16 No O O 0.70 (20.34, 1.74)W-J academic skills 498.25 2.58* 0.61* 20.88; .053; .02* 20.09, 4.12 0.19 0.17 No O O 0.69 (20.38, 1.69)
Second Tier
DRD2 rs1800497 (0 ¼ A2/A2, 1 ¼ A1/A2 & A1/A1)CBCL mother 46.73 21.25* 0.09 20.21; .000; .49 — — — — 4w 4w 2.00 (NA)TRF teacher 50.38 21.61* 20.02 0.26; .002; .27 — — — — O O 2.00 (NA)Social comp mother 105.32 2.99* 20.02 0.52; .000; .24 — — — — 4w 4w 2.00 (NA)Social comp teacher 103.22 2.02* 0.25 20.13; .000; .71 — — — — O O 2.00 (NA)Academic skills teacher 99.64 1.86* 20.20 0.02; .000; .95 — — — — 1 1 NAW-J academic skills 497.95 2.45* 20.02 20.08; .000; .80 — — — — 1 1 (NA)
HTR2A rs6313 (0 ¼ C/C, 1 ¼ T/C, 2 ¼ T/T)CBCL mother 46.74 21.18* 20.67* 20.02; .000; .94 — — — — 1 1 NATRF teacher 50.41 21.59* 20.14 20.23; .004; .36 — — — — 1 1 NASocial comp mother 105.57 3.20* 0.38 0.24; .000; .60 — — — — 1 1 NASocial comp teacher 103.25 2.19* 0.20 0.21; .000; .57 — — — — 1 1 NA
11
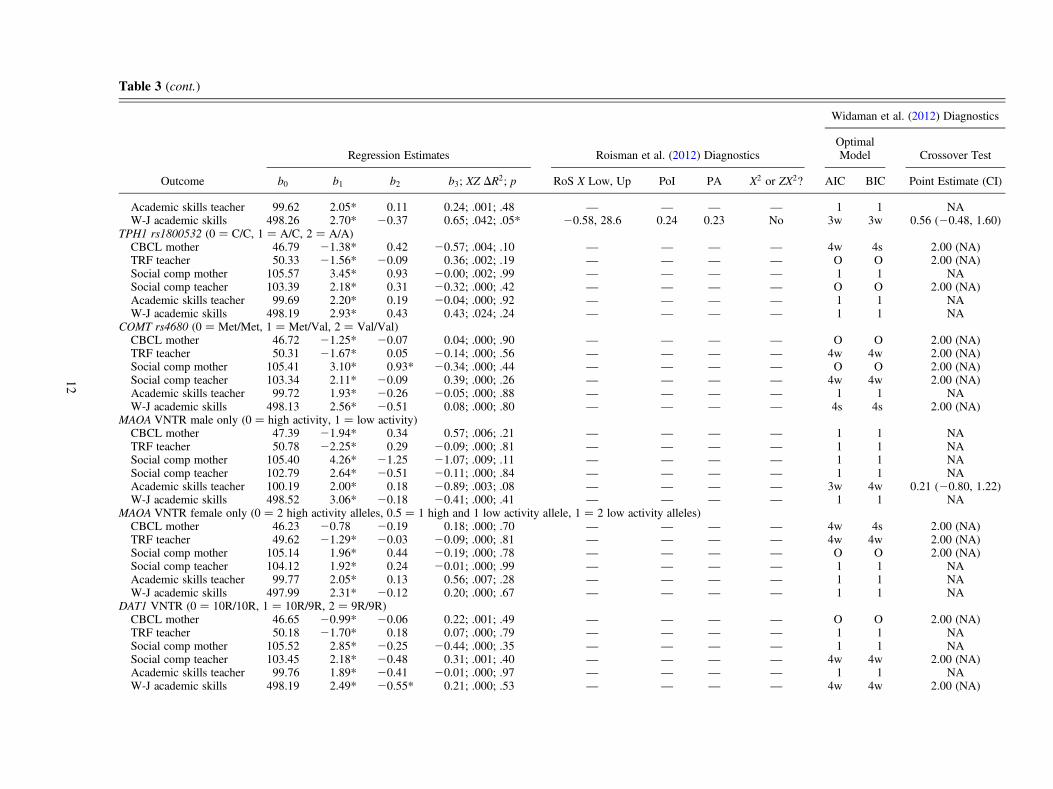
Table 3 (cont.)
Widaman et al. (2012) Diagnostics
Regression Estimates Roisman et al. (2012) DiagnosticsOptimalModel Crossover Test
Outcome b0 b1 b2 b3; XZ DR2; p RoS X Low, Up PoI PA X2 or ZX2? AIC BIC Point Estimate (CI)
Academic skills teacher 99.62 2.05* 0.11 0.24; .001; .48 — — — — 1 1 NAW-J academic skills 498.26 2.70* 20.37 0.65; .042; .05* 20.58, 28.6 0.24 0.23 No 3w 3w 0.56 (20.48, 1.60)
TPH1 rs1800532 (0 ¼ C/C, 1 ¼ A/C, 2 ¼ A/A)CBCL mother 46.79 21.38* 0.42 20.57; .004; .10 — — — — 4w 4s 2.00 (NA)TRF teacher 50.33 21.56* 20.09 0.36; .002; .19 — — — — O O 2.00 (NA)Social comp mother 105.57 3.45* 0.93 20.00; .002; .99 — — — — 1 1 NASocial comp teacher 103.39 2.18* 0.31 20.32; .000; .42 — — — — O O 2.00 (NA)Academic skills teacher 99.69 2.20* 0.19 20.04; .000; .92 — — — — 1 1 NAW-J academic skills 498.19 2.93* 0.43 0.43; .024; .24 — — — — 1 1 NA
COMT rs4680 (0 ¼ Met/Met, 1 ¼ Met/Val, 2 ¼ Val/Val)CBCL mother 46.72 21.25* 20.07 0.04; .000; .90 — — — — O O 2.00 (NA)TRF teacher 50.31 21.67* 0.05 20.14; .000; .56 — — — — 4w 4w 2.00 (NA)Social comp mother 105.41 3.10* 0.93* 20.34; .000; .44 — — — — O O 2.00 (NA)Social comp teacher 103.34 2.11* 20.09 0.39; .000; .26 — — — — 4w 4w 2.00 (NA)Academic skills teacher 99.72 1.93* 20.26 20.05; .000; .88 — — — — 1 1 NAW-J academic skills 498.13 2.56* 20.51 0.08; .000; .80 — — — — 4s 4s 2.00 (NA)
MAOA VNTR male only (0 ¼ high activity, 1 ¼ low activity)CBCL mother 47.39 21.94* 0.34 0.57; .006; .21 — — — — 1 1 NATRF teacher 50.78 22.25* 0.29 20.09; .000; .81 — — — — 1 1 NASocial comp mother 105.40 4.26* 21.25 21.07; .009; .11 — — — — 1 1 NASocial comp teacher 102.79 2.64* 20.51 20.11; .000; .84 — — — — 1 1 NAAcademic skills teacher 100.19 2.00* 0.18 20.89; .003; .08 — — — — 3w 4w 0.21 (20.80, 1.22)W-J academic skills 498.52 3.06* 20.18 20.41; .000; .41 — — — — 1 1 NA
MAOA VNTR female only (0 ¼ 2 high activity alleles, 0.5 ¼ 1 high and 1 low activity allele, 1 ¼ 2 low activity alleles)CBCL mother 46.23 20.78 20.19 0.18; .000; .70 — — — — 4w 4s 2.00 (NA)TRF teacher 49.62 21.29* 20.03 20.09; .000; .81 — — — — 4w 4w 2.00 (NA)Social comp mother 105.14 1.96* 0.44 20.19; .000; .78 — — — — O O 2.00 (NA)Social comp teacher 104.12 1.92* 0.24 20.01; .000; .99 — — — — 1 1 NAAcademic skills teacher 99.77 2.05* 0.13 0.56; .007; .28 — — — — 1 1 NAW-J academic skills 497.99 2.31* 20.12 0.20; .000; .67 — — — — 1 1 NA
DAT1 VNTR (0 ¼ 10R/10R, 1 ¼ 10R/9R, 2 ¼ 9R/9R)CBCL mother 46.65 20.99* 20.06 0.22; .001; .49 — — — — O O 2.00 (NA)TRF teacher 50.18 21.70* 0.18 0.07; .000; .79 — — — — 1 1 NASocial comp mother 105.52 2.85* 20.25 20.44; .000; .35 — — — — 1 1 NASocial comp teacher 103.45 2.18* 20.48 0.31; .001; .40 — — — — 4w 4w 2.00 (NA)Academic skills teacher 99.76 1.89* 20.41 20.01; .000; .97 — — — — 1 1 NAW-J academic skills 498.19 2.49* 20.55* 0.21; .000; .53 — — — — 4w 4w 2.00 (NA)
12
Third Tier
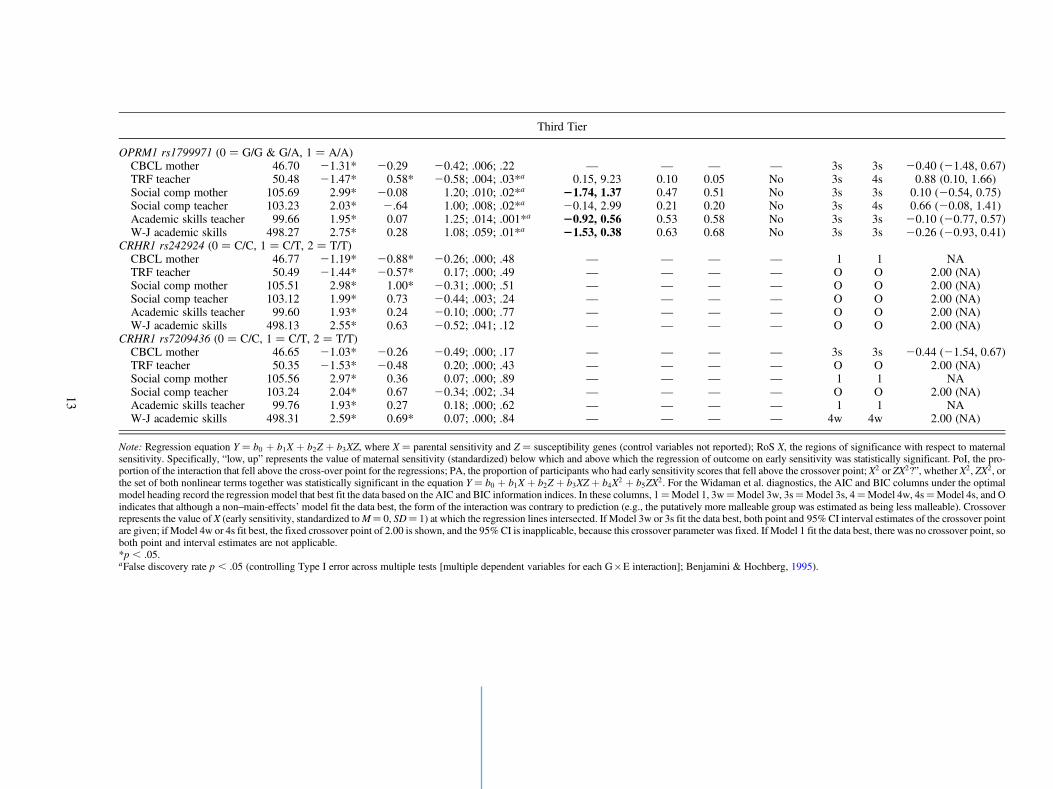
OPRM1 rs1799971 (0 ¼ G/G & G/A, 1 ¼ A/A)CBCL mother 46.70 21.31* 20.29 20.42; .006; .22 — — — — 3s 3s 20.40 (21.48, 0.67)TRF teacher 50.48 21.47* 0.58* 20.58; .004; .03*a 0.15, 9.23 0.10 0.05 No 3s 4s 0.88 (0.10, 1.66)Social comp mother 105.69 2.99* 20.08 1.20; .010; .02*a 21.74, 1.37 0.47 0.51 No 3s 3s 0.10 (20.54, 0.75)Social comp teacher 103.23 2.03* 2.64 1.00; .008; .02*a 20.14, 2.99 0.21 0.20 No 3s 4s 0.66 (20.08, 1.41)Academic skills teacher 99.66 1.95* 0.07 1.25; .014; .001*a 20.92, 0.56 0.53 0.58 No 3s 3s 20.10 (20.77, 0.57)W-J academic skills 498.27 2.75* 0.28 1.08; .059; .01*a 21.53, 0.38 0.63 0.68 No 3s 3s 20.26 (20.93, 0.41)
CRHR1 rs242924 (0 ¼ C/C, 1 ¼ C/T, 2 ¼ T/T)CBCL mother 46.77 21.19* 20.88* 20.26; .000; .48 — — — — 1 1 NATRF teacher 50.49 21.44* 20.57* 0.17; .000; .49 — — — — O O 2.00 (NA)Social comp mother 105.51 2.98* 1.00* 20.31; .000; .51 — — — — O O 2.00 (NA)Social comp teacher 103.12 1.99* 0.73 20.44; .003; .24 — — — — O O 2.00 (NA)Academic skills teacher 99.60 1.93* 0.24 20.10; .000; .77 — — — — O O 2.00 (NA)W-J academic skills 498.13 2.55* 0.63 20.52; .041; .12 — — — — O O 2.00 (NA)
CRHR1 rs7209436 (0 ¼ C/C, 1 ¼ C/T, 2 ¼ T/T)CBCL mother 46.65 21.03* 20.26 20.49; .000; .17 — — — — 3s 3s 20.44 (21.54, 0.67)TRF teacher 50.35 21.53* 20.48 0.20; .000; .43 — — — — O O 2.00 (NA)Social comp mother 105.56 2.97* 0.36 0.07; .000; .89 — — — — 1 1 NASocial comp teacher 103.24 2.04* 0.67 20.34; .002; .34 — — — — O O 2.00 (NA)Academic skills teacher 99.76 1.93* 0.27 0.18; .000; .62 — — — — 1 1 NAW-J academic skills 498.31 2.59* 0.69* 0.07; .000; .84 — — — — 4w 4w 2.00 (NA)
Note: Regression equation Y ¼ b0 þ b1X þ b2Z þ b3XZ, where X ¼ parental sensitivity and Z ¼ susceptibility genes (control variables not reported); RoS X, the regions of significance with respect to maternalsensitivity. Specifically, “low, up” represents the value of maternal sensitivity (standardized) below which and above which the regression of outcome on early sensitivity was statistically significant. PoI, the pro-portion of the interaction that fell above the cross-over point for the regressions; PA, the proportion of participants who had early sensitivity scores that fell above the crossover point; X2 or ZX2?”, whether X2, ZX2, orthe set of both nonlinear terms together was statistically significant in the equation Y ¼ b0 þ b1X þ b2Z þ b3XZ þ b4X2 þ b5ZX2. For the Widaman et al. diagnostics, the AIC and BIC columns under the optimalmodel heading record the regression model that best fit the data based on the AIC and BIC information indices. In these columns, 1¼Model 1, 3w¼Model 3w, 3s¼Model 3s, 4¼Model 4w, 4s¼Model 4s, and Oindicates that although a non–main-effects’ model fit the data best, the form of the interaction was contrary to prediction (e.g., the putatively more malleable group was estimated as being less malleable). Crossoverrepresents the value of X (early sensitivity, standardized to M¼ 0, SD¼ 1) at which the regression lines intersected. If Model 3w or 3s fit the data best, both point and 95% CI interval estimates of the crossover pointare given; if Model 4w or 4s fit best, the fixed crossover point of 2.00 is shown, and the 95% CI is inapplicable, because this crossover parameter was fixed. If Model 1 fit the data best, there was no crossover point, soboth point and interval estimates are not applicable.*p , .05.aFalse discovery rate p , .05 (controlling Type I error across multiple tests [multiple dependent variables for each G�E interaction]; Benjamini & Hochberg, 1995).
13
the recommended range of +2 SD from the mean of X, the RoSon X test fails to support either diathesis–stressor differential sus-ceptibility. The next two Roisman et al. (2012) diagnostics arethe PoI and the PA the crossover. To support differential suscep-tibility, the PoI should be near 0.50 (ideally, PoI between 40%and 60%), and the PA index should be greater than 16% (seeRoisman et al., 2012). For example, for the DRD4 VNTR 7gene moderating the effect of maternal sensitivity on teacher-rated academic skills (11th row in Table 3), PoI ¼ 0.53 andPA¼ 0.58. Thus, the PoI and the PA diagnostics both offer sup-port for differential susceptibility in this case. Finally, for thenonlinearity diagnostic, we note that neither X2, ZX2, nor thecombination of both X2 and ZX2 is statistically significant;thus this DRD4 VNTR 7�Maternal Sensitivity interaction effectpasses the nonlinearity test for inferring differential susceptibil-ity. Overall, then, the form of the DRD4 VNTR 7�MaternalSensitivity interaction effect survives three of Roisman et al.’s(2012) four diagnostics, but it fails the RoS on X test. Therefore,the Roisman et al. procedure yields the conclusion that differen-tial susceptibility is not supported in the case of DRD4 VNTR 7.
Careful consideration of the many Roisman et al. (2012)differential susceptibility tests reported in Table 3 revealsthat few interaction effects meet the Roisman et al. criteriafor differential susceptibility. First, we consider the three ap-parent interaction effects involving BDNF and HTR2A, as allthree of these show the same pattern. That is, for the two in-teraction effects for the BDNF rs6265 gene (teacher-ratedacademic skills, and Woodcock–Johnson academic skills)and the one apparent interaction effect for the HTR2Ars6313 gene (Woodcock–Johnson academic skills), all threeapparent interaction effects commonly fail the Benjamini–Hochberg (1995) procedure for Type I error control; fail theRoS on X test because the Y–Z relationship only becomes sta-tistically significant at a value of X far above 2.0 SD above themean of X (X ¼ 7.33, 4.12, and 28.6, respectively); fail thePoI test that PoI should be near to 0.50 (PoI ¼ 0.18, 0.19,and 0.24, respectively); pass the PA test, which requiresthat the percentage of the sample above the crossover pointshould be at or greater than 16% (% above ¼ 16%, 17%,and 23%, respectively); and pass the nonlinearity test.
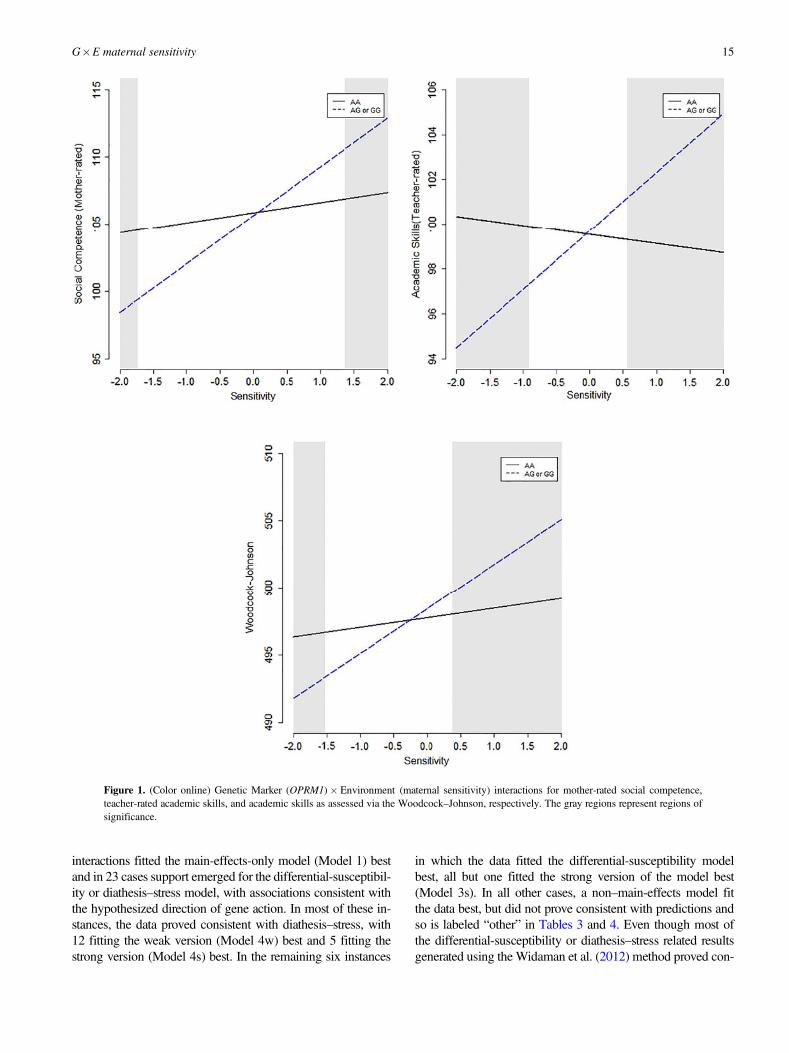
Second, and perhaps more promising, one genotype of aparticular marker, OPRM1 rs1799971 AA þ, seems to pro-vide more support for a G�E interaction consistent with dif-ferential susceptibility. Specifically, five of six interactioneffects involving OPRM1 rs1799971 AAþ and maternal sen-sitivity survive the Benjamini–Hochberg procedure, whichcontrols for overall Type I Error (see Table 3). Of these fivestatistically–significant interaction effects: three pass theRoS on X test (mother-rated social competence, teacher-ratedacademic skills, and Woodcock–Johnson academic skills);four pass the PoI test and the PA test (only TRF teacher failseither of these two tests, because PoI¼ 0.10 and PA¼ 0.05);and all five pass the nonlinearity test. In brief, three interac-tion effects prove consistent with differential susceptibility(i.e., a true disordinal interaction), according to the Roismanet al. (2012) diagnostics. These three differential susceptibil-
ity effects are the OPRM1�Maternal Sensitivity interactioneffects on mother-rated social competence, teacher-rated aca-demic skills, and Woodcock–Johnson academic skills. Thesethree differential susceptibility effects are plotted in Figure 1.Of note, in each of these three cases simple slopes analyses(i.e., RoS on Z tests) revealed that the association betweenthe outcome and maternal sensitivity was positive and statis-tically significant in the hypothesized susceptible group (AAþ, n¼ 455), but not in the comparison group (AG or GG, n¼128). Specifically, the association between social compe-tence (mother rated) and maternal sensitivity was statisticallysignificant in the AA group (b ¼ 3.62, p , .001), but not inthe AGjGG group (b ¼ 0.75, p ¼ .522). The association be-tween academic skills and maternal sensitivity was statisti-cally significant among those in the AA group (b ¼ 3.33,p , .001), but not among those in the AGjGG group (b ¼0.71, p ¼ .391). The association between academic skills(teacher rated) and maternal sensitivity was statistically sig-nificant in the AA group (b¼ 2.61, p , .001), but not amongthose in the AG or GG group (b ¼ –0.42, p ¼ .631).
The Widaman et al. approach
Next, we applied the Widaman et al. (2012) criteria for G�Einteraction data, the results of which are also displayed in Ta-ble 3. When inspecting these results, the following needs tobe kept in mind regarding the signs of regression weights:the main (or lower order) effect of maternal sensitivity isshown in the b1 column in Table 3. The sign of the b1 regres-sion weight should be negative for the negative outcomes ofproblem behavior rated by mother (CBCL mother) andteacher (TRF teacher), but it should be positive for the re-maining four outcome variables if higher levels of maternalsensitivity are associated with more competent functioning.Thus, higher levels of maternal sensitivity should be associ-ated with lower levels of problem behavior, but higher levelsof social competence and academic skills. Furthermore, eachof the genetic moderators were coded exactly as in the Rois-man et al. (2012) approach, with higher numbers representingthe hypothesized plasticity gene (see Table 2). Given thismethod of coding, the regression weight for the G�E inter-action, shown in the b3 column, should be negative for thetwo negative outcomes (problem behavior rated by motherand teacher) and positive for the remaining four outcomevariables. That is, persons with more risk/plasticity allelesshould exhibit a steeper negative slope as a function of ma-ternal sensitivity for the negative outcome variables, but astronger positive slope for the four positive outcomes. If re-sults for a particular G�E interaction are the reverse of thepredicted direction, this is regarded as a failure to confirm ei-ther the strong or weak diathesis–stress or differential-suscep-tibility hypotheses, given that these deal not only with thecrossover point but also with the anticipated nature of the re-lation between predictor and outcome measure.
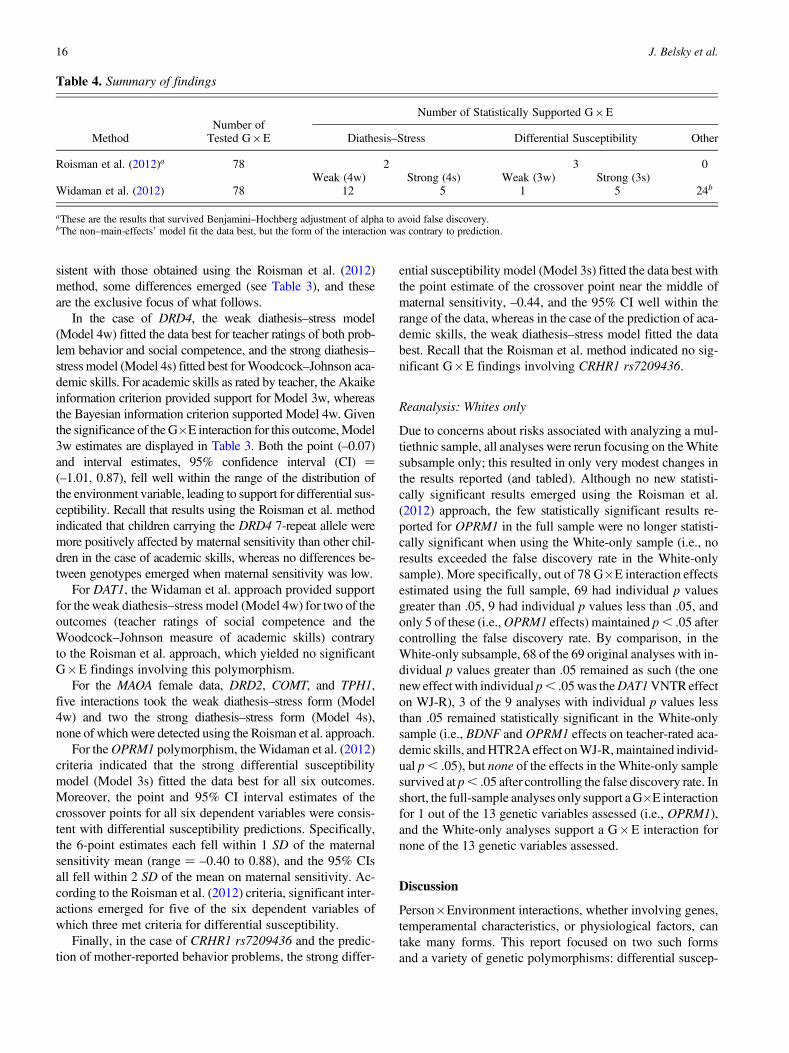
Table 4 presents an overall summary of the findings. Apply-ing the Widaman et al. approach, 31 of the 78 investigated G�E
J. Belsky et al.14
interactions fitted the main-effects-only model (Model 1) bestand in 23 cases support emerged for the differential-susceptibil-ity or diathesis–stress model, with associations consistent withthe hypothesized direction of gene action. In most of these in-stances, the data proved consistent with diathesis–stress, with12 fitting the weak version (Model 4w) best and 5 fitting thestrong version (Model 4s) best. In the remaining six instances
in which the data fitted the differential-susceptibility modelbest, all but one fitted the strong version of the model best(Model 3s). In all other cases, a non–main-effects model fitthe data best, but did not prove consistent with predictions andso is labeled “other” in Tables 3 and 4. Even though most ofthe differential-susceptibility or diathesis–stress related resultsgenerated using the Widaman et al. (2012) method proved con-
Figure 1. (Color online) Genetic Marker (OPRM1)� Environment (maternal sensitivity) interactions for mother-rated social competence,teacher-rated academic skills, and academic skills as assessed via the Woodcock–Johnson, respectively. The gray regions represent regions ofsignificance.
G�E maternal sensitivity 15
sistent with those obtained using the Roisman et al. (2012)method, some differences emerged (see Table 3), and theseare the exclusive focus of what follows.
In the case of DRD4, the weak diathesis–stress model(Model 4w) fitted the data best for teacher ratings of both prob-lem behavior and social competence, and the strong diathesis–stress model (Model 4s) fitted best for Woodcock–Johnson aca-demic skills. For academic skills as rated by teacher, the Akaikeinformation criterion provided support for Model 3w, whereasthe Bayesian information criterion supported Model 4w. Giventhe significance of the G�E interaction for this outcome, Model3w estimates are displayed in Table 3. Both the point (–0.07)and interval estimates, 95% confidence interval (CI) ¼(–1.01, 0.87), fell well within the range of the distribution ofthe environment variable, leading to support for differential sus-ceptibility. Recall that results using the Roisman et al. methodindicated that children carrying the DRD4 7-repeat allele weremore positively affected by maternal sensitivity than other chil-dren in the case of academic skills, whereas no differences be-tween genotypes emerged when maternal sensitivity was low.
For DAT1, the Widaman et al. approach provided supportfor the weak diathesis–stress model (Model 4w) for two of theoutcomes (teacher ratings of social competence and theWoodcock–Johnson measure of academic skills) contraryto the Roisman et al. approach, which yielded no significantG�E findings involving this polymorphism.
For the MAOA female data, DRD2, COMT, and TPH1,five interactions took the weak diathesis–stress form (Model4w) and two the strong diathesis–stress form (Model 4s),none of which were detected using the Roisman et al. approach.
For the OPRM1 polymorphism, the Widaman et al. (2012)criteria indicated that the strong differential susceptibilitymodel (Model 3s) fitted the data best for all six outcomes.Moreover, the point and 95% CI interval estimates of thecrossover points for all six dependent variables were consis-tent with differential susceptibility predictions. Specifically,the 6-point estimates each fell within 1 SD of the maternalsensitivity mean (range ¼ –0.40 to 0.88), and the 95% CIsall fell within 2 SD of the mean on maternal sensitivity. Ac-cording to the Roisman et al. (2012) criteria, significant inter-actions emerged for five of the six dependent variables ofwhich three met criteria for differential susceptibility.
Finally, in the case of CRHR1 rs7209436 and the predic-tion of mother-reported behavior problems, the strong differ-
ential susceptibility model (Model 3s) fitted the data best withthe point estimate of the crossover point near the middle ofmaternal sensitivity, –0.44, and the 95% CI well within therange of the data, whereas in the case of the prediction of aca-demic skills, the weak diathesis–stress model fitted the databest. Recall that the Roisman et al. method indicated no sig-nificant G�E findings involving CRHR1 rs7209436.
Reanalysis: Whites only
Due to concerns about risks associated with analyzing a mul-tiethnic sample, all analyses were rerun focusing on the Whitesubsample only; this resulted in only very modest changes inthe results reported (and tabled). Although no new statisti-cally significant results emerged using the Roisman et al.(2012) approach, the few statistically significant results re-ported for OPRM1 in the full sample were no longer statisti-cally significant when using the White-only sample (i.e., noresults exceeded the false discovery rate in the White-onlysample). More specifically, out of 78 G�E interaction effectsestimated using the full sample, 69 had individual p valuesgreater than .05, 9 had individual p values less than .05, andonly 5 of these (i.e., OPRM1 effects) maintained p , .05 aftercontrolling the false discovery rate. By comparison, in theWhite-only subsample, 68 of the 69 original analyses with in-dividual p values greater than .05 remained as such (the onenew effect with individual p , .05 was the DAT1 VNTR effecton WJ-R), 3 of the 9 analyses with individual p values lessthan .05 remained statistically significant in the White-onlysample (i.e., BDNF and OPRM1 effects on teacher-rated aca-demic skills, and HTR2A effect on WJ-R, maintained individ-ual p , .05), but none of the effects in the White-only samplesurvived at p , .05 after controlling the false discovery rate. Inshort, the full-sample analyses only support a G�E interactionfor 1 out of the 13 genetic variables assessed (i.e., OPRM1),and the White-only analyses support a G�E interaction fornone of the 13 genetic variables assessed.
Discussion
Person�Environment interactions, whether involving genes,temperamental characteristics, or physiological factors, cantake many forms. This report focused on two such formsand a variety of genetic polymorphisms: differential suscep-
Table 4. Summary of findings
Number ofNumber of Statistically Supported G×E
Method Tested G×E Diathesis–Stress Differential Susceptibility Other
Roisman et al. (2012)a 78 2 3 0Weak (4w) Strong (4s) Weak (3w) Strong (3s)
Widaman et al. (2012) 78 12 5 1 5 24b
aThese are the results that survived Benjamini–Hochberg adjustment of alpha to avoid false discovery.bThe non–main-effects’ model fit the data best, but the form of the interaction was contrary to prediction.
J. Belsky et al.16
tibility, in which individuals carrying certain alleles provemore susceptible to both beneficial and adverse effects ofsupportive and risky environments, respectively; and diathe-sis–stress (or dual-risk), in which individuals carrying certainalleles prove more vulnerable to contextual adversity than doothers. Here we sought to determine whether, and perhapshow, early maternal sensitivity/ insensitivity from 6 to 36months of age interacted with each of a variety of candidategenes in predicting children’s social, behavioral, and aca-demic functioning through midadolescence.
This research is distinguished by its sample, the NICHDSECCYD. The relatively large NICHD SECCYD cohort,which was genotyped when participants were at age 15, hasa number of strengths, including the genotyping of 12 puta-tive plasticity genes (SNPs and VNTRs), structured in threetiers according to their evidentiary basis in the literature(see Table 2); the environmental factor of early maternal sen-sitivity, which is the most consistent predictor of children’sfunctioning in the SECCYD (Belsky et al., 2007; Fraleyet al., 2013) and other investigations (e.g., Jaafari-Bimmelet al., 2006; Sroufe et al., 2005); six outcome assessmentsfrom multiple domains involving multiple informants; andoutcomes assessed over multiple developmental assessments.Having noted these strengths, we would be remiss if we didnot emphasize that, although larger than most of the studieson which the selection of the polymorphisms that were the fo-cus of this report were based, the SECCYD is insufficientlylarge for estimating G�E effects that are modest in magni-tude. For example, Duncan and Keller (2011) contend thatto estimate a large effect size for a single G�E interaction re-quires a sample of at least 600 subjects.
This research is also distinguished by its omnibus presen-tation of study results: specifically, 12 candidate genepolymorphisms interacting with early maternal sensitivityin the prediction of six repeatedly measured outcomes. Weadopted this approach because questions have been raisedabout the confidence that can be placed in many reportedfindings across the sciences, including G�E interactions inthe psychological sciences, the focus of this report. Alongwith many isolated effects of various SNPs and VNTRs ona host of psychological phenotypes, whether as main effectsor in interaction with environmental factors, there have beennumerous failures to replicate and evidence of false positives(Chabris et al., 2012; Charney & English, 2012; Deary,2012). This has raised concerns that selective reporting ofpositive findings characterizes much of the published litera-ture. The advantage of the omnibus approach is that it pro-vides a bird’s-eye view of a totality of possible G�E effectsacross a broad range of polymorphisms and outcomes using astrong, well-understood data set. The weakness, some mightargue, is that such an omnibus approach may not be basedon biologically plausible mechanisms by which particulargenes come to influence particular phenotypes in interactionwith particular environmental exposures. In addition, by fo-cusing upon so many genes and so many dependent variables,adjustments for chance findings raises the bar for detecting
significant effects, although interactions in uncorrected anal-yses were also generally nonsignificant.
A further distinguishing characteristic of this research is itsanalytic approach, which consists of two independently de-veloped techniques designed to distinguish evidence for dif-ferential susceptibility from that of diathesis–stress (Roismanet al., 2012; Widaman et al., 2012). The need for new analytictechniques to evaluate evidence of differential susceptibilityand diathesis–stress reflects the rapid influence these ideashave had on contemporary developmental science (e.g.,Belsky & Pluess, 2009; Ellis et al., 2011). Originally, evi-dence for endogenous factors indicative of differential sus-ceptibility was based on simple visual displays of data(Belsky, 2005); later, more formal criteria were establishedfor assessing the presence of crossover interactions and therelative significance of simple slopes involved in interactions(Belsky et al., 2007; Kochanska et al., 2011).
The present analysis reflects further evolution in the assess-ment of differential susceptibility and diathesis–stress via theRoisman et al. (2012) and Widaman et al. (2012; Belsky et al.,2013) techniques. Recall that Roisman et al. (2012) requiresfour criteria to be met for a determination of differential sus-ceptibility: significant interaction terms using appropriateType I error control; a RoI test demonstrating that outcomesand moderators (i.e., genetic polymorphisms) are related,with opposite signs (i.e., for better and for worse) at low andhigh values (i.e., within +2 SD) of the environmental factor(i.e., maternal sensitivity); a substantial PoI (e.g., 40%–60%) and a substantial proportion of individuals (e.g., 16%or more) lying above the interaction crossover point; and thediscounting of nonlinearities. Recall, too, that the Widamanet al. (2012; Belsky et al., 2013) approach does not require astatistically significant interaction before further evaluatingthe nature of an interaction. Instead, it assesses the best fittingregression model that is reparameterized to highlight the inter-action crossover point and its 95% confidence interval. Differ-ential susceptibility is supported when the crossover occursnear the midpoint of the environmental predictor; diathesis–stress when the crossover point is at a high value of the predic-tor. The width of the confidence interval together with theplacement of the crossover point affords insight into whetherstrong (typically small CI) or weak (typically large CI) formsof differential susceptibility or diathesis–stress are supported.The crossover point is freely modeled or set fixed to a highvalue of X, and fit indices indicate whether data accord bestwith models suggesting no interaction, or strong or weakforms of differential susceptibility or diathesis–stress.
When we applied these two methods to the SECCYD data,we found that most of the G�E interactions were weak orclose to zero. Whereas maternal sensitivity proved again tobe a consistent predictor of child functioning across the pri-mary-school years, candidate polymorphisms did not showmany main effects, nor did they tend to amplify or attenuatethe predictive significance of maternal sensitivity/insensitiv-ity. Only three interactions met the Roisman et al. (2012) cri-teria for differential susceptibility, all involving the third-tier
G�E maternal sensitivity 17
genetic marker OPRM1; and when analyses were restricted toonly Whites, none of the previously detected effects survivedat p , .05 after controlling the false discovery rate. In short,the full-sample analyses only support a G�E interaction for 1out of the 13 genetic variables (12 markers but with theMAOA VNTR examined by sex) assessed (i.e., OPRM1),and the White-only analyses support a G�E interaction fornone of the 13 genetic variables assessed.
Although there were more interactions supporting differ-ential susceptibility using the Widaman et al. (2012) tech-nique, there were also more in which the diathesis–stressmodel proved the best fitting model. Many of the best fittingWidaman et al. (2012) models supported weak versions ofdiathesis–stress or differential susceptibility. Moreover, oneinteraction, involving maternal sensitivity, DRD4 VNTRand teacher-rated academic skills, took the form of vantagesensitivity (Pluess & Belsky, 2012), reflecting that one geneticsubgroup proved disproportionately likely to benefit fromsupportive rearing while not being disproportionately suscep-tible to the adverse effects of maternal insensitivity. However,this same interaction did not survive controls for Type 1error when using the Roisman et al. (2012) approach. Theconsistent message across techniques and alternative samples,then, is that there are relatively few measured Gene�EarlyMaternal Sensitivity interactions in the NICHD SECCYD.Although acknowledgement of this result is important, it isequally important that the generally null G�E results reportedhere not be overgeneralized to other samples, other predictors,other outcomes, and other candidate genes.
What are other implications of these findings? One lessonmay be to not privilege genetic variation over other endogenouscharacteristics when seeking to identify plasticity, or vulner-ability, factors in development (Belsky & Pluess, 2013; Kuo,1967). When the focus has been on early negative emotional-ity/difficult temperament as the moderating plasticity or riskfactor, consistent interactions reflecting both differential sus-ceptibility and diathesis–stress have emerged using SECCYDdata (Belsky & Pluess, 2010, 2012; Roisman et al., 2012). Isis perhaps also notable that other SECCYD studies have de-tected evidence of G�E interaction (Belsky & Pluess, 2013),although admittedly not using the new analytic approaches em-ployed in the research reported herein. In sum, reflecting thelarger scholarly literature, there are relatively fewearly Sensitiv-ity�Gene interactions within the SECCYD. This does not pre-clude the possibility that plasticityand risk factors manifested inother forms may interact with maternal sensitivity to influenceoutcomes of developmental significance.
OPRM1 rs1799971 was an exception to the general lack ofGene � Early Maternal Sensitivity findings in this report.OPRM1, which is a polymorphism of the mu-opioid receptorgene, was listed as a third-tier SNP in Table 2 yet provided thestrongest evidence for differential susceptibility. Accordingto the Widaman et al. (2012) analysis, the strong form of dif-ferential susceptibility was the best fitting model across fourof six outcomes. According to the Roisman et al. (2012) anal-ysis, differential susceptibility was suggested on three of six
outcomes: mother-rated social competence and academicskills (teacher-rated and Woodcock–Johnson performance),with diathesis–stress supported for teacher-rated problemsymptomology and social competence. What the Roismanet al. (2012) procedure found to be closer to diathesis–stresswas inconsistently classified in Widaman et al. (2012) asstrongly fitting differential susceptibility using the Akaike in-formation criterion index, but strongly fitting diathesis–stressusing the Bayesian information criterion index.
The findings regarding OPRM1 are intriguing, but thereare reasons to be cautious about interpreting even these lim-ited G�E effects. The third-tier status of OPRM1 reflects theabsence of a substantial knowledge base on this SNP (Tro-isi et al., 2010, 2012; Way et al., 2009). It is also of concernthat the genetic subgroup that proves more susceptible to envi-ronmental variation is inconsistent across the few relevantG� E studies dealing with OPRM1-A/A carriers here andin one other report (Troisi et al., 2012), but carriers of theG allele in another (Way et al., 2009). Moreover, the Roismanet al. (2012) technique only controls for Type I error withinbut not across polymorphisms, which raises the possibilitythat our OPRM1 results reflect chance findings resulting fromconducting analyses on 12 different polymorphisms. Of course,even the detected G � E interactions involving OPRM1proved nonsignificant when the sample was restricted toWhites only and the false-discovery rate was controlled.
The aggregation of outcome variables over time in an in-tercepts as outcomes approach could be seen as a limitationof this study (Roisman et al., 2012) because reported analysesare not sensitive to developmental differences in the strengthof G�E interactions. Notable in this regard is that Belsky andPluess (2013) found that Gene�Childcare Quality interac-tions on caregiver-reported externalizing problems andteacher-reported social skills were evident at school entrybut dissipated thereafter in a linear fashion. Might similar re-sults have emerged had we set the intercept to earlier ages orassessed developmental trends as Belsky and Pluess (2013)did? As it turns out, preliminary analyses on the data includedin the current report using the Roisman et al. (2012) techniquefailed to provide support for this possibility (see footnote 1).
Perhaps the most significant limitation of this study is thecandidate-gene approach itself. The use of candidate geneshas the advantage, relative to behavioral-genetic designs, of ac-tually measuring the biological substance of DNA. At theirheart, though, both designs share the same problem: limitedability to speak to biological mechanisms (Plomin et al.,2013). A priori predictions linking genetic polymorphisms todomain-specific environmental features and outcomes are diffi-cult without recourse to these explanatory mechanisms. For in-stance, what is it about DRD4, MAOA, OPRM1, or any othercandidate gene that would interact with environmental variablesin ways that are significant to long-term developmental adjust-ment? Charney and English (2012, p. 30) put the matter best:“The model of the relationship between genotype and pheno-type used in the social sciences makes scientific discovery in ge-netics appear deceptively simple: All that is required is a large
J. Belsky et al.18
data set containing relevant behavioral data and genotype dataconsisting of several polymorphisms. . . . Statistical modelingtakes care of the rest. However, the validity of these statisticalmodels depends foundationally on the validity of the geneticparadigm they presuppose.” We agree with Rutter (2009,p. 1288) that “biological plausibility” should be a central con-cern in the study of G�E processes. However, for now, the de-velopmental biology linking genetic variation to complex psy-chological phenotypes is far more conjecture than it is science.
Alternatives to candidate-gene approaches have begun ap-pearing in the literature, though the nature of the genetic para-digm they presuppose may still be evolving (Plomin, 2012).For example, polygenic approaches are being adopted inwhich candidate genes that do not yield a significant G�Einteraction on their own have been found to amplify othercandidate G� E interactions (Drury et al., 2012). Further-more, genome-wide association analyses, which use hun-dreds of thousands of SNPs, permit estimation of general her-itability among unrelated participants, as well as specificgene–outcome associations (Plomin et al., 2013).
Plomin (2012, p. 11) writes that “once genes are found theywill transform the ability of developmental research to addressquestions about developmental continuities, about psychopath-ological patterns, and about environmental risk patterns.” Therapid advance of technology that permits ever more compre-hensive analyses of genetic phenomena, together with the irre-sistible allure of studying what most believe to be the irreduci-ble element of life, our DNA, almost guarantees more and
better research on the intersection of child development andmolecular genetics. With this long-term vision, it is perhapseasier to accept that candidate-gene approaches, where effectsare small and difficult to replicate and links to biologicalmechanism are tenuous, is just a first step down a grander path.
Clearly, results from the NICHD SECCYD do not suggestthat candidate genetic markers are especially useful as endog-enous precipitants of Person� Environment interactions, atleast not involving maternal sensitivity and the 12 polymor-phisms that are the focus of the current inquiry and the depen-dent variables considered. The effects that appeared werescattered, inconclusive, or as in the case of OPRM1, unusual,and failed to survive the false-discovery rate when only theWhite subsample was the focus of analysis. Other endoge-nous factors, and more advanced assessments of geneticphenomena, may be required to better appreciate the relativeimportance of differential susceptibility and diathesis–stressin modeling key adjustment markers of childhood and youth.Until then, the clearest message from this NICHD SECCYDreport is that the benefits of sensitive mothering and the costsof insensitive mothering early in childhood are robust across avariety of potential genetic moderators.
Supplementary Materials
The supplementary materials mentioned in this article can befound online at http://journals.cambridge.org/dpp.
References
Achenbach, T. M. (1991). Manual for the Child Behavior Checklist/4–18 and1991 Profile. Burlington, VT: University of Vermont, Department ofPsychiatry.
Achenbach, T. M., & Edelbrock, C. (1986). Manual for the Teacher’s ReportForm and Teacher Version of the Child Behavior Profile. Burlington,VT: University of Vermont, Department of Psychiatry.
Achenbach, T. M., Edelbrock, C., & Howell, C. (1987). Empirically-basedassessment of the behavioral/ emotional problems of 2-3-year-old chil-dren. Journal of Abnormal Child Psychology, 15, 629–650.
Ainsworth, M. D. (1973). The development of infant–mother attachment. InB. M. Caldwell & H. N. Ricciuti (Eds.), Review of child development re-search (Vol. 3, pp. 1–94). Chicago: University of Chicago Press.
Bakermans-Kranenburg, M. J., & van IJzendoorn, M. H. (2011). Differentialsusceptibility to rearing environment depending on dopamine-relatedgenes: New evidence and a meta-analysis. Development and Psychopa-thology, 23, 39–52.
Bakermans-Kranenburg, M. J., van IJzendoorn, M. H., & Juffer, F. (2003).Less is more: Meta-analysis of sensitivity and attachment interventionsin early childhood. Psychological Bulletin, 129, 195–215.
Baumrind, D. (1967). Child-care practices anteceding three patterns of pre-school behavior. Genetic Psychology Monographs, 75, 43–88.
Baumrind, D. (1991). The influence of parenting style on adolescent compe-tence and substance use. Journal of Early Adolescence, 11, 56–95.
Belsky, J. (1997). Variation in susceptibility to environmental influences: Anevolutionary argument. Psychological Inquiry, 8, 182–186.
Belsky, J. (2005). Differential susceptibility to rearing influences: An evolu-tionary hypothesis and some evidence. In B. Ellis & D. Bjorklund (Eds.),Origins of the social mind: Evolutionary psychology and child develop-ment (pp. 139–163). New York: Guilford Press.
Belsky, J., Bakermans-Kranenburg, M. J., & van IJzendoorn, M. H.(2007). For better and for worse: Differential susceptibility to environ-mental influence. Current Directions in Psychological Science, 16,300–304.
Belsky, J., Jonassaint, C., Pluess, M., Stanton, M., Brummett, B., & Wil-liams, R. (2009). Vulnerability genes or plasticity genes? Molecular Psy-chiatry, 14, 746–754.
Belsky, J., & Pluess, M. (2009). Beyond diathesis–stress: Differential suscep-tibility to environmental influences. Psychological Bulletin, 135, 885–908.
Belsky, J., & Pluess, M. (2012). Differential susceptibility to long-term ef-fects of quality of child care on externalizing behavior in adolescence. In-ternational Journal of Behavioral Development, 36, 2–10.
Belsky, J., & Pluess, M. (2013). Beyond risk, resilience and dysregulation:Phenotypic plasticity and human development. Development and Psy-chopathology, 25, 1243–1261.
Belsky, J., Pluess, M., & Widaman, K. F. (2013). Confirmatory and compe-titive evaluation of alternative gene–environment interaction hypotheses.Journal of Child Psychology and Psychiatry, 54, 1135–1143.
Belsky, J., Steinberg, L., & Draper, P. (1991). Childhood experience, inter-personal development and reproductive strategy: An evolutionary theoryof socialization. Child Development, 62, 647–670.
Benjamini, Y., & Hochberg, Y. (1995). Controlling the false discoveryrate: A practical and powerful approach to multiple testing. Journal ofthe Royal Statistical Society, Series B (Methodological), 57, 289–300.
Berry, D., Deater-Deckard, K., McCartney, K., Wang, Z., & Petrill, S. A.(2013). Gene–environment interaction between dopamine receptor D47-repeat polymorphism and early maternal sensitivity predicts inattentiontrajectories across middle childhood. Development and Psychopathology,25, 291–306.
Brody, G. H., Beach, S. R. H., Chen, Y., Obasi, E., Philibert, R. A., Kogan, S.M., et al. (2011). Perceived discrimination, serotonin transporter linkedpolymorphic region status, and the development of conduct problems.Development and Psychopathology, 23, 617–627.
Carver, C. S., Johnson, S. L., Joormann, J., Kim, Y., & Nam, J. Y. (2011).Serotonin transporter polymorphism interacts with childhood adversityto predict aspects of impulsivity. Psychological Science, 22, 589–595.
G�E maternal sensitivity 19
Caspi, A., McClay, J., Moffitt, T., Mill, J., Martin, J., Craig, I., et al. (2002).Role of genotype in the cycle of violence in maltreted children. Science,297, 851–854.
Chabris, C. F., Hebert, B. M., Benjamin, D. J., Beauchamp, J., Cesarini, D.,van der Loos, M., et al. (2012). Most reported genetic associations withgeneral intelligence are probably false positives. Psychological Science,23, 1314–1323.
Charney, E., & English, W. (2012). Candidate genes and political behavior.American Political Science Review, 106, 1–34.
Clasen, P. C., Wells, T. T., Knopik, V. S., McGeary, J. E., & Beevers, C. G.(2011). 5-HTTLPR and BDNF Val66Met polymorphisms moderate ef-fects of stress on rumination. Genes, Brain and Behavior, 10, 740–746.
Dearing, E., & Hamilton, L. C. (2006). Contemporary approaches and classicadvice for analyzing mediating and moderating variables. Monographs ofthe Society for Research in Child Development, 71, 88–104.
Deary, I. J. (2012). Intelligence. Annual Review of Psychology, 63, 453–482.De Wolff, M., & van IJzendoorn, M. (1997). Sensitivity and attachment: A
meta-analysis on parental antecedents of infant attachment. Child Devel-opment, 68, 571–591.
DeYoung, C. G., Cicchetti, D., & Rogosch, F. A. (2011). Moderation of theassociation between childhood maltreatment and neuroticism by the cor-ticotropin-releasing hormone receptor 1 gene. Journal of Child Psychol-ogy and Psychiatry, 52, 898–906.
Dressler, W. W., Balieiro, M. C., Ribeiro, R. P., & Dos Santos, J. E. (2009).Cultural consonance, a 5HT2A receptor polymorphism, and depressivesymptoms: A longitudinal study of Gene�Culture interaction in urbanBrazil. American Journal of Human Biology, 21, 91–97.
Drury, S. S., Gleason, M. M., Theall, K. P., Smyke, A. T., Nelson, C. A., Fox,N. A., et al. (2012). Genetic sensitivity to the caregiving context: The in-fluence of 5HTTLPR and BDNF val66met on indiscriminate social be-havior. Physiology & Behavior, 106, 728–735.
Ducci, F., Enoch, M. A., Hodgkinson, C., Xu, K., Catena, M., Robin, R. W.,et al. (2008). Interaction between a functional MAOA locus and child-hood sexual abuse predicts alcoholism and antisocial personality disorderin adult women. Molecular Psychiatry, 13, 334–347.
Duncan, L., & Keller, M. C. (2011). A critical review of the first 10 years ofcandidate gene-by-environment interaction research in psychiatry. Amer-ican Journal of Psychiatry, 168, 1041–1049.
Ellis, B. J., Boyce, W. T., Belsky, J., Bakermans-Kranenburg, M. J., & vanIJzdenoorn, M. (2011). Differential susceptibility to the environment:An evolutionary–neurodevelopmental theory. Development and Psycho-pathology, 23, 1–5.
Elovainio, M., Jokela, M., Kivimaki, M., Pulkki-Raback, L., Lehtimaki, T.,Airla, N., et al. (2007). Genetic variants in the DRD2 gene moderate therelationship between stressful life events and depressive symptoms inadults: Cardiovascular risk in young Finns study. Psychosomatic Medi-cine, 69, 391–395.
Elzinger, B. M., Molendijk, M. L., Voshaar, R. C., Bus, B. A., Prickaerts, J.,Spinhoven, P., et al. (2011). The impact of child abuse and recent stresson serum brain-derived neurotrophic factor and the moderating role ofBDNF Val66Met. Psychopharmacology, 214, 319–328.
Enoch, M. A., Steer, C. D., Newman, T. K., Gibson, N., & Goldman, D.(2010). Early life stress, MAOA, and gene–environment interactions pre-dict behavioral disinhibition in children. Genes, Brain and Behavior, 9,65–74.
Fardo, D. W., Becker, K. D., Bertram, L., Tanzi, R. E., & Lange, C. (2009).Recovering unused information in genome-wide association studies: Thebenefit of analyzing SNPs out of Hardy–Weinberg equilibrium. Euro-pean Journal of Human Genetics, 17, 1676–1682.
Fortuna, K., van IJzendoorn, M. H., Mankuta, D., Kaitz, M., Avinun, R., Ep-stein, R. P., et al. (2011) Differential genetic susceptibility to child risk atbirth in predicting observed maternal behavior. PLOS ONE, 6, e19765.
Fraley, R. C., Roisman, G. I., & Haltigan, J. D. (2013). The legacy of earlyexperiences in development: Formalizing alternative models of how earlyexperiences are carried forward over time. Developmental Psychology,49, 109–126.
Frazzetto, G., Di Lorenzo, G., Carola, V., Proietti, L., Sokolowska, E., Sira-cusano, A., et al. (2007). Early trauma and increased risk for physical ag-gression during adulthood: The moderating role of MAOA genotype.PLOS ONE, 2, e486.
Gatt, J. M., Nemoroff, C. B., Dobson-Stone, C., Paul, R. H., Bryant, R. A.,Schofield, P. R., et al. (2009). Interactions between BDNF Val66Metpolymorphism and early life stress predict brain and arousal pathways tosyndromal depression and anxiety. Molecular Psychiatry, 14, 681–695.
Gottesman, I. I., & Shields, J. (1967). A polygenic theory of schizophrenia.Proceedings of the National Academy of Sciences, 58, 199–205.
Gresham, F. M., & Elliott, S. N. (1990). The Social Skills Rating System. Cir-cle Pines, MN: American Guidance Service.
Haltigan, J. D., Roisman, G. I., & Fraley, R. C. (2013). The predictive signif-icance of early caregiving experiences for symptoms of psychopathologythrough midadolescence: Enduring or transient effects? Development andPsychopathology, 25, 209–221.
Hankin, B. L., Jenness, J., Abela, J. R., & Smolen, A. (2011). Interaction of5-HTTLPR and idiographic stressors predicts prospective depressivesymptoms specifically among youth in a multi-wave design. Journal ofClinical Child and Adolescent Psychology, 40, 572–585.
Hankin, B., Nederhof, E., Oppenheimer, C. W., Jenness, J., Young, J. F.,Abela, J. R. Z., et al. (2011). Differential susceptibility in youth: Evi-dence that 5HTTLPR�Positive Parenting is associated with positive af-fect “for better and worse.” Translational Psychiatry, 1, e44.
Hartl, D. L., & Clark, A. G. (1989). Principles of population genetics (2nded.). Sunderland, MA: Sinauer Associates.
Hayden, E. P., Klein, D. N., Dougherty, L. R., Olino, T. M., Dyson, M. W.,Durbin, C. E., et al. (in press). The role of brain-derived neurotrophic fac-tor genotype, parental depression, and relationship discord in predictingearly-emerging negative emotionality. Psychological Science.
Jaffari-Bimmel, N., Juffer, F., van IJzendoorn, M. H., Bakermans-Kranen-burg, M. J., & Mooijaart, A. (2006). Social development from infancyto adolescence: Longitudinal and current factors in an adoption sample.Developmental Psychology, 42, 1143–1153.
Jokela, M., Lehtimaki, T., & Keltikangas-Jarvinen, L. (2007a). The influenceof urban/rural residency on depressive symptoms is moderated by the se-rotonin receptor 2A gene. American Journal of Medical Genetics: Part B,Neuropsychiatric Genetics, 144, 918–922.
Jokela, M., Lehtimaki, T., & Keltikangas-Jarvinen, L. (2007b). The serotoninreceptor 2A gene moderates the influence of parental socioeconomic sta-tus on adulthood harm avoidance. Behavior Genetics, 37, 567–574.
Juhasz, G., Dunham, J., McKie, S., Thomas, E., Downey, D., Chase, D., et al.(2011). The CREDB1–BDNF–NTRK2 pathway in depression. Biologi-cal Psychiatry, 69, 762–771.
Keltikangas-Jarvinen, L., Jokela, M., Hintsanen, M., Salo, J., Hintsa, T., Ala-tupa, S., et al. (2010). Does genetic background moderate the associationbetween parental education and school achievement? Genes, Brain andBehavior, 9, 318–324.
Keltikangas-Jarvinen, L., Puttonen, S., Kivimaki, M., Elovainio, M., Rontu,R., & Lehtimaki, T. (2007). Tryptophan hydroxylase 1 gene haplotypesmodify the effect of a hostile childhood environment on adulthood harmavoidance. Genes, Brain, and Behavior, 6, 305–313.
Knafo, A., Israel, S., & Ebstein, R. P. (2011). Heritability of children’s pro-social bhavior and differential susceptibility to parenting by variation inthe dopamine receptor D4 gene. Development and Psychopathology, 23,53–67.
Kochanska, G. (2002). Mutually responsive orientation between mothers andtheir young children: A context for the early development of conscience.Current Directions in Psychological Science, 11, 191–195.
Kochanska, G., Kim, S., Barry, R. A., & Philibert, R. A. (2011). Children’sgenotypes interact with maternal responsive care in predicting children’scompetence: Diathesis–stress or differential susceptibility? Developmentand Psychopathology, 23, 605–616.
Kuepper, Y., Wielpuetz, C., Alexander, N., Mueller, E., Grant, P., & Hennig, J.(2012). 5-HTTLPR S-Allele: A genetic plasticity factor regarding the effectsof life events on personality. Genes, Brain and Behavior, 34, 1070–1074.
Kuo, Z.-Y. (1967). The dynamics of behavior development: An epigeneticview. New York: Random House.
Laucht, M., Blomeyeer, D., Burchmann, A. F., Treutlein, J., Schmidt, M. H.,Esser, G., et al. (2012). Catechol-O-methyltransferase Val158Met geno-type, parenting practices and adolescent alcohol use: Testing the differen-tial susceptibility hypothesis. Journal of Child Psychology and Psychia-try, 53, 351–359.
Mata, J., Thompson, R. J., & Gotlib, I. H. (2010). BDNF genotype moderatesthe relation between physical activity and depressive symptoms. HealthPsychology, 29, 130–133.
Mills-Koonce, W. R., Propper, C. B., Gariepy, J. L., Blair, C., Garrett-Peters,P., & Cox, M. J. (2007). Bidirectional genetic and environmental influ-ences on mother and child behavior: The family system as the unit of anal-yses. Development and Psychopathology, 19, 1073–1087.
Neuman, R. J., Lobos, E., Reich, W., Henderson, C. A., Sun, L. W., & Todd,R. D. (2007). Prenatal smoking exposure and dopaminergic genotypes in-
J. Belsky et al.20

teract to cause a severe ADHD subtype. Biological Psychiatry, 61, 1320–1328.
Newman, D. A. (2003). Longitudinal modeling with randomly and system-atically missing data: A simulation of ad hoc, maximum likelihood,and multiple imputation techniques. Organizational Research Methods,6, 328–362.
NICHD Early Child Care Research Network. (2001). Child-care and familypredictors of preschool attachment and stability from infancy. Develop-mental Psychology, 37, 847–862.
NICHD Early Child Care Research Network. (2005). Child care and childdevelopment. New York: Guilford Press.
NICHD Early Child Care Research Network. (2006). Child-care effect sizesfor the NICHD Study of Early Child Care and Youth Development.American Psychologist, 61, 99–116.
Nijmeijer, J. S., Hartman, C. A., Rommelse, N. N., Altink, M. E., Buschgens,C. J., Fliers, E. A., et al. (2010). Perinatal risk factors interacting with ca-techol-O-methyltransferase and the serotonin transporter gene predictASD symptoms in children with ADHD. Journal of Child Psychologyand Psychiatry, 51, 1242–1250.
Obradovic, J., & Boyce, W. T. (2009). Individual differences in behavioral,physiological, and genetic sensitivities to contexts: Implications for de-velopment and adaptation. Developmental Neuroscience, 31, 300–308.
Park, A., Sher, K. J., Todorov, A. A., & Heath, A. C. (2011). Interaction be-tween DRD4 VNTR polymorphism and proximal and distal environ-ments in alcohol dependence during emerging and young adulthood.Journal of Abnormal Psychology, 120, 585–595.
Patterson, G. R. (1982). Coercive family process. Eugene, OR: Castalia.Patterson, G. R. (1986). Performance models for antisocial boys. American
Psychologist, 41, 432–444.Plomin, R. (2012). Child development and molecular genetics: 14 years later.
Child Development. Advance online publication. doi: 10.1111/j.1467-8624.2012.01757.x
Plomin, R., Haworth, C. M. A., Meaburn, E. L., Price, T. S., Wellcome TrustCase Control Consortium 2, & Davis, O. S. P. (2013). Common DNAmarkers can account for more than half of the genetic influence on cog-nitive abilities. Psychological Science. Advance online publication.doi:10.1177/0956797612457952
Pluess, M., & Belsky, J. (2009). Differential susceptibility to rearing experi-ence: The case of child-care. Journal of Child Psychology and Psychiatryand Allied Disciplines, 50, 396–404.
Pluess, M., & Belsky, J. (2010). Differential susceptibility to parenting andquality child care. Developmental Psychology, 45, 379–390.
Pluess, M., & Belsky, J. (2012). Vantage sensitivity: Individual differences inresponse to positive experiences. Psychological Bulletin. Advance onlinepublication.
Propper, C., Mills-Koonce, W. R., Tucker Halpern, C., Hill-Soderlund, A. L.,Carbone, M. A., Moore, G. A., et al. (2008). Gene–environment contri-butions to the development of infant vagal reactivity: The interaction ofdopamine and maternal sensitivity. Child Development, 79, 1377–1394.
Raymond, M., & Rousset, F. (1995). GENEPOP (Version 1.2): Populationgenetics software for exact tests and ecumenicism. Journal of Heredity,86, 248–249.
Roisman, G. I., Booth-LaForce, C., Cauffman, E., Spieker, S., & the NICHDEarly Child Care Research Network. (2009). The developmental signifi-cance of adolescent romantic relationships: Parent and peer predictors ofquality and engagement at age 15. Journal of Youth and Adolescence, 38,1294–1303.
Roisman, G. I., & Fraley, R. C. (2012). A behavior-genetic study of the le-gacy of early caregiving experiences: Academic skills, social compe-tence, and externalizing behavior in kindergarten. Child Development,83, 728–742.
Roisman, G. I., Newman, D. A., Fraley, R. C., Haltigan, J. D., Groh, A. M., &Haydon, K. C. (2012). Distinguishing differential susceptibility from di-athesis–stress: Recommendations for evaluating interaction effects. De-velopment and Psychopathology, 24, 389–409.
Roisman, G. I., Susman, E., Barnett-Walker, K., Booth-LaForce, C., Owen,M. T., Belsky, J., et al. (2009). Early family and child-care antecedents ofawakening cortisol levels in adolescence. Child Development, 80, 907–920.
Rothbart, M. K., & Bates, J. E. (2006). Temperament. In N. Eisenberg, W. Damon,&R.M.Lerner(Eds.),Handbookofchildpsychology:Vol.3.Social,emotional,and personality development (6th ed., pp. 99–166). Hoboken, NJ: Wiley.
Rubin, D. B. (1987). Multiple imputation for nonresponse in surveys.New York: Wiley.
Rutter, M. (2009). Understanding and testing risk mechanisms for mentaldisorders. Journal of Child Psychology and Psychiatry, 50, 44–52.
Salo, J., Jokela, M., Lehtimaki, T., & Keltikangas-Jarvinen, L. (2011). Sero-tonin receptor 2A gene moderates the effect of childhood maternal nurtur-ance on adulthood social attachment. Genes, Brain and Behavior, 10,702–709.
Sameroff, A. J. (1983). Developmental systems: Contexts and evolution. In P.Mussen (Ed.), Handbook of child psychology (Vol. 1, pp. 237–294).New York: Wiley.
Schafer, J. L. (1997). Analysis of incomplete multivariate data. London:Chapman & Hall.
Schafer, J. L., & Graham, J. W. (2002). Missing data: Our view of the state ofthe art. Psychological Methods, 7, 147–177.
Sonuga-Barke, E. J., Oades, R. D., Psychogiou, L., Chen, W., Franke, B.,Buitelaar, J., et al. (2009). Dopamine and serotonin transporter genotypesmoderate sensitivity to maternal expressed emotion: The case of conductand emotional problems in attention deficit/hyperactivity disorder.Journal of Child Psychology and Psychiatry and Allied Disciplines,50, 1052–1063.
Sroufe, L. A. (2000). Early relationships and the development of children. In-fant Mental Health Journal, 21, 67–74.
Sroufe, L. A., Egeland, B., Carlson, E. A., & Collins, W. A. (2005). The de-velopment of the person: The Minnesota study of risk and adaptationfrom birth to adulthood. New York: Guilford Press.
Suzuki, A., Matsumoto, Y., Shibuya, N., Sadahiro, R., Kamata, M., Goto, K.,et al. (2011). The brain-derived neurotrophic factor Val66Met polymor-phism modulates the effects of parental rearing on personality traits inhealthy subjects. Genes, Brain and Behavior, 10, 385–391.
Troisi, A., Frazzetto, G., Carola, V., D’Amato, F. R., Moles, A., Siracusano, A.,et al. (2010). Social hedonic capacity is associated with the A118G poly-morphism of the m-opioid receptor gene (OPRM1) in adult healthy volun-teers and psychiatric patients. Social Neuroscience, 17, 1–10.
Troisi, A., Frazzetto, G., Carola, V., Di Lorenzo, G., Coviello, M., Siracusano,A., et al. (2012). Variationin the m-opioid receptor gene (OPRM1) moder-ates the influence of early maternal care on fearful attachment. Social andAffective Nueroscience, 5, 542–547.
Vandell, D. L., Belsky, J., Burchinal, M., Steinberg, L., Vandergrift, N., &the NICHD Early Child Care Research Network. (2010). Do effects ofearly child care extend to age 15 years? Results from the NICHD Studyof Early Child Care and Youth Development. Child Development, 81,737–756.
van IJzendoorn, M. H., Bakermans-Kranenburg, M. J., & Mesman, J. (2008).Dopamine system genes associated with parenting in the context of dailyhassles. Genes, Brain, and Behavior, 7, 403–410.
Van Roekel, E., Goossens, L., Scholte, R. H., Engels, R. C., & Verhagen, M.(2011). The dopamine D2 receptor gene, perceived parental support,and adolescent loneliness: Longitudinal evidence for gene–environment in-teractions. Journal of Child Psychology and Psychiatry, 52, 1044–1051.
Verschoor, E. & Markus, C. R. (2011). Affective and neuroendocrine stressreactivity to an academic examination: Influence of the 5-HTTLPR geno-type and trait neuroticism. Biological Psychiatry, 87, 439–449.
Vinberg, M., Trajkovska, V., Bennike, B., Knorr, U., Knudsen, G. M., &Kessing, L. V. (2009). The BDNF Val66Met polymorphism: Relationto familiar risk of affective disorder, BDNF levels and salivary cortisol.Psychoneuroendrocrinlogy, 34, 1380–1389.
Wacker, J., Mueller, E. M., Hennig, J., & Stemmler, G. (2012). How to con-sistently link extraversion and intelligence to the catechol-O-methyltrans-ferase (COMT) gene: On defining and measuring psychological pheno-types in neurogenetic research. Journal of Personality and SocialPsychology, 102, 427–444.
Wakschlag, L. S., Kistner, E. O., Pine, D. S., Biesecker, G., Pickett, K. E.,Skol, A. D., et al. (2010). Interaction of prenatal exposure to cigatrettesand MAOA genotype in pathways to you antisocial behavior. MolecularPsychiatry, 15, 928–937.
Way, B. M., Taylor, S. E., & Eisenberger, N. I. (2009). Variation in the m-opioid receptor gene (OPMR1) is associated with dispositional andneural sensitivity to social rejection. Proceedings of the National Acad-emy of Sciences, 106, 15079–15084.
Widaman, K. F., Helm, J. L., Castro-Schilo, L., Pluess, M., Stallings, M. C.,& Belsky, J. (2012). Distinguishing ordinal and disordinal interactions.Psychological Methods, 17, 615–622.
Widom, C. S., & Bruzustowicz, L. M. (2006). MAOA and the “cycle of vio-lence”: Childhood abuse and neglect, MAOA genotype, and risk for vio-lent and antisocial behavior. Biological Psychiatry, 60, 684–689.
G�E maternal sensitivity 21

Woodcock, R. W. (1990). Theoretical foundations of the WJ-R measuresof cognitive ability. Journal of Psychoeducational Assessment, 8,231–258.
Woodcock, R. W., & Johnson, M. B. (1989). Woodcock–Johnson Psycho-Educational Battery—Revised. Allen, TX: DLM.
Yong Zou, G., & Donner, A. (2006). The merits of testing Hardy–Weinbergequilibrium in the analysis of unmatched case-control data: A cautionarynote. Annals of Human Genetics, 70, 923–933.
Zuckerman, M. (1999). Vulnerability to psychopathology: A biosocialmodel. Washington, DC: American Psychological Association.
J. Belsky et al.22