Gold Nanoparticle Based Label-Free SERS Probe for Ultrasensitive and Selective Detection of...
7
Gold Nanoparticle Based Label-Free SERS Probe for Ultrasensitive and Selective Detection of Trinitrotoluene Samuel S. R. Dasary, Anant Kumar Singh, Dulal Senapati, Hongtao Yu, and Paresh Chandra Ray* Department of Chemistry, Jackson State UniVersity, Jackson, Mississippi 39217 Received June 22, 2009; E-mail: [email protected] Abstract: TNT is one of the most commonly used nitro aromatic explosives used for landmine and military purpose. Due to the significant detrimental effects, contamination of soil and groundwater with TNT is the major concern. Driven by the need to detect trace amounts of TNT from environmental samples, this article demonstrates for the first time a highly selective and ultra sensitive, cysteine modified gold nanoparticle based label-free surface enhanced Raman spectroscopy (SERS) probe, for TNT recognition in 2 pico molar (pM) level in aqueous solution. Due to the formation of Meisenheimer complex between TNT and cysteine, gold nanoparticles undergo aggregation in the presence of TNT via electrostatic interaction between Meisenheimer complex bound gold nanoparticle and cysteine modified gold nanoparticle. As a result, it formed several hot spots and provided a significant enhancement of the Raman signal intensity by 9 orders of magnitude through electromagnetic field enhancements. A detailed mechanism for termendous SERS intensity change has been discussed. Our experimental results show that TNT can be detected quickly and accurately without any dye tagging in lower pM level with excellent discrimination against other nitro compounds and heavy metals. Introduction 2,4,6-Trinitrotoluene (TNT) is one of the most commonly used explosives in the preparation of landmines for military and terrorist activities. 1,2 Contamination of soil and groundwater with TNT is the major concern because of its biological persistence, toxicity and mutagenicity. 3,4 TNT can absorb through the skin and people who are exposed to TNT over a prolonged period tend to experience anemia and abnormal liver functions. Recently, global security concerns have also dictated a need for the detection of hidden explosive devices in war zones and transportation hubs. As a result, it is important to develop highly sensitive, cost-effective probe that can provide real-time deter- mination of TNT level in the environment. Current technology for the detection of TNT is less sensitive and usually time- consuming with the employment of cumbersome and expensive gas chromatography coupled to a mass spectrometer, ion mobility spectrometry, and neutron activation analysis. 5,6 They are too slow from the perspective of day-to-day life needs for on-the-spot detection. To address the growing market needs in the 21st century, future devices must link high performance, with speed, simplicity and low cost. 5-8 As a result, the development of ultrasensitive assays for the real-time detection of TNT has attracted considerable research efforts in recent years. 5-18 Different sensors for analyzing TNT have been reported in last 10 years, which includes optical sensors such as, QD, silica nanoparticle and organic dyes based fluorescence resonance energy transfer (FRET), conjugated polymer based single and mutiphoton sensor. But these assays identify the TNT analyte through a covalently linked label such as a fluorescence or luminescence tag. Necessity of tagging makes it difficult to (1) Smith, K. D.; McCord, B. R.; MacCrehan, W. A.; Mount, K.; Rowe, W. F. J. Forensic Sci. 1999, 44, 789–794. (2) Charles, P. T.; Dingle, B. M.; Van Bergen, S.; Gauger, P. R.; Patterson, C. H.; Kusterbeck, A. W. Field Anal. Chem. Technol. 2001, 5, 272– 280. (3) Dillewijn, P. V.; Couselo, J. L.; Corredoira, E.; Delgado, A.; Wittich, R. M.; Ballester, A.; Ramos, J. L. EnViron. Sci. Technol. 2008, 42, 7405–7410. (4) Hawari, J.; Beaudet, S.; Halasz, A.; Thiboutot, S.; Ampleman, G. Appl. Microbiol. Biotechnol. 2000, 54, 605–618. (5) Swager, T. M. Acc. Chem. Res. 1998, 31, 201–20. (6) McQuade, D. T.; Pullen, A. E.; Swager, T. M. Chem. ReV. 2000, 100, 2537–2574. (7) Sohn, H.; Sailor, M. J.; Magde, D.; Trogler, W. C. J. Am. Chem. Soc. 2003, 125, 3821–3830. (8) Riskin, M.; Tel-Vered, R.; Lioubashevski, O.; Willner, I. J. Am. Chem. Soc. 2009, 131, 7368–7378. (9) Riskin, M.; Tel-Vered, R.; Bourenko, T.; Granot, E.; Willner, I. J. Am. Chem. Soc. 2008, 130, 9726–9733. (10) Goldman, E. R.; Medintz, I. L.; Whitley, J. L.; Hayhurst, A.; Clapp, A. R.; Uyeda, T. H.; Deschamps, J. R.; Lassman, M. E.; Mattoussi, H. J. Am. Chem. Soc. 2005, 127, 6744–6751. (11) Forzani, E. R.; Lu, D.; Leright, M. J.; Aguilar, D. A.; Tsow, F.; Iglesias, R. A.; Zhang, Q.; Lu, J.; Li, J.; Tao, N. J. Am. Chem. Soc. 2009, 131, 1390–1391. (12) Andrew, T. L.; Swager, T. M. J. Am. Chem. Soc. 2007, 129, 7254– 7255. (13) Narayanan, A.; Varnavski, O. P.; Swager, T. M.; Goodson, T., III J. Phys. Chem. C 2008, 112, 881–884. (14) Jiang, Y.; Zhao, H.; Zhue, N.; Lin, Y.; Yu, P.; Mao, L. Angew. Chem., Int. Ed. 2008, 47, 8601–8604. (15) Freeman, R.; Willner, I. Nano Lett. 2009, 9, 322–326. (16) Trammell, S. A.; Zeinali, M.; Melde, B. J.; Charles, P. T.; Velez, F. L.; Dinderman, M. A.; Kusterbeck, A.; Markowitz, M. A. Anal. Chem. 2008, 80, 4627–4633. (17) Cerruti, M.; Jaworski, J.; Raorane, D.; Zueger, C.; Varadarajan, J.; Carraro, C.; Lee, S. K.; Maboudian, R.; Majumdar, A. Anal. Chem. 2009, 81, 4192–4199. (18) Gao, D.; Wang, Z.; Liu, B.; Ni, L.; Wu, M.; Zhang, Z. Anal. Chem. 2008, 80, 8545–8553. Published on Web 09/08/2009 10.1021/ja905134d CCC: $40.75 2009 American Chemical Society 13806 9 J. AM. CHEM. SOC. 2009, 131, 13806–13812
Transcript of Gold Nanoparticle Based Label-Free SERS Probe for Ultrasensitive and Selective Detection of...

Gold Nanoparticle Based Label-Free SERS Probe forUltrasensitive and Selective Detection of Trinitrotoluene
Samuel S. R. Dasary, Anant Kumar Singh, Dulal Senapati, Hongtao Yu, andParesh Chandra Ray*
Department of Chemistry, Jackson State UniVersity, Jackson, Mississippi 39217
Received June 22, 2009; E-mail: [email protected]
Abstract: TNT is one of the most commonly used nitro aromatic explosives used for landmine and militarypurpose. Due to the significant detrimental effects, contamination of soil and groundwater with TNT is themajor concern. Driven by the need to detect trace amounts of TNT from environmental samples, this articledemonstrates for the first time a highly selective and ultra sensitive, cysteine modified gold nanoparticlebased label-free surface enhanced Raman spectroscopy (SERS) probe, for TNT recognition in 2 pico molar(pM) level in aqueous solution. Due to the formation of Meisenheimer complex between TNT and cysteine,gold nanoparticles undergo aggregation in the presence of TNT via electrostatic interaction betweenMeisenheimer complex bound gold nanoparticle and cysteine modified gold nanoparticle. As a result, itformed several hot spots and provided a significant enhancement of the Raman signal intensity by 9 ordersof magnitude through electromagnetic field enhancements. A detailed mechanism for termendous SERSintensity change has been discussed. Our experimental results show that TNT can be detected quicklyand accurately without any dye tagging in lower pM level with excellent discrimination against other nitrocompounds and heavy metals.
Introduction
2,4,6-Trinitrotoluene (TNT) is one of the most commonlyused explosives in the preparation of landmines for military andterrorist activities.1,2 Contamination of soil and groundwater withTNT is the major concern because of its biological persistence,toxicity and mutagenicity.3,4 TNT can absorb through the skinand people who are exposed to TNT over a prolonged periodtend to experience anemia and abnormal liver functions.Recently, global security concerns have also dictated a needfor the detection of hidden explosive devices in war zones andtransportation hubs. As a result, it is important to develop highlysensitive, cost-effective probe that can provide real-time deter-mination of TNT level in the environment. Current technologyfor the detection of TNT is less sensitive and usually time-consuming with the employment of cumbersome and expensivegas chromatography coupled to a mass spectrometer, ionmobility spectrometry, and neutron activation analysis.5,6 Theyare too slow from the perspective of day-to-day life needs foron-the-spot detection. To address the growing market needs inthe 21st century, future devices must link high performance,
with speed, simplicity and low cost.5-8 As a result, thedevelopment of ultrasensitive assays for the real-time detectionof TNT has attracted considerable research efforts in recentyears.5-18 Different sensors for analyzing TNT have beenreported in last 10 years, which includes optical sensors suchas, QD, silica nanoparticle and organic dyes based fluorescenceresonance energy transfer (FRET), conjugated polymer basedsingle and mutiphoton sensor. But these assays identify the TNTanalyte through a covalently linked label such as a fluorescenceor luminescence tag. Necessity of tagging makes it difficult to
(1) Smith, K. D.; McCord, B. R.; MacCrehan, W. A.; Mount, K.; Rowe,W. F. J. Forensic Sci. 1999, 44, 789–794.
(2) Charles, P. T.; Dingle, B. M.; Van Bergen, S.; Gauger, P. R.; Patterson,C. H.; Kusterbeck, A. W. Field Anal. Chem. Technol. 2001, 5, 272–280.
(3) Dillewijn, P. V.; Couselo, J. L.; Corredoira, E.; Delgado, A.; Wittich,R. M.; Ballester, A.; Ramos, J. L. EnViron. Sci. Technol. 2008, 42,7405–7410.
(4) Hawari, J.; Beaudet, S.; Halasz, A.; Thiboutot, S.; Ampleman, G. Appl.Microbiol. Biotechnol. 2000, 54, 605–618.
(5) Swager, T. M. Acc. Chem. Res. 1998, 31, 201–20.(6) McQuade, D. T.; Pullen, A. E.; Swager, T. M. Chem. ReV. 2000, 100,
2537–2574.
(7) Sohn, H.; Sailor, M. J.; Magde, D.; Trogler, W. C. J. Am. Chem. Soc.2003, 125, 3821–3830.
(8) Riskin, M.; Tel-Vered, R.; Lioubashevski, O.; Willner, I. J. Am. Chem.Soc. 2009, 131, 7368–7378.
(9) Riskin, M.; Tel-Vered, R.; Bourenko, T.; Granot, E.; Willner, I. J. Am.Chem. Soc. 2008, 130, 9726–9733.
(10) Goldman, E. R.; Medintz, I. L.; Whitley, J. L.; Hayhurst, A.; Clapp,A. R.; Uyeda, T. H.; Deschamps, J. R.; Lassman, M. E.; Mattoussi,H. J. Am. Chem. Soc. 2005, 127, 6744–6751.
(11) Forzani, E. R.; Lu, D.; Leright, M. J.; Aguilar, D. A.; Tsow, F.; Iglesias,R. A.; Zhang, Q.; Lu, J.; Li, J.; Tao, N. J. Am. Chem. Soc. 2009, 131,1390–1391.
(12) Andrew, T. L.; Swager, T. M. J. Am. Chem. Soc. 2007, 129, 7254–7255.
(13) Narayanan, A.; Varnavski, O. P.; Swager, T. M.; Goodson, T., III J.Phys. Chem. C 2008, 112, 881–884.
(14) Jiang, Y.; Zhao, H.; Zhue, N.; Lin, Y.; Yu, P.; Mao, L. Angew. Chem.,Int. Ed. 2008, 47, 8601–8604.
(15) Freeman, R.; Willner, I. Nano Lett. 2009, 9, 322–326.(16) Trammell, S. A.; Zeinali, M.; Melde, B. J.; Charles, P. T.; Velez, F. L.;
Dinderman, M. A.; Kusterbeck, A.; Markowitz, M. A. Anal. Chem.2008, 80, 4627–4633.
(17) Cerruti, M.; Jaworski, J.; Raorane, D.; Zueger, C.; Varadarajan, J.;Carraro, C.; Lee, S. K.; Maboudian, R.; Majumdar, A. Anal. Chem.2009, 81, 4192–4199.
(18) Gao, D.; Wang, Z.; Liu, B.; Ni, L.; Wu, M.; Zhang, Z. Anal. Chem.2008, 80, 8545–8553.
Published on Web 09/08/2009
10.1021/ja905134d CCC: $40.75 2009 American Chemical Society13806 9 J. AM. CHEM. SOC. 2009, 131, 13806–13812
use the FRET technique as biosensors for real life. Driven bythe need, in this article, we demonstrate that cysteine modifiedgold nanoparticle based surface enhanced Raman scattering(SERS) probe can be used for label-free detection of TNT, withexcellent detection limit (50 pico-molar) and selectivity overDNT and other nitrocompounds.
In the last 15 years, the field of biological and chemicalsensors using nanomaterial has witnessed an explosion due tothe unique optical properties of noble metal nanostructures.19-29
The collective oscillation of surface electrons on nanostructuredmaterials has been leveraged for the amplification of opticalprocesses in Raman scattering.30-37 The phenomenon of SERSis generally explained by a combination of an electromagnetic(EM) mechanism describing the surface electron movement inthe substrate and a chemical mechanism related to chargetransfer (CT)between thesubstrateand theanalytemolecules.36-46
The possibility of observing Raman signals, which are normallyvery weak, with enhancements of the order of 108-1014 andthe unique ability to obtain molecular recognition of an analyteat very low concentrations in aqueous environment allow SERSto be unique for ultrasensitive biological and chemical analysisand environmental sensing.34-47 In addition to sensitivity,another important feature of SERS is the level of detection
specificity that can be achieved by controlling the chemistryaround the metal surface. By incorporating a specific chemicalmoiety on the SERS surface, one can target the detection of asingle species present in a complex sample mixture at nano tofemto molar level without having to physically separate outinterfering species.36-49 Very high selectivity and sensitivityoffered by SERS, along with the highly informative spectracharacteristics of Raman spectroscopy, allows SERS-basedmethod a feasible alternative to more commonly used opticalsensing methods. Remote sensing using SERS has beendemonstrated at distances of up to 10 m using fiber-opticallycoupled probe coupled with telephoto lens.48,49 Using thoseunique SERS properties, we report for the first time cysteinemodified gold nanoparticle based miniaturized, inexpensiveultrasensitive surface enhanced Raman scattering (SERS) probe,for highly sensitive and selective screening of TNT fromaqueous solution. This nanotechnology based method could beadapted for the detection of a wide variety of explosives usedas bioterrorism agents and for military purpose. Our resultsdemonstrate the potential for a broad application of this typeof nanotechnology in practical applications in various explosivedetection systems.
Materials and Experiments
Hydrogen tetrachloroaurate (HAuCl4.3H2O), NaBH4, sodiumcitrate, L-cysteine, 2,6-dinitrotoluene, nitrophenol, acetontrile andethanol were purchased from Sigma-Aldrich and used withoutfurther purification. 2,4,6-Trinitrotoluene was provided by ERDC,Vicksburg, MS.
Gold Nanoparticle Synthesis. Gold nanoparticles of differentsizes and shapes were synthesized by controlling the ratio ofHAuCl4, 3H2O and sodium citrate concentration as we reportedrecently.21-24,46 HAuCl4 trihydrate (1.8 mL, 0.01 M) in water and0.5 mL of 0.01 M sodium citrate in water were added to 40 mL ofdeionized H2O and stirred. Next, 0.12 mL of freshly prepared 0.1M NaBH4 was added and the solution color changed from colorlessto orange. Stirring was stopped and the solution was left undisturbedfor 2 h. The resulting spherical gold nanoparticles were 30 nm indiameter. JEM-2100F transmission electron microscope (TEM) andUV-visible absorption spectrum were used to characterize thenanoparticles. The particle concentration was measured byUV-visible spectroscopy using the molar extinction coefficientsat the wavelength of the maximum absorption of each gold colloidas reported recently21-24,46 [ε(30) 530 nm ) 3.0 × 109 cm-1 M-1].
Gold Nanoparticle Surface Modification. For selective detec-tion of TNT, we have modified the gold nanoparticle surface bycysteine. 9:1 volume ratio of freshly prepared AuNPs (0.5nM) andcysteine (10-6 M) were mixed by stirring for 12hrs. Excess cysteinewas removed by centrifugation at 8000 rpm for several minutes.By using UV-vis absorption spectra we estimated average 8-10cystein/gold nanoparticle.
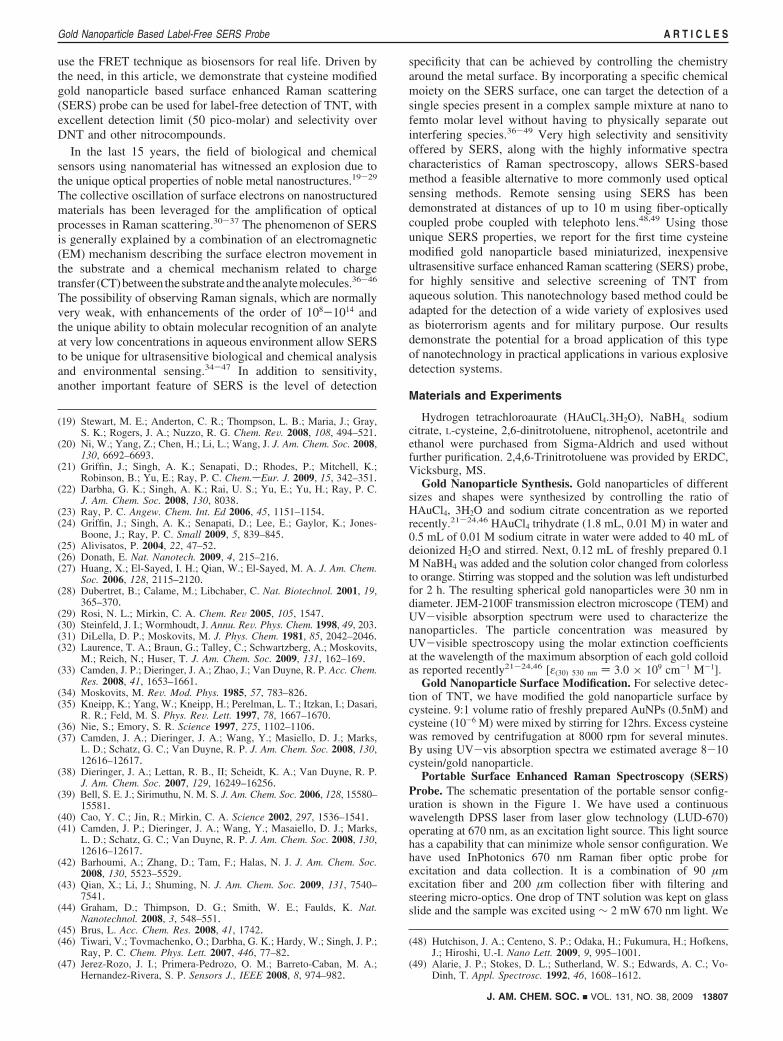
Portable Surface Enhanced Raman Spectroscopy (SERS)Probe. The schematic presentation of the portable sensor config-uration is shown in the Figure 1. We have used a continuouswavelength DPSS laser from laser glow technology (LUD-670)operating at 670 nm, as an excitation light source. This light sourcehas a capability that can minimize whole sensor configuration. Wehave used InPhotonics 670 nm Raman fiber optic probe forexcitation and data collection. It is a combination of 90 µmexcitation fiber and 200 µm collection fiber with filtering andsteering micro-optics. One drop of TNT solution was kept on glassslide and the sample was excited using ∼ 2 mW 670 nm light. We
(19) Stewart, M. E.; Anderton, C. R.; Thompson, L. B.; Maria, J.; Gray,S. K.; Rogers, J. A.; Nuzzo, R. G. Chem. ReV. 2008, 108, 494–521.
(20) Ni, W.; Yang, Z.; Chen, H.; Li, L.; Wang, J. J. Am. Chem. Soc. 2008,130, 6692–6693.
(21) Griffin, J.; Singh, A. K.; Senapati, D.; Rhodes, P.; Mitchell, K.;Robinson, B.; Yu, E.; Ray, P. C. Chem.sEur. J. 2009, 15, 342–351.
(22) Darbha, G. K.; Singh, A. K.; Rai, U. S.; Yu, E.; Yu, H.; Ray, P. C.J. Am. Chem. Soc. 2008, 130, 8038.
(23) Ray, P. C. Angew. Chem. Int. Ed 2006, 45, 1151–1154.(24) Griffin, J.; Singh, A. K.; Senapati, D.; Lee, E.; Gaylor, K.; Jones-
Boone, J.; Ray, P. C. Small 2009, 5, 839–845.(25) Alivisatos, P. 2004, 22, 47–52.(26) Donath, E. Nat. Nanotech. 2009, 4, 215–216.(27) Huang, X.; El-Sayed, I. H.; Qian, W.; El-Sayed, M. A. J. Am. Chem.
Soc. 2006, 128, 2115–2120.(28) Dubertret, B.; Calame, M.; Libchaber, C. Nat. Biotechnol. 2001, 19,
365–370.(29) Rosi, N. L.; Mirkin, C. A. Chem. ReV 2005, 105, 1547.(30) Steinfeld, J. I.; Wormhoudt, J. Annu. ReV. Phys. Chem. 1998, 49, 203.(31) DiLella, D. P.; Moskovits, M. J. Phys. Chem. 1981, 85, 2042–2046.(32) Laurence, T. A.; Braun, G.; Talley, C.; Schwartzberg, A.; Moskovits,
M.; Reich, N.; Huser, T. J. Am. Chem. Soc. 2009, 131, 162–169.(33) Camden, J. P.; Dieringer, J. A.; Zhao, J.; Van Duyne, R. P. Acc. Chem.
Res. 2008, 41, 1653–1661.(34) Moskovits, M. ReV. Mod. Phys. 1985, 57, 783–826.(35) Kneipp, K.; Yang, W.; Kneipp, H.; Perelman, L. T.; Itzkan, I.; Dasari,
R. R.; Feld, M. S. Phys. ReV. Lett. 1997, 78, 1667–1670.(36) Nie, S.; Emory, S. R. Science 1997, 275, 1102–1106.(37) Camden, J. A.; Dieringer, J. A.; Wang, Y.; Masiello, D. J.; Marks,
L. D.; Schatz, G. C.; Van Duyne, R. P. J. Am. Chem. Soc. 2008, 130,12616–12617.
(38) Dieringer, J. A.; Lettan, R. B., II; Scheidt, K. A.; Van Duyne, R. P.J. Am. Chem. Soc. 2007, 129, 16249–16256.
(39) Bell, S. E. J.; Sirimuthu, N. M. S. J. Am. Chem. Soc. 2006, 128, 15580–15581.
(40) Cao, Y. C.; Jin, R.; Mirkin, C. A. Science 2002, 297, 1536–1541.(41) Camden, J. P.; Dieringer, J. A.; Wang, Y.; Masaiello, D. J.; Marks,
L. D.; Schatz, G. C.; Van Duyne, R. P. J. Am. Chem. Soc. 2008, 130,12616–12617.
(42) Barhoumi, A.; Zhang, D.; Tam, F.; Halas, N. J. J. Am. Chem. Soc.2008, 130, 5523–5529.
(43) Qian, X.; Li, J.; Shuming, N. J. Am. Chem. Soc. 2009, 131, 7540–7541.
(44) Graham, D.; Thimpson, D. G.; Smith, W. E.; Faulds, K. Nat.Nanotechnol. 2008, 3, 548–551.
(45) Brus, L. Acc. Chem. Res. 2008, 41, 1742.(46) Tiwari, V.; Tovmachenko, O.; Darbha, G. K.; Hardy, W.; Singh, J. P.;
Ray, P. C. Chem. Phys. Lett. 2007, 446, 77–82.(47) Jerez-Rozo, J. I.; Primera-Pedrozo, O. M.; Barreto-Caban, M. A.;
Hernandez-Rivera, S. P. Sensors J., IEEE 2008, 8, 974–982.
(48) Hutchison, J. A.; Centeno, S. P.; Odaka, H.; Fukumura, H.; Hofkens,J.; Hiroshi, U.-I. Nano Lett. 2009, 9, 995–1001.
(49) Alarie, J. P.; Stokes, D. L.; Sutherland, W. S.; Edwards, A. C.; Vo-Dinh, T. Appl. Spectrosc. 1992, 46, 1608–1612.
J. AM. CHEM. SOC. 9 VOL. 131, NO. 38, 2009 13807
Gold Nanoparticle Based Label-Free SERS Probe A R T I C L E S

have used miniaturized QE65000 Scientific-grade Spectrometerfrom Ocean Optics as a Raman detector. The spectral response rangeof this mini Raman spectrometer is 220-3600 cm-1. It is equippedwith TE cooled 2048 pixel CCD and interfaced to computer via aUSB port. The Hamamatsu FFT-CCD detector used in the QE65000provides 90% quantum efficiency with high signal-to-noise andrapid signal processing speed as well as remarkable sensitivity forlow-light level applications. Raman spectrum was collected withOcean Optics data acquisition SpectraSuite spectroscopy software.
Results and Discussion
Our detection is based on the fact that in the presence ofTNT, cysteine-conjugated gold nanoparticles forms Meisenhe-imer complex (as shown in Figure 2A) and due to electrostaticinteraction between gold nanoparticle bound Meisenheimercomplex and cysteine bound gold nanoparticle, they undergoaggregation (as shown in Figure 2B).
As a result, it formed several hot spots and provided asignificant enhancement of the Raman signal intensity by severalorders of magnitude (109) through electromagnetic field en-hancements. In our study, we have used cysteine as the primaryamine as well as stabilizer for the gold nanoparticles. After theaddition of cysteine to freshly prepared citrate-stabilized goldnanoparticles, the nanosurfaces were modified by cysteinethrough the Au-S covalent bond (as shown in Figure 2A). Theaddition of cysteine does not change the color and absorptionspectrum of the gold nanoparticles remains the same, whichindicates that there is no aggregation when 9:1 volume ratio offreshly prepared AuNPs (0.5 nM) and cysteine (10-6 M) wasstirred. TEM image of cysteine modified gold nanoparticle, asshown in Figure 2E, also confirmed it. Now when we addedTNT to cysteine modified gold nanoparticle, it undergoesaggregation (as shown in Figure 2F). TNT is known to formMeisenheimer complex with cysteine.50,51 Recently Fant etal.50,51 has shown using 13C NMR spectroscopy that TNTchemically forms a Meisenheimer complex with cysteine.Meisenheimer complexes (as shown in Figure 3A) are σ-com-plexes formed by covalent addition of nucleophiles to a ringcarbon atom of electron-deficient aromatic substrates. Since TNTis typically electron-deficient due to the strong electron-withdrawing effect of the nitro group, TNT is able to formMeisenheimer complexes even in the gas phase.51 When we
added 10 mM cysteine and 1 mM TNT, using condition similarto NMR experiments that has been performed by Fant et. al,50
the color of TNT solution become red (as shown in Figure 3B),which indicates the formation of Meisenheimer complex. TheUV-vis spectra (as shown in Figure 3C) of the complex showstwo new absorption bands appears at 525 and 630 nm, due tothe formation of Meisenheimer complex. We found that byvarying the concentration of TNT (25 µM to 1 mM), one cantune the visible absorption band intensity of Meisenheimercomplex. This allows us to find the association constant betweenTNT and cysteine by monitoring the absorption band ofMeisenheimer complex at different concentrations of TNT. Ourmeasured association constant was 9.4 × 10⁴, which is quitesimilar to the reported association constant for other amines.52
To understand the structure of Meisenheimer complex, wealso performed normal Raman spectra of 10 mM TNT and thatof Meisenheimer complex (as shown in Figure 3D). Comparisonof both spectra clearly shows a strong broadband appears around2900 cm-1 for Meisenheimer complex and it is due to the NH2
+
symmetric stretch, C-H stretching and CH2 asymmetric stretch-ing. Figure 2D shows the SERS spectra of 50 nM to 800 pMTNT, upon addition into cysteine modified gold nanoparticle.The SERS spectrum (as shown in Figure 2D) exhibits severalprominent TNT peaks. Peak at 1615 cm-1 is due to the CdCaromatic stretching vibration. Strong Raman band at 1360.1cm-1 is due to the NO2 symmetric stretching vibration and weakband at 1533.9 cm-1 is due to the NO2 asymmetric stretchingvibration. Other observed Raman bands such as 1210.5 cm-1
is due to C6H2-C vibration, 1026 cm-1 is due to CH3
deformation, 940 cm-1 and 909 cm-1 are due to C-N stretchingvibration and 790 cm-1 is due to C-H out-of-plane bend. Allof them are due to TNT vibration.53,54
In our SERS spectra (Figure 2D), we also noted a clearlybroad Raman band around 2900 cm-1, which indicates theformation of Meisenheimer complex (as shown in Figure 2A).So our SERS spectra also clearly show the formation of smallamount of Meisenheimer complex even at the nM TNTconcentration. Using our measured association constant, wecalculated that the amount of Meisenheimer complex would be∼0.1 nM, when 10 nM TNT is mixed with 100 nM cysteinemodified gold nanoparticle. Since TNT concentration (nM) is100 times more than the Meisenheimer complex, the SERSspectra shows strong TNT vibration and weak vibrational bandfrom Meisenheimer complex.
Our pH measurement shows that after mixing of TNT withcysteine modified gold nanoparticle, pH of the solution becomes6.5. In this pH, cysteine remains in Zwitterionic form, as shownin Figure 2A and B. In this situation, gold nanoparticle attachedwith Meisenheimer complex can undergo aggregation withcysteine modified gold nanoparticle via electrostatic interactionand hydrogen bonding (as shown in Figure 2B). We believethat Meisenheimer complex formation and this electrostaticinteraction help cysteine modified gold nanoparticles to ag-gregate in the presence of TNT. Cysteine modified goldnanoparticle, is known to aggregate through electrostatic andhydrogen bonding interaction, at higher concentrations (10-4
M cysteine or above).55,56 Since we have used 10-7 M of
(50) Fant, F.; De Sloovere, A.; Matthijsen, K.; Marle, C.; Fantroussi El,S.; Verstraete, W. EnViron. Pollut. 2001, 503, 507.
(51) Jehuda, Y.; Johonson, V. J.; Bernier, R. U.; Yost, A. R.; Mayfield,T. H.; Mahone, W. C.; Vorbeck, C. J. Mass Spect. 2005, 30, 715–722.
(52) Sharma, S. P.; Lahiri, S. C. Spectra. Chem. Acta. 2008, 70, 144–153.(53) Gupta, N.; Dahmani, R. Spectra. Chem. Acta 2000, 56, 1453–1456.(54) Kneipp, K.; Wang, Y.; Dasari, R. R.; Feld, M. S.; Gilbert, B. D.; Janni,
J.; Steinfeld, J. I. Spectra. Chim. Acta 1995, 51, 2171–2175.(55) Zhong, Z.; Subramanian, A. S.; Highfield, J.; Carpenter, K.; Gedanken,
A. Chem.sEur. J. 2005, 11, 1473–1478.
Figure 1. Schematic representation of our portable SERS probe, used forTNT detection.
13808 J. AM. CHEM. SOC. 9 VOL. 131, NO. 38, 2009
A R T I C L E S Dasary et al.

cysteine, we have not observed any aggregation, when we addedcysteine to gold nanoparticle solution, as shown in Figure 2E.But in the presence of TNT, due to the formation of Meisen-heimer complex, it undergoes aggregation though the concentra-tion of Meisenheimer complex is very low. This indicates thatMeisenheimer complex bound gold nanoparticle has strongability to form aggregate with normal cysteine bound goldnanoparticle in comparison to the formation of aggregate bycysteine bound gold nanoparticle with itself. Figure 2E and Fshows the TEM image of cysteine modified gold nanoparticlein the presence and the absence of TNT. Aggregation in thepresence of TNT ions results in both a substantial shift in theplasmon band energy to longer wavelength and a red-to-bluecolor change (as shown in Figure 4A and B). The largest Ramanscattering enhancements, even single molecule SERS, have beendescribed for molecules residing in the fractal space betweenaggregated colloidal nanoparticles.36-47 This is attributed toplasmonic coupling between nanoparticles in close proximity,which results in huge local electromagnetic field enhancementsin these confined junctions or SERS “hot spots”.36-47 So ourdata clearly show that TNT helps to generate hot spots throughaggregation by cysteine modified gold nanoparticle surface andas result, we have noted about 9 orders of magnitude enhance-
ment of Raman signal (as shown in Figure 2C and D). Tounderstand whether aggregation is necessary to observe strongSERS spectra from nM region TNT, we also did gold nano-particle adsorbed TNT SERS experiment, in the presence of0.1 M NaCl. We and other groups20-27 have reported in severalpublications that sodium chloride helps gold nanoparticle toaggregate. As shown in Figure 2G, the SERS spectra looks verysimilar for 150 nM TNT adsorbed gold nanoparticle in thepresence of salt and the same concentration of TNT in thepresence of cysteine bound gold nanoparticle. Only exceptionis the presence of broadband around 2900 cm-1, due to theformation of Meisenheimer complex in the presence cysteinemodified gold nanoparticle. Since after aggregation, the plasmonband moves from visible to near-infrared region, partial SERSenhancements can be due to the better overlap between nanoaggregate plasmon band with the excitation source. Due to theresonance, in the case of nano aggregate, EM contribution canbe by 2-3 orders of magnitude higher. Our time dependentSERS data indicate that this nanobased SERS assay is rapid,takes less than 10 min from TNT binding to detection andanalysis, as well as it is highly convenient. When we addedTNT to pure gold nanoparticle solution, we have not observedany color change (as shown in Figure 3A) and also our TEMexperiment shows that there is no aggregation. As a result, hotspot has not been generated and we have not observed any TNT(56) Lu, C.; Zu, Y. Chem. Comm. 2007, 3871–3973.
Figure 2. (A) Schematic representation of the formation of Meisenheimer complex between cysteine modified gold nanoparticle and TNT. (B) Schematicrepresentation for the possible cross-linking between gold nanoparticle bound Meisenheimer complex with gold nanoparticle bound cysteine, (C) SERSspectra from gold nanoparticle + TNT (50 × 10-7 M), (D) SERS spectra from cysteine modified gold nanoparticle + TNT (50 nM - 800 pM TNT), (E)TEM image of cysteine modified gold nanoparticle, (F) TEM image demonstrating aggregation of gold nanoparticle in the presence of TNT, (G) SERSspectra from gold nanoparticle + TNT (150 × 10-9 M) in presence of 0.2 M NaCl and SERS spectra from cysteine modified gold nanoparticle + TNT (150nM).
J. AM. CHEM. SOC. 9 VOL. 131, NO. 38, 2009 13809
Gold Nanoparticle Based Label-Free SERS Probe A R T I C L E S

SERS signal from TNT adsorbed gold nanoparticle surface, asshown in Figure 2C. So our result clearly shows that amineligand modified gold nanoparticle is a must to generate hot spotin the presence of TNT.
The Raman enhancement, G, is measured experimentally bydirect comparison as shown below,
where Mbulk is the number of molecules sampled in the bulk,Mads is the number of molecules adsorbed and sampled on theSERS-active substrate, ISERS is the intensity of a vibrational modein the surface-enhanced spectrum, and IRaman is the intensity ofthe same mode in the Raman spectrum. All spectra arenormalized for integration time. An enhancement factor esti-mated from the SERS signal and general Raman signal ratiofor 1360 cm-1 band (NO2 symmetric stretching vibration) isapproximately 1 × 10⁹. No significant changes in Raman
Figure 3. (A) Schematic representation of the formation of Meisenheimercomplex between cysteine and TNT, (B) Photograph showing how TNTchanges the color when it forms Meisenheimer complex with cysteine (10mM cysteine + 1 mM TNT), (1) 1 mM only TNT, (2) Meisenheimercomplex after addition of 10 mM cysteine in 1 mM TNT), (C) absorptionspectra demonstrating new peaks at 520 and 630 nm due to the formationof Meisenheimer complex in presence of 1 mM TNT, we have not observedany visible band between 450 to 800 nm in presence of 100 mM DNT orNP. (D) Normal Raman spectra from 10 mM TNT and Meisenheimercomplex.
G ) [ISERS]/[IRaman] × [Mbulk]/[Mads]
Figure 4. (A) Absorption spectral changes of cysteine modified goldnanoparticle in the presence of TNT. Absorption spectra remain samein the presence of DNT or nitro phenol (NP). (B) Photograph showingcolorimetric image of gold nanoparticle in the presence of (1) only goldnanoparticle, (2) cysteine modification, (3) cysteine modified gold nano-particle + DNT (50 × 10-6 M), (4) cysteine modified gold nanoparticle+ NP (50 × 10-6 M), (5) cysteine modified gold nanoparticle + TNT((50 × 10-9 M). Color remains same in the presence of DNT or nitrophenol. (C) Plot demonstrating SERS spectra in the presence of TNT,DNT and NP, (D) TEM image of cysteine modified gold nanoparticlein the presence of DNT ((50 × 10-6 M), (E) TEM image of cysteinemodified gold nanoparticle in the presence of TNT (50 × 10-9 M). (F)Photograph showing formation of Meisenheimer complex in presenceof TNT (500 µM) only. DNT and NP do not form Meisenheimer complexeven at 100 mM concentration.
13810 J. AM. CHEM. SOC. 9 VOL. 131, NO. 38, 2009
A R T I C L E S Dasary et al.

frequencies are observed in comparison with the correspondingSERS and Raman bands.
To understand whether our assay is highly selective, we havealso performed how SERS intensity changes upon addition of2,4 -dinitrotoluene (DNT), nitrobenzene and nitrophenol. Figure4C shows the SERS response of our probe in the presence ofvarious nitro-compounds. Our result clearly shows no Ramansignal from DNT and nitrophenol, which shows excellentselectivity of our probe over DNT, nitro-benzene and nitrophenol. Figure 4A shows the absorption change, Figure 4Bdemonstrates the colorimetric response and Figure 4D,E showsthe TEM images in the presence of various nitro aromaticcompounds.
Our absorption and colorimetric study clearly demonstratesthat cysteine modified gold nanoparticle does not undergoaggregation in the presence of DNT and other nitro compounds,which is also confirmed by TEM experiments. To understandthe selectivity over DNT and nitro compounds, we examinedwhether cysteine forms Meisenheimer complex in the presenceof DNT and nitro phenol. As shown in Figure 4F, we have notobserved red color Meisenheimer complex even at the concen-tration of 100 mM DNT and NP, where as we see clearly strongred color Meisenheimer complex in the presence of 500 µMTNT. Even our absorption spectra measurements (as shown inFigure 3C) clearly show that there are no visible bands between450 and 800 nm in the presence of DNT or NP, whereas weobserve a very strong absorption bands with peaks at 525 and630 nm in the presence of TNT, which is due to the formationof Meisenheimer complex. So our experimental results clearlydemonstrate that DNT and NP are not able to form Meisenhe-imer complex, even at 100 mM concentration, whereas TNTcan form Meisenheimer complex even at the concentration of500 µM. In the case of DNT, it is most probably possible todeprotonate at the methyl group. But due to the lack of -NO2
group in fourth position of the benzene ring, partial negativecharge may not be distributed throughout the DNT molecularring. Due to the lack of enough anionic charge, DNT may notform Meisenheimer complex and as a result, aggregation ofcysteine modified gold nanoparticles is prevented. The samephenomenon can explain why nitro phenol is not formingaggregated cysteine modified gold nanoparticles. So our resultclearly shows excellent selectivity of our probe over DNT andnitro phenol.
For real life application, in environmental sample, there canbe several impurities due to the heavy metal ions. As a result,we also tested the selectivity of our SERS probe in the presenceof alkali, alkaline earth (Li+, Na+, K+, Mg2+, Ca2+) andtransition heavy metal ions (Pb2+, Pb+, Mn2+, Fe2+, Cu2+, Ni2+,Zn2+, Cd2+). Since aggregation is necessary for hot spotformation, we have measured the aggregate absorbance between(630-900) nm, upon addition of other impurities. Figure 5shows the aggregated absorbance response in the presence ofvarious nitro aromatic compounds e.g. DNT, nitro benzene(NB), nitro phenol (NP) and other environmentally relevantmetal ions. Our result shows excellent selectivity over othernitro compounds, alkaline, alkaline earth (Li+, Na+, K+, Mg2+,Ca2+) and transition heavy metal ions (Pb2+, Pb+, Mn2+, Fe2+,Cu2+, Ni2+, Zn2+, Cd2+). So our experimental results clearlydemonstrate that our SERS probe can be used for the detectionof TNT from environmental sample.
To evaluate the sensitivity of our SERS probe, differentconcentrations of TNT from one stock solution were evaluated.As shown in Figure 5, the SERS intensity at 1360 cm-1 due to
NO2 symmetric stretching vibration is highly sensitive to theconcentration of TNT. Our experimental results (as shown inFigure 6) clearly demonstrate that the detection capability ofour SERS probe is as low as 2 pM TNT. To the best of ourknowledge, the detection limit achieved with our SERS probe,represents the lowest among the reported methods. Our experi-mental results also show that as we increase the concentrationof TNT above 10 nM, the SERS intensity starts decreasing. Atextremely low concentration, the surface coverage by TNT issubmonolayer and in the absence of sufficient scatteringmolecules the SERS signal is weak. With increasing concentra-tion, as the surface coverage increases, the SERS intensityincreases and attains maximum intensity at monolayer coverage.With further increase in concentration of the adsorbates, multiplelayers are formed and SERS signal decreases in intensity. Itmay be due to the fact that as we increase the concentration ofTNT, aggregates or cluster size increases. Since it is knownthat small cluster is better for hot spot formation, increasingcluster size may decrease the number of hot spots and as a result,intensity decreases after certain concentration of TNT.
Conclusion
In conclusion, in this article, we have demonstrated for thefirst time a label-free, highly selective and ultra sensitive SERSprobe TNT recognition in 2 pM level in aqueous solution. Wehave shown that due to the formation of Meisenheimer complexbetween TNT and cysteine, gold nanoparticles undergo ag-gregation in the presence of TNT via electrostatic interactionbetween Meisenheimer complex bound gold nanoparticle andcysteine modified gold nanoparticle. As a result, it formed
Figure 5. Demonstrating selectivity of our SERS probe over other nitroaromatic compounds and heavy metal ions. It shows how the aggregateabsorbance varies with the addition TNT (500 × 10-9 M) and otherimpurities (50 × 10-6 M).
Figure 6. Plot demonstrating how Raman intensity at 1360 cm-1 changesupon addition of different concentration of TNT.
J. AM. CHEM. SOC. 9 VOL. 131, NO. 38, 2009 13811
Gold Nanoparticle Based Label-Free SERS Probe A R T I C L E S

several hot spots and provided a significant enhancement of theRaman signal intensity by 9 orders of magnitude throughelectromagnetic field enhancements. Our experimental resultsshow that TNT can be detected quickly and accurately withoutany dye tagging in 2 pM level with excellent discriminationagainst other nitro aromatic compounds and heavy metals. ThisSERS assay is rapid and takes less than 10 min from TNTbinding to detection and analysis. Our experimental resultsreported here show a new possibility of rapid, easy and reliablediagnosis of TNT from environmental sample by measuring theTNT SERS intensity. It is probably possible to improve theSERS sensitivity by several orders of magnitudes by choosing
proper materials for generating hot spot and using betterdetection systems. Although we have shown promising advancesin SERS assay, we still need a much greater understanding ofhow to control surface architecture to stabilize and maximizethe SERS response.
Acknowledgment. Dr. Ray thanks DOD grant # W 912HZ-06-C-0057, ARO grant # W911NF-06-1-0512 and NSF-PREMgrant # DMR-0611539, for their generous funding. We also thankreviewer whose valuable suggestions improved the quality of themanuscript.
JA905134D
13812 J. AM. CHEM. SOC. 9 VOL. 131, NO. 38, 2009
A R T I C L E S Dasary et al.