
Comparison of three methods to improve adherence of thin gold films to glass substrates and their...
12
862 Volume 53, Number 7, 1999 APPLIED SPECTROSCOPY 0003-7028 / 99 / 5307-0862$2.00 / 0 q 1999 Society for Applied Spectroscopy Comparison of Three Methods to Improve Adherence of Thin Gold Films to Glass Substrates and Their Effect on the SERS Response PAMELA A. MOSIER-BOSS* and STEVEN H. LIEBERMAN SPAWAR Systems Center San Diego, San Diego, California 92152-5000 Vapor-deposited Ag and Au ® lms exhibit high surface-enhanced Raman scattering (SERS) sensitivity. With thin metal ® lms, SERS spectra can be obtained by using a ``backside’’ con® guration in which the laser light is focused through the substrate onto the metal ® lm/liquid (or gas) interface. Use of the ``backside’’ con® guration is particularly advantageous for obtaining SERS spectra of aqueous samples. Because excitation occurs only at the metal/® lm/liquid in- terface, both attenuation of the signal by water and ¯ uorescence interference are minimized. However, noble metals, such as Ag and Au, do not adhere well to glass substrates, and signi® cant exposure to water damages the ® lms. In this paper, three methods of adhering Au to glass and their effect on the SERS response are examined. The methods include the use of a buffer metal between the SERS- active metal ® lm and the glass substrate; the use of (3-mercapto- propyl)trimethoxysilane (MCTMS); and the use of organometallic paints. Of the methods examined, the best ® lm adherence and SERS response was obtained by using MCTMS to bind the metal ® lm to a chemically etched glass slide. Index Headings: Adhesion; SERS; Self-assembled monolayers. INTRODUCTION In the 1970s, 1,2 it was discovered that Raman scattering from molecules adsorbed on such noble metals as silver, copper, and gold can be enhanced by as much as 10 6 to 10 7 . Since its discovery, surface-enhanced Raman spec- troscopy (SERS) has been studied extensively to achieve a better understanding of the enhancement process. It is believed that both chemical and physical enhancement mechanisms are important in SERS. 3,4 The chemical en- hancement mechanism involves changes in the polariz- ability of the adsorbate molecule resulting from interac- tions with the surface. These interactions include charge transfer or covalent bonding between the adsorbate and the surface. The physical enhancement mechanism, or electromagnetic theory, 5 involves the interaction of ex- citation photons with the metal surface. According to this theory, the Raman enhancement is associated with am- pli® ed local electromagnetic ® elds at the surface. These ® elds originate from roughness-induced excitation of sur- face plasmons and from the concentration of the electric ® eld lines near high-curvature points of the surface. Initially, the SERS technique was used as a means to probe adsorption of adsorbates at metal interfaces both in electrochemical and gas-phase environments. 3 This technique has proven useful in deducing the effects of interfacial structure and reactivity on the adsorption pro- cess. 6 However, the sensitivity of the technique as well as its exceptional spectral selectivity has made SERS at- Received 22 October 1998; accepted 16 February 1999. * Author to whom correspondence should be sent. tractive for a broad range of analytical applications. 3,5 Vo- Dinh et al. demonstrated that SERS can be used for trace organic analysis. 7 SERS can be used also as a detection method in gas chromatography, 8,9 liquid chromatogra- phy, 10 and thin-layer chromatography. 11 Electrochemical SERS 12,13 and SERS of chemically modi® ed surfaces 14,15 have been used to detect aromatic compounds and chlo- rinated hydrocarbons, organic contaminants of environ- mental concern, in the parts-per-million concentration range. The observation of SERS for molecules adsorbed on metal surfaces requires that the metal surface be rough- ened. The most common types of SERS substrates in- clude electrodes; colloidal sols; island ® lms prepared by vacuum deposition of metal; and metal-covered surfaces having submicrometer structures 16 such as microspheres, monolithic posts, etc. Recently, Norrod et al. 17 evaluated the sensitivity, limit of detection, stability, and ease of preparation of ® ve Ag SERS substrates. The substrates examined were vapor-deposited Ag ® lms, electrochemi- cally roughened Ag electrodes, nitric acid-etched Ag foils, Tollens-produced Ag ® lms, and photoreduced Ag ® lms on TiO 2 . Of these substrates, annealed vapor-de- posited Ag ® lms exhibited the best sensitivity and lowest limit of detection. The substrates remained SERS active for days after preparation. If stored under vacuum, the substrates maintain high SERS activity over extended pe- riods of time. However, noble metals such as Au and Ag do not adhere well to glass. 18 Consequently, signi® cant exposure to water damages the ® lms, limiting their ap- plicability. In this paper, we examine three methods of adhering Au to glass and their effect on the SERS re- sponse. The methods include (1) the use of a buffer met- al, such as Ti, W, or Cr, between the Au ® lm and the glass substrate, 18 (2) the use of (3-mercaptopro- pyl)trimethoxysilane (MCTMS), 19 and (3) the use of or- ganometallic paints. Although no experiments were con- ducted using Ag, we would expect similar results as ob- served for Au. EXPERIMENTAL Preparation of Thiol-Coated Gold Films. Gold Films Vapor-Deposited onto Glass . Substrates were approxi- mately 2.5 by 1.5 cm rectangles of clear or white glass cut from 2.5 by 7.5 cm microscope slides (clear slides from VWR and white slides from Erie Scienti® c Co.). Prior to vacuum deposition of metal, the glass substrates were cleaned by immersion in hot concentrated nitric acid for 30 min. After rinsing thoroughly with deionized wa- ter, the substrates were immersed in hot methanol for 30
-
Upload
bluejojooy -
Category
Documents
-
view
3 -
download
0
Transcript of Comparison of three methods to improve adherence of thin gold films to glass substrates and their...
862 Volume 53, Number 7, 1999 APPLIED SPECTROSCOPY0003-7028 / 99 / 5307-0862$2.00 / 0
q 1999 Society for Applied Spectroscopy
Comparison of Three Methods to Improve Adherence ofThin Gold Films to Glass Substrates andTheir Effect on the SERS Response
PAMELA A. MOSIER-BOSS* and STEVEN H. LIEBERMANSPAWAR Systems Center San Diego, San Diego, California 92152-5000
Vapor-deposited Ag and Au ® lms exhibit high surface-enhanced
Raman scattering (SERS) sensitivity. With thin metal ® lms, SERSspectra can be obtained by using a ``backside’’ con ® guration in
which the laser light is focused through the substrate onto the metal
® lm/liquid (or gas) interface. Use of the ``backside’’ con® gurationis particularly advantageous for obtaining SERS spectra of aqueous
samples. Because excitation occurs only at the metal/® lm/liquid in-
terface, both attenuation of the signal by water and ¯ uorescenceinterference are minimized. However, noble metals, such as Ag and
Au, do not adhere well to glass substrates, and signi® cant exposure
to water damages the ® lms. In this paper, three methods of adheringAu to glass and their effect on the SERS response are examined.
The methods include the use of a buffer metal between the SERS-
active metal ® lm and the glass substrate; the use of (3-mercapto-propyl)trimethoxysilane (MCTMS); and the use of organometallic
paints. Of the methods examined, the best ® lm adherence and SERS
response was obtained by using MCTMS to bind the metal ® lm toa chemically etched glass slide.
Index Headings: Adhesion; SERS; Self-assembled monolayers.
INTRODUCTION
In the 1970s,1,2 it was discovered that Raman scatteringfrom molecules adsorbed on such noble metals as silver,copper, and gold can be enhanced by as much as 10 6 to107. Since its discovery, surface-enhanced Raman spec-troscopy (SERS) has been studied extensively to achievea better understanding of the enhancement process. It isbelieved that both chemical and physical enhancementmechanisms are important in SERS.3,4 The chemical en-hancement mechanism involves changes in the polariz-ability of the adsorbate molecule resulting from interac-tions with the surface. These interactions include chargetransfer or covalent bonding between the adsorbate andthe surface. The physical enhancement mechanism, orelectromagnetic theory,5 involves the interaction of ex-citation photons with the metal surface. According to thistheory, the Raman enhancement is associated with am-pli® ed local electromagnetic ® elds at the surface. These® elds originate from roughness-induced excitation of sur-face plasmons and from the concentration of the electric® eld lines near high-curvature points of the surface.
Initially, the SERS technique was used as a means toprobe adsorption of adsorbates at metal interfaces bothin electrochemical and gas-phase environments.3 Thistechnique has proven useful in deducing the effects ofinterfacial structure and reactivity on the adsorption pro-cess.6 However, the sensitivity of the technique as wellas its exceptional spectral selectivity has made SERS at-
Received 22 October 1998; accepted 16 February 1999.* Author to whom correspondence should be sent.
tractive for a broad range of analytical applications.3,5 Vo-Dinh et al. demonstrated that SERS can be used for traceorganic analysis.7 SERS can be used also as a detectionmethod in gas chromatography,8,9 liquid chromatogra-phy,10 and thin-layer chromatography.11 ElectrochemicalSERS12,13 and SERS of chemically modi® ed surfaces14,15
have been used to detect aromatic compounds and chlo-rinated hydrocarbons, organic contaminants of environ-mental concern, in the parts-per-million concentrationrange.
The observation of SERS for molecules adsorbed onmetal surfaces requires that the metal surface be rough-ened. The most common types of SERS substrates in-clude electrodes; colloidal sols; island ® lms prepared byvacuum deposition of metal; and metal-covered surfaceshaving submicrometer structures16 such as microspheres,monolithic posts, etc. Recently, Norrod et al.17 evaluatedthe sensitivity, limit of detection, stability, and ease ofpreparation of ® ve Ag SERS substrates. The substratesexamined were vapor-deposited Ag ® lms, electrochemi-cally roughened Ag electrodes, nitric acid-etched Agfoils, Tollens-produced Ag ® lms, and photoreduced Ag® lms on TiO2. Of these substrates, annealed vapor-de-posited Ag ® lms exhibited the best sensitivity and lowestlimit of detection. The substrates remained SERS activefor days after preparation. If stored under vacuum, thesubstrates maintain high SERS activity over extended pe-riods of time. However, noble metals such as Au and Agdo not adhere well to glass.18 Consequently, signi® cantexposure to water damages the ® lms, limiting their ap-plicability. In this paper, we examine three methods ofadhering Au to glass and their effect on the SERS re-sponse. The methods include (1) the use of a buffer met-al, such as Ti, W, or Cr, between the Au ® lm and theglass substrate, 18 (2) the use of (3-m ercaptopro-pyl)trimethoxysilane (MCTMS),19 and (3) the use of or-ganometallic paints. Although no experiments were con-ducted using Ag, we would expect similar results as ob-served for Au.
EXPERIMENTAL
Preparation of Thiol-Coated Gold Films. Gold FilmsVapor-Deposited onto Glass . Substrates were approxi-mately 2.5 by 1.5 cm rectangles of clear or white glasscut from 2.5 by 7.5 cm microscope slides (clear slidesfrom VWR and white slides from Erie Scienti® c Co.).Prior to vacuum deposition of metal, the glass substrateswere cleaned by immersion in hot concentrated nitric acidfor 30 min. After rinsing thoroughly with deionized wa-ter, the substrates were immersed in hot methanol for 30
APPLIED SPECTROSCOPY 863
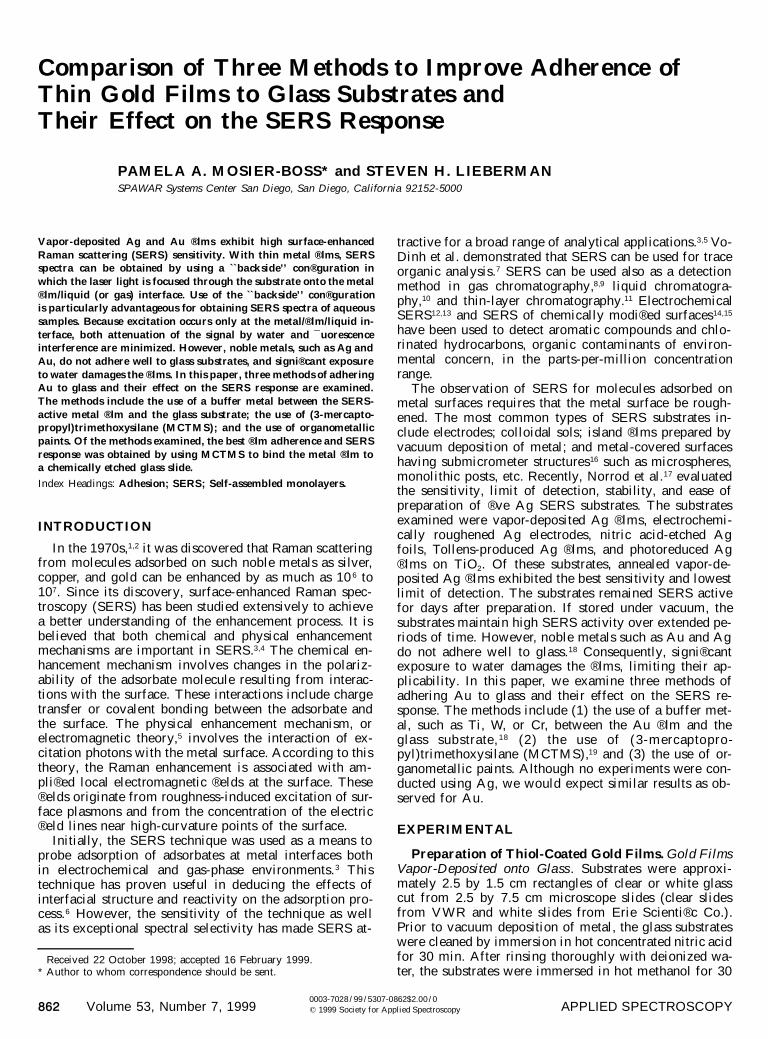
FIG. 1. Schematic diagram of the experimental arrangement used toobtain SERS spectra by using the ``backside’ ’ con® guration. The com-ponents are described in the text.
min, then hot acetone for 30 min. The substrates wereused immediately after air drying. Gold was depositedonto the cleaned glass substrates in a Veeco Model EC200 vapor deposition system by using gold wire (Aldrich,99.99% pure) placed inside a tungsten boat. The sub-strates were placed on a stainless steel mount that waspositioned ; 30 cm above the tungsten boat. Rather thanbeing parallel to the tungsten boat, the substrates wereslightly tilted at a 5 8 angle. After vacuum deposition, met-al ® lm thickness and roughness were measured by usinga Dektak3 ST surface pro® ler (Veeco Sloan Technology).After preparation, the substrates were placed in diluteethanolic thiol solutions and allowed to react for 24 h toform a durable self-assembled monolayer (SAM) on thegold ® lm. The thiols were purchased from Aldrich andwere used without further puri® cation. After reaction wascomplete, coated substrates were rinsed in ethanol andstored in HPLC-grade water (Aldrich).
Frosted substrates were prepared by etching clear, glasssubstrates (prepared from clear, glass, microscope slides,VWR) with a commercial etchant (Velvet Etching Cream,McKay International). After etching for 1 min, the sub-strates were thoroughly rinsed with deionized water priorto the cleaning and vacuum deposition procedures andreaction with thiols described (vide supra). Microscopicexamination of the frosted glass substrates and commer-cial white glass was done with the use of a Zeiss Ultra-phot II camera microscope.
Buffer ® lms of Ti (Aldrich) or Cr (Aldrich) were vac-uum-deposited on the glass substrates prior to depositionof the gold ® lm. The Veeco Model EC-200 vapor depo-sition system is a one-® lament system. Consequently,vacuum had to be interrupted between deposition of thebuffer metal and gold. To avoid alloying of the metalsand cross contamination, we used separate tungsten boatsfor the buffer metals and gold. The substates were thenimmersed in dilute ethanolic thiol solutions to form theSAM.
Clean, glass substrates were derivatized in a 1:10 mix-ture by volume of (3-mercaptopropyl)trimethoxysilane(95%, Aldrich) in ethanol for 24 h. After the substrateswere thoroughly rinsed in ethanol and allowed to air dry,gold ® lms were vacuum deposited as described (vide su-pra). After deposition of the gold ® lms, the substrateswere immersed in a dilute ethanolic thiol solution as de-scribed previously.
Gold Films Thermally Reduced on Glass Substrates .Clear, glass substrates were prepared and cleaned as de-scribed (vide supra). After preparation, a gold electrodeon one corner of the substrate was prepared by thermallyreducing Liquid Bright Gold (Alfa Aesar) at 590 8 C usinga Lindberg programmable oven. The gold electrode wasconductive and nontransparent. The Liquid Bright Goldwas diluted 1:1 with toluene. A P-6000 Spin Coater (Spe-cialty Coating Systems, Inc.), operating at 1180 rpm for45 s, was used to spin coat the electroded substrate witha thin layer of diluted Liquid Bright Gold. The gold wasthermally reduced at 590 8 C. The resultant thin ® lm wasblue in color and transparent. The resistance of the ® lmwas on the order of 40±100 V . As prepared, the thin ® lmwas not SERS active. The substrate was immersed, up tothe conductive gold electrode on the corner of the sub-strate, in an aqueous 0.1 KCl solution. An alligator clip
established Ohmic contact to the gold electrode. A Ptmesh counter electrode was placed parallel to the sub-strate. A distance of approximately 1 cm separated thesubstrate and the counter electrode. A Ag/AgCl referenceelectrode was positioned near the substrate. The gold ® lmwas electrochemically roughened in the manner describedby Weaver et al.20 With the use of a PAR 173 potentiostatunder computer control, the Au ® lm was roughened byapplying 25 successive oxidation-reduction cycles(ORCs) from 2 300 to 1200 mV vs. the reference elec-trode at a sweep rate of 500 mv s 2 1. For each scan, thepotential was held at 1.3 s at the positive limit and 30 sat the negative limit.
After electrochemical roughening, the substrate wasrinsed with water and then ethanol. The substrate wasthen immersed in a dilute thiol solution in ethanol andallowed to react for approximately 24 h to form a SAM.Before use the substrate was thoroughly rinsed with eth-anol to remove any unreacted thiol. Thiol-treated sub-strates were stored in water between uses.
Evaluation of Thiol-Coated SERS Substrates. Ra-man spectra were obtained by using either a ® ber-opticsystem shown in Fig. 1 or the Raman Solution 852 sys-tem from Detection Limit. The orientation of the opticalcomponents of the ® ber-optic system shown in Fig. 1 issimilar to that of Carrabba et al.21 Low OH, silica/silicaclad optical ® bers were used. The excitation source wasa 852 nm DBR laser (Spectra Diode Laser, Inc., ModelSDL-5712-H1) complete with heat sink (Spectra DiodeLaser, Inc.) and optical isolator (Optics for Research).The 852 nm line was focused into the 200 m m diameterexcitation ® ber. The light was collimated at the end ofthe excitation ® ber by using a 6.4 mm focal length plano-
864 Volume 53, Number 7, 1999
convex lens (Newport, KPX010AR.16). Interferencesdue to ® ber Raman emissions were removed by a band-pass ® lter (Chroma Technology, P/N 852BP) and a di-chroic mirror (Chroma Technology, P/N 852RDM). Theexcitation light was focused onto the coated SERS sub-strate by using a fused-silica, plano-convex lens with a12.7 mm focal length (Newport, SPX010). Scattered lightwas collected by the focusing lens. The dichroic mirrors(Chroma Technology, P/N 852RDM) directed the scat-tered light to the 365 m m diameter collection ® ber. Alongpass ® l ter (Chrom a Technology, P/N 852REF)blocked the laser line, thereby preventing excitation ofRaman emissions in the collection ® ber. A plano-convexlens (Newport, KPX010AR.16) focused the scatteredlight into the collection ® ber. To match the f numbers ofthe collection ® ber ( f 5 2.2) to that of the spectrometer( f 5 4), we used an input coupler (Detection Limits, Inc.,Model SIC-1000-Chromex). A longpass ® lter (ChromaTechnology, P/N 852REF) was used inside the spectrom-eter to reject the Rayleigh line. The spectrograph (Chro-mex) uses a 600 grooves/mm grating blazed at 750 nmand has a 250 mm focal length. A Princeton Instrumentsthermally cooled charge-coupled device (CCD) with con-troller (Model TE/CCD-1153EM with ST-135) was usedfor detection.
The Raman Solution 852 system (Detection Limit) iscomprised of a 100 mW DBR frequency-stabilized diodelaser operating at 852 nm and a ® ber-optic mini Ramanprobe. The mini probe houses the appropriate ® lters toremove interferences due to Raman emissions in the op-tical ® bers. The excitation and collection ® bers are 50m m in diameter. The spectrograph has an f number of 2,a 1200 grooves/mm grating, and a TE cooled Kodak0400 CCD.
The Raman spectra of the coated substrates were col-lected in rigidly held 20 mL quartz cuvettes, as shown inFig. 1. All spectra, unless otherwise noted, were obtainedwith the use of a ``backside’ ’ con® guration in which theexcitation light passes through the substrate and gold ® lmand is focused onto the SERS surface. Advantages of the``backside’ ’ approach for sensor applications will be dis-cussed (vide infra). In a procedure to determine whetheror not analytes, such as benzene, partition into the coatingof the SERS substrate, a saturated aqueous solution ofthe analyte would be aliquoted inside the quartz cuvette.Within a few minutes a spectrum would be collected andcompared to the spectrum obtained prior to the additionof the solution in the cuvette. Experimental conditionsare noted in the ® gure captions.
Gold Film Adherence Test. Three methods were usedto evaluate the adherence of the gold ® lms to the glasssubstrate. These methods include the ``tape test’ ’ , the``sonication test’ ’ , and the ``effervescence test’ ’ . Both thesonication test and the effervescence test are designed tosimulate long immersion times in water. In the tape test,a piece of clear Scotch tape (3M) is pressed against the® lm and pulled away. After the tape test, the sonicationtest is performed by immersing the substrate in a beakerof deionized water. The beaker is then placed in an ul-trasonic bath where the substrates are sonicated for up to4 h. In the effervescence test, the substrates are mountedinside an electrochemical cell equipped with Pt elec-trodes. The substrates are positioned between the elec-
trodes. The spacing between the substrates and the Ptelectrodes is on the order of 2±3 mm. The electrolyte isan aqueous solution of 0.1 M KNO 3. With the use of aPAR Model 363 Potentiostat/Galvanostat, the substratesare exposed to H 2 and O2 bubbles generated galvanostat-ically. Exposure times are noted in Table I.
RESULTS AND DISCUSSION
Thiol-Coated SERS Substrates. Thiols react on goldand silver surfaces to form self-assembled monolayers(SAMs).22±24 Recently, Carron et al.14,15 demonstrated thatthiol-coated SERS substrates can be used to detect chlo-rinated hydrocarbons and aromatic compounds. The coat-ing concentrates the analyte at the SERS interface. Thedegree of concentration is related to the adsorption co-ef® cient for the analyte. Coatings are chosen that selec-tively adsorb the contaminants of interest. These thiol-coated substrates can be used to detect contaminants inboth the vapor and aqueous phases and are reusable. TheSERS spectrum of the coating acts as an internal standardfor calibration purposes and the coating protects theSERS surface from poisoning, thereby increasing the life-time of the SERS substrate from minutes or hours tomonths. Unlike electrochemical SERS, the Raman peaksof the contaminants adsorbed on the coated substratesdirectly correspond with those of the neat compounds,thereby facilitating species identi® cation.
Bello and Vo-Dinh 25 demonstrated that one could ex-cite SERS through relatively thick silver ® lms. Filmthicknesses were on the order of 750 AÊ. Similarly, Mullenand Carron26 showed that it was possible to obtain high-quality SERS spectra of adsorbents using Ag ® lms di-rectly deposited on abrasively roughened optical ® bers.In their experiments, the excitation light was focused onthe untreated end of the ® ber. The treated end of theoptical ® ber was directly mounted into the spectrometer.This ``backside’ ’ con® guration can be used also for thiol-coated SERS substrates. Figure 2a shows spectra ob-tained for p-thiocresol on a thin, gold ® lm vacuum de-posited on a glass substrate and the glass substrate. Bothspectra were obtained by using the ``backside’ ’ con® gu-ration. As shown in Fig. 2a, the broad spectral featurespresent in the SERS spectrum of p-thiocresol are pri-marily due to the Raman vibrations of the glass substrate.However, even after the spectral contributions of glasshave been subtracted out, a luminescence background isstill present in the SERS spectrum of p-thiocresol (Fig.2b). Luminescence frequently appears as a backgroundin SERS spectra, and the magnitude of the backgroundhas been shown to correlate with surface roughness. 27
This luminescence background has been attributed to anumber of causes including (1) roughness-induced elec-tronic Raman scattering, 28 (2) broadband ¯ uorescencefrom trace impurities that is being enhanced in much thesame fashion as SERS, 29 (3) luminescence from photo-excited electron-hole pairs in the metal,30 and (4) lumi-nescence from an excited metal±molecule charge transferstate.30
In their investigations, Bello and Vo-Dinh 25 examinedvarious ® ber±substrate geometries to determine the opti-mum geometry for a SERS ® ber-optic sensor. Their re-sults indicated that the ``backside’ ’ , or ``head-on’ ’ (their
APPLIED SPECTROSCOPY 865
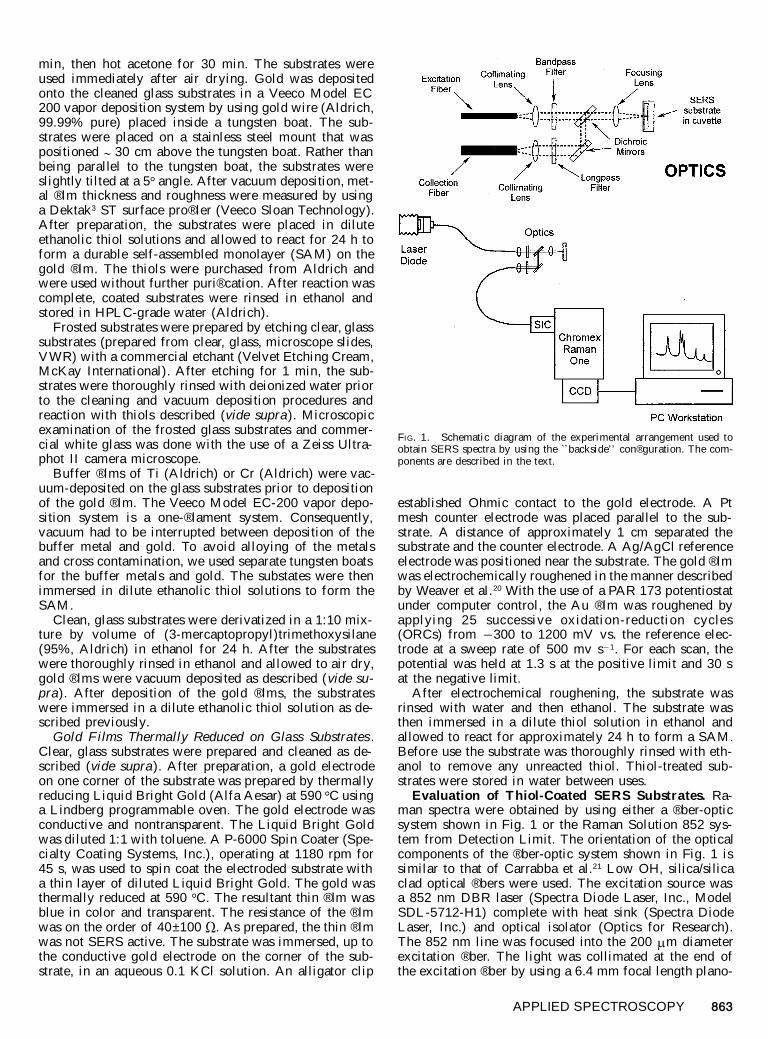
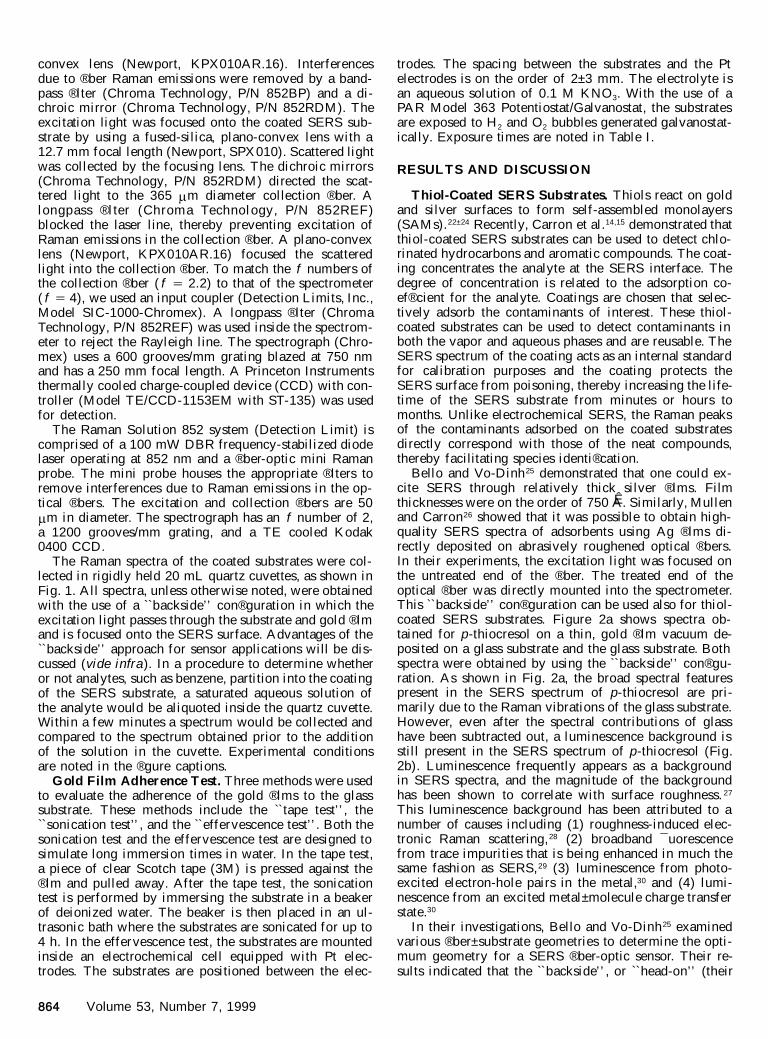
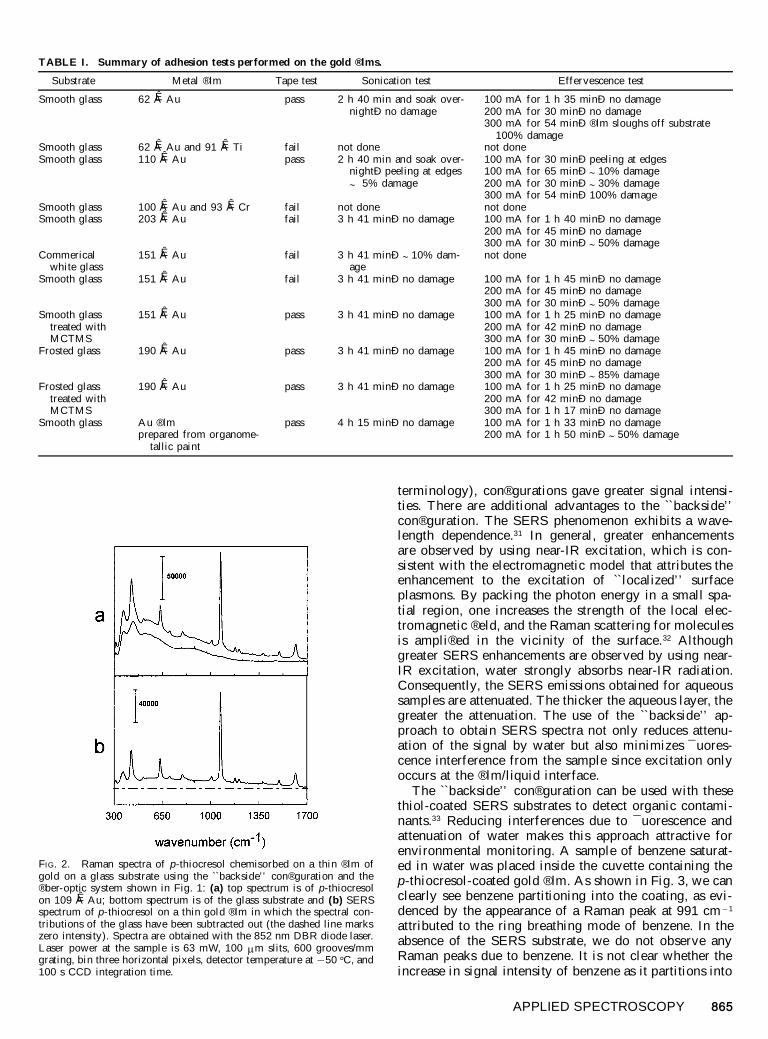
TABLE I. Summary of adhesion tests performed on the gold ® lms.
Substrate Metal ® lm Tape test Sonication test Effervescence test
Smooth glass 62 AÊ Au pass 2 h 40 min and soak over-nightÐ no damage
100 mA for 1 h 35 minÐ no damage200 mA for 30 minÐ no damage300 mA for 54 minÐ ® lm sloughs off substrate
100% damageSmooth glass 62 AÊ Au and 91 AÊ Ti fail not done not doneSmooth glass 110 AÊ Au pass 2 h 40 min and soak over-
nightÐ peeling at edges
; 5% damage
100 mA for 30 minÐ peeling at edges100 mA for 65 minÐ ; 10% damage200 mA for 30 minÐ ; 30% damage300 mA for 54 minÐ 100% damage
Smooth glass 100 AÊ Au and 93 AÊ Cr fail not done not doneSmooth glass 203 AÊ Au fail 3 h 41 minÐ no damage 100 mA for 1 h 40 minÐ no damage
200 mA for 45 minÐ no damage300 mA for 30 minÐ ; 50% damage
Commericalwhite glass
151 AÊ Au fail 3 h 41 minÐ ; 10% dam-age
not done
Smooth glass 151 AÊ Au fail 3 h 41 minÐ no damage 100 mA for 1 h 45 minÐ no damage200 mA for 45 minÐ no damage300 mA for 30 minÐ ; 50% damage
Smooth glasstreated withMCTMS
151 AÊ Au pass 3 h 41 minÐ no damage 100 mA for 1 h 25 minÐ no damage200 mA for 42 minÐ no damage300 mA for 30 minÐ ; 50% damage
Frosted glass 190 AÊ Au pass 3 h 41 minÐ no damage 100 mA for 1 h 45 minÐ no damage200 mA for 45 minÐ no damage300 mA for 30 minÐ ; 85% damage
Frosted glasstreated withMCTMS
190 AÊ Au pass 3 h 41 minÐ no damage 100 mA for 1 h 25 minÐ no damage200 mA for 42 minÐ no damage300 mA for 1 h 17 minÐ no damage
Smooth glass Au ® lmprepared from organome-
tallic paint
pass 4 h 15 minÐ no damage 100 mA for 1 h 33 minÐ no damage200 mA for 1 h 50 minÐ ; 50% damage
FIG. 2. Raman spectra of p-thiocresol chemisorbed on a thin ® lm ofgold on a glass substrate using the ``backside’ ’ con® guration and the® ber-optic system shown in Fig. 1: (a) top spectrum is of p-thiocresolon 109 AÊ Au; bottom spectrum is of the glass substrate and (b) SERSspectrum of p-thiocresol on a thin gold ® lm in which the spectral con-tributions of the glass have been subtracted out (the dashed line markszero intensity). Spectra are obtained with the 852 nm DBR diode laser.Laser power at the sample is 63 mW, 100 m m slits, 600 grooves/mmgrating, bin three horizontal pixels, detector temperature at 2 50 8 C, and100 s CCD integration time.
terminology), con® gurations gave greater signal intensi-ties. There are additional advantages to the ``backside’ ’con® guration. The SERS phenomenon exhibits a wave-length dependence.31 In general, greater enhancementsare observed by using near-IR excitation, which is con-sistent with the electromagnetic model that attributes theenhancement to the excitation of ``localized’ ’ surfaceplasmons. By packing the photon energy in a small spa-tial region, one increases the strength of the local elec-tromagnetic ® eld, and the Raman scattering for moleculesis ampli® ed in the vicinity of the surface.32 Althoughgreater SERS enhancements are observed by using near-IR excitation, water strongly absorbs near-IR radiation.Consequently, the SERS emissions obtained for aqueoussamples are attenuated. The thicker the aqueous layer, thegreater the attenuation. The use of the ``backside’ ’ ap-proach to obtain SERS spectra not only reduces attenu-ation of the signal by water but also minimizes ¯ uores-cence interference from the sample since excitation onlyoccurs at the ® lm/liquid interface.
The ``backside’ ’ con® guration can be used with thesethiol-coated SERS substrates to detect organic contami-nants.33 Reducing interferences due to ¯ uorescence andattenuation of water makes this approach attractive forenvironmental monitoring. A sample of benzene saturat-ed in water was placed inside the cuvette containing thep-thiocresol-coated gold ® lm. As shown in Fig. 3, we canclearly see benzene partitioning into the coating, as evi-denced by the appearance of a Raman peak at 991 cm 2 1
attributed to the ring breathing mode of benzene. In theabsence of the SERS substrate, we do not observe anyRaman peaks due to benzene. It is not clear whether theincrease in signal intensity of benzene as it partitions into
866 Volume 53, Number 7, 1999
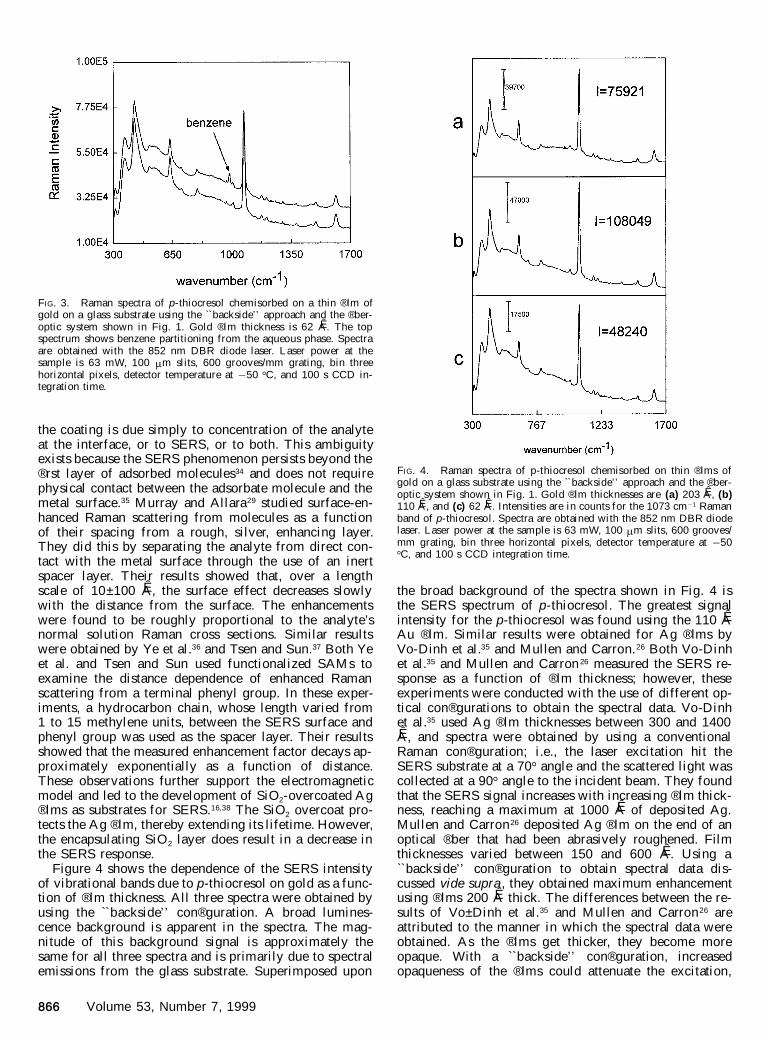
FIG. 3. Raman spectra of p-thiocresol chemisorbed on a thin ® lm ofgold on a glass substrate using the `̀ backside’ ’ approach and the ® ber-optic system shown in Fig. 1. Gold ® lm thickness is 62 AÊ. The topspectrum shows benzene partitioning from the aqueous phase. Spectraare obtained with the 852 nm DBR diode laser. Laser power at thesample is 63 mW, 100 m m slits, 600 grooves/mm grating, bin threehorizontal pixels, detector temperature at 2 50 8 C, and 100 s CCD in-tegration time.
FIG. 4. Raman spectra of p-thiocresol chemisorbed on thin ® lms ofgold on a glass substrate using the `̀ backside’ ’ approach and the ® ber-optic system shown in Fig. 1. Gold ® lm thicknesses are (a) 203 AÊ, (b)110 AÊ, and (c) 62 AÊ. Intensities are in counts for the 1073 cm 2 1 Ramanband of p-thiocresol. Spectra are obtained with the 852 nm DBR diodelaser. Laser power at the sample is 63 mW, 100 m m slits, 600 grooves/mm grating, bin three horizontal pixels, detector temperature at 2 50
8 C, and 100 s CCD integration time.
the coating is due simply to concentration of the analyteat the interface, or to SERS, or to both. This ambiguityexists because the SERS phenomenon persists beyond the® rst layer of adsorbed molecules34 and does not requirephysical contact between the adsorbate molecule and themetal surface.35 Murray and Allara 29 studied surface-en-hanced Raman scattering from molecules as a functionof their spacing from a rough, silver, enhancing layer.They did this by separating the analyte from direct con-tact with the metal surface through the use of an inertspacer layer. Their results showed that, over a lengthscale of 10±100 AÊ, the surface effect decreases slowlywith the distance from the surface. The enhancementswere found to be roughly proportional to the analyte’snormal solution Raman cross sections. Similar resultswere obtained by Ye et al.36 and Tsen and Sun.37 Both Yeet al. and Tsen and Sun used functionalized SAMs toexamine the distance dependence of enhanced Ramanscattering from a terminal phenyl group. In these exper-iments, a hydrocarbon chain, whose length varied from1 to 15 methylene units, between the SERS surface andphenyl group was used as the spacer layer. Their resultsshowed that the measured enhancement factor decays ap-proximately exponentially as a function of distance.These observations further support the electromagneticmodel and led to the development of SiO2-overcoated Ag® lms as substrates for SERS.16,38 The SiO2 overcoat pro-tects the Ag ® lm, thereby extending its lifetime. However,the encapsulating SiO 2 layer does result in a decrease inthe SERS response.
Figure 4 shows the dependence of the SERS intensityof vibrational bands due to p-thiocresol on gold as a func-tion of ® lm thickness. All three spectra were obtained byusing the ``backside’ ’ con® guration. A broad lumines-cence background is apparent in the spectra. The mag-nitude of this background signal is approximately thesame for all three spectra and is primarily due to spectralemissions from the glass substrate. Superimposed upon
the broad background of the spectra shown in Fig. 4 isthe SERS spectrum of p-thiocresol. The greatest signalintensity for the p-thiocresol was found using the 110 AÊ
Au ® lm. Similar results were obtained for Ag ® lms byVo-Dinh et al.35 and Mullen and Carron.26 Both Vo-Dinhet al.35 and Mullen and Carron 26 measured the SERS re-sponse as a function of ® lm thickness; however, theseexperiments were conducted with the use of different op-tical con® gurations to obtain the spectral data. Vo-Dinhet al.35 used Ag ® lm thicknesses between 300 and 1400AÊ, and spectra were obtained by using a conventionalRaman con® guration; i.e., the laser excitation hit theSERS substrate at a 70 8 angle and the scattered light wascollected at a 90 8 angle to the incident beam. They foundthat the SERS signal increases with increasing ® lm thick-ness, reaching a maximum at 1000 AÊ of deposited Ag.Mullen and Carron 26 deposited Ag ® lm on the end of anoptical ® ber that had been abrasively roughened. Filmthicknesses varied between 150 and 600 AÊ. Using a``backside’ ’ con® guration to obtain spectral data dis-cussed vide supra , they obtained maximum enhancementusing ® lms 200 AÊ thick. The differences between the re-sults of Vo±Dinh et al.35 and Mullen and Carron 26 areattributed to the manner in which the spectral data wereobtained. As the ® lms get thicker, they become moreopaque. With a ``backside’ ’ con® guration, increasedopaqueness of the ® lms could attenuate the excitation,

APPLIED SPECTROSCOPY 867
resulting in a decrease in signal. Consequently, Mullenand Carron26 see maximum enhancement at 200 AÊ thick-ness, while Vo-Dinh et al.35 reach a maximum at 1000AÊ. Regardless of the optical con® guration used to obtainspectral data, these earlier results show that there is anoptimum ® lm thickness that gives the largest SERS en-hancement. This optimal ® lm thickness corresponds tothe degree of surface roughness.
The dependence of the SERS response on surfaceroughness has been thoroughly investigated. It has beenshown that a submicroscopic surface roughness (particlesizes on the order of 50 to 200 AÊ) as well as an atomic-scale roughness (on the order of atomic dimensions) isrequired for the observation of SERS.39,40 Submicroscopicsurface geometries permit surface plasmon resonancesnecessary for an electromagnetic enhancement of Ramanscattered light.41 Atomic-scale roughness plays a crucialrole in the chemical enhancement and is associated withcharge transfer excitation. It is believed that atomic-scaleroughness may improve the coupling between incidentphotons and electronic excitations in the metal.42 For va-por-deposited ® lms, the magnitude of the SERS responsealso exhibits a strong dependence on metal grain size. 43,44
It was shown that large grained (slowly deposited) ® lmsdisplay a stronger SERS response than small grained(quickly deposited) ® lms. Because both ® lms have sim-ilar surface roughness factors, it has been suggested thatthe small grain size of the fast-deposited silver ® lms leadsto increased elastic scattering of surface-plasmon polari-tons at the grain boundaries, with a consequent increaseof internal dampening, resulting in a reduction of thescattered Raman signal. In general, when one is preparingSERS substrates, the optimal size range is determined bytwo factors: (1) energy losses of the conduction electronsof the metal caused by collisions with the particle surface,which is signi® cant for small particles, and (2) radiationdampening that involves radiative losses of the electricdipole moment.35 The importance of surface roughness tothe SERS phenomenon will be discussed, in greater de-tail, vide infra.
Table I summarizes the results of the adhesive tests for62, 110, 151, and 203 AÊ thick gold ® lms. Both the 62and 110 AÊ thick ® lms pass the tape test. While the 62 AÊ
® lm passes the sonication test, the 110 AÊ ® lm experiencessome damage. The 151 and 203 AÊ thick ® lms failed thetape test; however, both passed the sonication test. Theeffervescence test is the most stringent test the ® lms weresubjected to. In this test, bubbles of H 2 and O2 gas aregenerated by electrolysis. The higher the applied current,the greater the rate of bubble generation and the higherthe solution temperature due to resistive heating. Thesubstrates were positioned within the stream of bubbles,and the ® lms were continuously bombarded with thesebubbles. The results summarized in Table I indicate thatall four ® lms eventually fail the effervescence test. It haslong been known that noble metals, such as Ag and Au,are weakly bound to glass surfaces. 36 Because of theweak binding forces between the metal ® lm and sub-strate, the metal atoms initially accumulate as islands dur-ing vacuum deposition. Thicker deposits form continuous® lms that are easily stripped, as shown by our results.
Vapor-deposited Ag and Au ® lms exhibit high SERSsensitivity, and the ``backside’ ’ con® guration for data ac-
quisition minimizes attenuation of the signal by water and¯ uorescence interference. Despite these advantages, theusefulness of these ® lms for environmental and other ap-plications is limited by their poor adherence to the glasssubstrates. Obviously improving the adherence betweenthe ® lms and glass substrates will increase their appli-cability. Three methods of adhering Au to glass and theireffect on the SERS response are examined: (1) the useof Ti or Cr buffer metals between the Au ® lm and theglass substrate, (2) the use of MCTMS, and (3) the useof Au organometallic paint.
The Use of Cr and Ti Buffer Metals to Improve AuFilm Adherence to Glass. Buffer metals of Cr, Ti, andW are often used to promote adhesion between the glasssubstrate and the Au or Ag ® lm.18 Silver is a relativelylow-boiling metal, and the binding force between theglass substrate and the metal is weak. Gold boils at ahigher temperature than silver, but it too weakly bondsto the glass substrate. Low-boiling metals and/or weakbinding forces between the metal ® lm and substrate in-crease the tendency to form island structure.46 Conse-quently, when Ag or Au is deposited on glass at roomtemperature, the ® lm has an island structure, consistingof few large aggregates in the initial stages of growth.46
In contrast, W is a high-boiling metal. Deposition of Won a glass slide at room temperature results in a ® lmconsisting of a dense population of small islands, or ag-gragates. Early in the deposition process, these small is-lands touch and grow together to form a continuous ® lm.Conversely, Ag and Au ® lms keep their island characterlonger. It was found that seeding the glass substrate witha thin layer of a high-boiling metal saturates the free sur-face bonds of the substrate47 and increases the bindingenergy of subsequently adsorbed atoms of a low-boilingmetal. However the resultant ® lm is continuous; i.e., noislands; and deposition of metals onto metals leads fre-quently to alloying at the interface.
Use of Ti to improve adhesion of Ni ® lms to glass hasbeen demonstrated previously in this laboratory by usingthe Veeco Model EC-200 vapor deposition system. TheseNi ® lms passed the tape test, and electrical contact couldbe made with the use of indium solder. Because of thesuccess achieved with Ni ® lms, the same procedures wereemployed to prepare Au ® lms on glass substrates. TableI summarizes the results of the adhesive tests using Tiand Cr as buffer metals. In the tape test, most of the Au® lm peeled off the substrate. However, the underlying Tiand Cr ® lms remained. As the ® lms did not pass the tapetest, no further adhesion tests were conducted. This lackof adhesion of the Au is attributed to the fact that theVeeco Model EC-200 vapor deposition system used inthese experiments is a one-® lament system. Consequent-ly, vacuum had to be interrupted between deposition ofthe buffer metal and gold. While a separate tungsten boatfor the gold would be mounted inside the vapor deposi-tion system, the substrate, coated with the buffer ® lm,would be exposed to the air. Oxide layers can form onthe buffer metals that can reduce the adhesion of metal® lms. While oxide formation did not decrease the adhe-sion of Ni ® lms, it does appreciably decrease the adhe-sion of the Au ® lms. Better adhesion results are expectedfor a two-® lament system where the buffer metal can be
868 Volume 53, Number 7, 1999
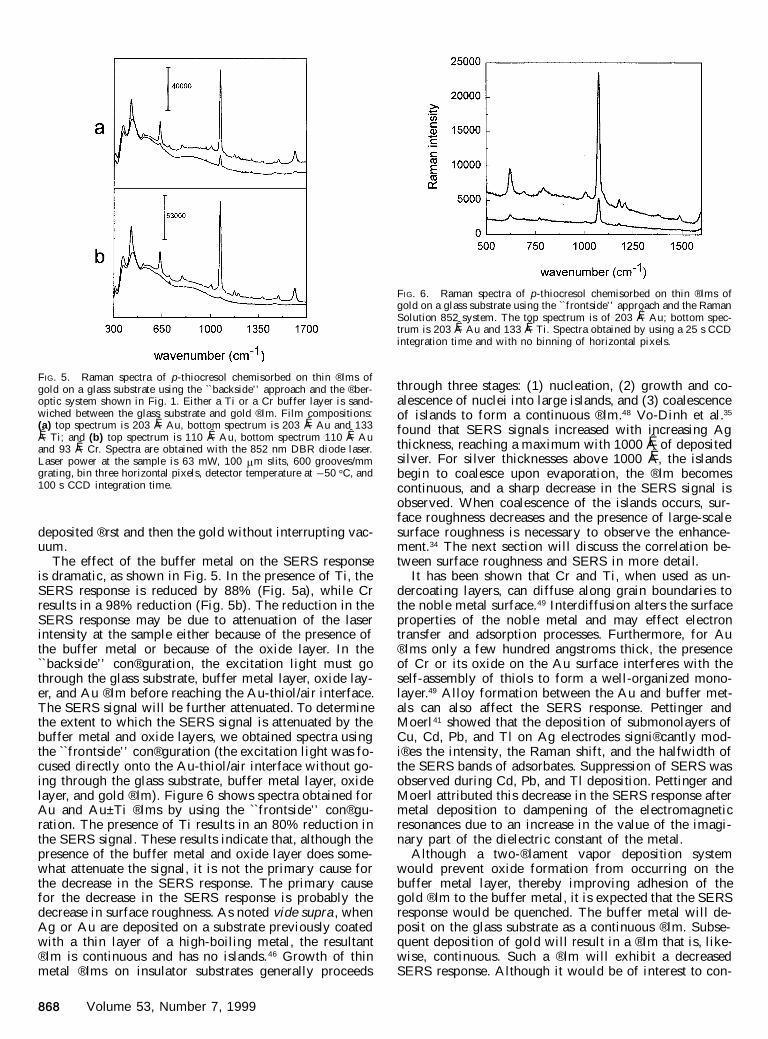
FIG. 5. Raman spectra of p-thiocresol chemisorbed on thin ® lms ofgold on a glass substrate using the `̀ backside’ ’ approach and the ® ber-optic system shown in Fig. 1. Either a Ti or a Cr buffer layer is sand-wiched between the glass substrate and gold ® lm. Film compositions:(a) top spectrum is 203 AÊ Au, bottom spectrum is 203 AÊ Au and 133AÊ Ti; and (b) top spectrum is 110 AÊ Au, bottom spectrum 110 AÊ Auand 93 AÊ Cr. Spectra are obtained with the 852 nm DBR diode laser.Laser power at the sample is 63 mW, 100 m m slits, 600 grooves/mmgrating, bin three horizontal pixels, detector temperature at 2 50 8 C, and100 s CCD integration time.
FIG. 6. Raman spectra of p-thiocresol chemisorbed on thin ® lms ofgold on a glass substrate using the ``frontside’ ’ approach and the RamanSolution 852 system. The top spectrum is of 203 AÊ Au; bottom spec-trum is 203 AÊ Au and 133 AÊ Ti. Spectra obtained by using a 25 s CCDintegration time and with no binning of horizontal pixels.
deposited ® rst and then the gold without interrupting vac-uum.
The effect of the buffer metal on the SERS responseis dramatic, as shown in Fig. 5. In the presence of Ti, theSERS response is reduced by 88% (Fig. 5a), while Crresults in a 98% reduction (Fig. 5b). The reduction in theSERS response may be due to attenuation of the laserintensity at the sample either because of the presence ofthe buffer metal or because of the oxide layer. In the``backside’ ’ con® guration, the excitation light must gothrough the glass substrate, buffer metal layer, oxide lay-er, and Au ® lm before reaching the Au-thiol/air interface.The SERS signal will be further attenuated. To determinethe extent to which the SERS signal is attenuated by thebuffer metal and oxide layers, we obtained spectra usingthe ``frontside’ ’ con® guration (the excitation light was fo-cused directly onto the Au-thiol/air interface without go-ing through the glass substrate, buffer metal layer, oxidelayer, and gold ® lm). Figure 6 shows spectra obtained forAu and Au±Ti ® lms by using the ``frontside’ ’ con® gu-ration. The presence of Ti results in an 80% reduction inthe SERS signal. These results indicate that, although thepresence of the buffer metal and oxide layer does some-what attenuate the signal, it is not the primary cause forthe decrease in the SERS response. The primary causefor the decrease in the SERS response is probably thedecrease in surface roughness. As noted vide supra , whenAg or Au are deposited on a substrate previously coatedwith a thin layer of a high-boiling metal, the resultant® lm is continuous and has no islands. 46 Growth of thinmetal ® lms on insulator substrates generally proceeds
through three stages: (1) nucleation, (2) growth and co-alescence of nuclei into large islands, and (3) coalescenceof islands to form a continuous ® lm.48 Vo-Dinh et al.35
found that SERS signals increased with increasing Agthickness, reaching a maximum with 1000 AÊ of depositedsilver. For silver thicknesses above 1000 AÊ, the islandsbegin to coalesce upon evaporation, the ® lm becomescontinuous, and a sharp decrease in the SERS signal isobserved. When coalescence of the islands occurs, sur-face roughness decreases and the presence of large-scalesurface roughness is necessary to observe the enhance-ment.34 The next section will discuss the correlation be-tween surface roughness and SERS in more detail.
It has been shown that Cr and Ti, when used as un-dercoating layers, can diffuse along grain boundaries tothe noble metal surface.49 Interdiffusion alters the surfaceproperties of the noble metal and may effect electrontransfer and adsorption processes. Furthermore, for Au® lms only a few hundred angstroms thick, the presenceof Cr or its oxide on the Au surface interferes with theself-assembly of thiols to form a well-organized mono-layer.49 Alloy formation between the Au and buffer met-als can also affect the SERS response. Pettinger andMoerl 41 showed that the deposition of submonolayers ofCu, Cd, Pb, and Tl on Ag electrodes signi® cantly mod-i® es the intensity, the Raman shift, and the halfwidth ofthe SERS bands of adsorbates. Suppression of SERS wasobserved during Cd, Pb, and Tl deposition. Pettinger andMoerl attributed this decrease in the SERS response aftermetal deposition to dampening of the electromagneticresonances due to an increase in the value of the imagi-nary part of the dielectric constant of the metal.
Although a two-® lament vapor deposition systemwould prevent oxide formation from occurring on thebuffer metal layer, thereby improving adhesion of thegold ® lm to the buffer metal, it is expected that the SERSresponse would be quenched. The buffer metal will de-posit on the glass substrate as a continuous ® lm. Subse-quent deposition of gold will result in a ® lm that is, like-wise, continuous. Such a ® lm will exhibit a decreasedSERS response. Although it would be of interest to con-

APPLIED SPECTROSCOPY 869
FIG. 7. Schematic diagram showing how MCTMS anchors vapor-deposited Au to a glass substrate. The silane moieties of MCTMS covalentlybind to the oxide surface of the glass and each other through Si±O±Si bonds. The thiol groups bond to gold atoms during vapor deposition. Agold±thiolate bond anchors the organic moiety of p-thiocresol to the gold ® lm to form a self-assembled monolayer.
FIG. 8. Raman spectra of p-thiocresol chemisorbed on thin ® lms ofgold on a glass substrate using the ``backside’ ’ approach and the ® ber-optic system shown in Fig. 1. The solid lines and circles representspectra obtained on glass substrates that are untreated and treated withMCTMS, respectively. Gold thicknesses and substrates are (a) 69 AÊ Auon smooth glass substrates, (b) 151 AÊ Au on commercial white glasssubstrates, and (c) 190 AÊ Au on glass substrates that had been etchedwith a commercial etchant. Intensities are in counts for the 1073 cm 2 1
Raman band of p-thiocresol obtained on the untreated glass substrates.Spectra are obtained with the 852 nm DBR diode laser. Laser power atthe sample is 63 mW, 100 m m slits, 600 grooves/mm grating, bin threehorizontal pixels, detector temperature at 2 50 8 C, and 100 s CCD in-tegration time.
tinue these experiments to further explore the in¯ uenceof buffer layer thickness, it is not the scope of this in-vestigation. The purpose of this investigation is to de-velop SERS metal ® lms on glass substrates that can be
used to detect analytes of environmental concern in aque-ous solutions by using the ``backside’ ’ con® gurationshown in Fig. 1. Such ® lms need to be durable, adherewell to the glass substrate, be transmissive, and exhibit astrong SERS response. Since the buffer metal approachdoes not meet all these criteria, these efforts were notpursued further.
The Use of (3-Mercaptopropyl)trimethoxysilane toImprove Au Film Adherence to Glass. While Grabaret al.19,50 showed that organosilanes such as (3-mercap-topropyl)trimethoxysilane can be used to immobolize col-loidal gold particles to a glass substrate, Goss et al. 49
investigated the adhesion of vapor-deposited Au onMCTMS functionalized glass. The ® lms prepared byGoss et al. retained adhesion after immersion in 60 8 Cchromic acid cleaning solution and/or 1:20 concentratedHF/H2O solution, immersion in 0.1 M NaOH solution,exposure to air or O2 plasma, and voltammetric cyclingthrough Au oxidation in 1 M HClO4. Figure 7 shows howAu surfaces are prepared by covalent attachment of va-por-deposited Au to the thiol group on glass treated withMCTMS.49,50 The silane moieties covalently bind to theoxide surface of the glass and with each other throughsiloxane bonds. The resultant silane layer is essentially aone-molecule-thick polymer ® lm. The thiol functionalityof MCTMS is available for bonding with gold atoms dur-ing vapor deposition. Afterwards the Au on the substrateis reacted with p-thiocresol in an ethanolic solution. Agold thiolate bond attaches the organic moiety of p-thio-cresol to the gold ® lm.
Adhesion tests for gold ® lms on smooth glass bothuntreated and treated with MCTMS are summarized inTable I. The untreated glass failed the tape test but passedthe sonication test, while the treated glass passed bothtests. In the effervescence test, however, both the treatedand untreated substrates performed equally well. Damageto the ® lms occurred only at the highest applied currents.
After using organosilanes to immobilize the gold col-loidal particles on the glass substrates, Grabar et al. 19,50
adsorbed bis-1,4-(pyridyl)ethene (BPE) onto the gold.They obtained intense SERS spectra for the BPE. Nospectral features of the organosilane were present as theyare very poor scatterers compared to BPE. Figure 8ashows SERS spectra obtained for p-thiocresol on gold
870 Volume 53, Number 7, 1999
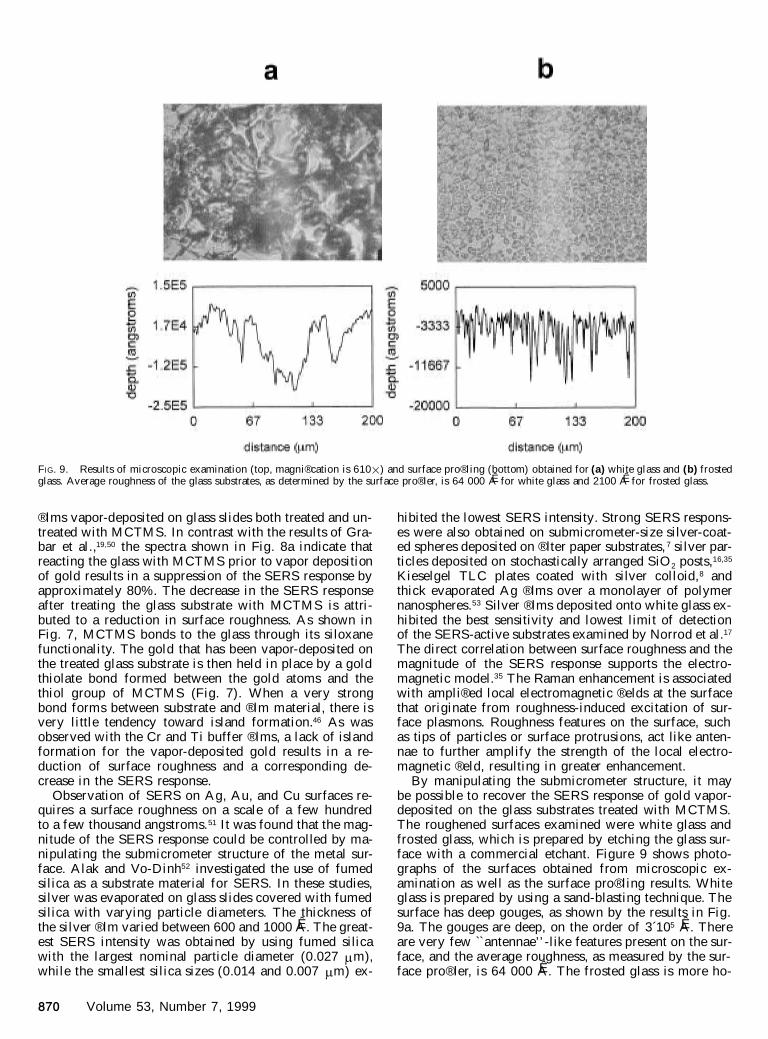
FIG. 9. Results of microscopic examination (top, magni® cation is 610 3 ) and surface pro® ling (bottom) obtained for (a) white glass and (b) frostedglass. Average roughness of the glass substrates, as determined by the surface pro® ler, is 64 000 AÊ for white glass and 2100 AÊfor frosted glass.
® lms vapor-deposited on glass slides both treated and un-treated with MCTMS. In contrast with the results of Gra-bar et al.,19,50 the spectra shown in Fig. 8a indicate thatreacting the glass with MCTMS prior to vapor depositionof gold results in a suppression of the SERS response byapproximately 80%. The decrease in the SERS responseafter treating the glass substrate with MCTMS is attri-buted to a reduction in surface roughness. As shown inFig. 7, MCTMS bonds to the glass through its siloxanefunctionality. The gold that has been vapor-deposited onthe treated glass substrate is then held in place by a goldthiolate bond formed between the gold atoms and thethiol group of MCTMS (Fig. 7). When a very strongbond forms between substrate and ® lm material, there isvery little tendency toward island formation.46 As wasobserved with the Cr and Ti buffer ® lms, a lack of islandformation for the vapor-deposited gold results in a re-duction of surface roughness and a corresponding de-crease in the SERS response.
Observation of SERS on Ag, Au, and Cu surfaces re-quires a surface roughness on a scale of a few hundredto a few thousand angstroms.51 It was found that the mag-nitude of the SERS response could be controlled by ma-nipulating the submicrometer structure of the metal sur-face. Alak and Vo-Dinh52 investigated the use of fumedsilica as a substrate material for SERS. In these studies,silver was evaporated on glass slides covered with fumedsilica with varying particle diameters. The thickness ofthe silver ® lm varied between 600 and 1000 AÊ. The great-est SERS intensity was obtained by using fumed silicawith the largest nominal particle diameter (0.027 m m),while the smallest silica sizes (0.014 and 0.007 m m) ex-
hibited the lowest SERS intensity. Strong SERS respons-es were also obtained on submicrometer-size silver-coat-ed spheres deposited on ® lter paper substrates, 7 silver par-ticles deposited on stochastically arranged SiO 2 posts,16,35
Kieselgel TLC plates coated with silver colloid,8 andthick evaporated Ag ® lms over a monolayer of polymernanospheres.53 Silver ® lms deposited onto white glass ex-hibited the best sensitivity and lowest limit of detectionof the SERS-active substrates examined by Norrod et al.17
The direct correlation between surface roughness and themagnitude of the SERS response supports the electro-magnetic model.35 The Raman enhancement is associatedwith ampli® ed local electromagnetic ® elds at the surfacethat originate from roughness-induced excitation of sur-face plasmons. Roughness features on the surface, suchas tips of particles or surface protrusions, act like anten-nae to further amplify the strength of the local electro-magnetic ® eld, resulting in greater enhancement.
By manipulating the submicrometer structure, it maybe possible to recover the SERS response of gold vapor-deposited on the glass substrates treated with MCTMS.The roughened surfaces examined were white glass andfrosted glass, which is prepared by etching the glass sur-face with a commercial etchant. Figure 9 shows photo-graphs of the surfaces obtained from microscopic ex-amination as well as the surface pro ® ling results. Whiteglass is prepared by using a sand-blasting technique. Thesurface has deep gouges, as shown by the results in Fig.9a. The gouges are deep, on the order of 3´105 AÊ. Thereare very few ``antennae’ ’ -like features present on the sur-face, and the average roughness, as measured by the sur-face pro ® ler, is 64 000 AÊ. The frosted glass is more ho-
APPLIED SPECTROSCOPY 871
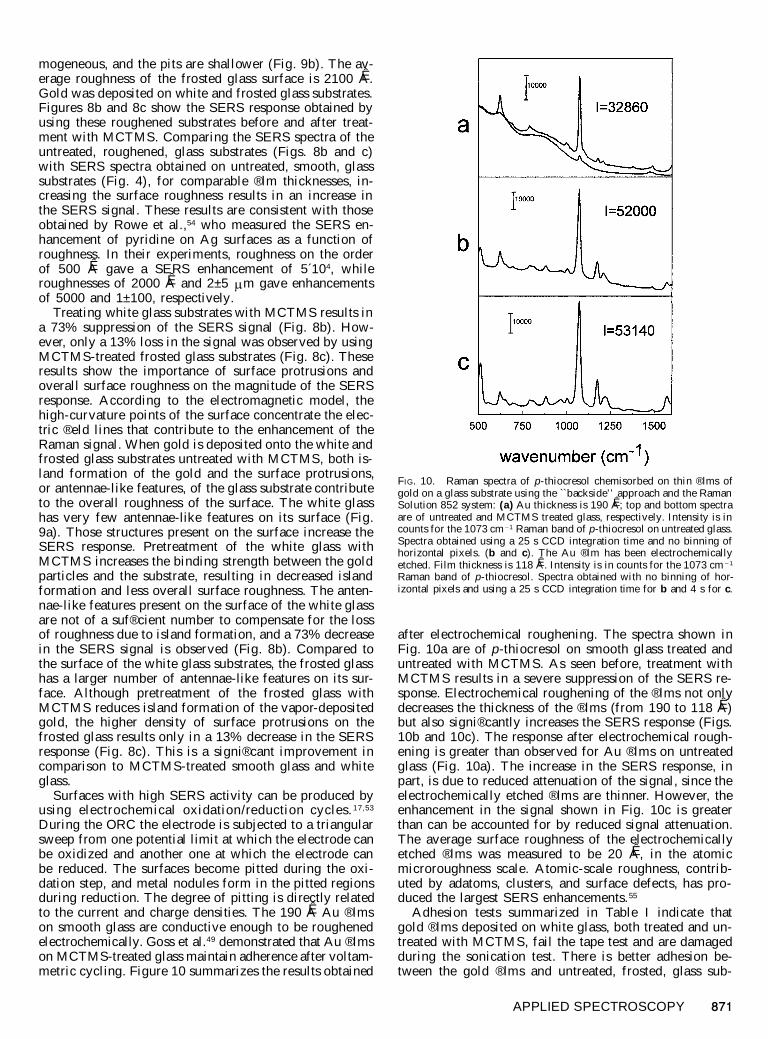
FIG. 10. Raman spectra of p-thiocresol chemisorbed on thin ® lms ofgold on a glass substrate using the ``backside’ ’ approach and the RamanSolution 852 system: (a) Au thickness is 190 AÊ; top and bottom spectraare of untreated and MCTMS treated glass, respectively. Intensity is incounts for the 1073 cm 2 1 Raman band of p-thiocresol on untreated glass.Spectra obtained using a 25 s CCD integration time and no binning ofhorizontal pixels. (b and c). The Au ® lm has been electrochemicallyetched. Film thickness is 118 AÊ. Intensity is in counts for the 1073 cm 2 1
Raman band of p-thiocresol. Spectra obtained with no binning of hor-izontal pixels and using a 25 s CCD integration time for b and 4 s for c.
mogeneous, and the pits are shallower (Fig. 9b). The av-erage roughness of the frosted glass surface is 2100 AÊ.Gold was deposited on white and frosted glass substrates.Figures 8b and 8c show the SERS response obtained byusing these roughened substrates before and after treat-ment with MCTMS. Comparing the SERS spectra of theuntreated, roughened, glass substrates (Figs. 8b and c)with SERS spectra obtained on untreated, smooth, glasssubstrates (Fig. 4), for comparable ® lm thicknesses, in-creasing the surface roughness results in an increase inthe SERS signal. These results are consistent with thoseobtained by Rowe et al.,54 who measured the SERS en-hancement of pyridine on Ag surfaces as a function ofroughness. In their experiments, roughness on the orderof 500 AÊ gave a SERS enhancement of 5´104, whileroughnesses of 2000 AÊ and 2±5 m m gave enhancementsof 5000 and 1±100, respectively.
Treating white glass substrates with MCTMS results ina 73% suppression of the SERS signal (Fig. 8b). How-ever, only a 13% loss in the signal was observed by usingMCTMS-treated frosted glass substrates (Fig. 8c). Theseresults show the importance of surface protrusions andoverall surface roughness on the magnitude of the SERSresponse. According to the electromagnetic model, thehigh-curvature points of the surface concentrate the elec-tric ® eld lines that contribute to the enhancement of theRaman signal. When gold is deposited onto the white andfrosted glass substrates untreated with MCTMS, both is-land formation of the gold and the surface protrusions,or antennae-like features, of the glass substrate contributeto the overall roughness of the surface. The white glasshas very few antennae-like features on its surface (Fig.9a). Those structures present on the surface increase theSERS response. Pretreatment of the white glass withMCTMS increases the binding strength between the goldparticles and the substrate, resulting in decreased islandformation and less overall surface roughness. The anten-nae-like features present on the surface of the white glassare not of a suf® cient number to compensate for the lossof roughness due to island formation, and a 73% decreasein the SERS signal is observed (Fig. 8b). Compared tothe surface of the white glass substrates, the frosted glasshas a larger number of antennae-like features on its sur-face. Although pretreatment of the frosted glass withMCTMS reduces island formation of the vapor-depositedgold, the higher density of surface protrusions on thefrosted glass results only in a 13% decrease in the SERSresponse (Fig. 8c). This is a signi® cant improvement incomparison to MCTMS-treated smooth glass and whiteglass.
Surfaces with high SERS activity can be produced byusing electrochemical oxidation/reduction cycles. 17 ,53
During the ORC the electrode is subjected to a triangularsweep from one potential limit at which the electrode canbe oxidized and another one at which the electrode canbe reduced. The surfaces become pitted during the oxi-dation step, and metal nodules form in the pitted regionsduring reduction. The degree of pitting is directly relatedto the current and charge densities. The 190 AÊ Au ® lmson smooth glass are conductive enough to be roughenedelectrochemically. Goss et al.49 demonstrated that Au ® lmson MCTMS-treated glass maintain adherence after voltam-metric cycling. Figure 10 summarizes the results obtained
after electrochemical roughening. The spectra shown inFig. 10a are of p-thiocresol on smooth glass treated anduntreated with MCTMS. As seen before, treatment withMCTMS results in a severe suppression of the SERS re-sponse. Electrochemical roughening of the ® lms not onlydecreases the thickness of the ® lms (from 190 to 118 AÊ)but also signi® cantly increases the SERS response (Figs.10b and 10c). The response after electrochemical rough-ening is greater than observed for Au ® lms on untreatedglass (Fig. 10a). The increase in the SERS response, inpart, is due to reduced attenuation of the signal, since theelectrochemically etched ® lms are thinner. However, theenhancement in the signal shown in Fig. 10c is greaterthan can be accounted for by reduced signal attenuation.The average surface roughness of the electrochemicallyetched ® lms was measured to be 20 AÊ, in the atomicmicroroughness scale. Atomic-scale roughness, contrib-uted by adatoms, clusters, and surface defects, has pro-duced the largest SERS enhancements.55
Adhesion tests summarized in Table I indicate thatgold ® lms deposited on white glass, both treated and un-treated with MCTMS, fail the tape test and are damagedduring the sonication test. There is better adhesion be-tween the gold ® lms and untreated, frosted, glass sub-
872 Volume 53, Number 7, 1999
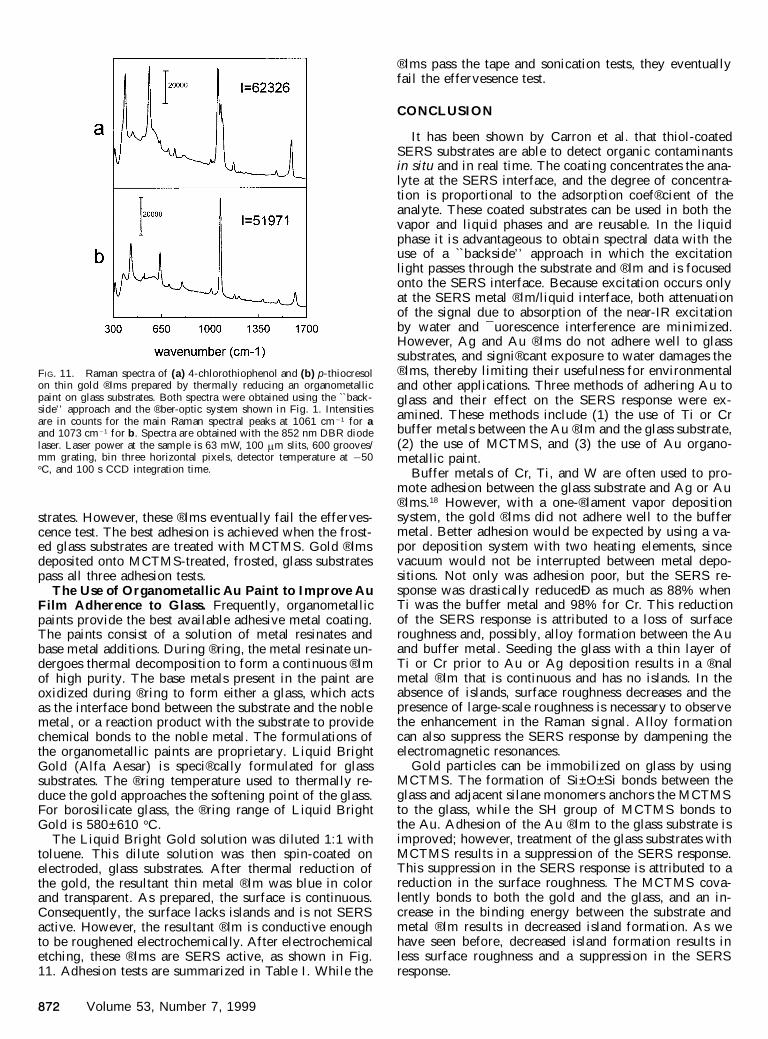
FIG. 11. Raman spectra of (a) 4-chlorothiophenol and (b) p-thiocresolon thin gold ® lms prepared by thermally reducing an organometallicpaint on glass substrates. Both spectra were obtained using the ``back-side’ ’ approach and the ® ber-optic system shown in Fig. 1. Intensitiesare in counts for the main Raman spectral peaks at 1061 cm 2 1 for aand 1073 cm 2 1 for b . Spectra are obtained with the 852 nm DBR diodelaser. Laser power at the sample is 63 mW, 100 m m slits, 600 grooves/mm grating, bin three horizontal pixels, detector temperature at 2 50
8 C, and 100 s CCD integration time.
strates. However, these ® lms eventually fail the efferves-cence test. The best adhesion is achieved when the frost-ed glass substrates are treated with MCTMS. Gold ® lmsdeposited onto MCTMS-treated, frosted, glass substratespass all three adhesion tests.
The Use of Organometallic Au Paint to Improve AuFilm Adherence to Glass. Frequently, organometallicpaints provide the best available adhesive metal coating.The paints consist of a solution of metal resinates andbase metal additions. During ® ring, the metal resinate un-dergoes thermal decomposition to form a continuous ® lmof high purity. The base metals present in the paint areoxidized during ® ring to form either a glass, which actsas the interface bond between the substrate and the noblemetal, or a reaction product with the substrate to providechemical bonds to the noble metal. The formulations ofthe organometallic paints are proprietary. Liquid BrightGold (Alfa Aesar) is speci® cally formulated for glasssubstrates. The ® ring temperature used to thermally re-duce the gold approaches the softening point of the glass.For borosilicate glass, the ® ring range of Liquid BrightGold is 580±610 8 C.
The Liquid Bright Gold solution was diluted 1:1 withtoluene. This dilute solution was then spin-coated onelectroded, glass substrates. After thermal reduction ofthe gold, the resultant thin metal ® lm was blue in colorand transparent. As prepared, the surface is continuous.Consequently, the surface lacks islands and is not SERSactive. However, the resultant ® lm is conductive enoughto be roughened electrochemically. After electrochemicaletching, these ® lms are SERS active, as shown in Fig.11. Adhesion tests are summarized in Table I. While the
® lms pass the tape and sonication tests, they eventuallyfail the effervesence test.
CONCLUSION
It has been shown by Carron et al. that thiol-coatedSERS substrates are able to detect organic contaminantsin situ and in real time. The coating concentrates the ana-lyte at the SERS interface, and the degree of concentra-tion is proportional to the adsorption coef® cient of theanalyte. These coated substrates can be used in both thevapor and liquid phases and are reusable. In the liquidphase it is advantageous to obtain spectral data with theuse of a ``backside’ ’ approach in which the excitationlight passes through the substrate and ® lm and is focusedonto the SERS interface. Because excitation occurs onlyat the SERS metal ® lm/liquid interface, both attenuationof the signal due to absorption of the near-IR excitationby water and ¯ uorescence interference are minimized.However, Ag and Au ® lms do not adhere well to glasssubstrates, and signi® cant exposure to water damages the® lms, thereby limiting their usefulness for environmentaland other applications. Three methods of adhering Au toglass and their effect on the SERS response were ex-amined. These methods include (1) the use of Ti or Crbuffer metals between the Au ® lm and the glass substrate,(2) the use of MCTMS, and (3) the use of Au organo-metallic paint.
Buffer metals of Cr, Ti, and W are often used to pro-mote adhesion between the glass substrate and Ag or Au® lms.18 However, with a one-® lament vapor depositionsystem, the gold ® lms did not adhere well to the buffermetal. Better adhesion would be expected by using a va-por deposition system with two heating elements, sincevacuum would not be interrupted between metal depo-sitions. Not only was adhesion poor, but the SERS re-sponse was drastically reducedÐ as much as 88% whenTi was the buffer metal and 98% for Cr. This reductionof the SERS response is attributed to a loss of surfaceroughness and, possibly, alloy formation between the Auand buffer metal. Seeding the glass with a thin layer ofTi or Cr prior to Au or Ag deposition results in a ® nalmetal ® lm that is continuous and has no islands. In theabsence of islands, surface roughness decreases and thepresence of large-scale roughness is necessary to observethe enhancement in the Raman signal. Alloy formationcan also suppress the SERS response by dampening theelectromagnetic resonances.
Gold particles can be immobilized on glass by usingMCTMS. The formation of Si±O±Si bonds between theglass and adjacent silane monomers anchors the MCTMSto the glass, while the SH group of MCTMS bonds tothe Au. Adhesion of the Au ® lm to the glass substrate isimproved; however, treatment of the glass substrates withMCTMS results in a suppression of the SERS response.This suppression in the SERS response is attributed to areduction in the surface roughness. The MCTMS cova-lently bonds to both the gold and the glass, and an in-crease in the binding energy between the substrate andmetal ® lm results in decreased island formation. As wehave seen before, decreased island formation results inless surface roughness and a suppression in the SERSresponse.
APPLIED SPECTROSCOPY 873
In general, it was found that using roughened glasssubstrates results in an increase in the SERS response.For roughened glass substrates untreated with MCTMS,the surface protrusions of the glass as well as island for-mation contributes to the overall roughness of the gold® lm. When the glass substrates are treated with MCTMS,island formation is decreased, and the surface roughnessis then determined primarily by the density of the surfaceprotrusions of the glass. White glass has very few anten-nae-like features on its surface. There are not a suf® cientnumber of these surface protrusions present to compen-sate for the loss of roughness due to island formation.Consequently, treating white glass substrates w ithMCTMS results in a 73% decrease in the magnitude ofthe SERS signal. Frosted glass substrates have a largernumber of antennae-like features on their surfaces com-pared to the white glass substrates. Although the higherdensity of surface protrusions on the frosted glass offerssome compensation for the loss of surface roughness dueto island formation, there is a 13% decrease in the SERSintensity after treatment with MCTMS. Electrochemicalroughening of Au ® lms on MCTMS-treated glass sub-strates results in signi® cant enhancements of the SERSresponse. Gold ® lms on MCTMS-treated frosted glasssubstrates exhibited the best adhesion of the substratesinvestigated.
Organometallic paints are solutions of metal resinates.During ® ring the metal resinates decompose to the metaland form a continuous ® lm. As prepared, these surfacesare not SERS active; however, the ® lms become SERSactive after electrochemical etching. The adhesive prop-erties of these ® lms to glass are not as good as thoseobserved for the MCTMS-treated frosted glass substrates.
ACKNOWLEDGMENTS
This work was supported by the the SPAWARSYSCEN San DiegoIndependent Research (IR) Program. The authors would like to thankProf. Keith Carron of the University of Wyoming for his assistance inpreparing coated SERS substrates, Dr. Roger Boss of SPAWARSYS-CEN San Diego for his assistance in the vapor deposition of gold ® lms,and Dr. Christian Schoen of Detection Limit for the generous loan ofhis Solution 852 Raman Spectrometer system.
1. M. Fleischmann, P. J. Hendra, and A. J. McQuillan, Chem. Phys.Lett. 26, 163 (1974).
2. D. L. Jeanmaire and R. P. van Duyne, J. Electroanal. Chem. 84, 1(1977).
3. M. R. Philbott, J. Chem. Phys. 62, 1812 (1975).4. R. L. Garrell, Anal. Chem. 61, 401A (1989).5. P. Gao, M. L. Patterson, M. A. Tadayyoni, and M. Weaver, Lang-
muir 1, 173 (1985).6. J. M. Storey, T. E. Barber, R. D. Shelton, E. A. Wachter, K. T.
Carron, and Y. Jiang, Spectroscopy 10, 20 (1995).7. T. Vo-Dinh, M. Y. K. Hiromoto, G. M. Begun, and R. L. Moody,
Anal. Chem. 56, 1667 (1984).8. E. Roth and W. Kiefer, Appl. Spectrosc. 48, 1193 (1994).9. K. T. Carron and B. J. Kennedy, Anal. Chem. 67, 3353 (1995).
10. R. D. Freeman, R. M. Hammaker, C. E. Meloan, and W. G. Fateley,Appl. Spectrosc. 42, 456 (1988).
11. J.-M. L. SeÂquaris and E. Koglin, Anal. Chem. 59, 527 (1987).12. M. M. Carrabba, R. B. Edmonds, R. D. Rauh, and J. Haas III, in
Proceedings of the Second International Symposium on FieldScreening Methods for Hazardous Wastes and Toxic Chemicals,Las Vegas, Nevada (1991), p. 67.
13. J. M. E. Storey, R. D. Shelton, T. E. Barber, and E. A. Wachter,Appl. Spectrosc. 48, 1265 (1994).
14. K. Carron, L. Pietersen, and M. Lewis, Environ. Sci. Technol. 26,1950 (1992).
15. K. Mullen and K. Carron, Anal. Chem. 66, 478 (1994).16. E. A. Wachter, J. M. E. Storey, S. L. Sharp, K. T. Carron, and Y.
Jiang, Appl. Spectrosc. 49, 193 (1995).17. K. L. Norrod, L. M. Sudnik, D. Rousell, and K. L. Rowlen, Appl.
Spectrosc. 51, 994 (1997).18. J. Janata, Principles of Chemical Sensors (Plenum Press, New York,
New York, 1989).19. K. C. Grabar, K. J. Allison, B. E. Baker, R. M. Bright, K. R. Brown,
R. Grif ® th Freeman, A. P. Fox, C. D. Keating, M. D. Musick, andM. J. Natan, Langmuir 12, 2353 (1996).
20. L.-W. H. Leung, D. Gostola, and M. J. Weaver, Langmuir 3, 45(1987).
21. M. M. Carrabba, R. B. Edmonds, K. M. Spencer, and R. D. Raih,``Fiber Optic Raman Chemical Sensors’ ’ , Chemical Sensors II, M.Butler, A. Ricco, and N. Yamazoe, Eds. (The Electrochemical So-ciety, Pennington, New Jersey 1993), p. 634.
22. J. D. Swalen, A. L. Allara, J. D. Andrade, E. A. Chandross, S.Garoff, J. Israelachvili, T. J. McCarthy, R. Murray, R. F. Pease, J.F. Rabolt, K. J. Wynne, and H. Yu, Langmuir 3, 832 (1987).
23. T. H. Joo, M. S. Kim, and K. J. Kim, J. Raman Spectrosc. 18, 57(1987).
24. K. Y. Carron and L. G. Hurley, J. Phys. Chem. 95, 9979 (1991).25. J. M. Bello and T. Vo±Dinh, Appl. Spectrosc. 44, 63 (1990).26. K. I. Mullen and K. T. Carron, Anal. Chem. 63, 2196 (1991).27. M. Udagawa, C.-C. Chou, J. C. Hemminger, and S. Ushioda, Phys.
Rev. B 23, 6843 (1981).28. J. Billmann, G. Kovacs, and A. Otto, Surf. Sci. 92, 153 (1980).29. C. A. Murray and D. L. Allara, J. Chem. Phys. 76, 1290 (1982).30. F. J. Adrian, J. Chem. Phys. 77, 5302 (1982).31. B. Chase and B. Parkinson, J. Phys. Chem. 95, 7810 (1991).32. P. K. Aravind, A. Nitzan, and H. Metui, Surf. Sci. 110, 189 (1981).33. K. T. Carron, private communication.34. J. Gersten and A. Nitzan, J. Chem. Phys. 73, 3023 (1980).35. T. Vo-Dinh, M. Meier, and A. Wokaum, Anal. Chim. Acta 181, 139
(1986).36. Q. Ye, J. Fang, and L. Sun, J. Phys. Chem. B 101, 8221 (1997).37. M. Tsen and L. Sun, Anal. Chim. Acta 307, 333 (1995).38. W. B. Lacey, J. M. Williams, L. A. Wenzler, T. P. Beebe, Jr., and
J. M. Harris, Anal. Chem. 68, 1003 (1996).39. S. Kruszewski, SPIE-Int. Soc. Opt. Eng. 3320, 281 (1998).40. Y. Mo, I. Morke, and P. Wachter, Surf. Sci. 133, L452 (1983).41. B. Pettinger and L. Moerl, J. Electron Spectrosc. Relat. Phenom.
29, 383 (1983).42. T. E. Furtak and S. H. Macomber, Chem. Phys. Lett. 95, 328 (1983).43. P. Dawson, K. B. Alexander, J. R. Thompson, J. W. Haas III, and
T. L. Ferrell, Phys. Rev. B 44, 6372 (1991).44. P. Dawson, J. W. Haas III, K. B. Alexander, J. Thompson, and T.
L. Ferrill, Surf. Sci. 250, L383 (1991).45. R. E. Thun, ``Structures of Thin Films’ ’ , in Physics of Thin Films,
Vol. 1, G. Haas, Ed. (Academic Press, New York, New York, 1963).46. C. A. Neugebauer, ``Structural Disorder Phenomena in Thin Metal
Films’ ’ , in Physics of Thin Films, Vol. 2, G. Haas and R. E. Thun,Eds. (Academic Press, New York, New York, 1964).
47. R. E. Thun, `̀ Structure of Thin Films’ ’ , in Physics of Thin Films,Vol. 1, G. Haas, Ed. (Academic Press, New York, New York, 1963).
48. M. J. Stowell, ``Surface Processes in Thin-Film Growth’ ’ , in Mo-lecular Processes on Solid Surfaces , E. Drauglis, R. D. Gretz, andR. I. Jaffee, Eds. (McGraw±Hill, New York, New York, 1969).
49. C. A. Goss, D. H. Charych, and M. Majda, Anal. Chem. 63, 85(1991).
50. K. C. Grabar, R. G. Freeman, M. B. Hommer, and M. J. Natan,Anal. Chem. 67, 735 (1995).
51. F. J. Adrian, Chem. Phys. Lett. 78, 45 (1981).52. A. M. Alak and T. Vo±Dinh, Anal. Chem. 61, 656 (1989).53. R. P. van Duyne, J. C. Hulteen, and D. A. Treichel, J. Chem. Phys.
99, 2101 (1993).54. J. E. Rowe, C. V. Shank, D. A. Zwemer, and C. A. Murray, Phys.
Rev. Lett. 44, 1770 (1980).55. R. L. Birke, T. Lu, and J. R. Lombardi, ``Surface-Enhanced Raman
Spectroscopy’ ’ , in Techniques for Characterization of Electrodesand Electrochemical Processes, R. Varma and J. R. Selman, Eds.(John Wiley and Sons, New York, New York, 1991).