
Synthesis, characterization and SERS activity of biosynthesized silver nanoparticles
7
Synthesis, characterization and SERS activity of biosynthesized silver nanoparticles M.R. Bindhu a , V. Sathe b , M. Umadevi a,⇑ a Department of Physics, Mother Teresa Women’s University, Kodaikanal 624 101, Tamil Nadu, India b UGC-DAE Consortium for Scientific Research, University Campus, Khandwa Road, Indore 452 017, India highlights Ag nanoparticles were synthesized using Moringa oleifera flower extract as reducing agent. Shows size dependent SERS activity. Pyridine adsorbed on the silver surface in a stand-on orientation via its nitrogen lone pair electrons. graphical abstract Silver nanoparticles were synthesized using Moringa oleifera extract and its SERS activity. article info Article history: Received 22 March 2013 Received in revised form 6 June 2013 Accepted 12 June 2013 Available online 28 June 2013 Keywords: Moringa oleifera Surface plasmon resonance Surface Enhanced Raman Spectroscopy Retinoic acid Pyridine abstract Silver nanoparticles were rapidly synthesized using Moringa oleifera flower extract as the reducing agent shows surface plasmon resonance peak at 439 nm. The size and shape of the nanoparticles controlled by varying the concentration of M. oleifera flower extract in the reaction medium. The synthesized silver nanoparticles were well-dispersed spherical nanoparticles with the average size of 14 nm. The retinoic acid present in M. oleifera flower extract used as reducing agent and proteins was responsible for capping of the bioreduced silver nanoparticles. The obtained nanoparticle shows size-dependent SERS activity. The SERS spectrum indicates that the pyridine adsorbed on the silver surface in a stand-on orientation via its nitrogen lone pair electrons. Ó 2013 Elsevier B.V. All rights reserved. Introduction Metal nanoparticles have been used in the fields such as elec- tronics, photonics, biochemical sensing, non-linear optics and Sur- face Enhanced Raman Scattering (SERS) [1]. SERS was a highly sensitive technique based mostly on the electromagnetic (EM) enhancement stimulated by metal surfaces and associated with their localized plasmon resonance. SERS represented a great ad- vance in the field of Raman spectroscopy due to the large increase of the Raman cross section, as a result of the intensification of both the incident and the emitted radiations in the scattering process [2]. SERS activity of noble metal surfaces was a powerful method to understand the adsorption behavior of molecules on metal sur- faces. It reveals the orientation of molecules and the mechanism of interaction of the molecules with the surface. SERS was widely applied in single molecule or few molecules detection. There were many different ways to synthesize metal nanoparti- cles, including chemical, physical and biological methods. Among these methods, biological synthesis of metal nanoparticles was cost-effective, environment friendly, scaled up easily for large- scale synthesis, and there was no need to use high pressure, 1386-1425/$ - see front matter Ó 2013 Elsevier B.V. All rights reserved. http://dx.doi.org/10.1016/j.saa.2013.06.047 ⇑ Corresponding author. Tel.: +91 04542241685. E-mail address: [email protected] (M. Umadevi). Spectrochimica Acta Part A: Molecular and Biomolecular Spectroscopy 115 (2013) 409–415 Contents lists available at SciVerse ScienceDirect Spectrochimica Acta Part A: Molecular and Biomolecular Spectroscopy journal homepage: www.elsevier.com/locate/saa
-
Upload
motherteresawomenuniv -
Category
Documents
-
view
5 -
download
0
Transcript of Synthesis, characterization and SERS activity of biosynthesized silver nanoparticles

Spectrochimica Acta Part A: Molecular and Biomolecular Spectroscopy 115 (2013) 409–415
Contents lists available at SciVerse ScienceDirect
Spectrochimica Acta Part A: Molecular andBiomolecular Spectroscopy
journal homepage: www.elsevier .com/locate /saa
Synthesis, characterization and SERS activity of biosynthesized silvernanoparticles
1386-1425/$ - see front matter � 2013 Elsevier B.V. All rights reserved.http://dx.doi.org/10.1016/j.saa.2013.06.047
⇑ Corresponding author. Tel.: +91 04542241685.E-mail address: [email protected] (M. Umadevi).
M.R. Bindhu a, V. Sathe b, M. Umadevi a,⇑a Department of Physics, Mother Teresa Women’s University, Kodaikanal 624 101, Tamil Nadu, Indiab UGC-DAE Consortium for Scientific Research, University Campus, Khandwa Road, Indore 452 017, India
h i g h l i g h t s
� Ag nanoparticles were synthesizedusing Moringa oleifera flower extractas reducing agent.� Shows size dependent SERS activity.� Pyridine adsorbed on the silver
surface in a stand-on orientation viaits nitrogen lone pair electrons.
g r a p h i c a l a b s t r a c t
Silver nanoparticles were synthesized using Moringa oleifera extract and its SERS activity.
a r t i c l e i n f o
Article history:Received 22 March 2013Received in revised form 6 June 2013Accepted 12 June 2013Available online 28 June 2013
Keywords:Moringa oleiferaSurface plasmon resonanceSurface Enhanced Raman SpectroscopyRetinoic acidPyridine
a b s t r a c t
Silver nanoparticles were rapidly synthesized using Moringa oleifera flower extract as the reducing agentshows surface plasmon resonance peak at 439 nm. The size and shape of the nanoparticles controlled byvarying the concentration of M. oleifera flower extract in the reaction medium. The synthesized silvernanoparticles were well-dispersed spherical nanoparticles with the average size of 14 nm. The retinoicacid present in M. oleifera flower extract used as reducing agent and proteins was responsible for cappingof the bioreduced silver nanoparticles. The obtained nanoparticle shows size-dependent SERS activity.The SERS spectrum indicates that the pyridine adsorbed on the silver surface in a stand-on orientationvia its nitrogen lone pair electrons.
� 2013 Elsevier B.V. All rights reserved.
Introduction of the Raman cross section, as a result of the intensification of both
Metal nanoparticles have been used in the fields such as elec-tronics, photonics, biochemical sensing, non-linear optics and Sur-face Enhanced Raman Scattering (SERS) [1]. SERS was a highlysensitive technique based mostly on the electromagnetic (EM)enhancement stimulated by metal surfaces and associated withtheir localized plasmon resonance. SERS represented a great ad-vance in the field of Raman spectroscopy due to the large increase
the incident and the emitted radiations in the scattering process[2]. SERS activity of noble metal surfaces was a powerful methodto understand the adsorption behavior of molecules on metal sur-faces. It reveals the orientation of molecules and the mechanism ofinteraction of the molecules with the surface. SERS was widelyapplied in single molecule or few molecules detection.
There were many different ways to synthesize metal nanoparti-cles, including chemical, physical and biological methods. Amongthese methods, biological synthesis of metal nanoparticles wascost-effective, environment friendly, scaled up easily for large-scale synthesis, and there was no need to use high pressure,
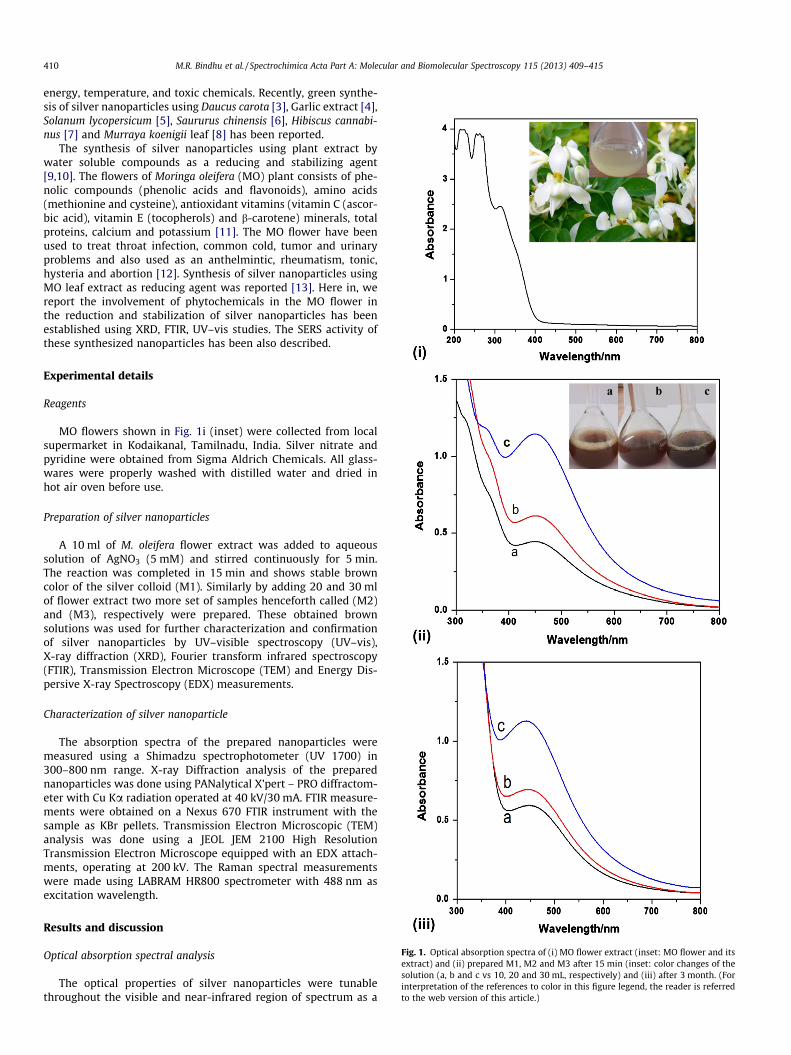
Fig. 1. Optical absorption spectra of (i) MO flower extract (inset: MO flower and itsextract) and (ii) prepared M1, M2 and M3 after 15 min (inset: color changes of thesolution (a, b and c vs 10, 20 and 30 mL, respectively) and (iii) after 3 month. (Forinterpretation of the references to color in this figure legend, the reader is referredto the web version of this article.)
410 M.R. Bindhu et al. / Spectrochimica Acta Part A: Molecular and Biomolecular Spectroscopy 115 (2013) 409–415
energy, temperature, and toxic chemicals. Recently, green synthe-sis of silver nanoparticles using Daucus carota [3], Garlic extract [4],Solanum lycopersicum [5], Saururus chinensis [6], Hibiscus cannabi-nus [7] and Murraya koenigii leaf [8] has been reported.
The synthesis of silver nanoparticles using plant extract bywater soluble compounds as a reducing and stabilizing agent[9,10]. The flowers of Moringa oleifera (MO) plant consists of phe-nolic compounds (phenolic acids and flavonoids), amino acids(methionine and cysteine), antioxidant vitamins (vitamin C (ascor-bic acid), vitamin E (tocopherols) and b-carotene) minerals, totalproteins, calcium and potassium [11]. The MO flower have beenused to treat throat infection, common cold, tumor and urinaryproblems and also used as an anthelmintic, rheumatism, tonic,hysteria and abortion [12]. Synthesis of silver nanoparticles usingMO leaf extract as reducing agent was reported [13]. Here in, wereport the involvement of phytochemicals in the MO flower inthe reduction and stabilization of silver nanoparticles has beenestablished using XRD, FTIR, UV–vis studies. The SERS activity ofthese synthesized nanoparticles has been also described.
Experimental details
Reagents
MO flowers shown in Fig. 1i (inset) were collected from localsupermarket in Kodaikanal, Tamilnadu, India. Silver nitrate andpyridine were obtained from Sigma Aldrich Chemicals. All glass-wares were properly washed with distilled water and dried inhot air oven before use.
Preparation of silver nanoparticles
A 10 ml of M. oleifera flower extract was added to aqueoussolution of AgNO3 (5 mM) and stirred continuously for 5 min.The reaction was completed in 15 min and shows stable browncolor of the silver colloid (M1). Similarly by adding 20 and 30 mlof flower extract two more set of samples henceforth called (M2)and (M3), respectively were prepared. These obtained brownsolutions was used for further characterization and confirmationof silver nanoparticles by UV–visible spectroscopy (UV–vis),X-ray diffraction (XRD), Fourier transform infrared spectroscopy(FTIR), Transmission Electron Microscope (TEM) and Energy Dis-persive X-ray Spectroscopy (EDX) measurements.
Characterization of silver nanoparticle
The absorption spectra of the prepared nanoparticles weremeasured using a Shimadzu spectrophotometer (UV 1700) in300–800 nm range. X-ray Diffraction analysis of the preparednanoparticles was done using PANalytical X’pert – PRO diffractom-eter with Cu Ka radiation operated at 40 kV/30 mA. FTIR measure-ments were obtained on a Nexus 670 FTIR instrument with thesample as KBr pellets. Transmission Electron Microscopic (TEM)analysis was done using a JEOL JEM 2100 High ResolutionTransmission Electron Microscope equipped with an EDX attach-ments, operating at 200 kV. The Raman spectral measurementswere made using LABRAM HR800 spectrometer with 488 nm asexcitation wavelength.
Results and discussion
Optical absorption spectral analysis
The optical properties of silver nanoparticles were tunablethroughout the visible and near-infrared region of spectrum as a

M.R. Bindhu et al. / Spectrochimica Acta Part A: Molecular and Biomolecular Spectroscopy 115 (2013) 409–415 411
function of nanoparticle size, shape, surface, aggregation state andlocal environment [14]. The optical spectrum of aqueous MO flow-er extract exhibits three bands at 221, 260 and 316 nm shown inFig. 1i. The absorption at 221 nm indicated the covalent linkageof peptide groups of protein main chain and the other peak at260 nm was assigned to the presence of aromatic amino acids oftryptophan and tyrosine and, to a small extent, disulfide bonds oftwo cysteine residues [15]. Amino acids were joined together bypeptide bonds to form the structure of proteins. The absorptionpeak at 316 nm indicated the presence of retinol, metabolite ofvitamin A [16].
When MO flower extract was added to the silver nitrate solu-tion, the solution becomes brown in color at 15 min, was due tothe excitation of surface plasmon vibrations. Generally, rapidnucleation in a small period of time was important in the forma-tion of monodispersed metal nanoparticles. Here, almost all Ag+
ions have reduced within 15 min to (Ag0) metallic species simulta-neously, followed by growth of the crystal nuclei. This synthesismethod of silver nanoparticles was faster compared to that ofour previous reports [3,5,7].
After 15 min of reaction, the UV–vis spectrum of the M1, M2and M3 was recorded (Fig. 1ii). It was observed that the character-istic SPR band centered at 450 nm and intensity increased withincreasing concentration of flower extract without any shift inthe peaks with small hemp around 350 nm. This indicates the pres-ence of retinoic acid in the MO flower extract.
Fig. 1iii shows the optical absorption spectra of M1, M2 and M3prepared after 90 days. The observed only one peak indicatesspherical nanoparticles with Cs symmetry [17]. As the concentra-tion of flower extract increases, the absorbance of the peak in-creased and become sharper. As shown in Fig. 1iii, a broad SPRwas observed for colloid M1 at 446 nm confirming the formationof nanoparticles with different size and shape. Colloid M3 showedthe formation of sharp and narrow SPR band at 439 nm indicatingthe formation of spherical nanoparticles with homogeneous distri-bution of silver nanoparticles. Based on these results, the concen-tration of flower extract plays an important role in the formationof silver nanoparticles.
The stability of the synthesized nanoparticles was studied bymeasuring its optical spectra of the silver colloids recorded after15 min to 90 days, since it was an important parameter in synthe-sis of nanoparticles. The formation of silver nanoparticles startedwithin 5 min, the intensity of the plasmon peak increased upto15 min, after which there was no change in color but slight varia-tion in surface plasmon resonance peak position upto 90 days.After 15 min, the availability of a larger number of nuclei induces
Fig. 2. X-ray diffraction pattern of (i) MO flower extract and (ii) silver nanopar
a decrease in the particle size, because smaller metal nuclei growand consume metal ions at the same time. This stability resultsfrom a potential barrier that develops as a result of the competitionbetween weak Van der Waals forces of attraction and electrostaticrepulsion.
XRD analysis
Biosynthesized silver nanostructure was confirmed by the char-acteristic peaks observed in XRD image. Fig. 2i shows the XRD pat-tern of the dried MO flower extract. The observed differentdiffraction peaks represent the presence of flavonoids (JCPDS No.38-1698 and 43-1695), phenolic compounds (JCPDS No. 07-0635,32-1516, 08-0566, and 30-1731), and amino acids (JCPDS No. 26-1856, 37-1998, 24-1928), antioxidant vitamins (JCPDS No. 22-1536, 22-1560) and waxes (JCPDS No. 03-0254, 03-0259, and 14-0763).
Fig. 2ii shows the XRD pattern of the silver nanoparticles M1and M3. The diffraction peaks observed at 38.02�, 44.2�, 64.33�and 77.39� in the 2h range, corresponding to the (111), (200),(220), and (311) reflection planes of face centered cubic (fcc)structure of metallic silver nanopowders with space group of Fm-3m (JCPDS file no. 04-0783). The observed additional peaks in theXRD pattern of silver nanoparticles M3, representing the presenceof amino acids and antioxidant vitamins in the MO flower extract.These peaks were much weaker when compared to those of silver,which indicates that the silver was the main material in the com-pound compared with those of the bulk counterpart. Based on ourXRD results, broadening in peaks at M3 occur due to the smallerparticle size, which reflect the effects of the experimental condi-tions on the nucleation and growth of the crystal nuclei [18]. Thiswas also confirmed by the estimation of particle size using Scher-rer formula was found to be decreasing particle size with increas-ing flower extract concentration. The calculated average particlesize was found to be 30 nm for M1 and 14 nm for M3. The calcu-lated cell volume for M1 and M3 was 68.71 Å3 and 68.41 Å3,respectively. The lattice parameter for M1 and M3 has been foundout to be 4.096 Å and 4.09 Å, respectively. The ratio between theintensity of the (200) and (111) diffraction peaks was 0.22 forM1 and 0.18 for M3, which was lower than the conventional bulkintensity ratio 0.52, suggesting that the (111) plane was the pre-dominant orientation as confirmed by HRTEM measurements.The calculated value of Specific Surface Area (SSA) of M1 was19.3 m2/g and M3 was 40.2 m2/g. This reveals that the Ag+ of silvernitrate had been reduced rapidly to Ag0 because of having addi-tional reaction surfaces with high SSA in M3.
ticles (a) JCPDS. 04-0783, (b) M1 and (c) M3 (⁄ due to MO flower extract).

412 M.R. Bindhu et al. / Spectrochimica Acta Part A: Molecular and Biomolecular Spectroscopy 115 (2013) 409–415
FTIR studies
FTIR measurements were carried to identify the possible bio-molecules in MO flower extract responsible for reduction and sta-bilization of the prepared silver nanoparticles. Fig. 3a shows theFTIR spectrum of MO flower extract, shows prominent bands lo-cated at 3362, 1580, 1411 and 1042 cm�1 in the 4000–500 cm�1
region. Four prominent bands were observed at 3405, 1629, 1364and 1108 cm�1 in the FTIR spectrum of M3 shown in Fig. 3b.
The peak observed around 3400 cm�1 can be assigned to OAHstretching vibrational band indicates the alcohol functional groupsof organic molecules [19]. The band at 1411 cm�1 in the MO flowerextract was observed in M3 as a strong band at 1364 cm�1 assignedto the ACAO stretching vibration modes of phytochemicals likewater soluble components such as phenolic compounds includingflavonoids, alkaloids and antioxidant vitamins [8,20]. It was possi-ble that the retinol present in the plant extract, adsorbed on thesurface of silver nanoparticles. The oxidation of reducible retinol(aldehyde group) to retinoic acid (carboxylic acid) possibly leadsto the reduction of Ag+ to Ag0 state.
The band at 1580 cm�1 in MO flower extract was upshifted inM3 was also may be due to the C@O stretching vibration and theNAH bending vibration band of peptide bonds. The well definedpeak at 1108 cm�1 corresponds to CAO, CAN or CAC stretchingof amino acids. These regions indicate the presence of proteins[21]. This represents release of some protein components intothe reaction medium may bind the nanoparticles through cysteineresidues in the proteins through hydrogen bond or it may cap thesilver nanoparticles through electrostatic attraction preventingfrom agglomeration and enhance the stability of the silver nano-particles. Protein components also control the retinoic acid levels,which control the synthesis and degrade the retinoic acid.
Here, the nucleation of silver nanoparticles may formed bytransferring charge from retinoic acid to Ag+ ions. Due to the Cou-lomb force, molecules of other phytochemicals possibly of aminoacid and proteins get adsorbed towards the silver nanoparticles
Fig. 3. FTIR spectrum of (a) MO flower extract and (b) M3.
and form electrostatic double layers and particle size was con-trolled. Due to the Van der walls force of attraction, diffuse doublelayer was formed by the adsorption of various layers of phyto-chemicals around this electrostatic double layer. Steric or electro-static barriers takes place around the silver nanoparticle surfacedue to the variability of the molecule structures of phytochemicalsin the MO flower extract. This may thereby supposed to cap the ob-tained silver nanoparticles, restrict the agglomeration and enhancethe stability.
TEM and EDS analysis
The morphology and internal crystalline structure of obtainednanoparticles (M1 and M3) was studied by TEM and SEAD patternshown in Figs. 1S and 2S (Supplemental information). The commonobtained shapes of M1 were spherical, tetrahedron and elongateddecahedron. Some of the particles exhibiting fivefold twinnedstructure (Fig. 1Sb, Supplemental information). SAED pattern(Fig. 1Sc, Supplemental information) also confirms the twin struc-ture. Noble metals having face-centered cubic (fcc) lattice have atendency to nucleate and grow into twinned and multiply twinnedparticles with their surfaces bounded by lowest energy facets(111) [22]. It was observed that the middle of the obtained parti-cles were darker than the ends, signifying that proteins in the MOflower extract capped the silver nanoparticles. It showed that thepresence of proteins along with the particles was adhering to theirsurfaces. The typical high-resolution TEM image (Fig. 1Sa (inset),Supplemental information) with clear lattice fringes having a spac-ing of 0.24 nm was in agreement with the (111) d-spacing of bulkAg (0.2355 nm) and the XRD results.
The obtained silver nanoparticles (M3) were almost spherical inshape. It was observed that most of the particles were well dis-persed and some of them were aggregated. The single silver nano-particle (Fig. 2Sb (Supplemental information)) shows a layer oforganic matrix with a �3 nm, act as capping agent used for thepreparation of silver nanoparticles. The selected-area electron dif-fraction (SAED) pattern observed in Fig. 2Sc (Supplemental infor-mation) shows spots in various orientations of the nanocrystalsclearly indicates good crystalline nature. The formation of silverwas further confirmed by the analysis of the energy dispersivespectroscopy shown in Figs. 1Sd and 2Sd (Supplemental informa-tion). It exhibits an optical absorption band at 3 keV due to theabsorption of metallic silver nanocrystallites.
SERS activity
Fig. 4a shows a typical normal Raman spectrum (nRs) of pyri-dine (Py). Fig. 4b and c depicts the SERS spectrum of pyridine ab-sorbed on the silver colloids Py/M1 and Py/M3, respectively. Theobtained SERS spectra shows enhancement in intensity, appear-ance of new peaks and broadening of peaks.
Pyridine (azabenzene), organic compound of the aromatic het-erocyclic series illustrated by a six-membered ring structure com-posed of five carbon atoms and one nitrogen atom. The molecularformula of pyridine was C5H5N. Pyridine was assumed to be planarand belongs to molecular symmetry C2m and it has 11 atoms andtherefore 27 fundamental modes of vibrations. These vibrationalmodes have the following distribution: 10a1 + 9b2 + 3a2 + 5b1 (a1
is IR; Raman, polarized, b2 and b1are IR; Raman, depolarized anda2 is Raman and depolarized).
Table 1 lists the observed SERS and Raman positions and theirtentative assignments according to the literature [23–26]. Theadsorption mechanism of an adsorbate deduced from the obtainedSERS spectrum. The binding sites in pyridine molecule werearomatic h–electron sextet, electro negative element–nitrogenand unshared pair of electrons of the nitrogen in CAN bond.

Fig. 4. Normal Raman spectrum of pyridine (a), SERS spectrum of M1 (b) and M3 (c).
Table 1Vibrational assignments of pyridine and pyridine adsorbed on silver nanoparticles.
Pyridine (nRs) (cm�1) Py/M1(SERS) (cm�1) Py/M3(SERS) (cm�1) Vibrational assignments
1575 1579 1582 C@N and ring stretching– 1477 – CAH in-plane bending1390 1405 1394 CAN and ring stretching1298 1298 1297 CAN and ring stretching1214 1214 1220 CAN stretching1138 1152 1152 In-plane CAH def.1029 1032 1033 Trigonal ring breathing998 1002 1002 Totally sym. ring breathing878 877 871 In-plane CAH def.699 693 706 In-plane ring def.– 648 654 In-plane ring def.600 607 605 In-plane ring distortion469 – – Out-of-plane ring def.420 415 416 Out-of-plane CAN def.327 – – Out-of-plane CAN def.– 230 238 AgAN stretching
M.R. Bindhu et al. / Spectrochimica Acta Part A: Molecular and Biomolecular Spectroscopy 115 (2013) 409–415 413
The orientation of the adsorbate on the metal surface will dependon these binding sites through which the interaction takes place.The possible orientation of the pyridine molecule on the silversurface were lying down (flat-on) on the silver surface throughbonding with the ring system or standing up (end-on) with bond-ing through the lone pair electrons of the pyridine ring nitrogen
atom with silver. The orientation of the pyridine molecule on thesilver surface can be deduced from ring stretching vibrations, thering breathing mode, in-plane and out-of-plane vibrations andthe SERS surface selection rule.
There were two enhancement mechanisms were generallydescribe SERS effect, the electromagnetic mechanism and the

414 M.R. Bindhu et al. / Spectrochimica Acta Part A: Molecular and Biomolecular Spectroscopy 115 (2013) 409–415
chemical mechanism. The enhancement in chemical mechanismconsists in increase in the molecular polaraizability of the adsor-bate due to the charge transfer interaction of the adsorbate withthe metal nanoparticle surface. In the electromagnetic mechanism,local electric fields in the surroundings of the metal nanoparticlewere enhanced due to the surface plasmon excitation, leading tomore intense electronic transitions in molecules located near thenanoparticle, and enhanced Raman scattering. The electromagneticmechanism depends on tunable optical properties of the metalnanoparticles that can be optimized in order to achieve higherSERS enhancements. In the present case, the SERS enhancementin the silver surfaces was explained through electromagnetic andchemical enhancement mechanism.
The position of the ring breathing mode represents adequateinformation of the orientation in aromatic compound, pyridine.The trigonal ring breathing mode occurs at 1033 and 1032 cm�1,in Py/M3 and Py/M1 respectively, was also observed in nRs at1029 cm�1 as a strong band. Similarly the symmetric ring breath-ing mode of SERS occurs at 1002 cm�1 was upshifted by about5 cm�1 and the bandwidth was decreased, compared to 998 cm�1
for nRs. In the SERS spectra, the metal–molecule interactions in-crease the frequency of the ring breathing mode when comparedto the spectrum of the ‘‘free’’ molecule in the liquid state. It wasclearly suggests that pyridine adsorbed on the silver surface inan end-on orientation.
The ring stretching vibrations are most prominent in thespectrum of pyridine and its derivatives are highly characteristicof aromatic ring. Medium intense bands in the general region1600–1300 cm�1 were assigned to ring stretching vibration [23].Pyridine show an absorption band in the region 1600–1500 cm�1
due to the C@N ring stretching vibrations [24]. The C@N stretchingband at 1575 cm�1 was upshifted about 7 cm�1 in Py/M3 and4 cm�1 in Py/M1in the SERS spectrum along with band broadening.This blue shifted ring mode indicates the direct interaction of pyr-idine ring moiety with the metal surface and the probability of di-rect ring p orbital to metal interaction should be high. The CANstretching bands at 1390 and 1214 cm�1 in nRs was upshifted inboth Py/A1 and Py/A3. The intensity of all stretching vibrationswas highly enhanced in Py/M3. The frequency difference betweenthe nRs and SERS of the ring and stretching vibration was around5 cm�1 in Py/M3 and 10 cm�1 in Py/M1suggests that pyridineadsorbed via its nitrogen lone pair electrons. This confirms the ori-entation of pyridine on silver nanoparticles was stand-on configu-ration. From the observed up-shifted peaks and its wavenumbers,it was difficult to make orientation of the pyridine molecules onthe silver surface using ring stretching vibrations.
In the present case, the observed intensities of Py/M1 andPy/M3 greatly influenced by the size of the particle size. Here,the overall SERS intensity in Py/M3 was highly enhanced when itwas compared to Py/M1. This was due to the smaller size of M3(14 nm) having larger surface area (40.2 m2/g). The smaller parti-cles with larger surface area, increases the electromagnetic field[27]. The electromagnetic field is the only factor affecting SERS tochange with particle size, and this is independent of particle–metalinteraction. The enhancement of the electric field at the interfaceand the resonance with the surface plasmon absorption band dueto the excitation of the conduction electrons localized at the silversurface are responsible for the observed high SERS intensity due toelectromagnetic effect. The electromagnetic field was independentof molecule–metal interaction. The particle size increased withincreasing electromagnetic enhancement, but the larger particleabsorb less light and scatter more through inelastic scattering. Thisis supposed to decrease the SERS intensity in Py/M1. When pyri-dine molecules adsorbed on silver nanoparticles in stand-on orien-tation, the polaraizability tensor of CAN bond will be normal to thesurface. This will results in observed high enhancement in Py/M3.
According to the SERS surface selection rules, the vibrations withpolaraizability tensor normal to the surface provides higher inten-sity enhancement [28].
The in-plane vibrational modes occur at 1477, 1152, 871,706and 654 cm�1in SERS spectra. Here, the SERS intensity of in-planevibrational modes increased with respect to nRs. But in the caseof Out-of plane vibrational modes the SERS intensity degreasedwith increasing nRs intensity. In our case, the overall intensity ofout-of-plane modes decreased with respect to the in-plane bend-ing mode. This once again confirms the stand-on orientation ofpyridine adsorbed silver nanoparticles [29]. When the moleculesadsorbed stand-on the silver surface, the polaraizability tensor cor-responding to out-plane vibrations was parallel to the metal sur-face. The absence of some of the out-of-plane bending modesand the presence of strong in-plane modes at 654 and 605 cm�1-
also indicates that the greater possibility of the stand-on orienta-tion of pyridine adsorbed silver nanoparticles.
In the present case, a new strong band appears at 238 cm�1 inSERS was due to AgAN stretching vibration [26]. This indicates thatthe pyridine molecule was adsorbed on silver surface through thenitrogen atoms in stand-on orientation. The observed high SERSsignal indicates that the prepared silver nanoparticles are goodsource for biomedical applications as SERS substrate.
Conclusion
The present study was aimed to rapid synthesis of silver nano-particles using flower extract of M. oleifera as reducing agent. Thisgreen synthesis method has formed spherical silver nanoparticleswith average size of 14 nm. This method is simple, efficient, eco-nomic and alternative to hazardous chemical procedures. The pre-pared silver nanoparticles were characterized by UV–visible,Fourier transform infrared spectroscopy (FTIR), transmission elec-tron microscopy (TEM) and energy dispersive spectroscopy (EDS)technique to identify the size, shape of silver nanoparticles andbiomolecules act as reducing and capping agents. FTIR measure-ments show that proteins in MO flower extract was adsorbed onsilver nanoparticles. It also indicates that retinoic acid present inMO flower extract was used as reducing agent and proteins presentin MO flower extract as capping agent. The prepared silver nano-particles were stable for three months without aggregation. Thesurface plasmon resonance of prepared silver nanoparticles wereconfirmed by UV–visible spectral analysis. As the concentrationof MO flower extract increases, absorption spectra shows blue shiftwith decreasing particle size. Crystalline nature of the nanoparti-cles was evident from bright spots in the SAED pattern and peaksin the XRD pattern. The SERS spectral analysis indicates that thesmaller silver nanoparticles with larger surface area reveal highSERS activity. The vibration features of CAN and AgAN stretchingmodes and in-plane CH bending modes suggest that the pyridinemolecule adsorbed in a stand-on orientation on the silver surface.
Acknowledgement
The authors are thankful to DST–CURIE New Delhi, UGC–DAE–CSR Indore for financial assistance.
Appendix A. Supplementary material
Supplementary data associated with this article can be found, inthe online version, at http://dx.doi.org/10.1016/j.saa.2013.06.047.
References
[1] M.A. El-Sayed, Acc. Chem. Res. 34 (2001) 257–264.[2] M. Moskovits, Rev. Mod. Phys. 57 (1985) 783–826.

M.R. Bindhu et al. / Spectrochimica Acta Part A: Molecular and Biomolecular Spectroscopy 115 (2013) 409–415 415
[3] M. Umadevi, S. Shalini, M.R. Bindhu, Adv. Nat. Sci. Nanosci. Nanotechnol. 3(2012) 1–6. 025008.
[4] V.W. Gregory, J. Nanomater. 10 (2012). doi.1155/2012/730746..[5] M. Umadevi, M.R. Bindhu, V. Sathe, J. Mater. Sci. Technol. 29 (2013) 317–322.[6] P.C. Nagajyoti, T.N.V.K.V. Prasad, T.V.M. Sreekanth, Kap duk lee, Dig. J.
Nanomater. Bios. 6 (2011) 121–133.[7] M.R. Bindhu, M. Umadevi, Spectrochim. Acta A 101 (2013) 184–190.[8] D. Philip, C. Unni, S.A. Aromal, V.K. Vidhu, Spectrochim. Acta A 78 (2011) 899–
904.[9] J. Huang, Q. Li, D. Sun, Y. Lu, Y. Su, X. Yang, H. Wang, Y. Wang, W. Shoa, N. He, J.
Hong, C. Chen, Nanotechnology 18 (2007) 105104.[10] D. Philip, Spectrochim. Acta A 77 (2010) 807–810.[11] S. Rangaswani, S. Sankarasubramian, Curr. Sci. 15 (1946) 316–317.[12] H.T. Ganatra, H.U. Josh, N.P. Bhalodia, R.T. Desai, P.R. Trigar, IRJP 3 (2012) 1–7.[13] T.N.V.K.V. Prasad, E.K. Elumalai, Asian Pac. J. Trop. Biomed. (2011) 439–442.
doi:10.1016/S2221-1691(11)60096-8.[14] C.J. Murphy, T.K. Sau, A.M. Gole, C.J. Orendorff, J.L. Gou, S.E. Hunyadi, T. Li, J.
Phys. Chem. B 109 (2005). 13857-138702.[15] D. Philip, C. Unni, Physica E 43 (2011) 1318–1322.[16] C. Errico, M. Gazzarri, F. Chiellini, Int. J. Mol. Sci. 10 (2009) 2336–2347.
[17] D.E. Sands, Introduction to Crystallography, Dover, New York, 1993. p. 51.[18] A. Becheri, M. Durr, P.L. Nostro, P.J. Baglioni, Nanopart. Res. 10 (2008) 679–689.[19] Y.M. Li, S.Q. Sun, Q. Zhou, Z. Qin, J.X. Tao, J. Wang, X. Fang, Vib. Spectrosc. 36
(2004) 227–232.[20] H. Schulz, M. Baranska, Vib. Spectrosc. 43 (2007) 13–25.[21] T. Solomun, A. Schimanski, H. Sturm, E. Illenberger, Chem. Phys. Lett. 387
(2004) 312–316.[22] J.G. Allpress, J.V. Sanders, Surf. Sci. 7 (1967) 1–25.[23] R.M. Silverstein, F.X. Webster, Spectrometric Identification of Organic
Compounds, sixth ed., Wiley, Asia, 2003.[24] G. Socrates, Infrared and Raman Characteristics Group Frequencies Tables and
Charts, third ed., Wiley, Chichoster, 2001.[25] B.S. Yadav, I. Ali, P. Kumar, P. Yadav, Indian J. Pure & Appl. Phys. 45 (2007) 979–
983.[26] K.G. Stamplecoskie, J.C. Scaiano, V.S. Tiwari, H. Anis, J. Phys. Chem. 115 (2011)
1403–1409.[27] J.A. Creighton, R.J.H. in Clark, R.E. Hester (Eds.), Advances in Spectroscopy,
Spectroscopy of Surfaces, vol. 16, Wiley, New York, 1988, p. 37.[28] S.W. Joo, S.W. Han, H.S. Han, K. Kim, J. Raman Spectrosc. 31 (2000) 145–150.[29] D.H. Son, S.J. Ahn, Y.J. Lee, K. Kim, J. Phys. Chem. 98 (1994) 8488–8493.