A Novel Synthesis of Malic acid capped Silver Nanoparticles using S. lycopersicums
7
This article appeared in a journal published by Elsevier. The attached copy is furnished to the author for internal non-commercial research and education use, including for instruction at the authors institution and sharing with colleagues. Other uses, including reproduction and distribution, or selling or licensing copies, or posting to personal, institutional or third party websites are prohibited. In most cases authors are permitted to post their version of the article (e.g. in Word or Tex form) to their personal website or institutional repository. Authors requiring further information regarding Elsevier’s archiving and manuscript policies are encouraged to visit: http://www.elsevier.com/authorsrights
-
Upload
motherteresawomenuniv -
Category
Documents
-
view
1 -
download
0
Transcript of A Novel Synthesis of Malic acid capped Silver Nanoparticles using S. lycopersicums
This article appeared in a journal published by Elsevier. The attachedcopy is furnished to the author for internal non-commercial researchand education use, including for instruction at the authors institution
and sharing with colleagues.
Other uses, including reproduction and distribution, or selling orlicensing copies, or posting to personal, institutional or third party
websites are prohibited.
In most cases authors are permitted to post their version of thearticle (e.g. in Word or Tex form) to their personal website orinstitutional repository. Authors requiring further information
regarding Elsevier’s archiving and manuscript policies areencouraged to visit:
http://www.elsevier.com/authorsrights

Author's personal copy
A Novel Synthesis of Malic Acid Capped Silver Nanoparticles using
Solanum lycopersicums Fruit Extract
M. Umadevi1)*, M.R. Bindhu1), V. Sathe2)
1) Department of Physics, Mother Teresa Women’s University, Kodaikanal 624 102, Tamil Nadu, India2) UGC-DAE Consortium for Scientific Research, University Campus, Khandwa Road, Indore 452 017, India
[Manuscript received April 12, 2012, in revised form July 10, 2012, Available online 9 February 2013]
Integration of green chemistry principles to nanotechnology is one of the key issues in nanoscience research. Thedevelopment of the concept of green nanoparticle preparation has been growingly needed for environmentallybenign metal nanoparticle synthesis protocols to avoid adverse effects in medical applications. Keep this inmind, in the present study, silver nanoparticles were synthesized using Solanum lycopersicums fruit extract.The prepared silver nanoparticles were characterized by UVevisible spectroscopy, Fourier transform infraredspectroscopy, Raman spectroscopy, scanning electron microscopy and transmission electron microscopytechniques. The surface plasmon resonance peak was found at 445 nm. The synthesized silver nanoparticleswere spherical in shape with the average size of 10 nm. The citric acid present in S. lycopersicums fruitextract acted as reducing agent and malic acid was responsible for capping of the bioreduced silvernanoparticles.
KEY WORDS: Silver nanoparticles; Solanum lycopersicums; UVevisible spectroscopy; Fourier transform infrared spectroscopy; Ramanspectroscopy
1. Introduction
Metal nanoparticles are being widely used nowadays in theareas such as photography, catalysis, biosensing, imaging, drugdelivery, photonics, optoelectronics, biological labeling, nano-device fabrication, surface enhanced Raman scattering (SERS)and medicine[1�3] due to their unique electrical, optical as wellas biological properties. The size, shape and surface morphologyplay a vital role in controlling the physical, chemical, optical andelectronic properties of nanomaterials. Silver nanoparticles is ofparticular interest because of unique properties such as goodelectrical conductivity, chemical stability, catalytic and anti-bacterial activity[4].In most of the chemical reduction methods, metal nano-
particles have been synthesized using sodium borohydride asreducing agent, which is highly reactive and pose potentialenvironmental and biological risks. Utilization of nontoxicchemicals, environmentally benign solvents and renewable ma-terials are some of the key issues that merit important consid-eration in a green synthesis strategy[5�7].
Integration of green chemistry principles to nanotechnology isone of the key issues in nanoscience research. The developmentof the concept of green nanoparticle preparation has beengrowingly needed for environmentally benign metal nanoparticlesynthesis protocols to avoid adverse effects in medical applica-tions. This has been started by Raveendran et al.[7]. Applicationof green chemistry for the synthesis of biocompatible metalnanoparticles has gained considerable attention in recent yearsfor potential applications in biomedicine[8,9].Solanum lycopersicum (tomato) is excellent sources of po-
tassium, folate, and vitamins A, C, and E. Tomatoes also containa variety of phytochemicals, including carotenoids and poly-phenols. In tomatoes, lycopene is the carotenoid with the highestconcentration, but tomatoes also contain other carotenoids,including phytoene, phytofluene, flavonoids, quercetin, kaemp-ferol and the provitamin A carotenoids beta-carotene. The pre-dominant organic acid in tomato is citric acid; malic acid is alsopresent as a major constituent, with very small amounts of acetic,lactic, and oxalic acid[10]. Sugar and organic acid contents intomatoes give its sweet-sour taste. Composition of dry mattercontent of tomato contains 9% of citric acid, 4% of malic acid,and 0.5% of ascorbic acid, 1% of other amino acids, vitamins,and polyphenols[11]. Citric and malic acid ratio in the ripe redand green fruit tomato is 1e0.6 and 1e1.3, respectively.In the synthesis of PbWO4 crystals, vitamin C present in the
tomato extract has been reported by Shen et al.[12]. Citric acidand ascorbic acid present in the Citrus limon aqueous extract
* Corresponding author. Ph.D; E-mail address: [email protected] (M.Umadevi).1005-0302/$e see front matter Copyright� 2013, The editorial office ofJournal of Materials Science & Technology. Published by ElsevierLimited. All rights reserved.http://dx.doi.org/10.1016/j.jmst.2013.02.002
Available online at SciVerse ScienceDirect
J. Mater. Sci. Technol., 2013, 29(4), 317e322
Author's personal copy
were used as bioreductant in the formation of silver nano-particles[4]. The reducing agents oxalic acid/ascorbic acid presentin the fenugreek leaf extract, result in the nucleation of silvernanoparticles followed by condensation, and surface reduc-tion[13]. The water-soluble ingredients such as flavonoids andterpenoids present in the Ocimum sanctum leaf extract areresponsible for the formation of silver nanoparticles[14]. Ascorbicacid present in D. carota extract is used as reducing agent in thesynthesis of silver nanoparticles[15]. In the synthesis of silvernanoparticles, polyphenols are the plant-derived compounds,which are efficient reducing agent[16]. Green synthesis of silvernanoparticles using starch[17], banana peel extract[18], leaf extractof Rosa rugosa[19], seed extract of Jatropha curcas[20], sucroseand maltose[21], Hibiscus rosa sinensis[22], Cochlospermumgossypium[23] and honey[24] have been reported.In this study, a simple and rapid green synthesis of silver
nanoparticles using S. lycopersicums fruit extract has beenreported. The fruit extract of S. lycopersicums was used asa bioreductant for the synthesis of silver nanoparticles.
2. Experimental
2.1. Material and methods
Silver nitrate was obtained from SigmaeAldrich Chemicals.All glasswares have been washed with distilled water and driedin an oven before use. Fresh fruits of S. lycopersicums have beencollected from local supermarket in Kodaikanal, Tamilnadu,India.
2.2. Preparation of S. lycopersicums fruit extract
The fresh fruits of S. lycopersicums were washed several timeswith distilled water to remove the dust. 100 g of washedS. lycopersicums were crushed in a mixer grinder for extract. Theextract was then separated by centrifugation at 1000 r/min for5 min to remove insoluble fractions and macromolecules andfinally a light red extract was collected for further experiments.
2.3. Preparation of silver nanoparticles
For the green synthesis of silver nanoparticles, 6 ml ofS. lycopersicums fruit extract was mixed to 50 ml aqueous so-lution of AgNO3 (10�2 mol/L) and stirring continued at 30 �Cfor 1 min and it was turned to brown color after 20 min, whichgives silver colloid (B6). Similarly by adding 8, 10, 12 and 14 mlof extract four more set of samples henceforth called B8, B10,B12 and B14, respectively were prepared. UVevisible spectrawere taken when the samples were in solution form. After 7 daysthe solutions were dried at 200 �C for 2 h. The dried powders B6and B14 were taken for the characterization such as X-ray dif-fraction (XRD), Fourier transform infrared spectroscopy (FTIR),Raman spectroscopy, scanning electron microscopy (SEM) andtransmission electron microscopy (TEM).
2.4. Characterization of the synthesized nanoparticles
Synthesis of silver nanoparticles by reducing silver ion solu-tion with S. lycopersicums fruit extract may be easily observedby UVevisible spectroscopy. The absorption spectra at differentS. lycopersicums extract quantities were measured with
a Shimadzu spectrophotometer (UV1700) in the range of 300e800 nm. Time dependent variations were also observed (1 h and7 days after the preparation). On 7th day the silver colloid wasdiluted in 1:3 (silver colloid:distilled water) ratio for UVevisiblemeasurement, since it showed higher absorbance (crosses theupper limit of the instrument). The synthesized nanocrystallinepowder was identified by the XRD method with an ‘X’ Pert PROPANalytical diffractometer using nickel-filtered CuKa radiationas source and operated at 40 kV and 30 mA. The sample wasscanned in the 2q ranging from 10� to 80� for 2 s in the step scanmode. The observed peak positions were compared with thestandard ICDD data and Miller indices were assigned to theBragg peaks. TEM analysis was done by using an FEI Tecnai-G2-20 model operating at 200 kV. SEM (HITACHI model S-3000H) was used to examine the surface morphology of thepowders. FTIR measurements were obtained on a Nexus 670FTIR instrument with the sample as KBr pellets. Micro-Ramanmeasurements were carried out in backscattering geometrywith the 632.8 nm line of a He�Ne laser at a power level ofw5 mW for an integration time of 30 s. The spectra wererecorded by using LABRAM HR800 spectrometer equippedwith Peltier cooled CCD. A high-resolution grating of 1800 g/mm was used for the measurement, giving spectral resolution ofw1 cm�1.
3. Results and Discussion
3.1. UVevisible spectral studies
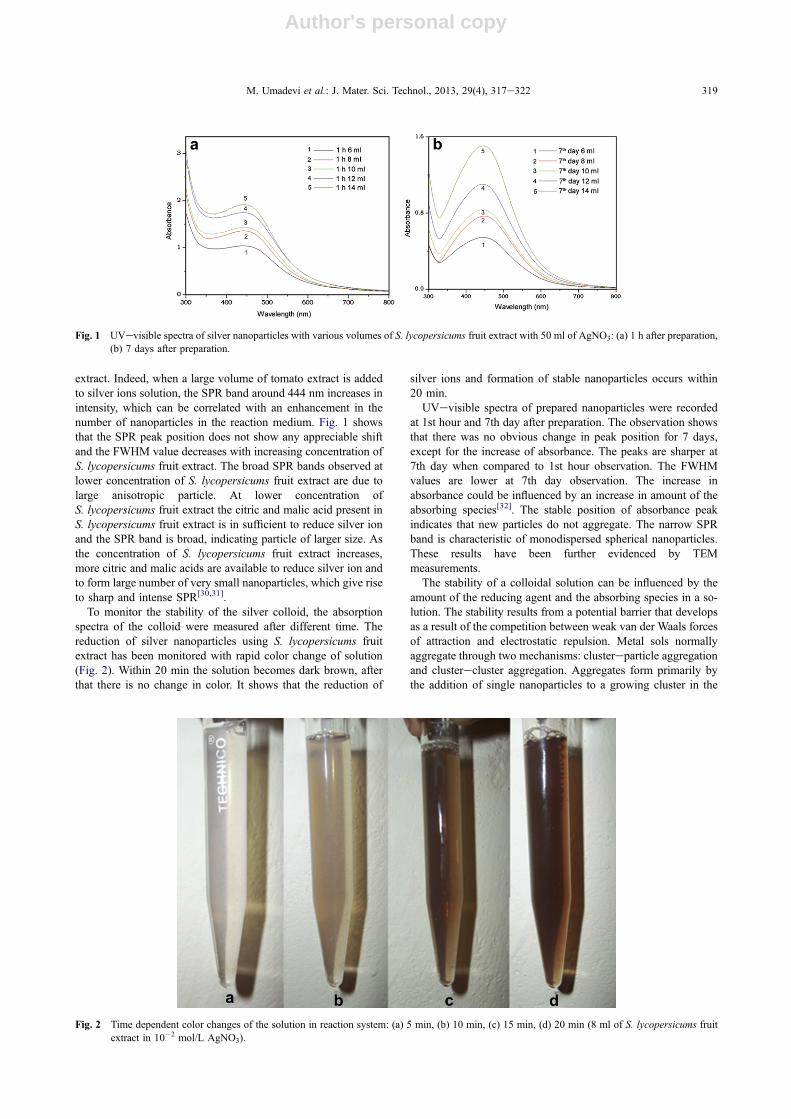
UVevisible absorption spectra have been proved to be quitesensitive to the formation of silver colloids because silvernanoparticles exhibit an intense absorption peak due to the sur-face plasmon excitation (the collective excitation of conductionelectrons in a metal)[25]. The position of the plasmon absorptionpeak depends on the particle size and shape and the adsorption ofnucleophile or electrophile to the particle surface. Usually, a redshift is associated with an increase in particle size or with thewithdrawal of electron density from the surface. It is well-knownthat adsorption of the nucleophile to the particle surface in-creases the Fermi level of the silver particle owing to its donationof electron density to the particles[26]. The absorption spectrumof isolated spherical particles is characterized by the Mie reso-nance at a frequency u0 such that: 3s(u0) ¼ �2 3m, where 3s(u) isthe dielectric function of the silver spherical particles and 3m isthe dielectric function of the surrounding medium[27].Fig. 1 shows the UVevisible absorption spectra of the silver
colloid in the range of 300e800 nm. The typical peak around445 nm corresponds to the characteristic surface plasmon reso-nance (SPR) of silver nanoparticles. The plasmon peak and thefull-width at half-maximum (FWHM) depend on the extent ofcolloid aggregation[28]. The observed plasmon band is symmet-ric, which indicates that the solution does not contain anyaggregated particles. TEM image also confirm this result. Theobserved plasmon bands are broad with an absorption tail in thelonger wavelengths, which could be in principle due to the sizedistribution of the particles[29]. A concentration variation studyof AgNO3 using S. lycopersicums fruit extract was carried outwith various volumes of S. lycopersicums fruit extract. Fig. 1shows that the concentration of S. lycopersicums fruit extractplays an important role in the formation of silver nanoparticles,revealed by the intensity of SPR band around 444 nm, whichincreases with increasing concentration of S. lycopersicums fruit
318 M. Umadevi et al.: J. Mater. Sci. Technol., 2013, 29(4), 317e322
Author's personal copy
extract. Indeed, when a large volume of tomato extract is addedto silver ions solution, the SPR band around 444 nm increases inintensity, which can be correlated with an enhancement in thenumber of nanoparticles in the reaction medium. Fig. 1 showsthat the SPR peak position does not show any appreciable shiftand the FWHM value decreases with increasing concentration ofS. lycopersicums fruit extract. The broad SPR bands observed atlower concentration of S. lycopersicums fruit extract are due tolarge anisotropic particle. At lower concentration ofS. lycopersicums fruit extract the citric and malic acid present inS. lycopersicums fruit extract is in sufficient to reduce silver ionand the SPR band is broad, indicating particle of larger size. Asthe concentration of S. lycopersicums fruit extract increases,more citric and malic acids are available to reduce silver ion andto form large number of very small nanoparticles, which give riseto sharp and intense SPR[30,31].To monitor the stability of the silver colloid, the absorption
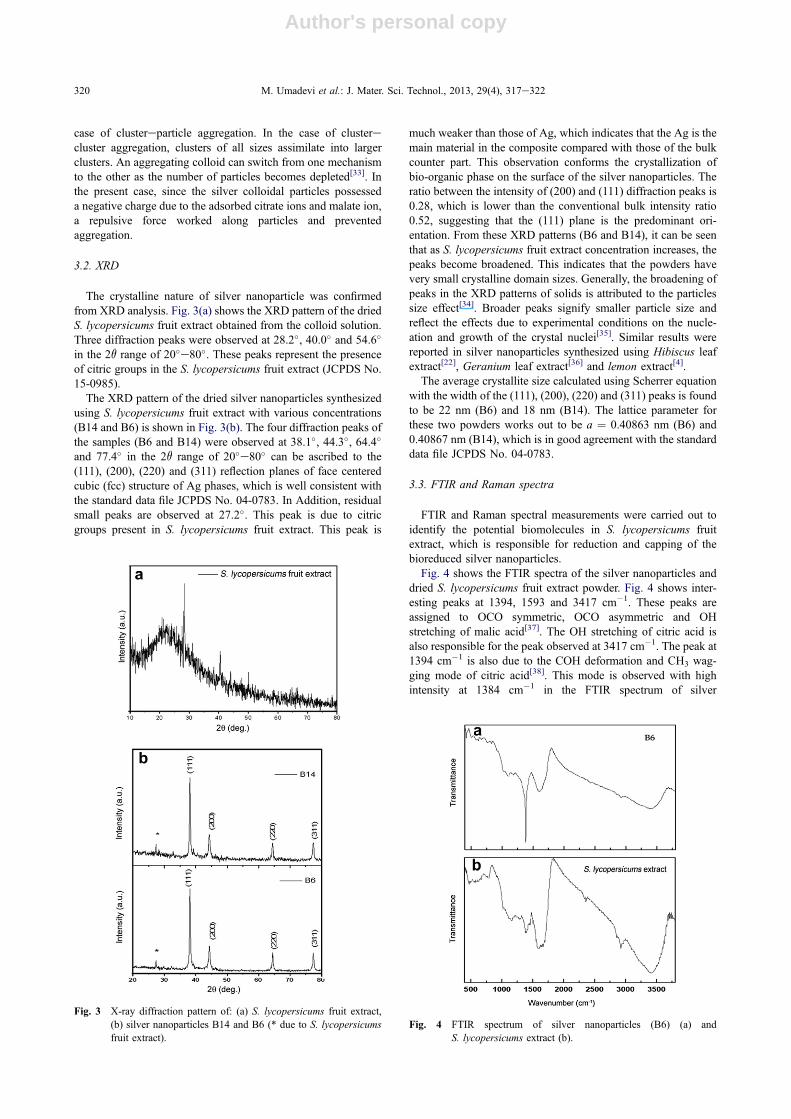
spectra of the colloid were measured after different time. Thereduction of silver nanoparticles using S. lycopersicums fruitextract has been monitored with rapid color change of solution(Fig. 2). Within 20 min the solution becomes dark brown, afterthat there is no change in color. It shows that the reduction of
silver ions and formation of stable nanoparticles occurs within20 min.UVevisible spectra of prepared nanoparticles were recorded
at 1st hour and 7th day after preparation. The observation showsthat there was no obvious change in peak position for 7 days,except for the increase of absorbance. The peaks are sharper at7th day when compared to 1st hour observation. The FWHMvalues are lower at 7th day observation. The increase inabsorbance could be influenced by an increase in amount of theabsorbing species[32]. The stable position of absorbance peakindicates that new particles do not aggregate. The narrow SPRband is characteristic of monodispersed spherical nanoparticles.These results have been further evidenced by TEMmeasurements.The stability of a colloidal solution can be influenced by the
amount of the reducing agent and the absorbing species in a so-lution. The stability results from a potential barrier that developsas a result of the competition between weak van der Waals forcesof attraction and electrostatic repulsion. Metal sols normallyaggregate through two mechanisms: clustereparticle aggregationand clusterecluster aggregation. Aggregates form primarily bythe addition of single nanoparticles to a growing cluster in the
Fig. 2 Time dependent color changes of the solution in reaction system: (a) 5 min, (b) 10 min, (c) 15 min, (d) 20 min (8 ml of S. lycopersicums fruitextract in 10�2 mol/L AgNO3).
Fig. 1 UVevisible spectra of silver nanoparticles with various volumes of S. lycopersicums fruit extract with 50 ml of AgNO3: (a) 1 h after preparation,(b) 7 days after preparation.
M. Umadevi et al.: J. Mater. Sci. Technol., 2013, 29(4), 317e322 319
Author's personal copy
case of clustereparticle aggregation. In the case of clusterecluster aggregation, clusters of all sizes assimilate into largerclusters. An aggregating colloid can switch from one mechanismto the other as the number of particles becomes depleted[33]. Inthe present case, since the silver colloidal particles possesseda negative charge due to the adsorbed citrate ions and malate ion,a repulsive force worked along particles and preventedaggregation.
3.2. XRD
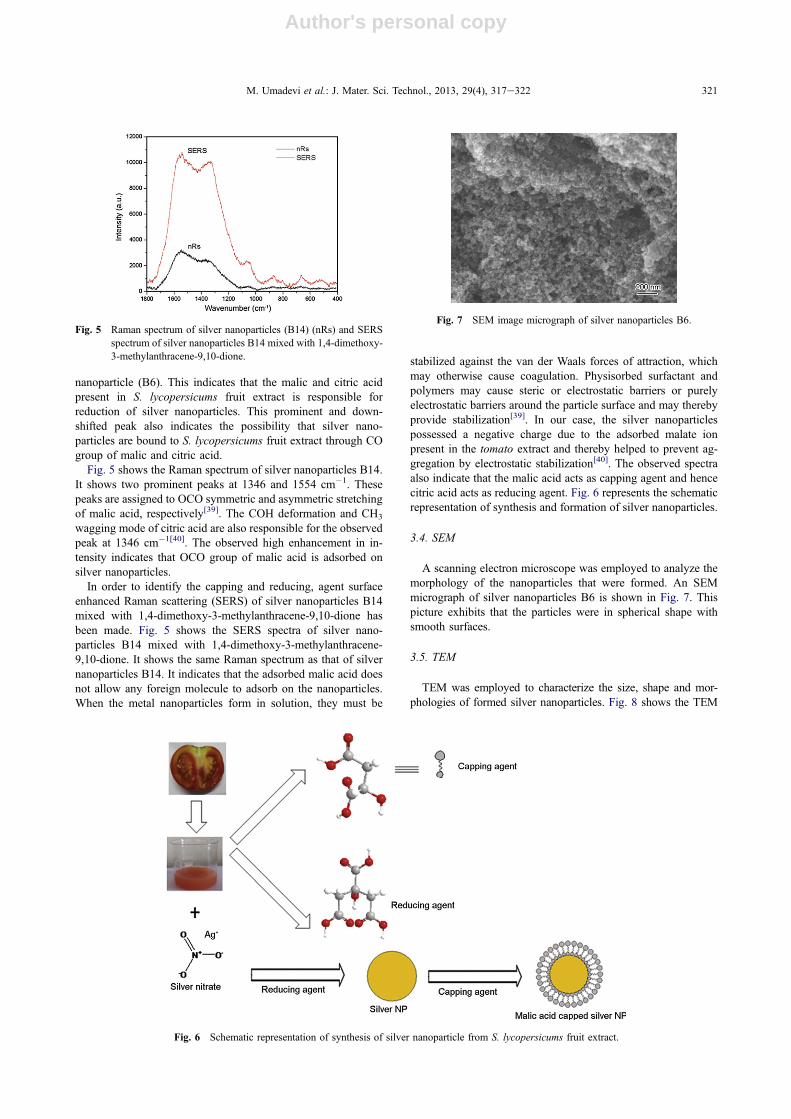
The crystalline nature of silver nanoparticle was confirmedfrom XRD analysis. Fig. 3(a) shows the XRD pattern of the driedS. lycopersicums fruit extract obtained from the colloid solution.Three diffraction peaks were observed at 28.2�, 40.0� and 54.6�
in the 2q range of 20�e80�. These peaks represent the presenceof citric groups in the S. lycopersicums fruit extract (JCPDS No.15-0985).The XRD pattern of the dried silver nanoparticles synthesized
using S. lycopersicums fruit extract with various concentrations(B14 and B6) is shown in Fig. 3(b). The four diffraction peaks ofthe samples (B6 and B14) were observed at 38.1�, 44.3�, 64.4�
and 77.4� in the 2q range of 20�e80� can be ascribed to the(111), (200), (220) and (311) reflection planes of face centeredcubic (fcc) structure of Ag phases, which is well consistent withthe standard data file JCPDS No. 04-0783. In Addition, residualsmall peaks are observed at 27.2�. This peak is due to citricgroups present in S. lycopersicums fruit extract. This peak is
much weaker than those of Ag, which indicates that the Ag is themain material in the composite compared with those of the bulkcounter part. This observation conforms the crystallization ofbio-organic phase on the surface of the silver nanoparticles. Theratio between the intensity of (200) and (111) diffraction peaks is0.28, which is lower than the conventional bulk intensity ratio0.52, suggesting that the (111) plane is the predominant ori-entation. From these XRD patterns (B6 and B14), it can be seenthat as S. lycopersicums fruit extract concentration increases, thepeaks become broadened. This indicates that the powders havevery small crystalline domain sizes. Generally, the broadening ofpeaks in the XRD patterns of solids is attributed to the particlessize effect[34]. Broader peaks signify smaller particle size andreflect the effects due to experimental conditions on the nucle-ation and growth of the crystal nuclei[35]. Similar results werereported in silver nanoparticles synthesized using Hibiscus leafextract[22], Geranium leaf extract[36] and lemon extract[4].The average crystallite size calculated using Scherrer equation
with the width of the (111), (200), (220) and (311) peaks is foundto be 22 nm (B6) and 18 nm (B14). The lattice parameter forthese two powders works out to be a ¼ 0.40863 nm (B6) and0.40867 nm (B14), which is in good agreement with the standarddata file JCPDS No. 04-0783.
3.3. FTIR and Raman spectra
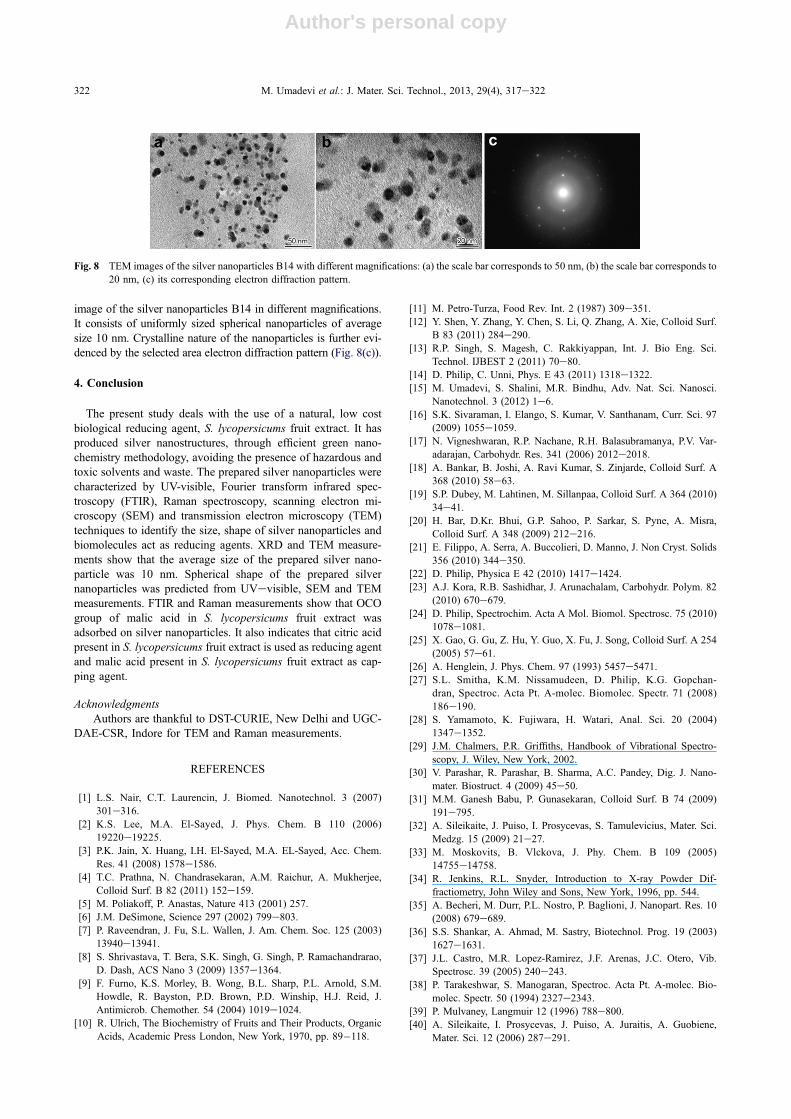
FTIR and Raman spectral measurements were carried out toidentify the potential biomolecules in S. lycopersicums fruitextract, which is responsible for reduction and capping of thebioreduced silver nanoparticles.Fig. 4 shows the FTIR spectra of the silver nanoparticles and
dried S. lycopersicums fruit extract powder. Fig. 4 shows inter-esting peaks at 1394, 1593 and 3417 cm�1. These peaks areassigned to OCO symmetric, OCO asymmetric and OHstretching of malic acid[37]. The OH stretching of citric acid isalso responsible for the peak observed at 3417 cm�1. The peak at1394 cm�1 is also due to the COH deformation and CH3 wag-ging mode of citric acid[38]. This mode is observed with highintensity at 1384 cm�1 in the FTIR spectrum of silver
Fig. 3 X-ray diffraction pattern of: (a) S. lycopersicums fruit extract,(b) silver nanoparticles B14 and B6 (* due to S. lycopersicumsfruit extract).
Fig. 4 FTIR spectrum of silver nanoparticles (B6) (a) andS. lycopersicums extract (b).
320 M. Umadevi et al.: J. Mater. Sci. Technol., 2013, 29(4), 317e322
Author's personal copy
nanoparticle (B6). This indicates that the malic and citric acidpresent in S. lycopersicums fruit extract is responsible forreduction of silver nanoparticles. This prominent and down-shifted peak also indicates the possibility that silver nano-particles are bound to S. lycopersicums fruit extract through COgroup of malic and citric acid.Fig. 5 shows the Raman spectrum of silver nanoparticles B14.
It shows two prominent peaks at 1346 and 1554 cm�1. Thesepeaks are assigned to OCO symmetric and asymmetric stretchingof malic acid, respectively[39]. The COH deformation and CH3
wagging mode of citric acid are also responsible for the observedpeak at 1346 cm�1[40]. The observed high enhancement in in-tensity indicates that OCO group of malic acid is adsorbed onsilver nanoparticles.In order to identify the capping and reducing, agent surface
enhanced Raman scattering (SERS) of silver nanoparticles B14mixed with 1,4-dimethoxy-3-methylanthracene-9,10-dione hasbeen made. Fig. 5 shows the SERS spectra of silver nano-particles B14 mixed with 1,4-dimethoxy-3-methylanthracene-9,10-dione. It shows the same Raman spectrum as that of silvernanoparticles B14. It indicates that the adsorbed malic acid doesnot allow any foreign molecule to adsorb on the nanoparticles.When the metal nanoparticles form in solution, they must be
stabilized against the van der Waals forces of attraction, whichmay otherwise cause coagulation. Physisorbed surfactant andpolymers may cause steric or electrostatic barriers or purelyelectrostatic barriers around the particle surface and may therebyprovide stabilization[39]. In our case, the silver nanoparticlespossessed a negative charge due to the adsorbed malate ionpresent in the tomato extract and thereby helped to prevent ag-gregation by electrostatic stabilization[40]. The observed spectraalso indicate that the malic acid acts as capping agent and hencecitric acid acts as reducing agent. Fig. 6 represents the schematicrepresentation of synthesis and formation of silver nanoparticles.
3.4. SEM
A scanning electron microscope was employed to analyze themorphology of the nanoparticles that were formed. An SEMmicrograph of silver nanoparticles B6 is shown in Fig. 7. Thispicture exhibits that the particles were in spherical shape withsmooth surfaces.
3.5. TEM
TEM was employed to characterize the size, shape and mor-phologies of formed silver nanoparticles. Fig. 8 shows the TEM
Fig. 5 Raman spectrum of silver nanoparticles (B14) (nRs) and SERSspectrum of silver nanoparticles B14 mixed with 1,4-dimethoxy-3-methylanthracene-9,10-dione.
Fig. 6 Schematic representation of synthesis of silver nanoparticle from S. lycopersicums fruit extract.
Fig. 7 SEM image micrograph of silver nanoparticles B6.
M. Umadevi et al.: J. Mater. Sci. Technol., 2013, 29(4), 317e322 321
Author's personal copy
image of the silver nanoparticles B14 in different magnifications.It consists of uniformly sized spherical nanoparticles of averagesize 10 nm. Crystalline nature of the nanoparticles is further evi-denced by the selected area electron diffraction pattern (Fig. 8(c)).
4. Conclusion
The present study deals with the use of a natural, low costbiological reducing agent, S. lycopersicums fruit extract. It hasproduced silver nanostructures, through efficient green nano-chemistry methodology, avoiding the presence of hazardous andtoxic solvents and waste. The prepared silver nanoparticles werecharacterized by UV-visible, Fourier transform infrared spec-troscopy (FTIR), Raman spectroscopy, scanning electron mi-croscopy (SEM) and transmission electron microscopy (TEM)techniques to identify the size, shape of silver nanoparticles andbiomolecules act as reducing agents. XRD and TEM measure-ments show that the average size of the prepared silver nano-particle was 10 nm. Spherical shape of the prepared silvernanoparticles was predicted from UVevisible, SEM and TEMmeasurements. FTIR and Raman measurements show that OCOgroup of malic acid in S. lycopersicums fruit extract wasadsorbed on silver nanoparticles. It also indicates that citric acidpresent in S. lycopersicums fruit extract is used as reducing agentand malic acid present in S. lycopersicums fruit extract as cap-ping agent.
AcknowledgmentsAuthors are thankful to DST-CURIE, New Delhi and UGC-
DAE-CSR, Indore for TEM and Raman measurements.
REFERENCES
[1] L.S. Nair, C.T. Laurencin, J. Biomed. Nanotechnol. 3 (2007)301e316.
[2] K.S. Lee, M.A. El-Sayed, J. Phys. Chem. B 110 (2006)19220e19225.
[3] P.K. Jain, X. Huang, I.H. El-Sayed, M.A. EL-Sayed, Acc. Chem.Res. 41 (2008) 1578e1586.
[4] T.C. Prathna, N. Chandrasekaran, A.M. Raichur, A. Mukherjee,Colloid Surf. B 82 (2011) 152e159.
[5] M. Poliakoff, P. Anastas, Nature 413 (2001) 257.[6] J.M. DeSimone, Science 297 (2002) 799e803.[7] P. Raveendran, J. Fu, S.L. Wallen, J. Am. Chem. Soc. 125 (2003)
13940e13941.[8] S. Shrivastava, T. Bera, S.K. Singh, G. Singh, P. Ramachandrarao,
D. Dash, ACS Nano 3 (2009) 1357e1364.[9] F. Furno, K.S. Morley, B. Wong, B.L. Sharp, P.L. Arnold, S.M.
Howdle, R. Bayston, P.D. Brown, P.D. Winship, H.J. Reid, J.Antimicrob. Chemother. 54 (2004) 1019e1024.
[10] R. Ulrich, The Biochemistry of Fruits and Their Products, OrganicAcids, Academic Press London, New York, 1970, pp. 89�118.
[11] M. Petro-Turza, Food Rev. Int. 2 (1987) 309e351.[12] Y. Shen, Y. Zhang, Y. Chen, S. Li, Q. Zhang, A. Xie, Colloid Surf.
B 83 (2011) 284e290.[13] R.P. Singh, S. Magesh, C. Rakkiyappan, Int. J. Bio Eng. Sci.
Technol. IJBEST 2 (2011) 70e80.[14] D. Philip, C. Unni, Phys. E 43 (2011) 1318e1322.[15] M. Umadevi, S. Shalini, M.R. Bindhu, Adv. Nat. Sci. Nanosci.
Nanotechnol. 3 (2012) 1e6.[16] S.K. Sivaraman, I. Elango, S. Kumar, V. Santhanam, Curr. Sci. 97
(2009) 1055e1059.[17] N. Vigneshwaran, R.P. Nachane, R.H. Balasubramanya, P.V. Var-
adarajan, Carbohydr. Res. 341 (2006) 2012e2018.[18] A. Bankar, B. Joshi, A. Ravi Kumar, S. Zinjarde, Colloid Surf. A
368 (2010) 58e63.[19] S.P. Dubey, M. Lahtinen, M. Sillanpaa, Colloid Surf. A 364 (2010)
34e41.[20] H. Bar, D.Kr. Bhui, G.P. Sahoo, P. Sarkar, S. Pyne, A. Misra,
Colloid Surf. A 348 (2009) 212e216.[21] E. Filippo, A. Serra, A. Buccolieri, D. Manno, J. Non Cryst. Solids
356 (2010) 344e350.[22] D. Philip, Physica E 42 (2010) 1417e1424.[23] A.J. Kora, R.B. Sashidhar, J. Arunachalam, Carbohydr. Polym. 82
(2010) 670e679.[24] D. Philip, Spectrochim. Acta A Mol. Biomol. Spectrosc. 75 (2010)
1078e1081.[25] X. Gao, G. Gu, Z. Hu, Y. Guo, X. Fu, J. Song, Colloid Surf. A 254
(2005) 57e61.[26] A. Henglein, J. Phys. Chem. 97 (1993) 5457e5471.[27] S.L. Smitha, K.M. Nissamudeen, D. Philip, K.G. Gopchan-
dran, Spectroc. Acta Pt. A-molec. Biomolec. Spectr. 71 (2008)186e190.
[28] S. Yamamoto, K. Fujiwara, H. Watari, Anal. Sci. 20 (2004)1347e1352.
[29] J.M. Chalmers, P.R. Griffiths, Handbook of Vibrational Spectro-scopy, J. Wiley, New York, 2002.
[30] V. Parashar, R. Parashar, B. Sharma, A.C. Pandey, Dig. J. Nano-mater. Biostruct. 4 (2009) 45e50.
[31] M.M. Ganesh Babu, P. Gunasekaran, Colloid Surf. B 74 (2009)191e795.
[32] A. Sileikaite, J. Puiso, I. Prosycevas, S. Tamulevicius, Mater. Sci.Medzg. 15 (2009) 21e27.
[33] M. Moskovits, B. Vlckova, J. Phy. Chem. B 109 (2005)14755e14758.
[34] R. Jenkins, R.L. Snyder, Introduction to X-ray Powder Dif-fractiometry, John Wiley and Sons, New York, 1996, pp. 544.
[35] A. Becheri, M. Durr, P.L. Nostro, P. Baglioni, J. Nanopart. Res. 10(2008) 679e689.
[36] S.S. Shankar, A. Ahmad, M. Sastry, Biotechnol. Prog. 19 (2003)1627e1631.
[37] J.L. Castro, M.R. Lopez-Ramirez, J.F. Arenas, J.C. Otero, Vib.Spectrosc. 39 (2005) 240e243.
[38] P. Tarakeshwar, S. Manogaran, Spectroc. Acta Pt. A-molec. Bio-molec. Spectr. 50 (1994) 2327e2343.
[39] P. Mulvaney, Langmuir 12 (1996) 788e800.[40] A. Sileikaite, I. Prosycevas, J. Puiso, A. Juraitis, A. Guobiene,
Mater. Sci. 12 (2006) 287e291.
Fig. 8 TEM images of the silver nanoparticles B14 with different magnifications: (a) the scale bar corresponds to 50 nm, (b) the scale bar corresponds to20 nm, (c) its corresponding electron diffraction pattern.
322 M. Umadevi et al.: J. Mater. Sci. Technol., 2013, 29(4), 317e322