An Exploration of 2D-LC-SERS: A Novel Offline Detection ...
86
An Exploration of 2D-LC-SERS: A Novel Offline Detection Modality for Multidimensional Chromatography By Melanie Dawn Davidson A Thesis Submitted to Saint Mary’s University, Halifax, Nova Scotia In Partial Fulfilment of the Requirements for the Degree of Masters of Science in Applied Science April 2019, Halifax, Nova Scotia Copyright Melanie Dawn Davidson, 2019 ____________________ Approved: Dr. Christa L. Brosseau Supervisor ___________________ Approved: Dr. Clarissa Sit Committee Member ____________________ Approved: Dr. Todd Ventura Committee Member ____________________ Approved: Dr. Anthony Tong External Examiner Date: April 17, 2019
-
Upload
khangminh22 -
Category
Documents
-
view
2 -
download
0
Transcript of An Exploration of 2D-LC-SERS: A Novel Offline Detection ...
An Exploration of 2D-LC-SERS:
A Novel Offline Detection Modality for Multidimensional Chromatography
By
Melanie Dawn Davidson
A Thesis Submitted to
Saint Mary’s University, Halifax, Nova Scotia
In Partial Fulfilment of the Requirements for the Degree of
Masters of Science in Applied Science
April 2019, Halifax, Nova Scotia
Copyright Melanie Dawn Davidson, 2019
____________________
Approved: Dr. Christa L. Brosseau
Supervisor
___________________
Approved: Dr. Clarissa Sit
Committee Member
____________________
Approved: Dr. Todd Ventura
Committee Member
____________________
Approved: Dr. Anthony Tong
External Examiner
Date: April 17, 2019

ii
Abstract
An Exploration of 2D-LC-SERS:
A Novel Offline Detection Modality for Multidimensional Chromatography
By
Melanie Dawn Davidson
Multidimensional liquid chromatography (2D-LC) provides better resolving and
separation power than conventional high-performance liquid chromatography (HPLC),
and over the past decade has increasingly been applied in many different fields.1 This
thesis seeks to explore the extent to which surface-enhanced Raman spectroscopy (SERS)
can be used as an offline detection modality for 2D-LC. This thesis hypothesizes that
careful selection and modification of a three dimensional (3D) SERS substrate will be
useful for characterization of fractions collected using 2D-LC. In particular, a mixture of
four polyphenolic molecules was chosen for this proof-of-concept study. An optimised
2D-LC method was developed as part of this thesis. Various materials were evaluated as
potential 3D-SERS substrates, with the most promising option being cellulose-based filter
paper. Various modification strategies were explored to enhance the interaction between
the polyphenolic molecules and the filter paper substrate. In the end, SERS-based
detection of 2D-LC fractions proved challenging, even after optimization.
April 17, 2018

iii
Acknowledgements
First and foremost, I would like to thank my supervisor Dr. Christa Brosseau for
allowing me to complete my master’s degree in her research group. I would not have been
able to complete this degree without her, the academic, life guidance and support she has
given me. I have had the honour to work in the Brosseau research group for the past 5
years as an undergraduate and graduate researcher, the experiences and friends I’ve made
along the way will always stay with me. Thank you from the bottom of my heart for all
you have done for me throughout the years and you will always be an important role
model in my life.
I would like to thank my committee members Dr. Clarissa Sit, and Dr. Todd
Ventura for their support and guidance through my degree. Also, Dr. Anthony Tong for
being my external examiner and taking the time to review my thesis work.
Special thanks to all past and present Brosseau group members who have been a
supportive family away from home. To Patricia Granados for all her help with LC and the
new 2D-LC, as her help and expertise has been instrumental in my work. To Xiang Yang
for help with SEM and imaging. Special thanks again to Alyssa Doue and the entire Saint
Mary’s University Chemistry Department for their help and support.
Lastly, I would like to thank my amazing friends and family who have helped me
through this degree. Without all of you, I probably would not be writing this today. Thank
you for lifting me up when I was down, and believing in me when I did not believe in
myself. I can never express my gratitude enough.
I acknowledge the following agencies for funding: Faculty of Graduate Studies
and Research, NSERC, and Canada Research Chairs.

iv
List of Abbreviations
1D One-Dimension 1D First Dimension
2D Two-Dimension 2D Second Dimension
2D-LC Two-Dimensional Liquid Chromatography
2D-LC-SERS Two-Dimensional Liquid Chromatography with SERS Detection
3D Three-Dimension
AgNP Silver Nanoparticles
CM Chemical Mechanism
DAD Diode Array Detector
EC-SERS Electrochemical Surface-Enhanced Raman Spectroscopy
EM Electromagnetic Mechanism
FP Filter Paper
GC Gas Chromatography
HOMO Highest Occupied Molecular Orbital
HPLC High Performance Liquid Chromatography
HPLC-MS High Performance Liquid Chromatography with MS Detection
HPLC-SERS High Performance Liquid Chromatography with SERS Detection
LC Liquid Chromatography
LC×LC Comprehensive Multidimensional Liquid Chromatography
LC-LC Heart-Cutting Multidimensional Liquid Chromatography
LSP Localised Surface Plasmon
LSPR Localised Surface Plasmon Resonance
LUMO Lowest Unoccupied Molecular Orbital
mLC-LC Multiple Heart-Cutting Multidimensional Liquid Chromatography
MS Mass Spectrometry
NMR Nuclear Magnetic Resonance
NP Normal Phase
NPs Nanoparticles
OCP Open Circuit Potential
PSP Propagating Surface Plasmon
PSPR Propagating Surface Plasmon Resonance
Pyr Pyridine
Pyz Pyrazine
RP Reverse Phase
SEM Scanning Electron Microscopy
SERS Surface-Enhanced Raman Spectroscopy
SP Surface Plasmon
SPE Screen-Printed Electrode
TLC Thin Layer Chromatography
UHPLC Ultra-High Performance Liquid Chromatography
UV-vis Ultra-Violet Visible Spectroscopy

v
Table of Contents Page #
Chapter 1 Introduction
1.1 Preamble 1
1.2 Objectives of Thesis 1
1.3 Scope of Thesis 2
Chapter 2 Literature Review
2.1 Introduction 4
2.2 Phenolic Compounds 4
2.3 Liquid Chromatography 6
2.4 Multidimensional Liquid Chromatography 8
2.5 Surface-Enhanced Raman Spectroscopy (SERS) 14
2.6 Three-Dimensional Surface-Enhanced Raman Spectroscopy 16
Substrates
2.7 Multidimensional Liquid Chromatography with 16
Surface-Enhanced Raman Spectroscopy
Chapter 3 Theory
3.1 Introduction 18
3.2 Liquid Chromatography 18
3.3 Multidimensional Liquid Chromatography 21
3.4 Surface-Enhanced Raman Spectroscopy 24
3.4.1 Plasmonics 24
3.4.2 Raman Spectroscopy 27
3.4.3 Surface-Enhanced Raman Spectroscopy 29
3.4.4 Electrochemical Surface-Enhanced Raman Spectroscopy 30

vi
Chapter 4 Materials and Methods
4.1 Introduction 32
4.2 Reagents 32
4.3 Instrumentation 32
4.3.1 Spectroscopy
4.3.1.1 UV-Visible Spectroscopy 32
4.3.1.2 Raman Spectroscopy 33
4.3.2 Electrochemistry
4.3.2.1 Electrochemical Surface-Enhanced Raman Spectroscopy 34
4.3.3 Scanning Electron Microscope 34
4.3.4 Liquid Chromatography
4.3.4.1 One-Dimensional Liquid Chromatography 34
4.3.4.2 Two-Dimensional Liquid Chromatography 35
4.4 SERS Substrates
4.4.1 Silver Nanoparticle Synthesis 36
4.4.2 Three-Dimensional Surface-Enhanced Raman Spectroscopy 36
Substrate Preparation
4.4.3 Substrate Surface Modification 37
4.5 Electrochemical Surface-Enhanced Raman Spectroscopy 38
Substrate Preparation
Chapter 5 Results and Discussion
5.1 Comparison of Three-Dimensional (3D) Surface-Enhanced Raman 39
Spectroscopy Substrates
5.2 Pyridine Functionalization of 3D Surface-Enhanced Raman 42
Spectroscopy Substrates

vii
5.3 Filter Paper Surface-Enhanced Raman Spectroscopy Substrate 46
Analysis of Polyphenols
5.4 Multidimensional Liquid Chromatographic Separations of Polyphenols
5.4.1 Characterization of Standards 50
5.4.2 Separation of Mixture 51
5.5 Multidimensional Liquid Chromatography with 56
Surface-Enhanced Raman Spectroscopy
5.6 Discussion 62
Chapter 6 Conclusions and Future Work
6.1 Conclusions 64
6.2 Future Work 65
References 66
Appendix 73

viii
List of Figures
Figure # Description Page #
2.1 Basic structures for phenolic acids and flavonoids 5
2.2 Schematic of UHPLC setup (adapted from2). 7
2.3 Schematic of 2D-LC setup (adapted from2). 10
2.4 Conceptual representation of heart-cutting (LC-LC) and 11
comprehensive (LC×LC) modes of 2D-LC
(© Agilent Technologies, Inc. 2015. Reproduced with Permission,
Courtesy of Agilent Technologies, Inc.)
2.5 Schematic representation of peak capacity in one and two 13
dimensions (adapted from2).
3.1 Simple chromatogram depicting retention time, tR , and 19
peak width, w.(Reproduced with permission from Manz, A.;
Dittrich, P. S.; Pamme, N.; Iossifidis, D. Bioanalytical Chemistry:
Second Edition. Copyright 2015 Imperial College Press.)
3.2 A van Deemter plot for the determination of optimum 21
chromatographic flow rate
3.3 Configurations of an 8-port/2-position valve needed for LC-LC 23
separation (© Agilent Technologies, Inc. 2015. Reproduced with
Permission, Courtesy of Agilent Technologies, Inc.)
3.4 Effects of different degrees of correlation of separation mechanisms 24
in plots of first versus second-dimension retention. (A) Example of
separations with total correlation; (B) example of separations with
partial correlation; (C) example of orthogonal separations
(© Agilent Technologies, Inc. 2015. Reproduced with Permission,
Courtesy of Agilent Technologies, Inc.)
3.5 Plots of the real (A) and imaginary (B) components of the 26
dielectric function of Ag, Au, and Si (Reproduced with permission
from Rycenga, M.; Cobley, C. M.; Zeng, J.; Li, W.; Moran, C. H.;
Zhang, Q.; Qin, D.; Xia, Y. Chem. Rev. 2011, 111 (6), 3669–3712.
Copyright 2011, American Chemical Society.)
3.6 Quality factor (Q) of the LSPR for a metal/air interface of 27
various metals. The shaded area represents the area of interest
for many plasmonic applications (Reproduced with permission
ix
from Rycenga, M.; Cobley, C. M.; Zeng, J.; Li, W.; Moran, C. H.;
Zhang, Q.; Qin, D.; Xia, Y. Chem. Rev. 2011, 111 (6), 3669–3712.
Copyright 2011, American Chemical Society.)
3.7 Diagram which shows the different light scattering modes: 28
Rayleigh, Stokes, and anti-Stokes scattering.
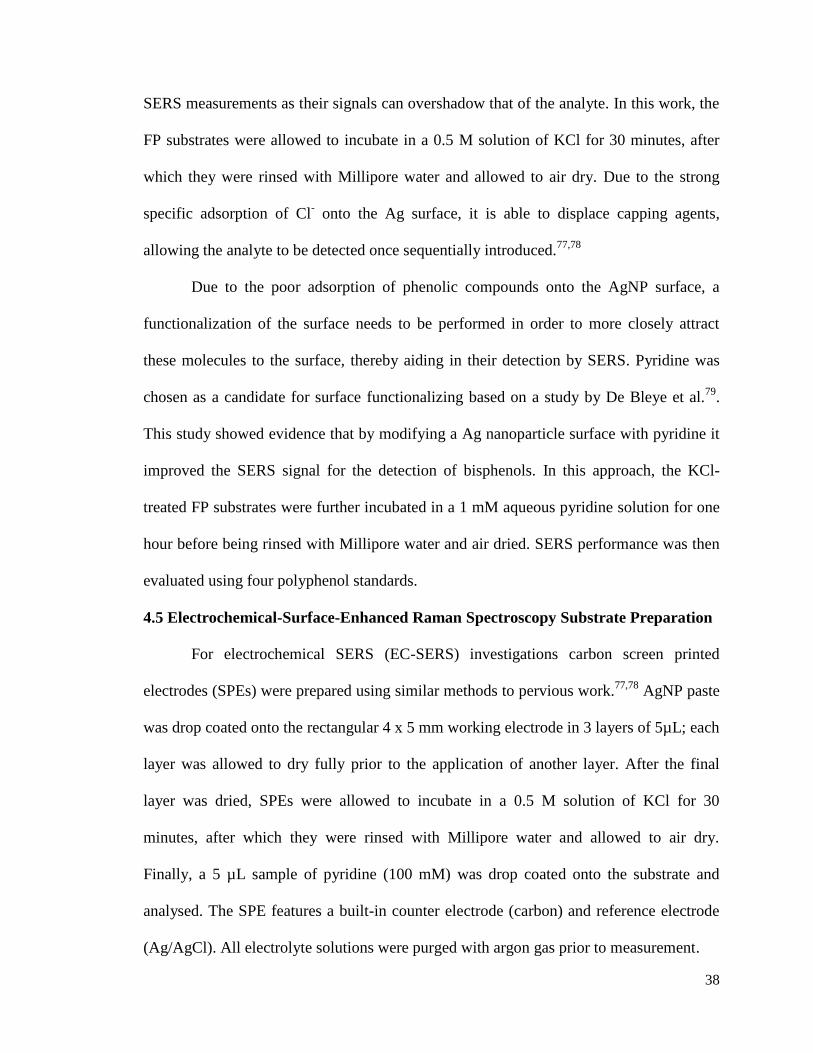
5.1 (A) Blend fabric, (B) filter paper, (C) nitrocellulose membrane, 39
and (D) glass fiber filter SEM images with silver nanoparticles.
(E) Porous alumina SEM image is shown without nanoparticles
for ease of viewing the 3D structure.
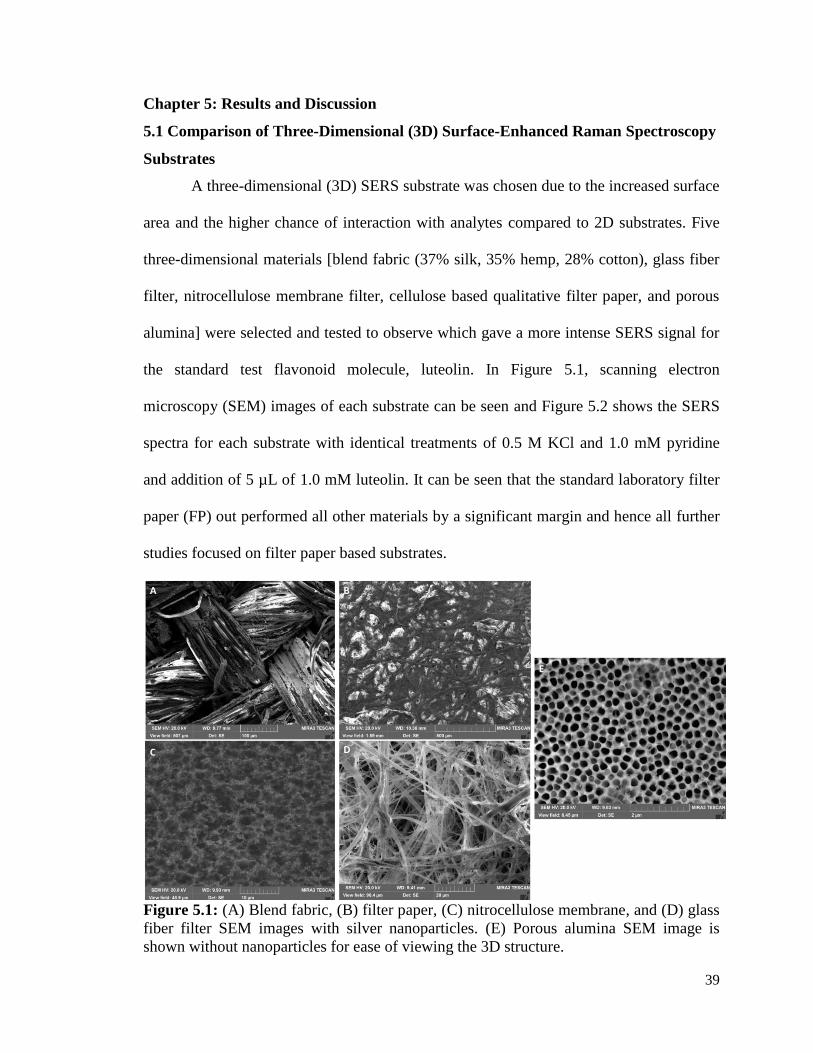
5.2 Comparison of SERS spectra of different substrates with 1.0 mM 40
luteolin (30 s, 12.17 mW, 785 nm laser).
5.3 Comparison of SERS spectra for 1.0 mM luteolin of different 41
filter papers (Ahlstrom, Grade 631; Fisher, Qualitative P5;
Whatman, Grade 1) (30 s, 12.17 mW, 785 nm laser).
5.4 SEM images of Ahlstrom (A&D), Fisher (B&E), and 41
Whatman (C&F) filter paper substrates with Ag nanoparticles.
A-C shows images at 500x magnification, and D-F shows images
at 1000x magnification.
5.5 SERS signal of 1mM luteolin on filter paper substrates with different 43
optimization strategies. Show with solely KCl treatment (black), with
solely pyridine functionalization (red), and with KCl treatment followed
by pyridine functionalization (blue). (30 s, 12.17 mW, 785 nm laser).
5.6 Structures of pyridine (pyr) and pyrazine (pyz) 43
5.7 EC-SERS analysis of 100 mM pyridine on the surface of AgNP 45
coated screen printed electrode. (Cathodic, 0.1V step-wise progression
from 0V to -1V). (30 s, 80 mW, 780 nm laser).
5.8 Scheme for the orientation of pyridine on a silver nanoparticle 46
surface at open circuit potential (OCP) and -0.5 V.
5.9 Structures of luteolin, caffeic acid, quercetin, and chlorogenic acid. 47
5.10 Raman spectra of caffeic acid, chlorogenic acid, luteolin, and 48
quercetin (30 s, 80 mW, 780nm laser).
5.11 SERS signal of 5 µL of 1.0 mM of each analyte: luteolin (286 ppm), 49
chlorogenic acid (354 ppm), caffeic acid (180 ppm), and quercetin
(203 ppm) (30 s, 12.17 mW, 785 nm laser).
x
5.12 SERS signal of 5 µL of 50 ppm (of each analyte: luteolin, 49
chlorogenic acid, caffeic acid, and quercetin
(30 s, 12.17 mW, 785 nm laser).
5.13 UV-vis absorbance spectra of a 25 ppm mixture of luteolin, 50
quercetin, chlorogenic acid, and caffeic acid, diluted 1:10
with MeOH:H2O (50:50 % v/v).
5.14 1D chromatograms for 100 ppm (20:80% v/v, MeOH:H2O) 51
solutions of luteolin, quercetin, chlorogenic acid, and caffeic
acid at 350 nm with retention times stated above each main peak.
5.15 1D chromatogram for the 25 ppm (20:80% v/v, MeOH:H2O) 52
mixture of luteolin, quercetin, chlorogenic acid, and caffeic
acid at 350nm with retention times stated above each main peak.
5.16 1D chromatogram of 25 ppm mixture (50:50% v/v, MeOH:H2O) 54
at 327 nm with a 2D threshold of 20 mAU.
5.17 2D chromatogram of 25 ppm mixture (50:50% v/v, MeOH:H2O) 55
at 327 nm with a fraction collection threshold of 2.5 mAU.
Peaks with asterisks correspond to the analytes. Elution order
here is: chlorogenic acid, caffeic acid, luteolin, and quercetin.
5.18 SERS spectra of fractions collected from peaks denoted with 57
asterisks from Figure 5.17 (30 s, 12.17 mW, 785 nm laser).
5.19 1D chromatogram of 25 ppm mixture (50:50% v/v, MeOH:H2O) 58
at 327 nm with injection volumes of 2, 3, and 4.0 µL. 2D-threshold of 20 mAU.
5.20 2D chromatogram of 25 ppm mixture (50:50% v/v, MeOH:H2O) 59
at 327 nm with injection volumes of 2.0, 3.0, and 4.0 µL.
Fraction collection threshold of 5.0 mAU.
5.21 SERS spectra of fractions collected from the first peak 59
(chlorogenic acid) of each injection volume from Figure 5.20
(30 s, 12.17 mW, 785 nm laser).
5.22 SERS spectra of fractions collected for chlorogenic acid using 60
2.0 µL injection volume from Figure 5.19 compared to 1.0 mM
chlorogenic acid (30 s, 12.17 mW, 785 nm laser).
5.23 SERS of 25 ppm mixture of luteolin, quercetin, chlorogenic acid, 61
and caffeic acid in MeOH:H2O (50:50 % v/v) of optimized FP SERS
substrate (30 s, 12.17 mW, 785 nm laser).
xi
5.24 UV-vis absorbance spectra of fractions 1-4 obtained 61
after 2D-LC separation of the 25 ppm mixture of polyphenolic
standards.
A.1 1D chromatograms for 100 ppm (50:50% v/v, MeOH:H2O) 73
solutions of luteolin, quercetin, chlorogenic acid, and caffeic
acid at 327 nm with retention times stated above each main peak.
A.2 SERS spectra of 1.0 mM luteolin on KCl treated FP substrates 74
using pyr (red) and pyz (black) as surface functionalization molecules.
xii
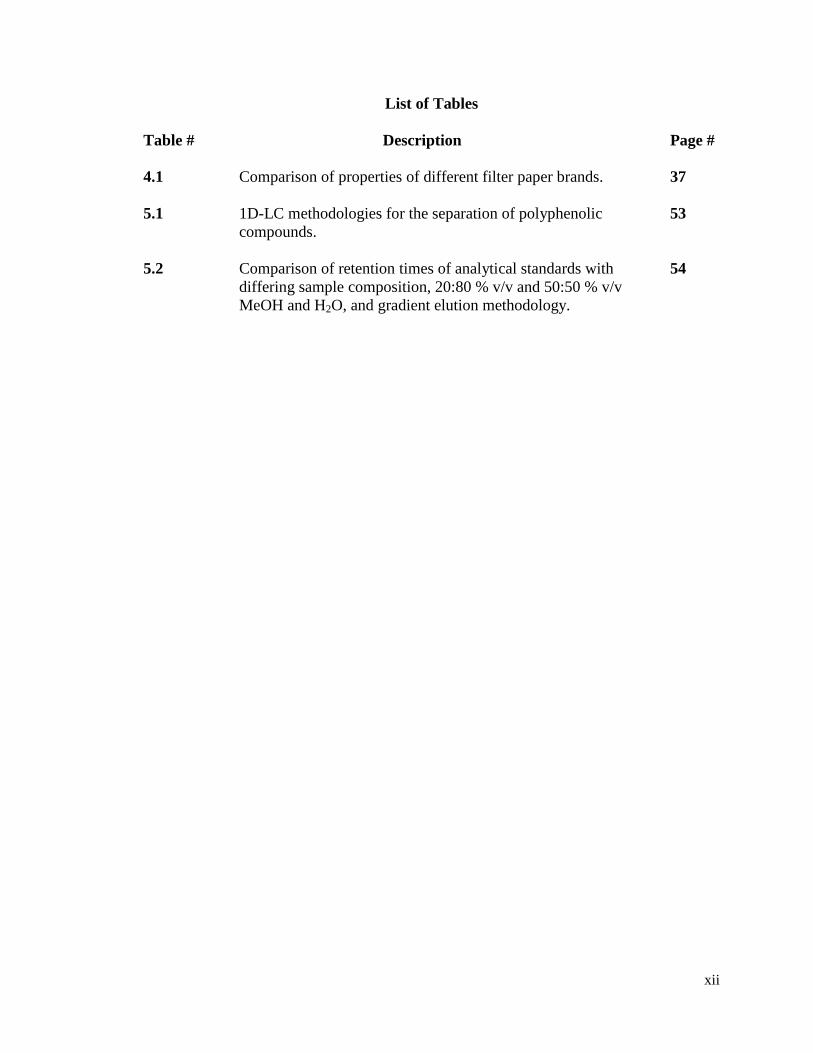
List of Tables
Table # Description Page #
4.1 Comparison of properties of different filter paper brands. 37
5.1 1D-LC methodologies for the separation of polyphenolic 53
compounds.
5.2 Comparison of retention times of analytical standards with 54
differing sample composition, 20:80 % v/v and 50:50 % v/v
MeOH and H2O, and gradient elution methodology.
1
Chapter 1 Introduction
1.1 Preamble
Multidimensional liquid chromatography is an emerging technique in the field of
analytical chemistry, with applications mainly in the areas of pharmaceutical, natural
products, and food sciences due to sample complexity.2 Alternatively, surface-enhanced
Raman spectroscopy (SERS) has been in practice since the late 1970’s as a sensitive and
selective spectroscopic technique. SERS increasingly is coupled with chromatographic
techniques as a detection modality due to its ability to detect small quantities, down to the
single molecule level in a rapid and cost-effective manner. This thesis explores SERS as
an offline detection modality for multidimensional liquid chromatography using
separation and detection of polyphenols as a proof-of-concept example.
1.2 Objective of Thesis
Secondary plant metabolites, commonly found in fruits and vegetables, have been
dominating the literature of food and nutritional sciences due to their potential health
benefits.3 Many have suggested that it is the antioxidant properties of polyphenolic
compounds in particular that are the largest contributors to positive health benefits.
However, the exact compounds and their varying combinations are still poorly understood
due to the complexity of these biological samples and the sophisticated techniques
required to examine them.4
Currently, the most widely used technique for the separation and detection of
polyphenolic compounds is high-performance liquid chromatography (HPLC), with either
mass spectrometry detection (HPLC-MS) or diode array detection (HPLC-DAD).
Although liquid chromatography is powerful and highly sensitive, it begins to reach the
end of its separation capacity for highly complex samples such as natural extracts, which
2
can contain thousands of metabolites, peptides, proteins and fatty acids.2
Multidimensional liquid chromatography (2D-LC) is an emerging technique that
addresses this issue due to the enhanced peak capacity allowing adequate separation of
highly complex samples. For example, a few recent applications have employed 2D-LC
to analyse and detect food pesticides, natural extracts for potential drug discovery, and
detect impurities in pharmaceutical applications.5–7
Surface-enhanced Raman spectroscopy (SERS) has been recently applied as a
detection modality for chromatographic techniques such as thin-layer chromatography
(TLC), gas chromatography (GC), and HPLC due to its high sensitivity and selectivity.8,9
As an alternative to expensive and complicated detectors such as mass spectrometry (MS)
and nuclear magnetic resonance (NMR), SERS has become an attractive option.
This thesis hypothesizes that with sufficient optimization, SERS will be useful as
an alternative offline detection modality for multidimensional liquid chromatography. To
investigate this, the analysis will be optimized for a polyphenolic standard mixture for
proof-of-concept work.
1.3 Scope of Thesis
This thesis consists of 6 chapters. Chapter 1 gives a brief introduction to the
research conducted in this thesis, and highlights the major goal of this work. Chapter 2
provides a detailed literature review of the important aspects of this project including
polyphenolic compounds, liquid chromatography, multidimensional liquid
chromatography, surface-enhanced Raman spectroscopy and an introduction to 2D-LC-
SERS. Chapter 3 provides a detailed description of the theory, which underlies the major
experimental techniques used in this work including 1D and 2D liquid chromatography,
Raman spectroscopy, SERS, and electrochemical SERS (EC-SERS). Chapter 4

3
summarizes the experimental procedures including a description of the electrochemical
methods, preparation of filter paper substrates, and liquid chromatographic methodology.
The major experimental results are presented in Chapter 5, which discusses the
fabrication and characterization of various 3D-SERS substrates and the treatment and
functionalization of these substrates before analyte detection. Chapter 5 also focuses on
the characterization of four polyphenolic analytical standards: luteolin, quercetin,
chlorogenic acid, and caffeic acid using Raman spectroscopy and SERS. The further
characterization of these compounds using liquid chromatography and their separation
using 2D-LC is also presented. Chapter 5 further presents the results for the new
technique of 2D-LC-SERS. Chapter 6 summarizes the most important results obtained
from this work and future work for this project is proposed.
4
Chapter 2: Literature Review
2.1 Introduction
The aim of this section is to provide an overview of naturally-occurring
polyphenols and to discuss the importance of their detection in complex samples. This
chapter then moves on to discuss both multidimensional liquid chromatography and
surface-enhanced Raman spectroscopy, and highlights why a hyphenated 2D-LC-SERS
technique may be of potential use for the separation and characterization of complex
samples.
2.2 Polyphenolic Compounds
Natural products are a central subject at the interface between chemistry and
biology, and are defined as molecules produced by a biological or “natural” source.10
There is an increased interest in plant metabolites that are not only beneficial to the plant,
but also to human health. Plant metabolites are generally divided into two major groups:
primary and secondary plant metabolites.11
Primary metabolites are compounds that play
essential roles in plant life, including photosynthesis, respiration, growth, and
development.11
Included in this sub-group are acyl lipids, nucleotides, amino acids, and
organic acids. All other phytochemicals fall into the sub-group of secondary plant
metabolites. The compounds in this secondary group play key roles in protecting plants
from herbivores and microbial infection, act as attractants to seed-dispersing and
pollinating agents, provide UV protection, and function as signal molecules in the
formation of nitrogen-fixing root nodules in legumes.11–14
Secondary metabolites have become an important area of research due to both the
potential and demonstrated benefits to human health. This class of compounds has been
shown to have positive outcomes in many areas including a possible role in prevention of
5
cancer, cardiovascular, neurodegenerative and infectious diseases, and
osteoporosis.3,4,12,13,15
The main theory regarding these benefits has been the antioxidant
properties of these compounds, allowing them to act as radical scavengers and thereby
reduce oxidative stress. In addition, they are good metal-chelating agents and remove
potentially harmful and toxic metals from the body. 16–18
Polyphenolic compounds are a group of secondary plant metabolites, that appear
to hold promise for various human health concerns.3,4,12,13,16,17,19
These molecules are
classified based on their structure (one aromatic ring with one or more hydroxyl groups
attached). Phenolic compounds are more popularly referred to as their sub-group, which
are an even more specific group based on number and arrangement of carbon atoms in the
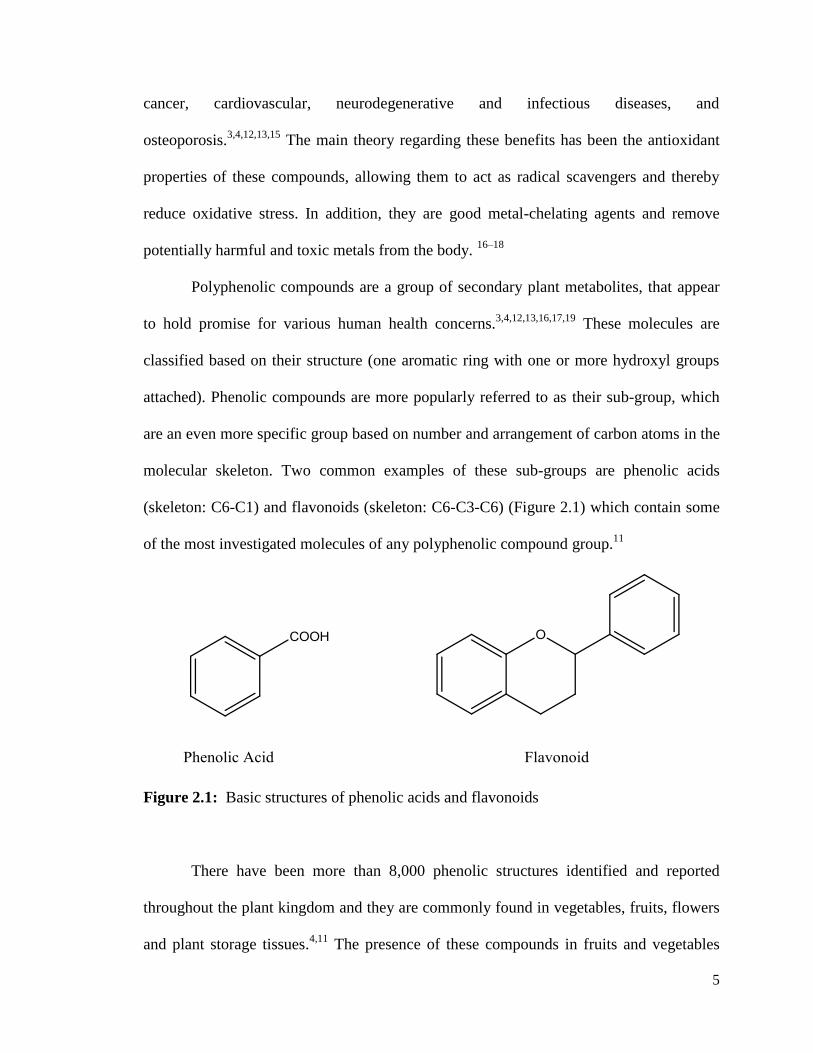
molecular skeleton. Two common examples of these sub-groups are phenolic acids
(skeleton: C6-C1) and flavonoids (skeleton: C6-C3-C6) (Figure 2.1) which contain some
of the most investigated molecules of any polyphenolic compound group.11
Figure 2.1: Basic structures of phenolic acids and flavonoids
There have been more than 8,000 phenolic structures identified and reported
throughout the plant kingdom and they are commonly found in vegetables, fruits, flowers
and plant storage tissues.4,11
The presence of these compounds in fruits and vegetables
6
provides high antioxidant potential and are a rich source of dietary antioxidants, including
many different berries, apples, lettuce, kale, wines and teas.12,13
Considering how
beneficial polyphenols are to human health and their potential in reducing the impact of
many diseases and afflictions, it has become an emergent research topic to understand the
polyphenolic composition of these everyday foodstuffs and their specific roles as
antioxidants.
The detection of these compounds is usually achieved with: capillary
electrophoresis with Ultra-Violet (UV) or amperometric detection, quantum dots and
metal nanoparticles, thin layer chromatography (TLC), as well as gas chromatography
(GC) and high-performance liquid chromatography (HPLC) using UV or mass
spectrometry (MS) detection.14,16,20
HPLC-MS was first used in the detection of
flavonoids in 1976, and has since then become the most commonly applied
technique.4,20,21
HPLC has emerged as a favoured technique due to its sensitive and
reliable nature, especially with MS employed as a detector which can determine both
molecular weight and structural features.14
2.3 Liquid Chromatography
Ultra-high performance liquid chromatography (UHPLC) and high-performance
liquid chromatography (HPLC) are both common and powerful separation techniques that
are currently the methods of choice for separations and analyses in many different fields,
including biomedical chemistry, pharmaceuticals, forensics, and mircobiology.22–27
The
differentiation between the two being that UHPLC uses columns with much smaller
particles sizes (< 2 µm) and thus requires higher pumping pressures to have solvent
flow.28
UHPLC was launched in the early 2000’s and has helped overcome some issues in
separation run time. The main components of UHPLC instrumentation include a mobile

7
phase, which is mixed and pushed through the system via a pump, the auto sampler, the
column and the detector (Figure 2.2). The heart of this instrumentation is the column,
where the analytical separation takes place.
Figure 2.2: Schematic of UHPLC setup. (adapted from2).
Separation of mixtures is achieved based on the composition of the mixture being
analysed, the mobile phases used and the column selected. UHPLC columns may be
composed of different materials and can be tuned to give the best separation possible. The
most widely used methods of chromatographic separations are normal phase (NP) and
reversed phase (RP). NP chromatography uses a column packed with a highly polar
stationary phase, such as silica, and a non-polar mobile phase solvents such as hexanes
and isopropyl ether. RP chromatography uses a column with a non-polar stationary phase,
such as C-18 or C-8 hydrocarbons, and highly polar mobile phase solvents, such as water,
methanol, and acetonitrile.29
In NP chromatography, the least polar components elute
first, and increasing the polarity of the mobile phase will decrease the elution time.
Conversely, in RP chromatography, the most polar components elute first, and increasing
the polarity of the mobile phase will increase the elution time.29
Reversed phase UHPLC
is almost exclusively used in the separation of flavonoids due to the limited solubility of
these compounds in typical NP solvents.30
The use of UHPLC in the detection of
flavonoids has been vast in the past ten years, with groups researching many different

8
samples including: tomatoes, cranberry and orange juices, wine, tea, chia seeds, and
licorice.30–37
The separation and resolving power of UHPLC is limited to simple samples with
moderate complexity.1 Complex mixtures are most commonly encountered for natural or
environmental samples as they can contain thousands of metabolites and other
components such as peptides, proteins, and fatty acids that can occlude the ability of
UHPLC to entirely separate out the mixture into definite components. The relevant
biological samples that are most commonly being analysed for phenolic compounds are
very complex in nature and can have co-eluting compounds, which limit accurate and
precise results.
2.4 Multidimensional Liquid Chromatography
The introduction of multidimensional liquid chromatography aimed to overcome
limitations, often outperforming conventional one dimensional ultra-high performance
liquid chromatography (1D-UHPLC) for very complex samples.2 Multidimensional liquid
chromatography such as two-dimensional liquid chromatography (2D-LC) provides
exceptional resolution compared to 1D UHPLC and is thus being increasingly explored
for the analysis of complex samples.30
Multidimensional or two-dimensional liquid
chromatography (2D-LC) has been around in definition and theory since the 1980’s.38–40
However, due to a lack of understanding of the technique, and limited accessibility to
adequate parts to build instrumentation, it was not until the past decade where this
technique has entered mainstream research and become increasingly popular.41
The concept of multidimensional chromatography began with thin-layer
chromatography (TLC) and a separation by two dimensions in space. By manually
rotating the TLC plate after the initial separation and placing in it another solvent, the
9
separation could then continue based on another property. This basic concept has been
adapted to fit other separation techniques, most popularly: gel electrophoresis, gas
chromatography and liquid chromatography. Multidimensional separations offer greater
separation and resolving power over conventional one-dimensional (1D) techniques. The
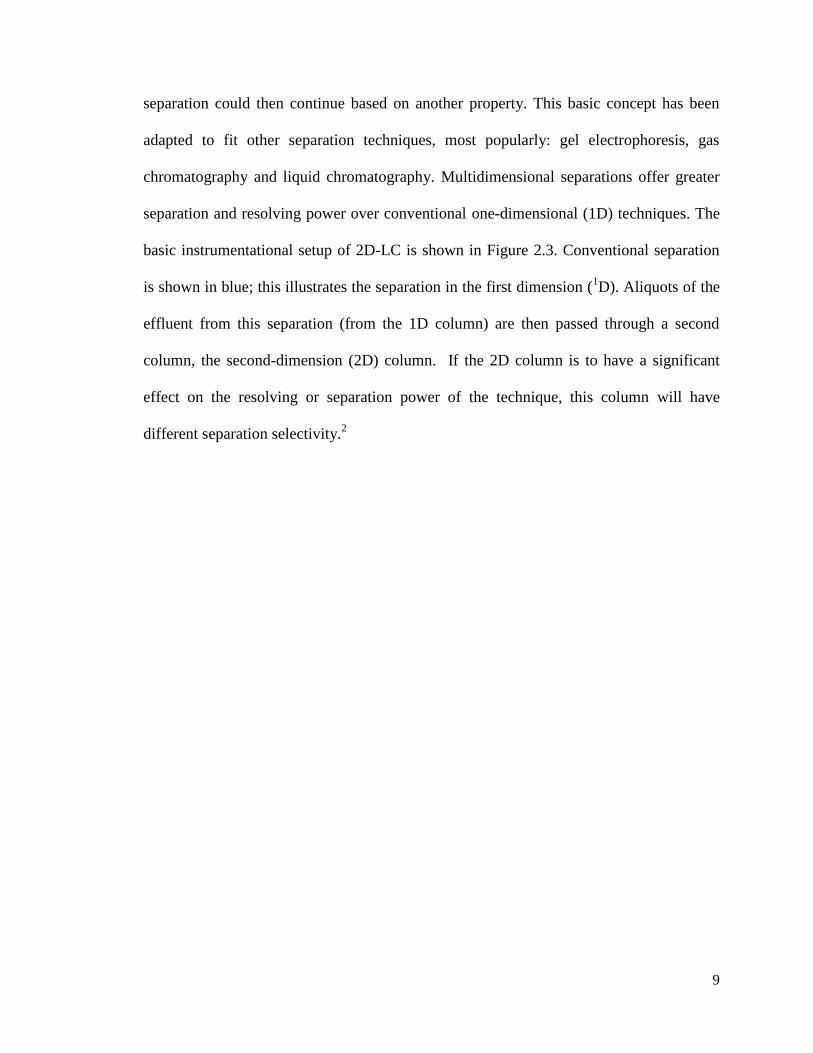
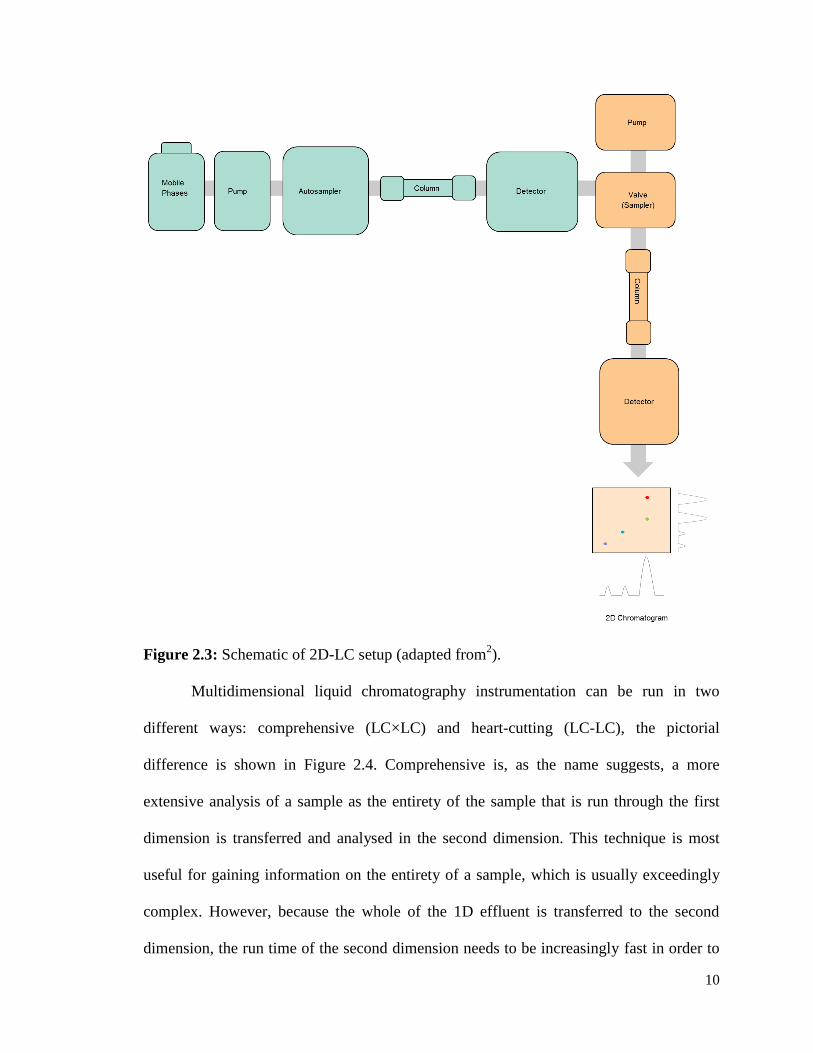
basic instrumentational setup of 2D-LC is shown in Figure 2.3. Conventional separation
is shown in blue; this illustrates the separation in the first dimension (1D). Aliquots of the
effluent from this separation (from the 1D column) are then passed through a second
column, the second-dimension (2D) column. If the 2D column is to have a significant
effect on the resolving or separation power of the technique, this column will have
different separation selectivity.2
10
Figure 2.3: Schematic of 2D-LC setup (adapted from2).
Multidimensional liquid chromatography instrumentation can be run in two
different ways: comprehensive (LC×LC) and heart-cutting (LC-LC), the pictorial
difference is shown in Figure 2.4. Comprehensive is, as the name suggests, a more
extensive analysis of a sample as the entirety of the sample that is run through the first
dimension is transferred and analysed in the second dimension. This technique is most
useful for gaining information on the entirety of a sample, which is usually exceedingly
complex. However, because the whole of the 1D effluent is transferred to the second
dimension, the run time of the second dimension needs to be increasingly fast in order to

11
analyse the entire sample. The heart-cutting technique takes the “heart” of peaks observed
from the first dimension and transfers this portion of the sample to be analysed in the
second dimension. Multiple heart-cutting (mLC-LC) is the term used when the sampling
time allows and more than one sampling loop is available. This provides a more in-depth
analysis of selected parts of the sample in the second dimension because of the less rigid
time constraint with respect to the 2D analysis.
Figure 2.4: Conceptual representation of heart-cutting (LC-LC) and comprehensive
(LC×LC) modes of 2D-LC (© Agilent Technologies, Inc. 2015. Reproduced with
Permission, Courtesy of Agilent Technologies, Inc.)

12
It is easiest to explain the improvement in separation seen by 2D-LC over that of a
single dimension separation through the concept of peak capacity. Peak capacity is the
largest number of peaks that can be accommodated in the separation window in which all
peaks are equally resolved.2 This is a theoretical value as peaks never actually elute all
equally resolved. In multidimensional separations, it is also important to consider the
product rule in relation to peak capacities, the equation for which is shown below
(equation 1.1).
nC,2D = 1nC ×
2nC (1.1)
The peak capacity of two-dimensional liquid chromatography (nC,2D) is equal to the
product of the peak capacities from the first dimension (1nC) and the second dimension
(2nC). This is a great improvement over tandem LC (where the effluent flows from one
column directly into the other) where the best overall achievable peak capacity is the sum
of the values from each dimension.42
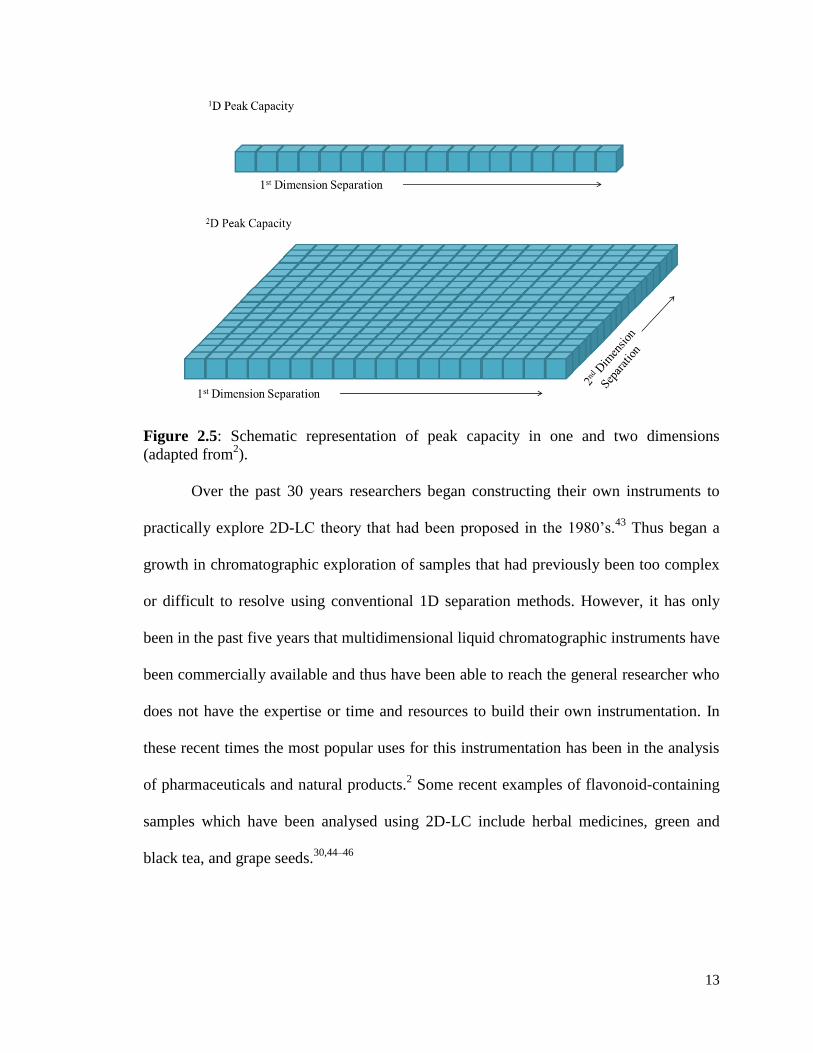
The visualization of this concept can be seen in Figure 2.5, and through the
following analogy: the peak capacity of the 1D separation can be equated to parking cars
along the side of the road, where as the peak capacity of the 2D separation can be equated
to parking cars in a parking lot. Obviously, many more cars can be accommodated in the
parking lot compared to the road.
13
Figure 2.5: Schematic representation of peak capacity in one and two dimensions
(adapted from2).
Over the past 30 years researchers began constructing their own instruments to
practically explore 2D-LC theory that had been proposed in the 1980’s.43
Thus began a
growth in chromatographic exploration of samples that had previously been too complex
or difficult to resolve using conventional 1D separation methods. However, it has only
been in the past five years that multidimensional liquid chromatographic instruments have
been commercially available and thus have been able to reach the general researcher who
does not have the expertise or time and resources to build their own instrumentation. In
these recent times the most popular uses for this instrumentation has been in the analysis
of pharmaceuticals and natural products.2 Some recent examples of flavonoid-containing
samples which have been analysed using 2D-LC include herbal medicines, green and
black tea, and grape seeds.30,44–46
14
2.5 Surface-Enhanced Raman Spectroscopy (SERS)
Surface-enhanced Raman Spectroscopy (SERS) was first developed in the 1970’s
when it was shown that adding a layer of nanoscale, noble metal to a surface increased
the Raman spectral intensity a million fold.47–49
This technique has since proven to be
useful in the detection of very dilute samples due to the sensitivity of Raman
spectroscopy and the significant quenching of fluorescence by the metal nanoparticles
that can normally hinder the Raman signal.50,51
This spectroscopic technique has been
used in various applications in which selectivity and sensitivity are extremely important
and where there exist large consequences for inaccurate results, including drug discovery,
forensic analysis, and homeland security.52
As a result of these advantages and the lack of
spectral interference from solvents such as water, several studies have used SERS as a
detection modality for different chromatographic techniques.
SERS was first used as a detection modality in conjunction with thin-layer
chromatography (TLC) in 1977 by Henzel et al.50
Since then, it has been used to detect
synthetic dyes, drugs in botanical dietary supplements, and tobacco-related biomarkers in
urine.50,53,54
In these studies, silver colloid can be added to the TLC plate and SERS
conducted directly on the plate.50,53
In others, the sample and support are removed from
the TLC plate and eluted with a different solvent before being added to a sample of silver
nanoparticles (AgNP) and SERS was subsequently conducted using a quartz cuvette.54
Both approaches were shown to be sensitive and selective, with results produced using
short detection times and simple sample pre-treatment strategies.
SERS has also been shown to be a useful detector in combination with gas
chromatography (GC). One study deposited eluents from the GC-column onto a TLC
plate pre-treated with Ag colloid, and another adsorbed eluents onto a modified silver foil
15
surface.55,56
Another method also condensed the analyte on a moving, liquid-nitrogen-
cooled ZnSe window, which had a 5 nm thick layer of Ag formed using physical vapour
deposition.52
These studies all successfully coupled SERS with GC to provide sensitive
and selective methods of molecular detection. In the latter study, detection limits lower
than those of GC coupled with mass spectrometry (GC-MS) were reported.
Many studies have reported the use of SERS as a detector for HPLC and UHPLC.
The two main ways of interfacing these two technologies are referred to as online and
offline.8 Online specifies at-line instrumentation that collects SERS spectra in real time as
eluents are coming off the column. Some of the main methods to accomplish online
HPLC-SERS have been to introduce nanoparticles to the mobile phase flow, or the reuse
of a roughened electrode placed at the end of the column.8 However, online SERS
detection of analytes as they elute from the column can be problematic. By adding colloid
to the mobile phase and allowing it to aggregate, there are risks of the colloid sticking to
the inside of flow cells used to collect the online SERS spectra and thus requiring it to be
cleaned between samples. There are also memory effects when using the roughened
electrodes as they are also required to be cleaned between samples to ensure accurate and
reproducible SERS signals. One attempt to overcome this memory effect has been to
apply sheath-flow SERS; however, this requires a fairly complex home-built setup.9,57
Offline analysis is a slightly more labour intensive method as the eluents must
first be collected and SERS spectra then obtained using separate Raman instrumentation.
This methodology removes the time-critical element of the analysis and thus care in
optimizing the SERS conditions for each fraction independently can be taken into
account.8,58
As a result of not needing to compromise SERS response for separation
efficiency, a potentially more relevant and accurate SERS signal can be achieved.

16
2.6 Three-Dimensional Surface-Enhanced Raman Spectroscopy Substrates
SERS has proven to be a highly sensitive and selective spectroscopic technique.51
A key contribution to the enhancement of the SERS signal comes from the physical
structure of the SERS active substrates. Various types of substrates have been developed,
however paper-based substrates have been some of the most notable.59
Advantages over
more conventional substrates such as glass or silicon-based substrates are due to the high
packing density and uniform distribution of the nanoparticles formed within the paper-
based substrates. Different paper-based materials have been used for the fabrication of
SERS substrates such as blotting paper, cardboard, printing paper, newspaper, and most
commonly laboratory filter paper. Filter papers have been popular due to their large
availability, flexibility, biodegradability, and low cost.59,60
Central to the SERS enhancement mechanism is the creation of SERS active “hot
spots”.59,60
“Hot spots” are places where the local electric field is exceptionally intense
and arises from regular spacing between nanoparticles on the substrate.61,62
Nanoparticles
self-assemble on the substrate and thus a 3D substrate can accommodate many more hot
spots than planar (2D) substrates.61
Silver nanoparticles in particular prefer to be loaded
on a filter paper substrate due to their interaction with the hydroxyl groups on the surface
of the paper fibers.59
Paper-based substrates and filter paper especially are a sensitive,
cost-effective, and reproducible alternative to conventional SERS substrates.
2.7 Multidimensional Liquid Chromatography with Surface-Enhanced Raman
Spectroscopy
This thesis work will apply the principle of offline UHPLC-SERS to
multidimensional liquid chromatography. To the knowledge of the author, this is the first
time SERS will be explored as a detection modality for 2D-LC. Since this is still an
17
emerging chromatographic technique with potentially extensive and beneficial outcomes,
exploring the coupling of 2D-LC and SERS could become very meaningful.
Advantages of the use of SERS over a more standardized detection modality like
MS include the straightforward signal acquisition and reduced cost. SERS is sensitive to
the structure of the molecule and can thus differentiate between structural isomers
whereas MS relies on mass-to-charge ratios and proves challenging for the detection of
isomers and also poorly ionizing molecules.9,57
MS techniques also need to be performed
in vacuum and thus it can be difficult to interface with samples and solvents from LC.55
Most importantly, SERS is comparably sensitive and selective to MS and can detect
molecules at very low levels, even down to the single molecule detection regime.57
18
Chapter 3: Theory
3.1 Introduction
This section provides the necessary theoretical background for concepts central to
this thesis work as well as an introduction to the instrumentation used in this project. This
chapter starts with a focus on liquid chromatography in general, and then moves on to
concepts related to multidimensional liquid chromatography and the theory behind this
technology. The fundamentals of plasmonics is then discussed as it relates to the SERS
enhancement phenomenon, with a focus on metal nanospheres, most importantly silver.
Finally, the theory behind the instrumentation of Raman spectroscopy, surface-enhanced
Raman spectroscopy and electrochemical surface-enhanced Raman spectroscopy are all
discussed.
3.2 Liquid Chromatography
Chromatography is a separation process in which a sample is distributed between
two phases in the chromatographic column.63
These two phases are the stationary phase
and the mobile phase. The stationary phase is as the name suggests, stationary and is
either solid, porous, or surface-active materials in small-particle form or a thin film of
liquid coated on a solid support or a column wall.63
The mobile phase is either a gas or a
liquid, which transports the analyte through the chromatographic column. In the context
of this work the mobile phase is a liquid and thus the chromatographic method is referred
to as liquid chromatography.
The goal of chromatography is to completely separate all components of a sample
in the shortest time possible.64
In order to achieve this goal, different parameters of the
separation can be optimized, such as the composition of mobile and/or stationary phases
and the variation of the mobile phase flow rate. A simple chromatogram is depicted in

19
Figure 3.1. In this example, the sample is injected into the system at t = 0s, and the non-
retained species will elute at retention time (t0), which corresponds to the flow rate of the
mobile phase. Compounds A and B each interact with the stationary phase differently and
thus elute later and at different times, tR(A) and tR(B). The width of each peak (w) is
defined as the intersection of the tangents on each side of the peak with the baseline.64
These parameters can be used to derive other parameters to express the quality of the
separation and quantify the components.
Figure 3.1: Simple chromatogram depicting retention time, tR, and peak width, w.
(Reproduced with permission from Manz, A.; Dittrich, P. S.; Pamme, N.; Iossifidis, D.
Bioanalytical Chemistry: Second Edition. Copyright 2015 Imperial College Press.)
A few of the most important principles in chromatography include the capacity
factor, the selectivity factor, and band broadening. The capacity factor (k’) describes the
velocity of the analyte relative to the velocity of the mobile phase and can be defined by
equation 3.1. If k’ is much smaller than 1, the analyte moves too quickly and the elution
time is too short to determine an exact retention time.64
𝑘′ =𝑡𝑅−𝑡0
𝑡0 (3.1)
20
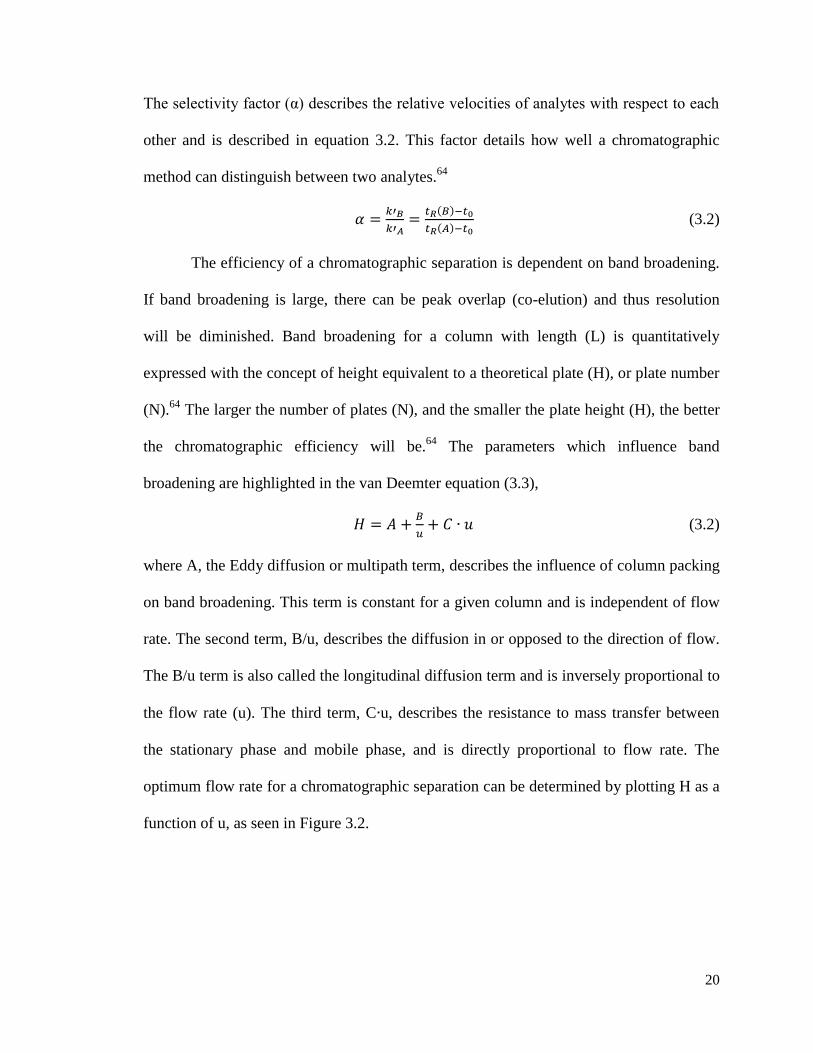
The selectivity factor (α) describes the relative velocities of analytes with respect to each
other and is described in equation 3.2. This factor details how well a chromatographic
method can distinguish between two analytes.64
𝛼 =𝑘′𝐵
𝑘′𝐴=
𝑡𝑅(𝐵)−𝑡0
𝑡𝑅(𝐴)−𝑡0 (3.2)
The efficiency of a chromatographic separation is dependent on band broadening.
If band broadening is large, there can be peak overlap (co-elution) and thus resolution
will be diminished. Band broadening for a column with length (L) is quantitatively
expressed with the concept of height equivalent to a theoretical plate (H), or plate number
(N).64
The larger the number of plates (N), and the smaller the plate height (H), the better
the chromatographic efficiency will be.64
The parameters which influence band
broadening are highlighted in the van Deemter equation (3.3),
𝐻 = 𝐴 +𝐵
𝑢+ 𝐶 ∙ 𝑢 (3.2)
where A, the Eddy diffusion or multipath term, describes the influence of column packing
on band broadening. This term is constant for a given column and is independent of flow
rate. The second term, B/u, describes the diffusion in or opposed to the direction of flow.
The B/u term is also called the longitudinal diffusion term and is inversely proportional to
the flow rate (u). The third term, C∙u, describes the resistance to mass transfer between
the stationary phase and mobile phase, and is directly proportional to flow rate. The
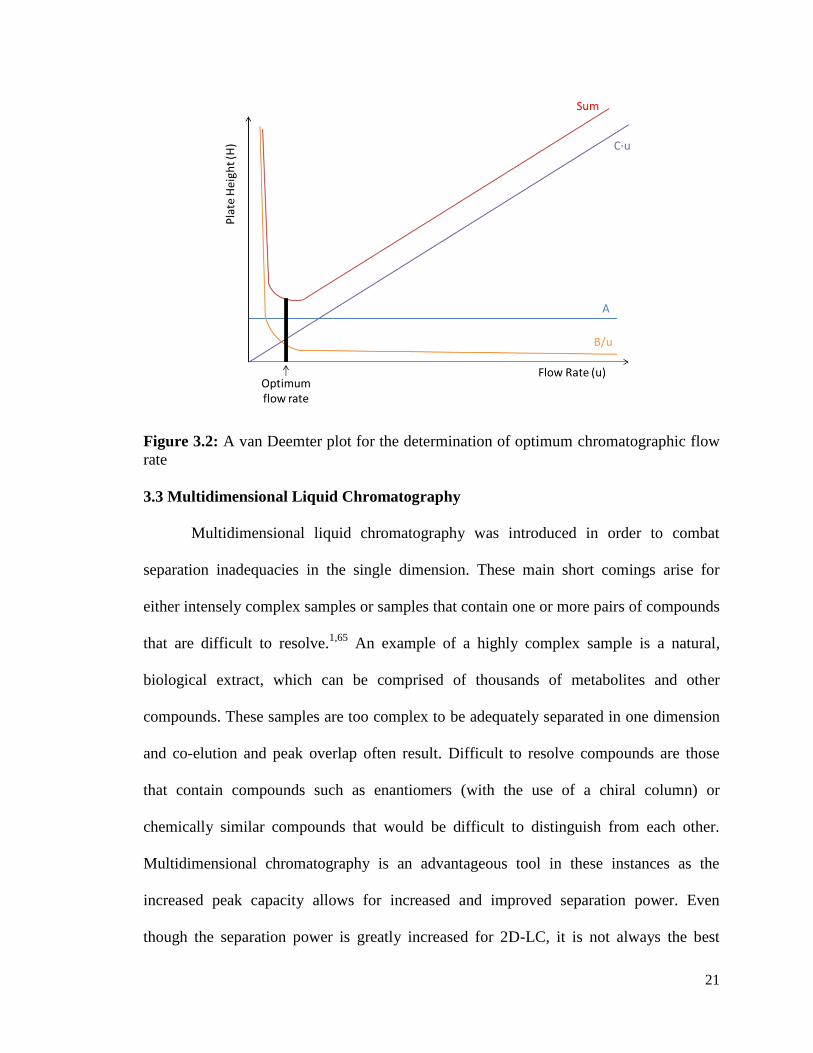
optimum flow rate for a chromatographic separation can be determined by plotting H as a
function of u, as seen in Figure 3.2.
21
Figure 3.2: A van Deemter plot for the determination of optimum chromatographic flow
rate
3.3 Multidimensional Liquid Chromatography
Multidimensional liquid chromatography was introduced in order to combat
separation inadequacies in the single dimension. These main short comings arise for
either intensely complex samples or samples that contain one or more pairs of compounds
that are difficult to resolve.1,65
An example of a highly complex sample is a natural,
biological extract, which can be comprised of thousands of metabolites and other
compounds. These samples are too complex to be adequately separated in one dimension
and co-elution and peak overlap often result. Difficult to resolve compounds are those
that contain compounds such as enantiomers (with the use of a chiral column) or
chemically similar compounds that would be difficult to distinguish from each other.
Multidimensional chromatography is an advantageous tool in these instances as the
increased peak capacity allows for increased and improved separation power. Even
though the separation power is greatly increased for 2D-LC, it is not always the best
22
technique for every separation. Since this technique uses multiple dimensions, the
instrumentation and processing becomes much more intricate and thus expensive, it is
also time consuming and requires additional training and expertise. A sample should not
be chosen for multidimensional separation if it can be adequately separated in a
reasonable time using single dimension chromatography.
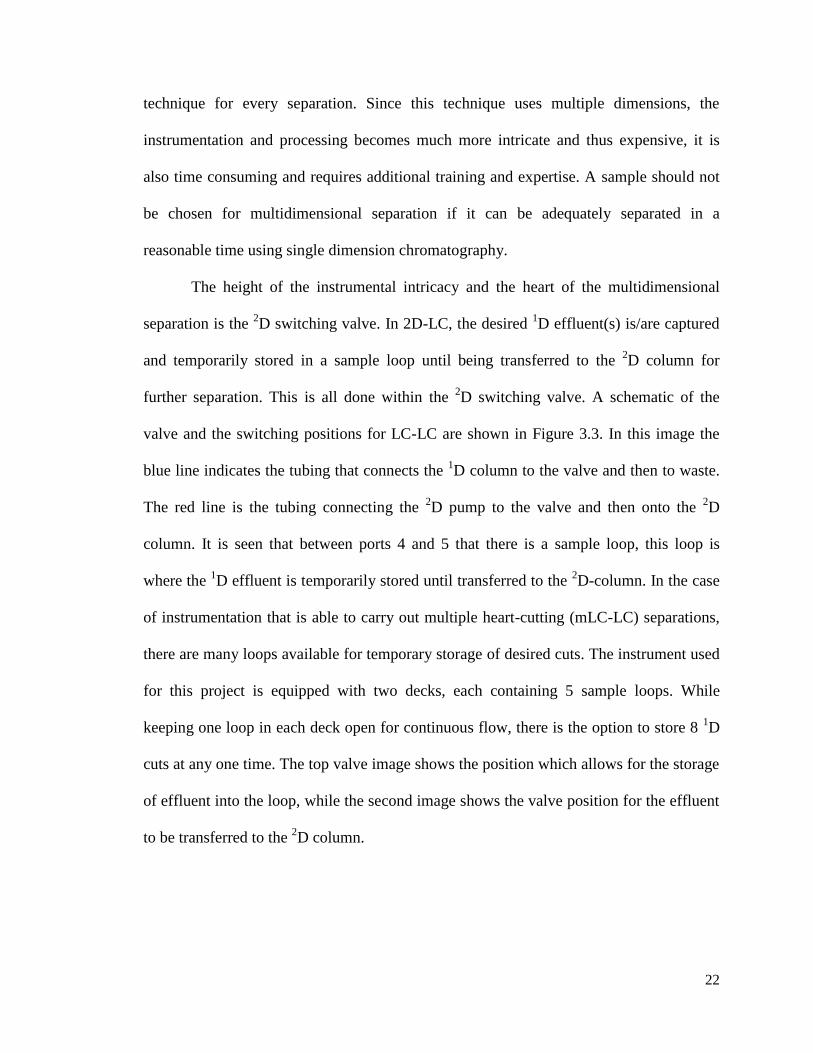
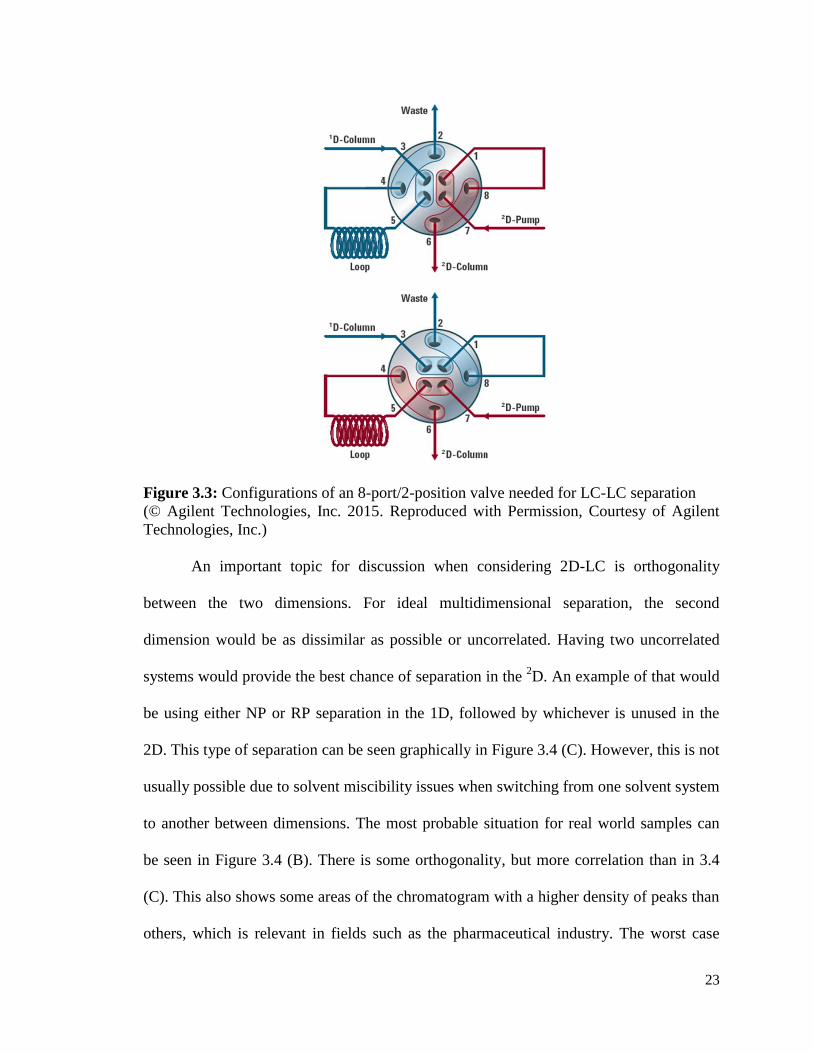
The height of the instrumental intricacy and the heart of the multidimensional
separation is the 2D switching valve. In 2D-LC, the desired
1D effluent(s) is/are captured
and temporarily stored in a sample loop until being transferred to the 2D column for
further separation. This is all done within the 2D switching valve. A schematic of the
valve and the switching positions for LC-LC are shown in Figure 3.3. In this image the
blue line indicates the tubing that connects the 1D column to the valve and then to waste.
The red line is the tubing connecting the 2D pump to the valve and then onto the
2D
column. It is seen that between ports 4 and 5 that there is a sample loop, this loop is
where the 1D effluent is temporarily stored until transferred to the
2D-column. In the case
of instrumentation that is able to carry out multiple heart-cutting (mLC-LC) separations,
there are many loops available for temporary storage of desired cuts. The instrument used
for this project is equipped with two decks, each containing 5 sample loops. While
keeping one loop in each deck open for continuous flow, there is the option to store 8 1D
cuts at any one time. The top valve image shows the position which allows for the storage
of effluent into the loop, while the second image shows the valve position for the effluent
to be transferred to the 2D column.
23
Figure 3.3: Configurations of an 8-port/2-position valve needed for LC-LC separation
(© Agilent Technologies, Inc. 2015. Reproduced with Permission, Courtesy of Agilent
Technologies, Inc.)
An important topic for discussion when considering 2D-LC is orthogonality
between the two dimensions. For ideal multidimensional separation, the second
dimension would be as dissimilar as possible or uncorrelated. Having two uncorrelated
systems would provide the best chance of separation in the 2D. An example of that would
be using either NP or RP separation in the 1D, followed by whichever is unused in the
2D. This type of separation can be seen graphically in Figure 3.4 (C). However, this is not
usually possible due to solvent miscibility issues when switching from one solvent system
to another between dimensions. The most probable situation for real world samples can
be seen in Figure 3.4 (B). There is some orthogonality, but more correlation than in 3.4
(C). This also shows some areas of the chromatogram with a higher density of peaks than
others, which is relevant in fields such as the pharmaceutical industry. The worst case

24
scenario is shown in Figure 3.4 (A) where the separation in both dimensions is highly
complementary. This would suggest that any co-eluting peaks in the 1D
would also co-
elute in the 2D, thus making the
2D separation redundant.
Figure 3.4: Effects of different degrees of correlation of separation mechanisms in plots
of first versus second dimension retention. (A) Example of separations with total
correlation; (B) example of separations with partial correlation; (C) example of
orthogonal separations. (© Agilent Technologies, Inc. 2015. Reproduced with
Permission, Courtesy of Agilent Technologies, Inc.)
3.4 Surface-Enhanced Raman Spectroscopy
3.4.1 Plasmonics
At the nanoscale, metals show different physical behaviours resulting in unique
electrical and optical responses.66
Some of the oldest and most notable examples include
the embedding of colloidal metal nanoparticles into glass works to create differing
colours, more commonly known as stained glass. Plasmonics is the field of research
which explores these unique interactions between certain nanoscale metals and incident
light. At the nanoscale, metals can convert incident light into localised electric fields,
which is made possible by the strong interaction between the oscillating electric field of
the light and the free electrons in the nanostructures.67
The metal is a key component to
25
plasmonics as it is the material which supports the surface plasmons (SPs), which are the
electromagnetic waves coupled to the collective oscillation of free electrons in the
metal.66,67
Surface plasmons can be classified as one of two types: localized surface plasmon
(LSP), or propagating surface plasmons (PSP). LSPs are described in metals that are
nanoscale in all dimensions, such as a nanosphere. Contrarily, PSPs are described in
metals that are nanoscale in one or two dimensions, such as a nanofilm or a nanowire
respectively.66,67
Both LSPs and PSPs give rise to resonance, accurately named localized
surface plasmon resonance (LSPR) and propagating surface plasmon resonance (PSPR),
respectively. This thesis deals only with LSPs and LSPR as it pertains to the research
objective.
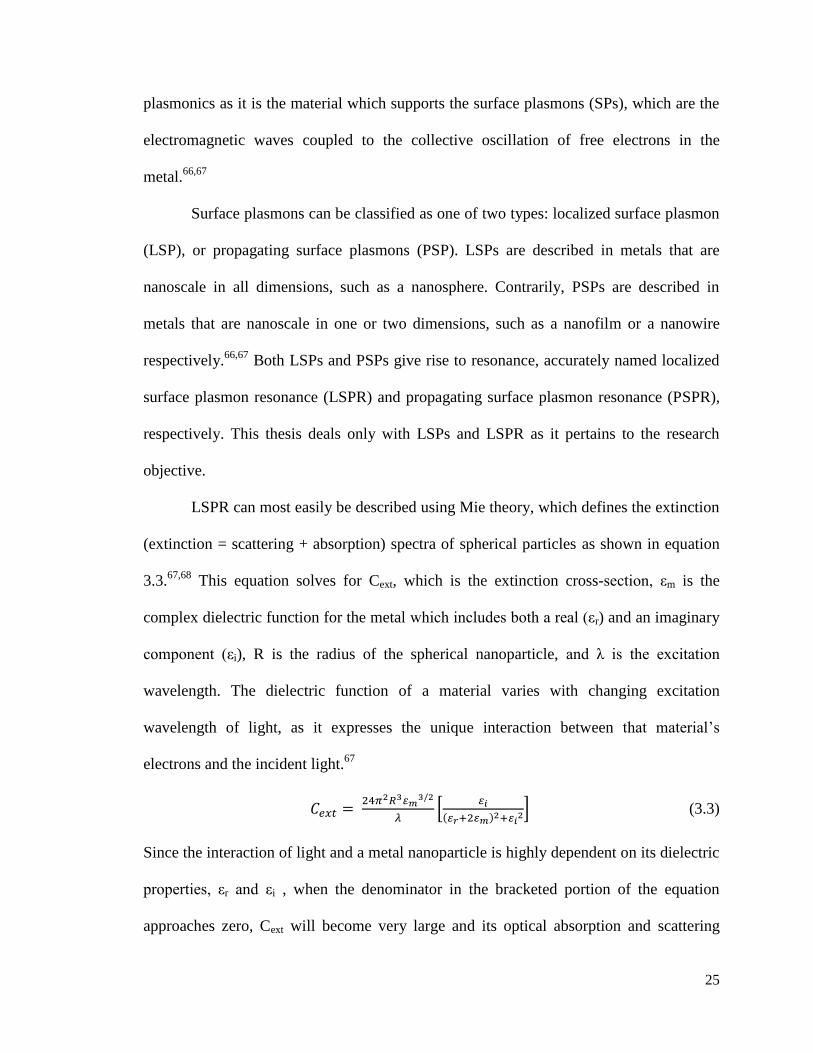
LSPR can most easily be described using Mie theory, which defines the extinction
(extinction = scattering + absorption) spectra of spherical particles as shown in equation
3.3.67,68
This equation solves for Cext, which is the extinction cross-section, εm is the
complex dielectric function for the metal which includes both a real (εr) and an imaginary
component (εi), R is the radius of the spherical nanoparticle, and λ is the excitation
wavelength. The dielectric function of a material varies with changing excitation
wavelength of light, as it expresses the unique interaction between that material’s
electrons and the incident light.67
𝐶𝑒𝑥𝑡 = 24𝜋2𝑅3𝜀𝑚
3/2
𝜆[
𝜀𝑖
(𝜀𝑟+2𝜀𝑚)2+𝜀𝑖2] (3.3)
Since the interaction of light and a metal nanoparticle is highly dependent on its dielectric
properties, εr and εi , when the denominator in the bracketed portion of the equation
approaches zero, Cext will become very large and its optical absorption and scattering
26
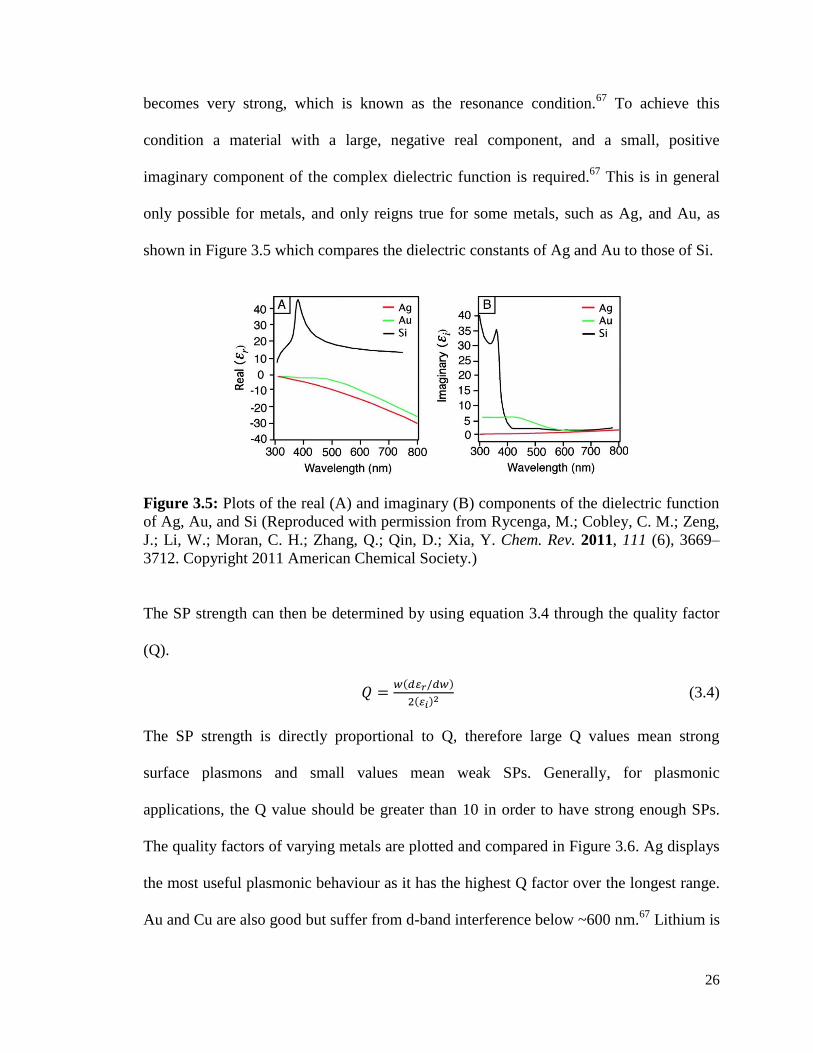
becomes very strong, which is known as the resonance condition.67
To achieve this
condition a material with a large, negative real component, and a small, positive
imaginary component of the complex dielectric function is required.67
This is in general
only possible for metals, and only reigns true for some metals, such as Ag, and Au, as
shown in Figure 3.5 which compares the dielectric constants of Ag and Au to those of Si.
Figure 3.5: Plots of the real (A) and imaginary (B) components of the dielectric function
of Ag, Au, and Si (Reproduced with permission from Rycenga, M.; Cobley, C. M.; Zeng,
J.; Li, W.; Moran, C. H.; Zhang, Q.; Qin, D.; Xia, Y. Chem. Rev. 2011, 111 (6), 3669–
3712. Copyright 2011 American Chemical Society.)
The SP strength can then be determined by using equation 3.4 through the quality factor
(Q).
𝑄 =𝑤(𝑑𝜀𝑟/𝑑𝑤)
2(𝜀𝑖)2 (3.4)
The SP strength is directly proportional to Q, therefore large Q values mean strong
surface plasmons and small values mean weak SPs. Generally, for plasmonic
applications, the Q value should be greater than 10 in order to have strong enough SPs.
The quality factors of varying metals are plotted and compared in Figure 3.6. Ag displays
the most useful plasmonic behaviour as it has the highest Q factor over the longest range.
Au and Cu are also good but suffer from d-band interference below ~600 nm.67
Lithium is

27
also potentially useful, but practical use is limited due to reactivity. Hence, this work uses
only Ag nanomaterials as it is the most widely applicable and most used metal for SERS
applications, which is a main objective of this thesis work.
Figure 3.6: Quality factor (Q) of the LSPR for a metal/air interface of various metals.
The shaded area represents the area of interest for many plasmonic applications
(Reproduced with permission from Rycenga, M.; Cobley, C. M.; Zeng, J.; Li, W.; Moran,
C. H.; Zhang, Q.; Qin, D.; Xia, Y. Chem. Rev. 2011, 111 (6), 3669–3712. Copyright 2011
American Chemical Society.)
3.4.2 Raman Spectroscopy
Raman spectroscopy is a common vibrational technique that is based on the
inelastic scattering of monochromatic light.69,70
Light can interact with matter in one of
three ways; the photons that make up the light may be absorbed, transmitted or scattered
by atoms and molecules. Most of the scattered light has the same wavelength as the
incident light, this is known as elastic or Rayleigh scattering. However, a small fraction of
the incident photons are shifted in wavelength by molecular vibrations and rotations of
the molecules in the sample, these shifts are either known as Stokes or anti-Stokes
scattering.69,70
Both Stokes and anti-Stokes scattering are forms of inelastic scattering,
called Raman scattering. The Stokes and anti-Stokes scattering and their shifts in energy
are shown in Figure 3.7. As described above, Rayleigh scattering has the excited
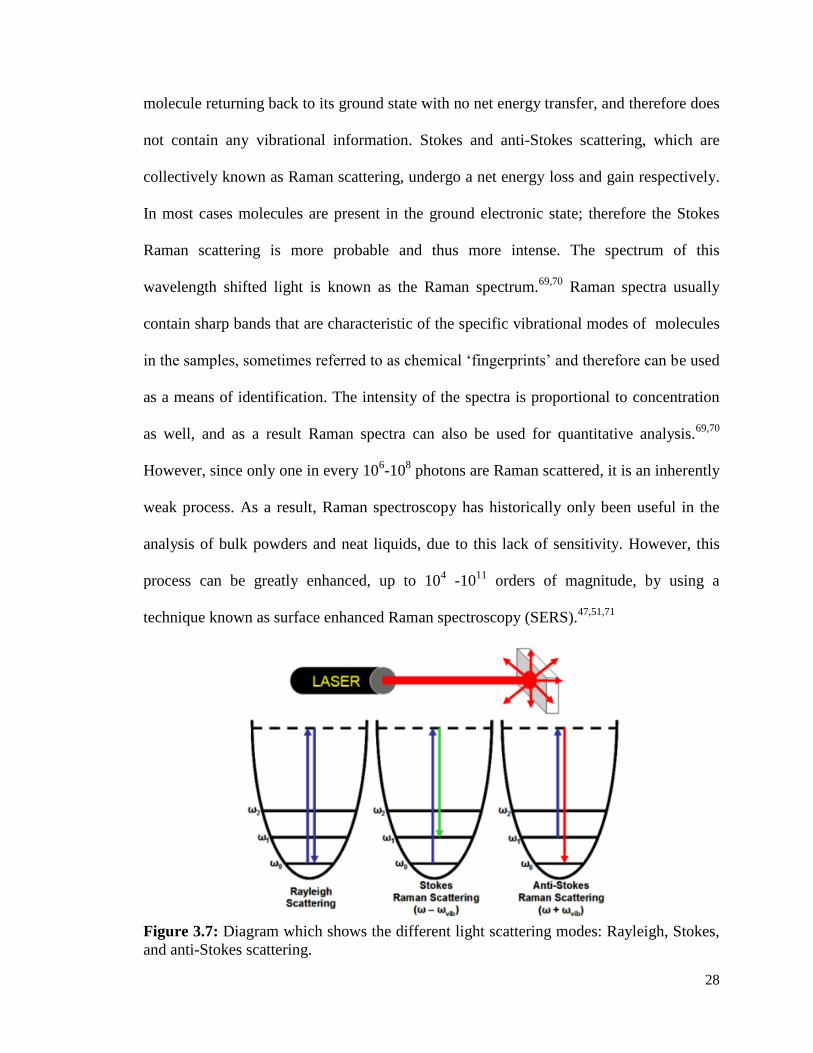
28
molecule returning back to its ground state with no net energy transfer, and therefore does
not contain any vibrational information. Stokes and anti-Stokes scattering, which are
collectively known as Raman scattering, undergo a net energy loss and gain respectively.
In most cases molecules are present in the ground electronic state; therefore the Stokes
Raman scattering is more probable and thus more intense. The spectrum of this
wavelength shifted light is known as the Raman spectrum.69,70
Raman spectra usually
contain sharp bands that are characteristic of the specific vibrational modes of molecules
in the samples, sometimes referred to as chemical ‘fingerprints’ and therefore can be used
as a means of identification. The intensity of the spectra is proportional to concentration
as well, and as a result Raman spectra can also be used for quantitative analysis.69,70
However, since only one in every 106-10
8 photons are Raman scattered, it is an inherently
weak process. As a result, Raman spectroscopy has historically only been useful in the
analysis of bulk powders and neat liquids, due to this lack of sensitivity. However, this
process can be greatly enhanced, up to 104 -10
11 orders of magnitude, by using a
technique known as surface enhanced Raman spectroscopy (SERS).47,51,71
Figure 3.7: Diagram which shows the different light scattering modes: Rayleigh, Stokes,
and anti-Stokes scattering.

29
3.4.3 Surface-Enhanced Raman Spectroscopy
In 1974 the enhanced Raman spectrum of pyridine adsorbed on a roughened silver
electrode was reported.48
Authors originally believed that this improvement was due to
increased surface area and thus coined the term surface-enhanced Raman spectroscopy
(SERS).72
However in 1978 this idea was challenged; Creighton & Albrecht49
attributed
the enhancement to a chemical or charge-transfer effect and Jeanmaire & Van Duyne47
to
an electromagnetic effect.72
In more recent years, the fundamental ideas concerning the
origin of the SERS signal have been extensively studied and continue to evolve.
Generally, there is a consensus on the contributions to the enhancement, which still
involves both a chemical (charge-transfer) mechanism as well as an electromagnetic
mechanism based on the presence of the localized surface plasmon resonance.67,72
The chemical SERS enhancement is thought to arise from electron transfer
between the molecule and the nanoparticle. This is driven by the incident radiation which
facilitates the excitation of electrons from the HOMO to the LUMO in the molecule.67
However, the chemical mechanism (CM) is thought to only contribute 10-102 to the
overall enhancement.67,71
The electromagnetic SERS enhancement arises due to LSPR
modes, which can focus light into nanosized volumes, drastically increasing the electric
field intensity near the nanoparticle, which can then be scattered by molecules on or in the
vicinity of the metal surface.67
Theoretical predictions suggest that the electromagnetic
mechanism (EM) contributes the most to SERS, approximately 104-10
10. Combining both
the CM and EM contributions, one can see that the Raman signal for a desired analyte can
be increased by 105-10
12 times simply by incorporating metal nanoparticles into the
system. This level of signal enhancement makes single molecule detection a possibility,
as has been illustrated for certain systems.67,72

30
The EM enhancement, and therefore the SERS enhancement, sharply decreases as
the distance between the analyte and the nanoparticle surface increases.71,73
The EM
enhancements for SERS has been derived to be 1 / r10
due to the decay length of the
LSPR. However, the 1/ r10
dependence is theoretical and is highly susceptible to the
differing shapes and sizes of nanoparticles on the surface.73
To fully benefit from the
overall SERS enhancement it has been experimentally determined that molecules should
be within 2 – 4 nm of the nanoscale roughened surface.71
To achieve this very close
proximity, molecules that have a low affinity for the metal surface have been coaxed
closer to the surface by using self-assembled monolayers, aptamers, and other surface
treatments of attractive nature to the analyte in question.71
3.4.4 Electrochemical Surface-Enhanced Raman Spectroscopy
Electrochemistry is a branch of physical chemistry that is focused on the
interaction between electrical and chemical changes in a system. This technique has
become popular in analytical fields for its application in environmental monitoring,
industrial quality control, and biomedical analysis.74
In contrast to many homogenous
bulk solutions, electrochemical processes take place at the electrode-solution interface.
There are two main types of electroanalytical measurements: potentiometric and
potentiostatic, the difference between the techniques being the type of electrical signal
used for quantification.74,75
Both types require an electrochemical cell. The cell is
comprised of at least two electrodes (conductors) and an electrolytic solution. The
electrolytic solution is commonly an aqueous salt solution; however choice of solvent is
dependent on analyte solubility and its redox activity. The solvent should also not react
with the analyte or any potential products, and should not undergo electrochemical
reactions over a wide potential range.74,75
31
This thesis work uses potentiostatic measurements, which focus on the charge-
transfer process at the electrode-solution interface. Using this methodology, the electrode
potential is being used to drive an electron transfer reaction and the resulting current is
measured.74
Potentiostatic measurements use a three-electrode configuration, which
consists of a working, reference, and counter electrode. The working electrode is where
the reaction of interest takes place. The reference electrode provides a reproducible
potential independent of the sample composition in which the working electrode potential
is compared. The counter electrode is an inert conductive material such as platinum or
graphite.74
Coupling SERS and electrochemistry is termed electrochemical surface-enhanced
Raman spectroscopy (EC-SERS). This technique allows for the detection of analyte
molecules on a metallic surface at a chosen applied voltage. EC-SERS can be useful to
detect signal of an analyte in biologically relevant electrical environments and to monitor
surface redox processes.47,51
Application of a voltage also changes the chemical and
electrical environment and can change the position or conformation of the molecule on
the surface. This technique can be exploited to obtain a desired conformation or oxidation
state of the analyte molecule while using the selective and sensitive SERS technique.47
32
Chapter 4: Materials and Methods
4.1 Introduction
This section starts with a description of the reagents used in this thesis work. The
instrumentation is then noted with the corresponding procedures and rationale. Finally the
methodology for SERS substrate fabrication and their characterization is outlined.
4.2 Reagents
AgNO3 (99.9999%), NaBH4 (≥96%), NaCl (99%), KCl (≥99%), and pyridine
(≥99%) were all purchased from Sigma Aldrich (St, Louis, MO, USA). Citric acid
(>99%) was purchased from Alfa Aesar (Tweksbury, MA, USA) and sodium citrate from
ACP (Montreal, Quebec). Chromatographic analytical standards of luteolin (95%),
quercetin dehydrate (96%), caffeic acid (98%) and chlorogenic acid (96%) were
purchased from Toronto Research Chemicals (TRC) Canada (Toronto, Ontario). All
chemicals were used without further purification and all solutions were prepared using
Millipore water (≥ 18.2 MΩ•cm). All glassware was placed in an acid bath composed of
neat H2SO4 overnight, and was then thoroughly rinsed with Millipore water prior to use.
4.3 Instrumentation
4.3.1 Spectroscopy
4.3.1.1 UV-vis Spectroscopy
UV-visible measurements were obtained using a Cary 60 UV-visible spectrometer
(Agilent, Santa Clara, CA). This instrument was used to record UV-vis absorbance
measurements for the analyte to select wavelengths to monitor during chromatographic
experiments. Samples were placed in a quartz cuvette and spectra were collected over the
a range from 200 – 800 nm. Instrument resolution was 1.5 nm.
33
4.3.1.2 Raman Spectroscopy
The bulk of the Raman spectra recorded in this work used a DeltaNu Advantage
785 Raman spectrometer (SciAps, Woburn, MA). This spectrometer is fitted with a 785
nm diode laser, an air cooled CCD detector, and has a resolution of 4.0 cm-1
. The
spectrometer was operated with NuSpec software for signal acquisition and processing.
EC-SERS work was done using a DXR Smart Raman Spectrometer (Thermo
Fisher Scientific, Mississauga, ON, Canada). This spectrometer has the ability to use two
different laser excitation wavelengths: 532 nm and 780 nm, and can be fitted with two
different gratings: a full range, low resolution (5 cm-1
) grating, and a shorter range, high
resolution (3 cm-1
) grating. This thesis work used only the 780 nm laser line with the high
resolution grating, as using a lower energy wavelength results in lower background
fluorescence. This Raman spectrometer was used for the EC-SERS work since it is also
coupled to a potentiostat, which is necessary for electrochemical measurements.
An acquisition time of 30 s and a laser power setting ranging between 12 and 27
mW was used for collecting Raman spectra with both the 785 nm and 780 nm laser lines.
For all further spectral processing and data analysis was completed using Origin 9.0
(OriginLab Corporation, Northampton, MA) on a standard PC. All data measured were
corrected for acquisition time and laser power, and also smoothed using a 9 point
adjacent/averaging smoothing method.
4.3.2 Electrochemistry
A Pine Research Instrumentation portable USB Wavenow potentiostat/galvanostat
(Durham, NC, U.S.A.) was used for conducting electrochemical measurements with the
electrochemical software, Aftermath Data Organizer (version 1.2.4361), also produced by
Pine Research Instrumentation.

34
4.3.2.1 Electrochemical Surface-Enhanced Raman Spectroscopy (EC-SERS)
Screen printed electrodes (SPE) (15 x 61 x 0.36 mm) were purchased from Pine
Research Instrumentation (Durham, NC, U.S.A.). They consist of a silver/silver chloride
(Ag/AgCl) reference electrode, a carbon counter electrode, and a 5 x 4 mm carbon
working electrode. The working electrode was then modified with Ag nanoparticles and
surface treatments as outlined in section 4.4.3 rendering the electrode SERS active.
Modified SPEs were placed in the electrochemical cell, which was a standard glass vial.
0.1 M NaF was used as the supporting electrolyte and was purged with argon (99.999%,
Praxair Canada Inc., Ontario, Canada) prior to use, and was added to the electrochemical
cell containing the SPE. The open circuit potential (OCP) spectrum could then be
collected. This spectrum is an important reference as it represents the SERS signal
achievable at the resting potential of the metal (i.e. SERS without any electrochemical
contribution). The system was first stepped in the cathodic direction (0.0 V to -1.0 V) and
then the anodic direction (-1.0 V to 0.0V), both in increments of 0.1V. At each applied
potential a SERS spectrum was collected. All potentials are reported versus Ag/AgCl
reference electrode.
4.3.3 Scanning Electron Microscopy
Scanning electron microscopy (SEM) images were acquired using Tescan MIRA3
LMU Field Emission SEM (Warrendale, PA, U.S.A.). This FE-SEM has a tungsten
electron gun and is fitted with both a back scatter and a secondary electron detector.
4.3.4 Liquid Chromatography
4.3.4.1 One-Dimensional Liquid Chromatography
Single dimension liquid chromatographic analysis was carried out on an Agilent
1290 Infinty II series UHPLC system (Agilent Technologies, Santa Clara, CA). Mobile

35
phases of (A) 0.1% formic acid in water and (B) 0.1% formic acid in methanol were used.
After optimization, the gradient elution used was as follows: 0 min at 50%B, 3 min at
55%B, 10 min at 80%B, and 11 min at 95%B. An Agilent ZORBAX SB-C18 (2.1 × 100
mm × 1.8 µm) column was maintained at 30 °C throughout the entire run (stop time = 15
min). An extract volume of 1.5 µL was injected into the system using an auto-sampler
and a flow rate of 0.2 mL / min was used. UV-vis spectra were collected at 350 nm for
pure samples and 327 nm for mixtures using a diode array detector (DAD), with a
reference wavelength of 500 nm and a bandwidth of 50 nm.
Samples were prepared in a MeOH / H2O solution and filtered with 0.2 µm
polytetrafluoroethylene (PTFE) syringe filters.
4.3.4.2 Two-Dimensional Liquid Chromatography
Multidimensional liquid chromatographic analysis was carried out on the same
system. The first dimension separation was exactly as outlined above. The second
dimension used mobile phases of (A) 0.1% formic acid in water and (B) 0.1% formic acid
in acetonitrile, formic acid obtained from Anachemica (Montreal, QC) and acetonitrile
obtained from Sigma Aldrich (St. Louis, MO). The second dimension uses a two minute
run time with a gradient as follows: 0 min at 5%B and 1.4 min at 95%B. An Agilent
ZORBAX BONUS RP (2.1 × 50 mm × 1.8 µm) column was used with a maintained
temperature of 30 °C. An extract volume of 2.0 µL was injected using an auto-sampler
and a flow rate of 1 mL / min was used in the second dimension while 0.2 mL / min was
used in the first dimension. A threshold of 20 mAU was used to trigger heart-cutting from
the first dimension to the second dimension and a threshold of 2.5 mAU to trigger
fraction collection into an Agilent 96-well plate. UV-vis spectra were again collected at
36
327 nm, with a reference wavelength at 500 nm and a bandwidth of 50 nm using a diode
array detector.
2D-LC-SERS analysis was completed by drop coating the collected fraction onto
pre-treated filter paper SERS substrates in 5 µL aliquots, which were allowed to briefly
air dry, and were then analysed using SERS.
4.4 Surface-Enhanced Raman Spectroscopy Substrates
4.4.1 Silver Nanoparticle Synthesis
The following method for silver nanoparticle preparation is adapted from Zhao et
al.76
95.0 mL of Millipore water, 1.0 mL of 0.1M AgNO3, 3.4 mL of 5% w/w sodium
citrate, and 0.6 mL of 0.17 M citric acid were all added to a three necked, flat bottom
flask and stirred. A 200 µL aliquot of a 0.1 mM solution of NaBH4 was then added to the
mixture and left to react for one minute. The mixture was then allowed to boil under
reflux for 80 minutes before being cooled to room temperature. The colloidal Ag was
portioned into 14 centrifuge tubes, each containing 1.43 mL and centrifuged for 20 min at
8000 rpm. The resulting supernatant was removed and the remaining Ag “paste” was
combined into one tube and the centrifugation step repeated. The supernatant was
removed again and the final amount of AgNP paste was made up to 50 µL using millipore
water.
4.4.2 Three-Dimensional Surface-Enhanced Raman Spectroscopy Substrate
Preparation
The 3D SERS substrates were created using 47 mm glass fiber filters (Gelman,
Ann Arbour, MI, USA), 0.45 µm nitrocellulose membrane filters (Whatman, Maidstone,
UK), 37% silk, 35% hemp, 28% cotton blend fabric (Pickering International, Inc. San
Francisco, USA), Ahlstrom grade 631 cellulose based filter paper (Whatman, Maidstone,

37
UK), and 0.02 µm porous alumina (Whatman, Maidstone, UK). The 3D materials were
cut into approximately 5 x 4 mm rectangles and AgNP paste was drop coated onto the FP
in 3 layers of 5µL; each layer was allowed to dry fully prior to the application of another
layer. After the final layer was dried, a 5 µL sample of analyte (1 mM) was drop coated
onto the substrate and analysed. Analysis included SEM characterization, SERS
characterization of spot-to-spot signal variation, and comparison of signal intensity to one
another.
The filter paper (FP) substrates outperformed the other materials and thus three
different laboratory filter papers (Ahlstrom grade 631, Fisher grade P5, and Whatman
grade 1) were chosen and compared (Table 4.1).
Table 4.1: Comparison of properties for different filter paper brands.
Ahlstrom
(Grade 631)
Fisher
(Grade P5)
Whatman
(Grade 1)
Thickness (mm) 0.23 0.17 0.18
Particle Retention
(µm)
25
10
11
Flow Rate (mL/min) 200 60 55
Loading Capacity High Medium Medium
4.4.3 Substrate Surface Modifications
Both a displacement of capping agents and functionalization of the nanoparticle
surface needs to be carried out in order to detect the phenolic compounds. The capping
agents that are used to stabilize and protect NPs can become problematic when doing
38
SERS measurements as their signals can overshadow that of the analyte. In this work, the
FP substrates were allowed to incubate in a 0.5 M solution of KCl for 30 minutes, after
which they were rinsed with Millipore water and allowed to air dry. Due to the strong
specific adsorption of Cl- onto the Ag surface, it is able to displace capping agents,
allowing the analyte to be detected once sequentially introduced.77,78
Due to the poor adsorption of phenolic compounds onto the AgNP surface, a
functionalization of the surface needs to be performed in order to more closely attract
these molecules to the surface, thereby aiding in their detection by SERS. Pyridine was
chosen as a candidate for surface functionalizing based on a study by De Bleye et al.79
.
This study showed evidence that by modifying a Ag nanoparticle surface with pyridine it
improved the SERS signal for the detection of bisphenols. In this approach, the KCl-
treated FP substrates were further incubated in a 1 mM aqueous pyridine solution for one
hour before being rinsed with Millipore water and air dried. SERS performance was then
evaluated using four polyphenol standards.
4.5 Electrochemical-Surface-Enhanced Raman Spectroscopy Substrate Preparation
For electrochemical SERS (EC-SERS) investigations carbon screen printed
electrodes (SPEs) were prepared using similar methods to pervious work.77,78
AgNP paste
was drop coated onto the rectangular 4 x 5 mm working electrode in 3 layers of 5µL; each
layer was allowed to dry fully prior to the application of another layer. After the final
layer was dried, SPEs were allowed to incubate in a 0.5 M solution of KCl for 30
minutes, after which they were rinsed with Millipore water and allowed to air dry.
Finally, a 5 µL sample of pyridine (100 mM) was drop coated onto the substrate and
analysed. The SPE features a built-in counter electrode (carbon) and reference electrode
(Ag/AgCl). All electrolyte solutions were purged with argon gas prior to measurement.
39
Chapter 5: Results and Discussion
5.1 Comparison of Three-Dimensional (3D) Surface-Enhanced Raman Spectroscopy
Substrates
A three-dimensional (3D) SERS substrate was chosen due to the increased surface
area and the higher chance of interaction with analytes compared to 2D substrates. Five
three-dimensional materials [blend fabric (37% silk, 35% hemp, 28% cotton), glass fiber
filter, nitrocellulose membrane filter, cellulose based qualitative filter paper, and porous
alumina] were selected and tested to observe which gave a more intense SERS signal for
the standard test flavonoid molecule, luteolin. In Figure 5.1, scanning electron
microscopy (SEM) images of each substrate can be seen and Figure 5.2 shows the SERS
spectra for each substrate with identical treatments of 0.5 M KCl and 1.0 mM pyridine
and addition of 5 µL of 1.0 mM luteolin. It can be seen that the standard laboratory filter
paper (FP) out performed all other materials by a significant margin and hence all further
studies focused on filter paper based substrates.
Figure 5.1: (A) Blend fabric, (B) filter paper, (C) nitrocellulose membrane, and (D) glass
fiber filter SEM images with silver nanoparticles. (E) Porous alumina SEM image is
shown without nanoparticles for ease of viewing the 3D structure.
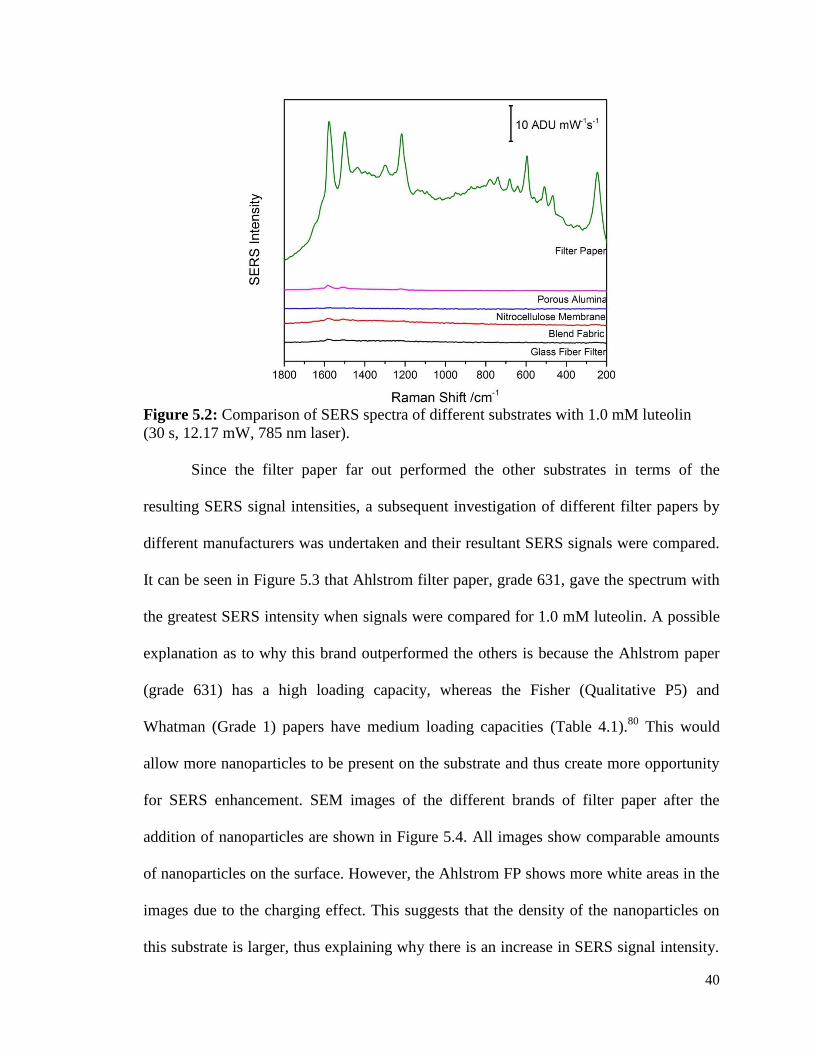
40
Figure 5.2: Comparison of SERS spectra of different substrates with 1.0 mM luteolin
(30 s, 12.17 mW, 785 nm laser).
Since the filter paper far out performed the other substrates in terms of the
resulting SERS signal intensities, a subsequent investigation of different filter papers by
different manufacturers was undertaken and their resultant SERS signals were compared.
It can be seen in Figure 5.3 that Ahlstrom filter paper, grade 631, gave the spectrum with
the greatest SERS intensity when signals were compared for 1.0 mM luteolin. A possible
explanation as to why this brand outperformed the others is because the Ahlstrom paper
(grade 631) has a high loading capacity, whereas the Fisher (Qualitative P5) and
Whatman (Grade 1) papers have medium loading capacities (Table 4.1).80
This would
allow more nanoparticles to be present on the substrate and thus create more opportunity
for SERS enhancement. SEM images of the different brands of filter paper after the
addition of nanoparticles are shown in Figure 5.4. All images show comparable amounts
of nanoparticles on the surface. However, the Ahlstrom FP shows more white areas in the
images due to the charging effect. This suggests that the density of the nanoparticles on
this substrate is larger, thus explaining why there is an increase in SERS signal intensity.
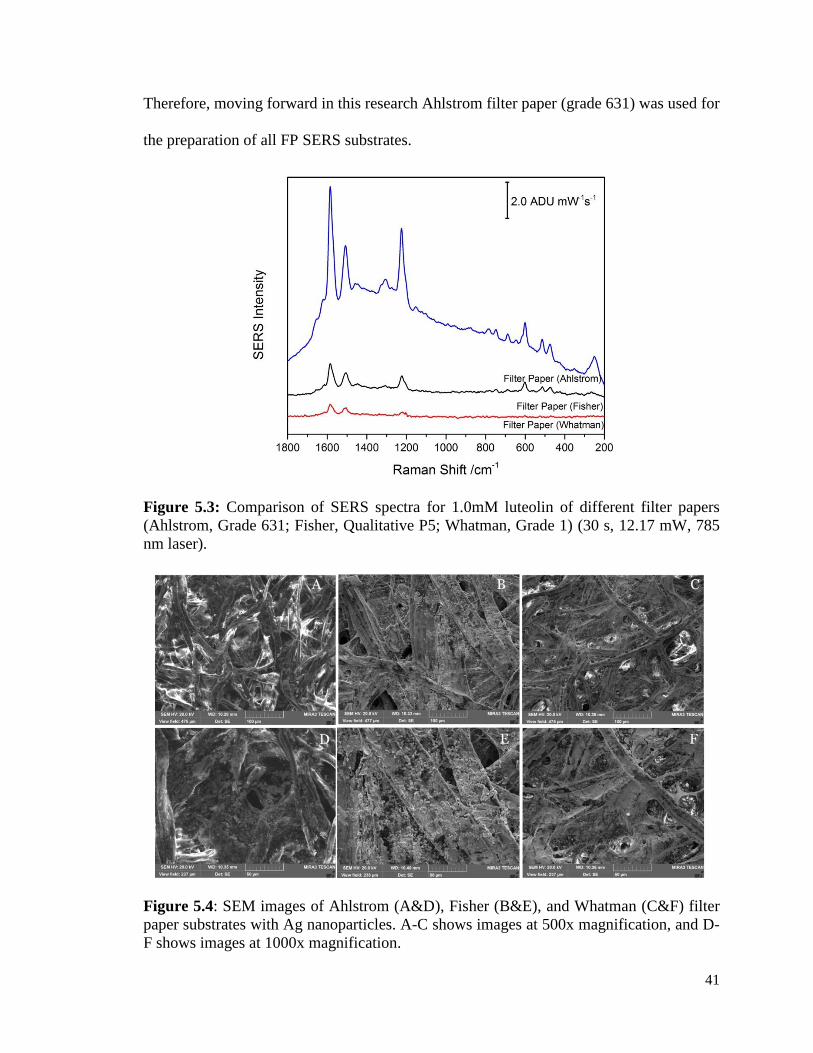
41
Therefore, moving forward in this research Ahlstrom filter paper (grade 631) was used for
the preparation of all FP SERS substrates.
Figure 5.3: Comparison of SERS spectra for 1.0mM luteolin of different filter papers
(Ahlstrom, Grade 631; Fisher, Qualitative P5; Whatman, Grade 1) (30 s, 12.17 mW, 785
nm laser).
Figure 5.4: SEM images of Ahlstrom (A&D), Fisher (B&E), and Whatman (C&F) filter
paper substrates with Ag nanoparticles. A-C shows images at 500x magnification, and D-
F shows images at 1000x magnification.

42
5.2 Pyridine Functionalization of 3D Surface-Enhanced Raman Spectroscopy
Substrates
As shown by previous research in our group77,78
, it was noted that a citrate
displacement treatment was essential to receiving clear and enhanced SERS signal. This
is due to the use of citrate as the reducing agent in the nanoparticle synthesis. Citrate ion
is a large negatively charged species that is attracted to the nanoparticle surface. The
signal from citrate can often obscure the signal for the desired analyte or can physically
block the analyte from reaching the surface and benefiting from the SERS enhancement.
Thus, a solution of potassium chloride (KCl) is used to displace the citrate from the metal
surface and replace it with a much smaller ion, Cl-.77,78
This displacement occurs due to
the strong specific adsorption of chlorine onto silver surfaces. This treatment is necessary
for the filter paper substrates as well. By incubating the FP substrates in a 0.5 M
potassium chloride (KCl) solution for 30 minutes, the chloride ions displaced the large,
negatively charged citrate molecules. However, even with citrate displacement the signal
for the flavonoid and phenolic acid analytes was not able to be seen; therefore additional
functionalization strategies were explored. In 2015, De Bleye et al. were able to detect
bisphenols by functionalizing their SERS substrates with pyridine (pyr).79
This
functionalization technique was shown to greatly aid in the detection of flavonoids and
phenolic acids in the present thesis work (Figure 5.5). An analogous functionalization
strategy explored the use of pyrazine (pyz), which has a similar structure to pyr (Figure
5.6), but with the additional nitrogen atom (and thus another lone pair susceptible to
bonding) was also investigated (Figure A.2). Functionalization with pyz resulted in lower
intensity in analyte signal, and pyridine functionalization was therefore chosen to be the
optimal strategy for detection of polyphenolic compounds.
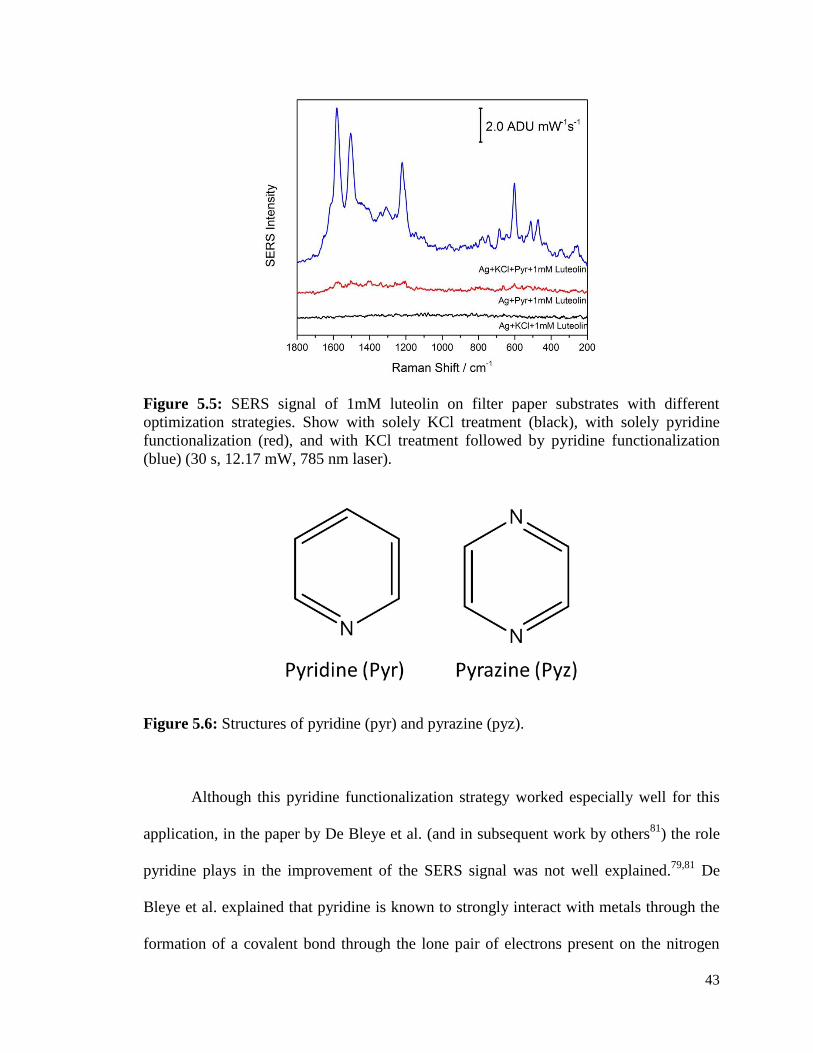
43
Figure 5.5: SERS signal of 1mM luteolin on filter paper substrates with different
optimization strategies. Show with solely KCl treatment (black), with solely pyridine
functionalization (red), and with KCl treatment followed by pyridine functionalization
(blue) (30 s, 12.17 mW, 785 nm laser).
Figure 5.6: Structures of pyridine (pyr) and pyrazine (pyz).
Although this pyridine functionalization strategy worked especially well for this
application, in the paper by De Bleye et al. (and in subsequent work by others81
) the role
pyridine plays in the improvement of the SERS signal was not well explained.79,81
De
Bleye et al. explained that pyridine is known to strongly interact with metals through the
formation of a covalent bond through the lone pair of electrons present on the nitrogen

44
atom. Despite this well-known interaction, they claim that the enhancement is also due to
the nitrogen of pyridine. This time forming hydrogen bonds with the hydroxyl
functionalities of the analyte, these two thoughts are seemingly contradictory. Since it
was clear in the present work that a pyridine functionalization strategy was needed for
efficient SERS detection of polyphenols, this current thesis work took a slight diversion
in order to elucidate the reason behind this improved signal.
Pyridine has been used historically in both Raman spectroscopy and SERS and
has a very strong Raman signal.48,82,83
However, in the present work no substantial signal
for pyridine was observed, even when it was supposedly the only substance present on the
surface. To better understand what could be happening on the surface, electrochemical
surface-enhanced Raman spectroscopy (EC-SERS) studies were conducted for the
modified screen printed electrodes (treated with both KCl and 100 mM pyr). 100 mM
aqueous pyridine solution was used as the analyte; an increased concentration of the pyr
compared to the treatment of the FP substrates was used to more clearly see the potential-
dependant changes in signal. The electrode was placed into an electrochemical cell with a
supporting electrolyte of 0.1 M aqueous sodium fluoride (NaF). Voltage was then applied
to the surface and subsequent SERS measurements were taken at each voltage. Voltages
progressed in the cathodic direction from 0 V to -1.0 V in a 100 mV step wise fashion,
and in the anodic direction from -1.0 V to 0 V in a 100 mV step-wise fashion.
The metal-surface selection rules predict that bands that correspond to molecular
vibrations with an oscillating polarizability tensor parallel to the surface will be
supressed, while molecular vibrations with an oscillating polarizability tensor
perpendicular to the surface are enhanced .84,85
Thus in this experiment, signals for ring
breathing of pyr will be suppressed when the molecule is planar to the surface and will be
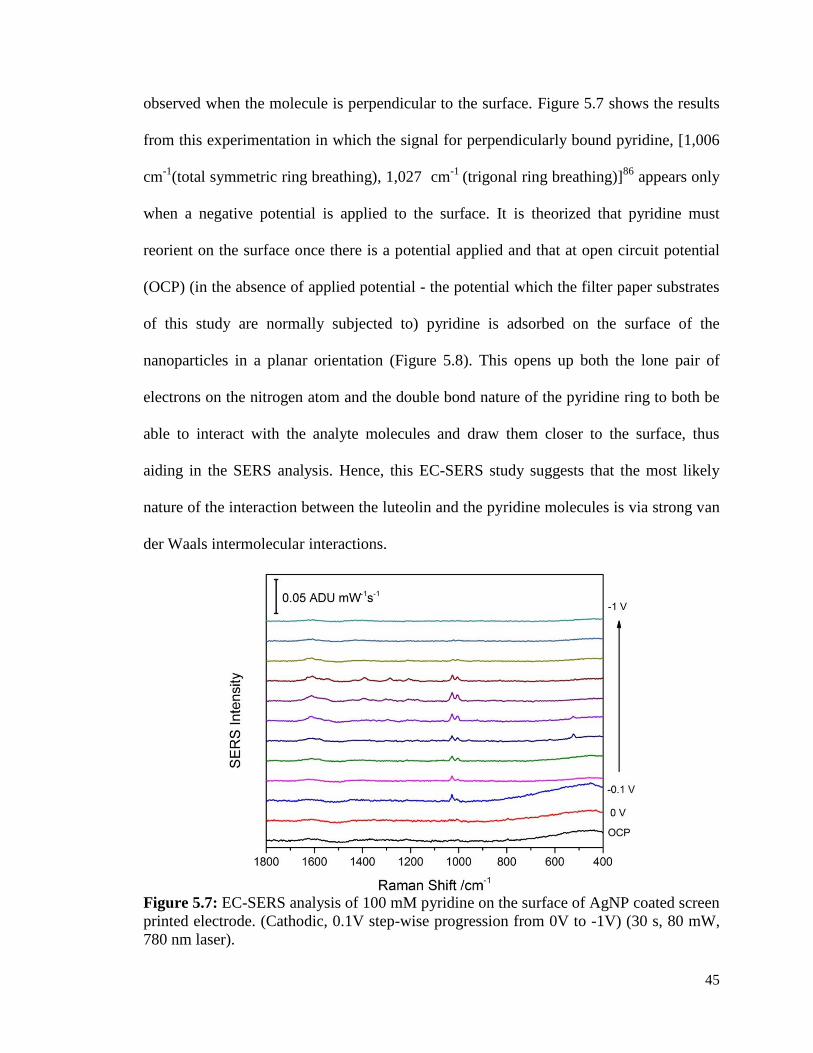
45
observed when the molecule is perpendicular to the surface. Figure 5.7 shows the results
from this experimentation in which the signal for perpendicularly bound pyridine, [1,006
cm-1
(total symmetric ring breathing), 1,027 cm-1
(trigonal ring breathing)]86
appears only
when a negative potential is applied to the surface. It is theorized that pyridine must
reorient on the surface once there is a potential applied and that at open circuit potential
(OCP) (in the absence of applied potential - the potential which the filter paper substrates
of this study are normally subjected to) pyridine is adsorbed on the surface of the
nanoparticles in a planar orientation (Figure 5.8). This opens up both the lone pair of
electrons on the nitrogen atom and the double bond nature of the pyridine ring to both be
able to interact with the analyte molecules and draw them closer to the surface, thus
aiding in the SERS analysis. Hence, this EC-SERS study suggests that the most likely
nature of the interaction between the luteolin and the pyridine molecules is via strong van
der Waals intermolecular interactions.
Figure 5.7: EC-SERS analysis of 100 mM pyridine on the surface of AgNP coated screen
printed electrode. (Cathodic, 0.1V step-wise progression from 0V to -1V) (30 s, 80 mW,
780 nm laser).
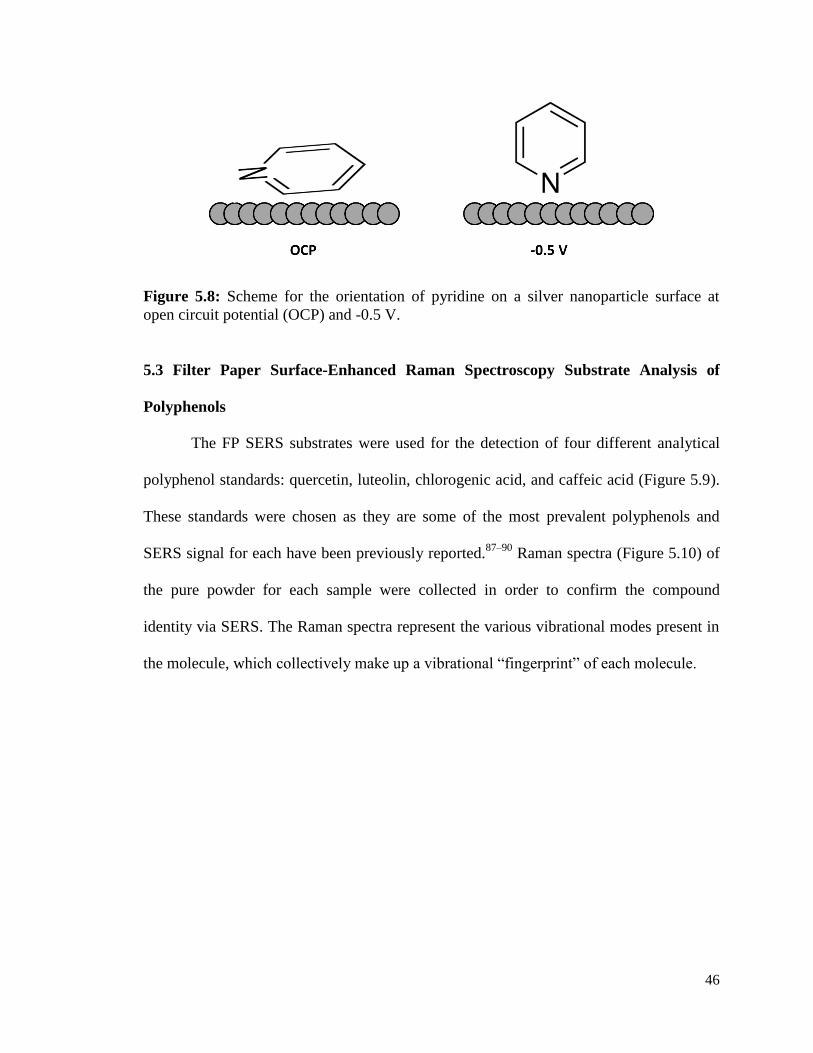
46
Figure 5.8: Scheme for the orientation of pyridine on a silver nanoparticle surface at
open circuit potential (OCP) and -0.5 V.
5.3 Filter Paper Surface-Enhanced Raman Spectroscopy Substrate Analysis of
Polyphenols
The FP SERS substrates were used for the detection of four different analytical
polyphenol standards: quercetin, luteolin, chlorogenic acid, and caffeic acid (Figure 5.9).
These standards were chosen as they are some of the most prevalent polyphenols and
SERS signal for each have been previously reported.87–90
Raman spectra (Figure 5.10) of
the pure powder for each sample were collected in order to confirm the compound
identity via SERS. The Raman spectra represent the various vibrational modes present in
the molecule, which collectively make up a vibrational “fingerprint” of each molecule.
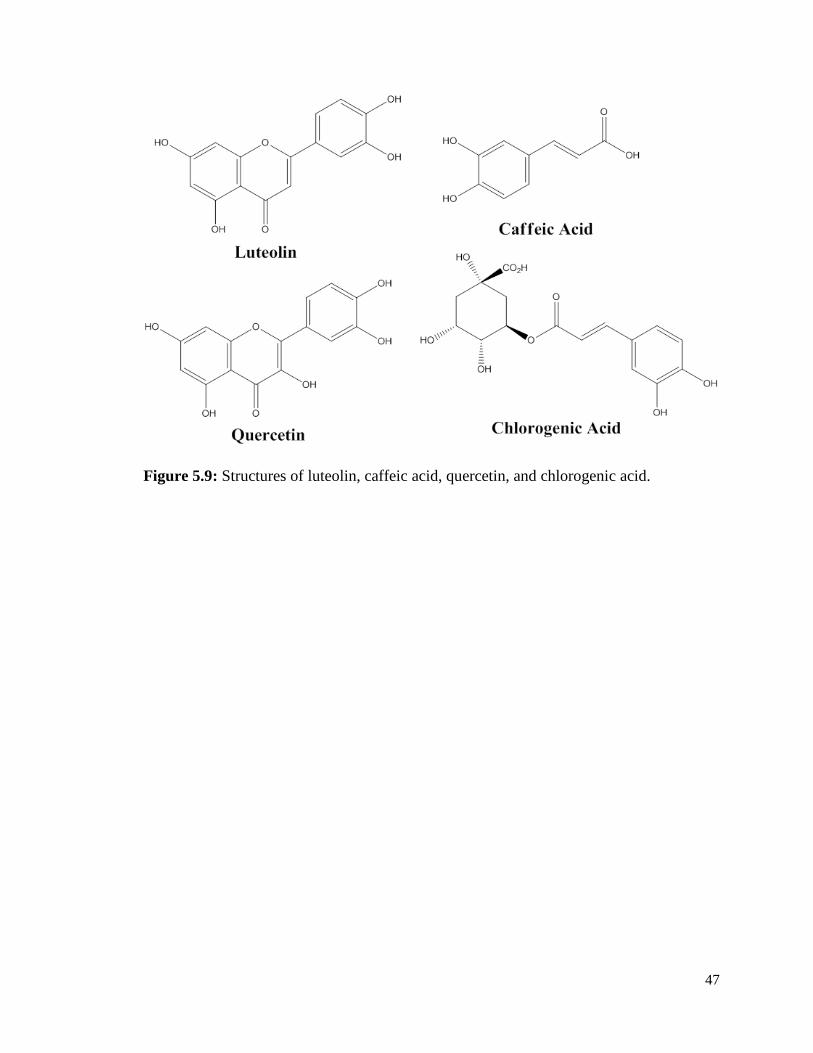
47
Figure 5.9: Structures of luteolin, caffeic acid, quercetin, and chlorogenic acid.

48
Figure 5.10: Raman spectra of caffeic acid, chlorogenic acid, luteolin, and quercetin
(30 s, 80 mW, 780 nm laser).
Analytes were drop coated onto the FP substrates after KCl and pyridine
treatments and subsequently analysed using SERS. SERS signal could be obtained for 1.0
mM concentrations of the four analytes as seen in Figure 5.11. When thinking forward to
the ultimate goal of this research, which is to collect SERS signal from the end of a 2D-
LC run, 50 ppm of analyte would be a more comparable and relevant concentration to
analyze. Thus, the SERS signal for 50 ppm of each analyte can be seen in Figure 5.12.
Once all four standards could be detected at 50 ppm using the modified FP substrates, the
thesis research moved onto the 2D-LC separation work.

49
Figure 5.11: SERS signal of 5 µL of 1.0 mM of each analyte: luteolin (286 ppm),
chlorogenic acid (354 ppm), caffeic acid (180 ppm), and quercetin (203 ppm) (30 s, 12.17
mW, 785 nm laser).
Figure 5.12: SERS signal of 5 µL of 50 ppm (of each analyte: luteolin, chlorogenic acid,
caffeic acid, and quercetin) (30 s, 12.17 mW, 785 nm laser).

50
5.4 Multidimensional Liquid Chromatographic Separations of Polyphenols
5.4.1 Characterization of Standards
In order to characterize each standard, 100 ppm solutions (20:80, MeOH:H2O)
were analysed using 1D liquid chromatography; 10 μL aliquots are injected into the
instrument and separated using gradient elution. To know which wavelength the
chromatograms should be monitored at the diode array detection (DAD), the UV-vis
spectrum of a 25 ppm mixture of the standards was recorded (Figure 5.13). This spectrum
shows a large absorbance at 327 nm, therefore DAD detection is taken around this
wavelength (350 nm for the separate standards and 327 nm for the mixtures in section
5.4.2). The chromatograms for each analytical standard are shown in Figure 5.14 with the
retention times being 4.76, 5.71, 10.21, and 10.74 minutes for chlorogenic acid, caffeic
acid, quercetin, and luteolin respectively.
Figure 5.13: UV-vis absorbance spectra of a 25 ppm mixture of luteolin, quercetin,
chlorogenic acid, and caffeic acid, diluted 1:10 with MeOH:H2O (50:50 % v/v).
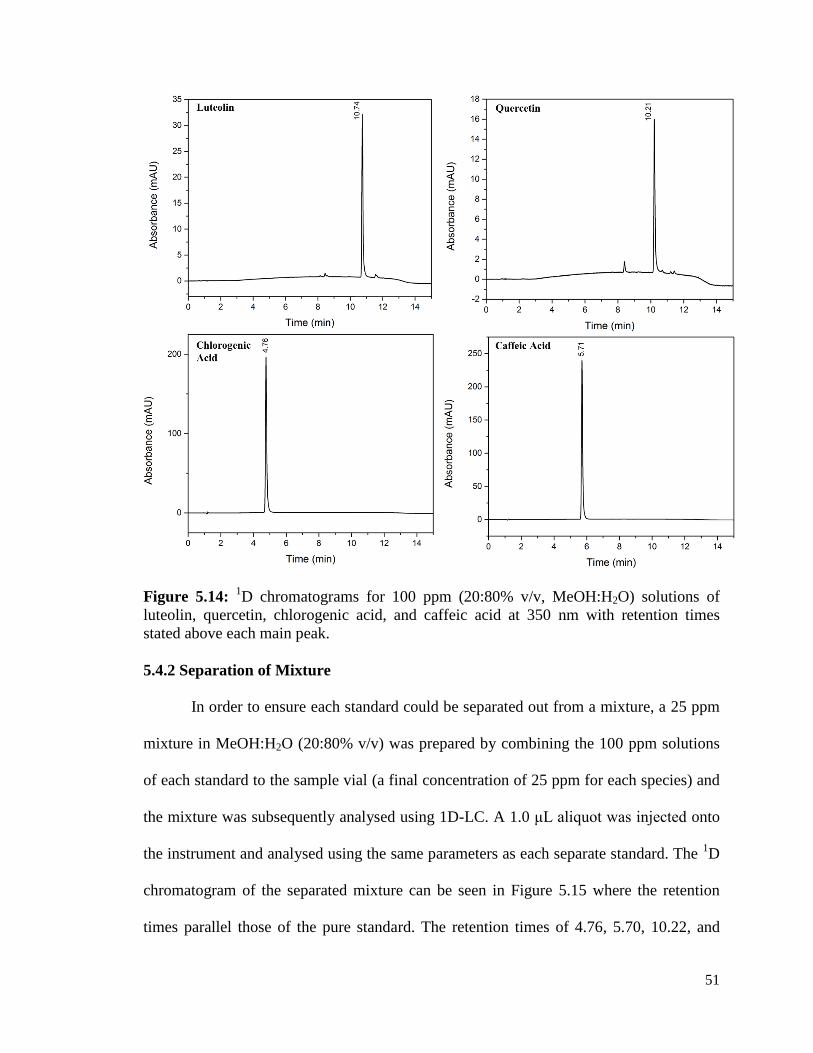
51
Figure 5.14: 1D chromatograms for 100 ppm (20:80% v/v, MeOH:H2O) solutions of
luteolin, quercetin, chlorogenic acid, and caffeic acid at 350 nm with retention times
stated above each main peak.
5.4.2 Separation of Mixture
In order to ensure each standard could be separated out from a mixture, a 25 ppm
mixture in MeOH:H2O (20:80% v/v) was prepared by combining the 100 ppm solutions
of each standard to the sample vial (a final concentration of 25 ppm for each species) and
the mixture was subsequently analysed using 1D-LC. A 1.0 μL aliquot was injected onto
the instrument and analysed using the same parameters as each separate standard. The 1D
chromatogram of the separated mixture can be seen in Figure 5.15 where the retention
times parallel those of the pure standard. The retention times of 4.76, 5.70, 10.22, and
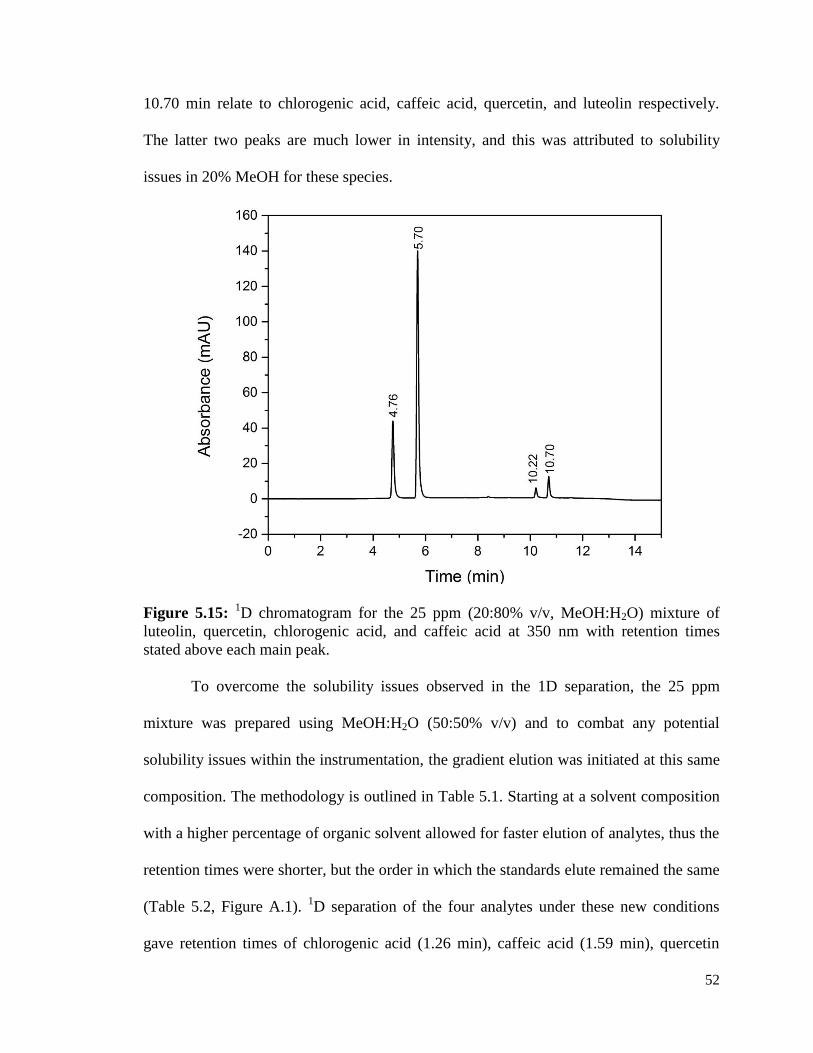
52
10.70 min relate to chlorogenic acid, caffeic acid, quercetin, and luteolin respectively.
The latter two peaks are much lower in intensity, and this was attributed to solubility
issues in 20% MeOH for these species.
Figure 5.15: 1D chromatogram for the 25 ppm (20:80% v/v, MeOH:H2O) mixture of
luteolin, quercetin, chlorogenic acid, and caffeic acid at 350 nm with retention times
stated above each main peak.
To overcome the solubility issues observed in the 1D separation, the 25 ppm
mixture was prepared using MeOH:H2O (50:50% v/v) and to combat any potential
solubility issues within the instrumentation, the gradient elution was initiated at this same
composition. The methodology is outlined in Table 5.1. Starting at a solvent composition
with a higher percentage of organic solvent allowed for faster elution of analytes, thus the
retention times were shorter, but the order in which the standards elute remained the same
(Table 5.2, Figure A.1). 1D separation of the four analytes under these new conditions
gave retention times of chlorogenic acid (1.26 min), caffeic acid (1.59 min), quercetin

53
(5.07 min), and luteolin (6.15 min). This can be seen in Figure 5.16, the 1D chromatogram
in which the retention times are reduced by half, but the relative elution order was
maintained. The dotted line reflects the threshold at which peaks were selected to be
sampled and transferred to the second dimension. In this case a threshold of 20 mAU was
chosen, and any analyte with absorbance detected at or above this limit was placed in a
sample loop to be separated in the second dimension.
Table 5.1: 1D-LC methodologies for the separation of polyphenolic compounds.
Initial Method Optimised Method
First Dimension
Column
Agilent ZORBAX SB-C18
(2.1 x 100 mm x 1.8 µm)
Agilent ZORBAX SB-C18
(2.1 x 100 mm x 1.8 µm)
Sample 20:80% v/v MeOH:H2O 50:50% v/v MeOH:H2O
Solvent A 0.1% Formic Acid in Water 0.1% Formic Acid in Water
Solvent B 0.1% Formic Acid in
Methanol
0.1% Formic Acid in
Methanol
Flow Rate 0.2 mL / min 0.2 mL / min
Gradient 20 %B at 0 min
80 %B at 10 min
95 %B at 11 min
50 %B at 0 min
55 %B at 3 min
80 %B at 10 min
95 %B at 11 min
Column Temperature 30 °C 30 °C
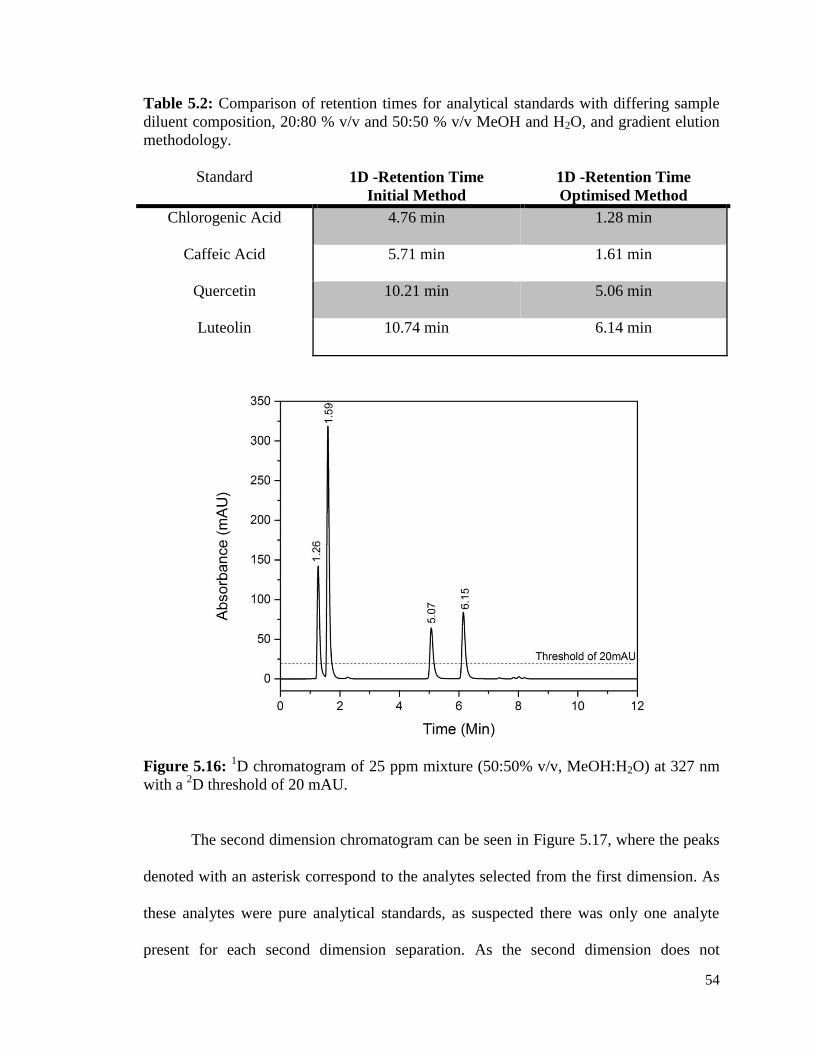
54
Table 5.2: Comparison of retention times for analytical standards with differing sample
diluent composition, 20:80 % v/v and 50:50 % v/v MeOH and H2O, and gradient elution
methodology.
Standard 1D -Retention Time
Initial Method
1D -Retention Time
Optimised Method
Chlorogenic Acid 4.76 min 1.28 min
Caffeic Acid 5.71 min 1.61 min
Quercetin 10.21 min 5.06 min
Luteolin 10.74 min 6.14 min
Figure 5.16: 1D chromatogram of 25 ppm mixture (50:50% v/v, MeOH:H2O) at 327 nm
with a 2D threshold of 20 mAU.
The second dimension chromatogram can be seen in Figure 5.17, where the peaks
denoted with an asterisk correspond to the analytes selected from the first dimension. As
these analytes were pure analytical standards, as suspected there was only one analyte
present for each second dimension separation. As the second dimension does not

55
necessarily analyse peaks in the order that they are collected, the analytes denoted in
Figure 5.17 are not in the same order as previously stated in the first dimension
separations. The peaks marked from earliest eluted to latest correlate to chlorogenic acid,
caffeic acid, luteolin, and quercetin respectively. The dotted line reflects the threshold set
for fraction collection. In this case, any analyte that absorbs higher than 2.5 mAU will be
collected into a sampling tray (96-well plate) and used for further investigation, which in
relation to this thesis work will be SERS analysis using the optimized FP substrates.
Figure 5.17: 2D chromatogram of 25 ppm mixture (50:50% v/v, MeOH:H2O) at 327 nm
with a fraction collection threshold of 2.5 mAU. Peaks with asterisks correspond to the
analytes. Elution order here is: chlorogenic acid, caffeic acid, luteolin and quercetin.

56
5.5 Multidimensional Liquid Chromatography with Surface-Enhanced Raman
Spectroscopy
After the fractions were collected for the desired analytes, a 5 µL aliquot was drop
coated onto the optimised FP substrates in aliquots of 5 µL. The samples were then
subjected to SERS analysis; Figure 5.18 shows SERS spectra of the collected fractions of
the peaks denoted with asterisks from Figure 5.17. Unfortunately, the SERS signal was
very weak and did not detect any presence of analyte on the surface. Only the strong
ν(Ag-Cl) mode at 230 cm-1
could be detected (resulting from the KCl treatment). The
reasoning behind the weak signal was suspected to be sample dilution. Since only 1.0 µL
of the 25 ppm mixture was initially injected onto the column, and it is known that through
the separation process some dilution will occur, it is feasible to suggest that the fraction
collected was too dilute to be detected using the FP substrate. Thus different injection
volumes were investigated next in order to identify if a more concentrated sample could
be collected during fraction collection, thus improving the chance for a successful SERS
analysis.
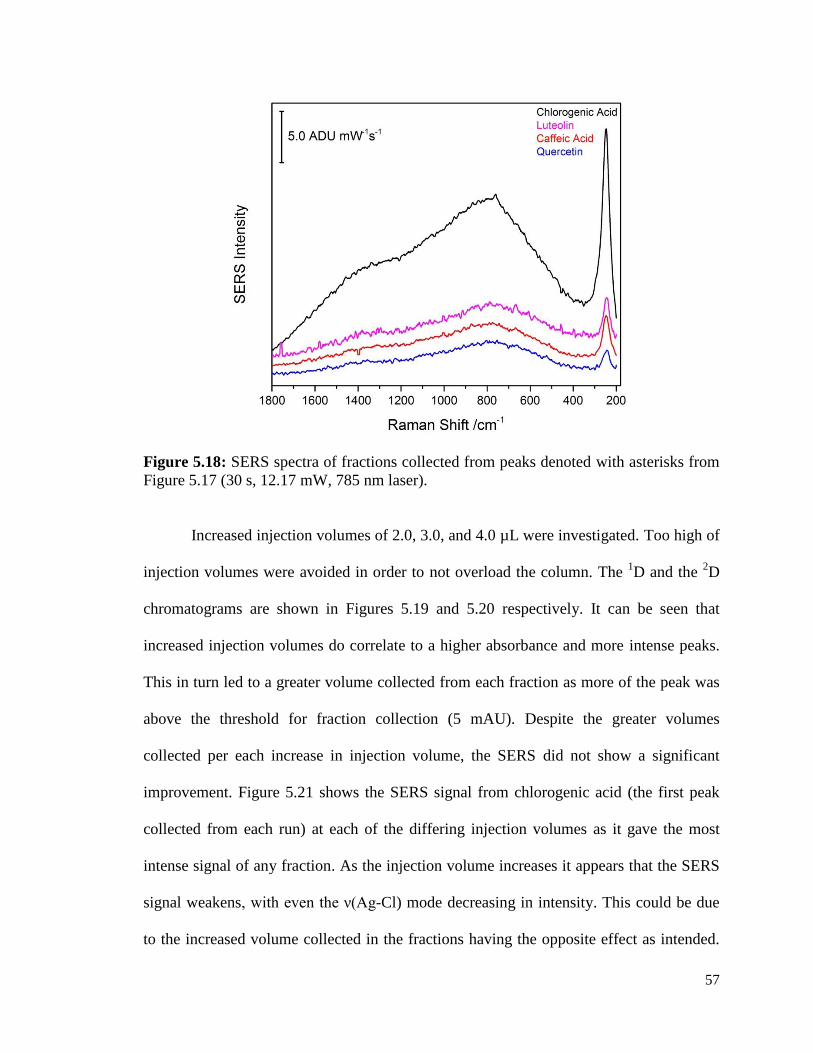
57
Figure 5.18: SERS spectra of fractions collected from peaks denoted with asterisks from
Figure 5.17 (30 s, 12.17 mW, 785 nm laser).
Increased injection volumes of 2.0, 3.0, and 4.0 µL were investigated. Too high of
injection volumes were avoided in order to not overload the column. The 1D and the
2D
chromatograms are shown in Figures 5.19 and 5.20 respectively. It can be seen that
increased injection volumes do correlate to a higher absorbance and more intense peaks.
This in turn led to a greater volume collected from each fraction as more of the peak was
above the threshold for fraction collection (5 mAU). Despite the greater volumes
collected per each increase in injection volume, the SERS did not show a significant
improvement. Figure 5.21 shows the SERS signal from chlorogenic acid (the first peak
collected from each run) at each of the differing injection volumes as it gave the most
intense signal of any fraction. As the injection volume increases it appears that the SERS
signal weakens, with even the ν(Ag-Cl) mode decreasing in intensity. This could be due
to the increased volume collected in the fractions having the opposite effect as intended.
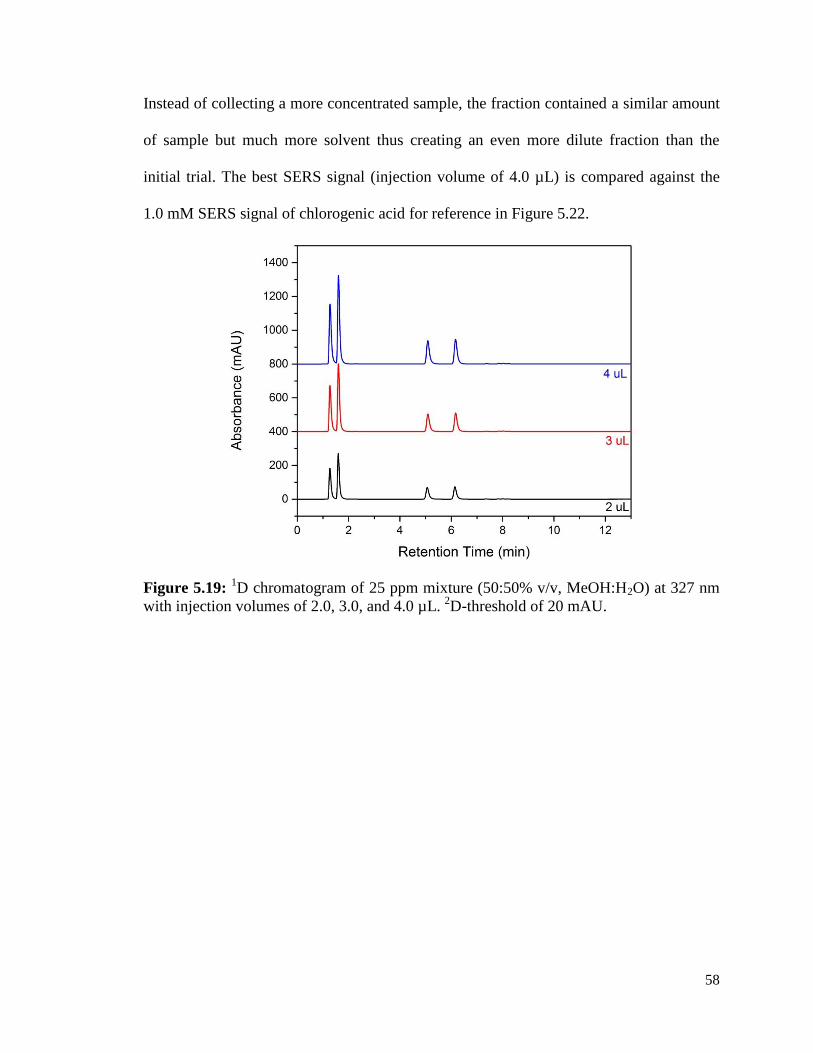
58
Instead of collecting a more concentrated sample, the fraction contained a similar amount
of sample but much more solvent thus creating an even more dilute fraction than the
initial trial. The best SERS signal (injection volume of 4.0 µL) is compared against the
1.0 mM SERS signal of chlorogenic acid for reference in Figure 5.22.
Figure 5.19: 1D chromatogram of 25 ppm mixture (50:50% v/v, MeOH:H2O) at 327 nm
with injection volumes of 2.0, 3.0, and 4.0 µL. 2D-threshold of 20 mAU.

59
Figure 5.20: 2D chromatogram of 25 ppm mixture (50:50% v/v, MeOH:H2O) at 327 nm
with injection volumes of 2.0, 3.0, and 4.0 µL. Fraction collection threshold of 5.0 mAU.
Figure 5.21: SERS spectra of fractions collected from the first peak (chlorogenic acid) of
each injection volume from Figure 5.20 (30 s, 12.17 mW, 785 nm laser).
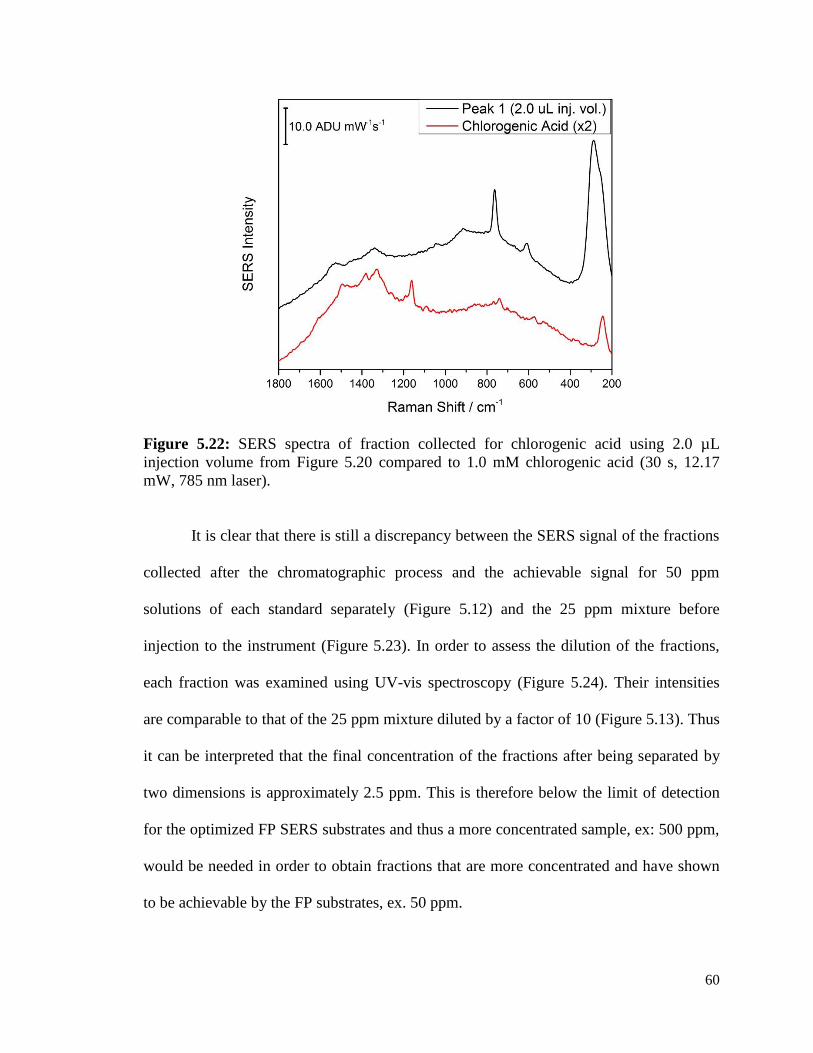
60
Figure 5.22: SERS spectra of fraction collected for chlorogenic acid using 2.0 µL
injection volume from Figure 5.20 compared to 1.0 mM chlorogenic acid (30 s, 12.17
mW, 785 nm laser).
It is clear that there is still a discrepancy between the SERS signal of the fractions
collected after the chromatographic process and the achievable signal for 50 ppm
solutions of each standard separately (Figure 5.12) and the 25 ppm mixture before
injection to the instrument (Figure 5.23). In order to assess the dilution of the fractions,
each fraction was examined using UV-vis spectroscopy (Figure 5.24). Their intensities
are comparable to that of the 25 ppm mixture diluted by a factor of 10 (Figure 5.13). Thus
it can be interpreted that the final concentration of the fractions after being separated by
two dimensions is approximately 2.5 ppm. This is therefore below the limit of detection
for the optimized FP SERS substrates and thus a more concentrated sample, ex: 500 ppm,
would be needed in order to obtain fractions that are more concentrated and have shown
to be achievable by the FP substrates, ex. 50 ppm.
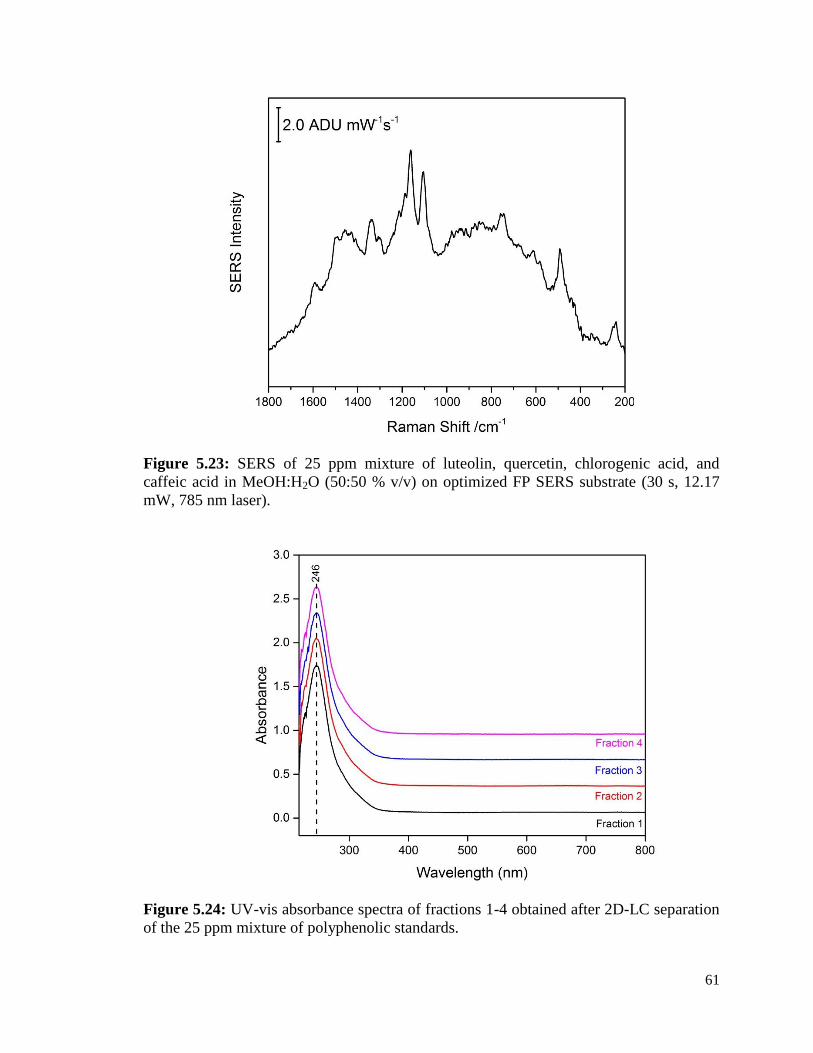
61
Figure 5.23: SERS of 25 ppm mixture of luteolin, quercetin, chlorogenic acid, and
caffeic acid in MeOH:H2O (50:50 % v/v) on optimized FP SERS substrate (30 s, 12.17
mW, 785 nm laser).
Figure 5.24: UV-vis absorbance spectra of fractions 1-4 obtained after 2D-LC separation
of the 25 ppm mixture of polyphenolic standards.

62
5.6 Discussion
This thesis successfully created an optimized 3D SERS substrate for the detection
of polyphenolic compounds. Filter paper (FP) was used as a more sustainable and cost-
effective alternative to conventional 2D substrates and proved to provide consistent and
reliable data. Signal, however, was only obtained using FP substrates once a series of
surface treatments were performed. A KCl treatment was used to displace citrate ions
from the nanoparticle surface. This allows the analyte closer access to the surface and
thus it could benefit from the SERS enhancement. A surface treatment technique using
pyridine (pyr) was also shown to be vital for the detection of polyphenols. Through EC-
SERS investigations, pyr was discovered to be present in a planar orientation to the
surface. This is an important discovery as it provides an explanation for the analyte SERS
enhancement observed when pyr is present. In a planar orientation, both the lone pair of
electrons on the nitrogen atom and the double bond nature of the pyridine ring are able to
interact with the analyte molecules and draw them closer to the surface due to hydrogen
bonding and van der Waals interactions respectively. The optimised FP SERS substrate
was able to detect concentrations of pure polyphenolic compounds down to 50 ppm, and a
mixture of 4 (luteolin, quercetin, chlorogenic acid, and caffeic acid) down to a
concentration of 25 ppm.
Optimised methodologies were developed for both 1D and 2D-LC separation of a
simple polyphenolic mixture. After separation in the 2D, fractions of the separated
components were collected and subsequently analysed using SERS. It is important to
highlight that this offline SERS detection for 2D-LC technique is the first of its kind
performed. Despite showing great promise, the SERS detection yielded no useful signal.
It was theorised that the final concentration of the fractions was too dilute to be measured
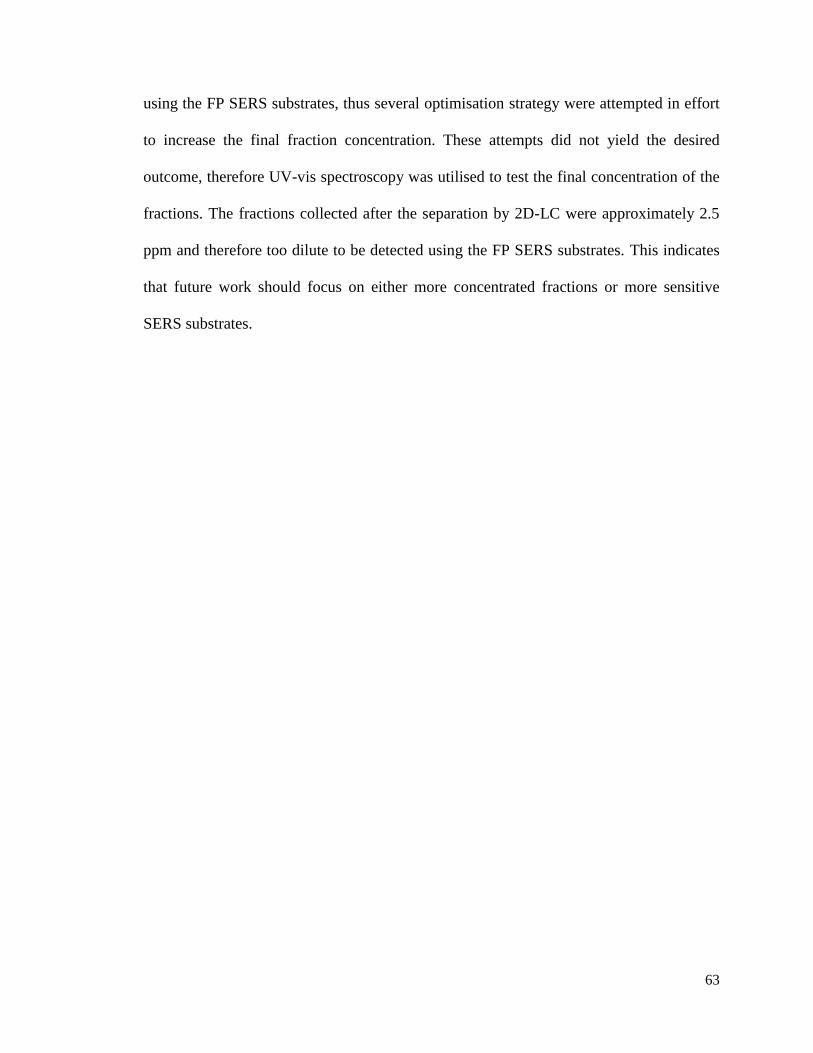
63
using the FP SERS substrates, thus several optimisation strategy were attempted in effort
to increase the final fraction concentration. These attempts did not yield the desired
outcome, therefore UV-vis spectroscopy was utilised to test the final concentration of the
fractions. The fractions collected after the separation by 2D-LC were approximately 2.5
ppm and therefore too dilute to be detected using the FP SERS substrates. This indicates
that future work should focus on either more concentrated fractions or more sensitive
SERS substrates.
64
Chapter 6: Conclusions and Future Work
6.1 Conclusions
This thesis work successfully optimized filter paper (FP) substrates for the
surface-enhanced Raman spectroscopy (SERS) detection of polyphenolic compounds.
This included the surface treatments with potassium chloride (KCl) and pyridine (pyr)
solutions. KCl was able to displace citrate from the surface to have enhanced SERS signal
of analytes. Pyr functionalization proved to be essential to the SERS substrates but its role
was previously unknown. Through electrochemical SERS (EC-SERS) measurements to
manipulate the molecular orientation, it was discovered that pyr assumes a planar
orientation on the surface with no applied potential, and only once a negative potential
was applied did it adopt a perpendicular arrangement on the surface. This provided
insight on the surface functionalization as the polyphenolic compounds would be drawn
to the substrate surface through strong van der Waals interactions and thus be able to
benefit from the SERS enhancement. In a sense, the pyr layer acts as a “carpet” for the
polyphenols to adsorb onto. As a result, this thesis work provides a new strategy for
efficient SERS detection of polyphenols and offers insight into the most likely reason for
improved SERS signal using this strategy.
This thesis work was also the first known attempt to combine multidimensional
liquid chromatography with surface-enhanced Raman spectroscopy (2D-LC-SERS) as an
offline detector for phenolic acids. An optimised 2D-LC method was created for the
separation of polyphenols, and this method successfully separated mixtures of four
polyphenolic compounds in multiple dimensions and fractions were able to be collected.
After a second dimension separation, SERS was applied as an offline characterization
tool by depositing the collected fractions onto the FP substrates. Detection of a SERS
65
signal for the polyphenols proved to be challenging and several strategies to try and
enhance the signal were explored. This included increasing the volume of standard
injected onto the column, and exploring the extent to which the sample was being diluted
throughout the chromatographic process. Although no identifiable SERS signal was able
to be obtained, this work shows promise for future endeavours into this novel coupling of
chromatographic and spectroscopic techniques.
6.2 Future Work
In the future, more trials of the 2D-LC-SERS detection need to be completed. A
more concentrated mixture of 500 ppm should also be separated to determine if the lack
of SERS signal is indeed due to the diluted nature of the collected fractions. In addition, it
has been noted in literature that LC methods that use acetonitrile may mask the SERS
signal58
; therefore another option would be to replace the second dimension mobile phase
B with an alternate solvent. SERS signal of fractions collected from any new method can
then be compared to the results in this thesis work.
Once a clear and reproducible approach for 2D-LC-SERS has been found, it
should be applied to real world samples. Natural extracts that are high in polyphenolic
content such as green tea, berries, and wines extracts could be separated with 2D-LC-
SERS and compared to literature values to aid in the discovery of new compounds and
expand literature on the exacts components of the extracts. In addition, creation of a
spectral library of known polyphenolic compounds would be helpful for the rapid
identification of unknown substances in the natural extracts.
66
References
(1) Stoll, D. R.; Carr, P. W. Anal. Chem. 2017, 89 (1), 519–531.
(2) Carr, P. W.; Stoll, D. R. Agil. Tech. Note 2015, 1–163.
(3) Donovan, J. L.; Manach, C.; Faulks, R. M.; Kroon, P. A. Crozier, A., Clifford, M.
N., Ashihara, H., Eds.; Blackwell Publishing: Oxford, 2006; p 372.
(4) Merken, H. M.; Beecher, G. R. J. Agric. Food Chem. 2000, 48 (3), 577–599.
(5) Kittlaus, S.; Schimanke, J.; Kempe, G.; Speer, K. J. Chromatogr. A 2013, 1283,
98–109.
(6) Qiu, S.; Yang, W. Z.; Shi, X. J.; Yao, C. L.; Yang, M.; Liu, X.; Jiang, B. H.; Wu,
W. Y.; Guo, D. A. Anal. Chim. Acta 2015, 893, 65–76.
(7) Wang, J.; Xu, Y.; Wen, C.; Wang, Z. Anal. Chim. Acta 2017, 992, 42–54.
(8) Cowcher, D. P.; Jarvis, R.; Goodacre, R. Anal. Chem. 2014, 86 (19), 9977–9984.
(9) Nguyen, A. H.; Deutsch, J. M.; Xiao, L.; Schultz, Z. D. Anal. Chem. 2018, 11062–
11069.
(10) Editorial. Nat. Chem. Biol. 2007, 3 (7), 351.
(11) Crozier, A.; Jaganath, I.; Clifford, M. Phenols, Polyphenols and Tannins: An
Overview; 2007.
(12) Diaconeasa, Z.; Florica, R.; Rugina, D.; Lucian, C.; Socaciu, C. J. Food Nutr. Res.
2014, 2 (11), 781–785.
(13) Panche, A. N.; Diwan, A. D.; Chandra, S. R. J. Nutr. Sci. 2016, 5.
(14) Mandal, S. M.; Chakraborty, D. In Natural Products: Phytochemistry, Botany and
Metabolism of Alkaloids, Phenolics and Terpenes; Ramawat, K. G., Mérillon, J.-
M., Eds.; Springer Berlin Heidelberg: Berlin, Heidelberg, 2013; pp 2047–2059.
(15) Choi, J. M.; Hahm, E.; Park, K.; Jeong, D.; Rho, W.-Y.; Kim, J.; Jeong, D. H.; Lee,

67
Y.-S.; Jhang, S. H.; Chung, H. J.; Cho, E.; Yu, J.-H.; Jun, B.-H.; Jung, S.
Nanomaterials 2017, 7, 8.
(16) Rao, Y.; Zhao, X.; Li, Z.; Huang, J. Talanta 2018, 190, 174–181.
(17) Jurasekova, Z.; Domingo, C.; Garcia-Ramos, J. V; Sanchez-Cortes, S. J. Raman
Spectrosc. 2012, 43 (12), 1913–1919.
(18) Hu, C.; Kitts, D. D. J. Agric. Food Chem. 2003, 51 (1), 301–310.
(19) Crozier, A.; Yokota, T.; Jaganath, I. B.; Marks, S.; Saltmarsh, M.; Clifford, M. N.
Secondary Metabolites in Fruits, Vegetables, Beverages and Other Plant-based
Dietary Components In Plant Secondary Metabolites; Crozier, A., Clifford, M.N.,
Ashihara, H., Ed.; Blackwell: Oxford, 2006; pp 208-302.
(20) Hernández-Borges, J.; González-Hernández, G.; Borges-Miquel, T.; Rodríguez-
Delgado, M. A. Food Chem. 2005, 91 (1), 105–111.
(21) Hasegawa, S.; Berhow, M. A.; Fong, C. H. In Fruit Analysis; Linskens, H. F.,
Jackson, J. F., Eds.; Springer: Berlin, Heidelberg, 1995; pp 59–80.
(22) Dolowy, M.; Pyka, A. Biomed. Chromatogr. 2014, 28 (1), 84–101.
(23) Beni, Á.; Lajtha, K.; Kozma, J.; Fekete, I. J. Microbiol. Methods 2017, 136, 1–5.
(24) Thieme, D.; Sachs, H. Anal. Chim. Acta 2003, 492 (1–2), 171–186.
(25) Nováková, L.; Matysová, L.; Solich, P. Talanta 2006, 68 (3), 908–918.
(26) HPLC in Nucleic Acid Research: Methods and Applications; Brown, P. R., Ed.;
Marcel Dekker, INC.: New York, 1984.
(27) McMaster, M. C. HPLC: A Practical User’s Guide, 2nd ed.; John Wiley & Sons,
Inc.: Hoboken, New Jersey, 2007.
(28) Guillarme, D.; Veuthey, J. L. UHPLC in Life Sciences; RSC Chromatography
Monographs; Royal Society of Chemistry, 2015.

68
(29) Skoog, D. A.; West, D. M.; Holler, F. J.; Crouch, Stanley, R. Fundamentals of
Analytical Chemistry; Brooks/Cole Cengage learning: Belmont, CA, 2004; pp
973–995.
(30) De Villiers, A.; Venter, P.; Pasch, H. J. Chromatogr. A 2015, 1430, 16–78.
(31) Martínez-Cruz, O.; Paredes-López, O. J. Chromatogr. A 2014, 1346, 43-48.
(32) Andreu‐Navarro, A.; Fernández‐Romero, J. M.; Gómez‐Hens, A. J. Sep. Sci. 2010,
33 (4‐5), 509–515.
(33) Kalili, K. M.; De Villiers, A. J. Sep. Sci. 2010, 33 (6‐7), 853–863.
(34) Biesaga, M.; Ochnik, U.; Pyrzynska, K. J. Sep. Sci. 2009, 32 (15‐16), 2835–2840.
(35) Silva, C. L.; Pereira, J.; Wouter, V. G.; Giró, C.; Câmara, J. S. Talanta 2011, 86
(1), 82–90.
(36) Aznar, O.; Checa, A.; Oliver, R.; Hernandez-Cassou, S.; Saurina, J. J. Sep. Sci.
2011, 34 (5), 527–535.
(37) Qiao, X.; Song, W.; Ji, S.; Wang, Q.; Guo, D.; Ye, M. J. Chromatogr. A 2015,
1402, 36–45.
(38) Giddings, J. C. J. High Resolut. Chromatogr. 1987, 10, 319–323.
(39) Davis, J. M.; Giddings, J. C. Anal. Chem. 1983, 55 (3), 418–424.
(40) Giddings, J. C. Anal. Chem. 1984, 56 (12), 1258A–1270A.
(41) Li, Z.; Chen, K.; Guo, M.; Tang, D. J. Sep. Sci. 2016, 39 (1), 21–37.
(42) Pierce, K. M.; Kehimkar, B.; Marney, L. C.; Hoggard, J. C.; Synovec, R. E. J.
Chromatogr. A 2012, 1255, 3–11.
(43) Whitworth, R. Anal. Sci. Agil. Technol. 2014, 1–26.
(44) Scoparo, C. T.; de Souza, L. M.; Dartora, N.; Sassaki, G. L.; Gorin, P. A. J.;

69
Iacomini, M. J. Chromatogr. A 2012, 1222, 29-37.
(45) Kalili, K. M.; Vestner, J.; Stander, M. A.; de Villiers, A. Anal. Chem. 2013, 85
(19), 9107-9115.
(46) Qiao, X.; Song, W.; Ji, S.; Li, Y.-J.; Wang, Y.; Li, R.; An, R.; Guo, D.; Ye, M. J.
Chromatogr. A 2014, 1362, 157–167.
(47) Jeanmaire, D. L.; Van Duyne, R. P. J. Electroanal. Chem. Interfacial Electrochem.
1977, 84 (1), 1–20.
(48) Fleischmann, M.; Hendra, P. J.; McQuillan, A. J. Chem. Phys. Lett. 1974, 26 (2),
163–166.
(49) Creighton, J. A.; Albrecht, M. G.; Hester, R. E.; Matthew, J. A. D. Chem. Phys.
Lett. 1978, 55 (1), 55–58.
(50) Cañamares, M. V.; Reagan, D. A.; Lombardi, J. R.; Leona, M. J. Raman Spectrosc.
2014, 45 (11–12), 1147–1152.
(51) Willets, K. A.; Duyne, R. P. Van. Annu. Rev. Phys. Chem. 2007, 58, 267–297.
(52) Heaps, D. A.; Griffiths, P. R. Appl. Spectrosc. 2005, 59 (11), 1305–1309.
(53) Zhu, Q.; Cao, Y.; Cao, Y.; Chai, Y.; Lu, F. Anal. Bioanal. Chem. 2014, 406 (7),
1877–1884.
(54) Huang, R.; Han, S.; Li, X. S. Anal. Bioanal. Chem. 2013, 405 (21), 6815-6822.
(55) Carron, K.; Kennedy, B. Anal. Chem. 1995, 67 (18), 3353–3356.
(56) Roth, E.; Kiefer, W. Appl. Spectrosc. 1994, 48, 1193–1195.
(57) Riordan, C. M.; Jacobs, K. T.; Negri, P.; Schultz, Z. D. Faraday Discuss. 2016,
187, 473–484.
(58) Trachta, G.; Schwarze, B.; Sägmüller, B.; Brehm, G.; Schneider, S. J. Mol. Struct.
2004, 693 (1–3), 175–185.

70
(59) Zhang, L.; Zhou, L.; Ji, W.; Song, W.; Zhao, S. Food Anal. Methods 2017, 10 (6),
1940–1947.
(60) Lee, C. H.; Hankus, M. E.; Tian, L.; Pellegrino, P. M.; Singamaneni, S. Anal.
Chem. 2011, 83 (23), 8953–8958.
(61) Wang, C.; Liu, B.; Dou, X. Sensors Actuators B Chem. 2016, 231, 357–364.
(62) Kleinman, S. L.; Frontiera, R. R.; Henry, A. I.; Dieringer, J. A.; Van Duyne, R. P.
Phys. Chem. Chem. Phys. 2013, 15 (1), 21–36.
(63) Meyer, V. R. Practical High-Performance Liquid Chromatography, Fourth.; John
Wiley & Sons, Inc.: Hoboken, New Jersey, 2004.
(64) Manz, A.; Dittrich, P. S.; Pamme, N.; Iossifidis, D. Bioanalytical Chemistry:
Second Edition; Imperial College Press, 2015.
(65) Stoll, D. R. In Handbook of Advanced Chromatography/Mass Spectrometry
Techniques; Holcapek, M., Byrdwell, W. C., Eds.; Academic Press and AOCS
Press: London, 2017; pp 227–286.
(66) Wei, A. In Nanoparticles: Building Blocks for Nanotechnology; Rotello, V., Ed.;
Kluwer Academic/ Plenum Publishers: New York, 2011; pp 173–200.
(67) Rycenga, M.; Cobley, C. M.; Zeng, J.; Li, W.; Moran, C. H.; Zhang, Q.; Qin, D.;
Xia, Y. Chem. Rev. 2011, 111 (6), 3669–3712.
(68) Kelly, K. L.; Coronado, E.; Zhao, L. L.; Schatz, G. C. J. Phys. Chem. B 2003, 107
(3), 668–677.
(69) Ferraro, J. R.; Nakamoto, K. Introductory Raman Spectroscopy; Academic Press,
Inc.: San Diego, 1994.
(70) Pelletier, M. J. Analytical Applications of Raman Spectroscopy; Pelletier, M. J.,
Ed.; Blackwell Science Ltd.: Oxford, 1999.
71
(71) Bantz, K. C.; Meyer, A. F.; Wittenberg, N. J.; Im, H.; Kurtulus, O.; Lee, S. H.;
Lindquist, N. C.; Oh, S.-H.; Haynes, C. L. 2011, 13 (24), 11551–11567.
(72) Kneipp, K.; Kneipp, H.; Itzkan, I.; Dasari, R. R.; Feld, M. S. J. Physics-Condensed
Matter 2002, 14 (18), R597–R624.
(73) Kennedy, B. J.; Spaeth, S.; Dickey, M.; Carron, K. T. J. Phys. Chem. B 1999, 103
(18), 3640–3646.
(74) Wang, J. Analytical Electrochemistry, 2nd ed.; Wiley-VCH: New York, 2000.
(75) Bard, A. J.; Faulkner, L. R. Electrochemical methods: Fundamentals and
applications, 2nd ed.; John Wiley & Sons, Inc.: New York, 2001.
(76) Zhao, L.; Blackburn, J.; Brosseau, C. L. Anal. Chem. 2015, 87 (1), 441–447.
(77) Greene, B. H. C.; Alhatab, D. S.; Pye, C. C.; Brosseau, C. L. J. Phys. Chem. C
2017, 121 (14), 8084–8090.
(78) Lynk, T. P.; Clarke, O. J. R.; Kesavan, N.; Brosseau, C. L. Sensors Actuators B
Chem. 2018, 257, 270–277.
(79) De Bleye, C.; Dumont, E.; Hubert, C.; Sacré, P. Y.; Netchacovitch, L.; Chavez, P.
F.; Hubert, P.; Ziemons, E. Anal. Chim. Acta 2015, 888, 118–125.
(80) Alstrom. Laboratory products catalog. 2016, p 28.
(81) Pan, T.; Sun, D.-W.; Pu, H.; Wei, Q. J. Agric. Food Chem. 2018, 66 (9), 2180–
2187.
(82) Saito, H. Bull. Chem. Soc. Jpn. 1993, 66 (3), 963–965.
(83) Jeanmaire, D. L.; Van Duyne, R. P. Journal of Electroanalytical Chemistry and
Interfacial Electrochemistry. 1977, pp 1–20.
(84) Greenler, R. G.; Snider, D. R.; Witt, D.; Sorbello, R. S. Surf. Sci. 1982, 118 (3),
415–428.

72
(85) Moskovits, M.; Suh, J. S. J. Phys. Chem. 1984, 88 (23), 5526–5530.
(86) Sun, S. C.; Bernard, I.; Birke, R. L.; Lombardi, J. R. J. Electroanal. Chem.
Interfacial Electrochem. 1985, 196 (2), 359–374.
(87) Jurasekova, Z.; Torreggiani, A.; Tamba, M.; Sanchez-Cortes, S.; Garcia-Ramos, J.
V. J. Mol. Struct. 2009, 918 (1–3), 129–137.
(88) Sánchez-Cortés, S.; García-Ramos, J. V. Appl. Spectrosc. 2000, 54 (2), 230–238.
(89) Jurasekova, Z.; Garcia‐Ramos, J. V; Domingo, C.; Sanchez‐Cortes, S. J. Raman
Spectrosc. 2006, 37 (11), 1239–1241.
(90) Maiti, N.; Kapoor, S.; Mukherjee, T. Adv. Mater. Lett. 2013, 4 (6), 502–506.

73
Appendix
Figure A.1: 1D chromatograms for 100 ppm (50:50% v/v, MeOH:H2O) solutions of
luteolin, quercetin, chlorogenic acid, and caffeic acid at 327 nm with retention times
stated above each main peak.

74
Figure A.2: SERS spectra of 1.0 mM luteolin on KCl treated FP substrates using pyr
(red) and pyz (black) as surface functionalization molecules.