Development of Mechanically Tailored Gelatin-Chondroitin Sulphate Hydrogel Films

Available online at www.sciencedirect.com
ScienceDirect
Journal of the European Ceramic Society 35 (2015) 631–640
Design of alumina-zirconia composites with spatially tailored
strength and toughness
Yunfei Chang a, Raul Bermejo b, Oldrich Sevecek c, Gary L. Messing a,∗
a Department of Materials Science and Engineering, Pennsylvania State University, University Park, PA, 16802, United Statesb Institut für Struktur-und Funktionskeramik, Montanuniversität Leoben, Leoben, Austria
c Institute of Solid Mechanics, Mechatronics and Biomechanics, Brno University of Technology, Brno, Czech Republic
Received 16 July 2014; received in revised form 3 September 2014; accepted 9 September 2014
Available online 27 September 2014
Abstract
Composites of Al2O3–5 vol.% t-ZrO2 (ATZ) and Al2O3–30 vol.% m-ZrO2 (AMZ) layers were designed with 3–1 connectivity to explore the effect
of spatially-dependent residual stress and layer distribution on mechanical behavior. ATZ composites with ‘shallow’ and ‘deep’ regions of AMZ,
defined relative to the distance from the surface, were fabricated. Four-point bending tests on indented 3–1 composites showed crack arrest in the
first compressive AMZ layer and a fracture strength nearly independent of indent size (i.e. minimum strength); the failure occurring in the region
with thicker outer ATZ layers (‘deep’ region). Region dependent crack growth resistance was measured on SEVNB specimens and compared
to theoretical predictions using a fracture mechanics model. Spatially tailored constant strengths were obtained, ranging between 148 MPa and
470 MPa; the maximum value corresponding to a ‘shallow’ region with a relatively thicker AMZ compressive layer embedded close to the tensile
ATZ surface. The 3–1 design concept allows the fabrication of ‘deep’ and ‘shallow’ embedded regions within a unique composite architecture,
thus providing a preferential path for crack propagation, opening new possibilities for design of composite structures with spatially-tailored crack
growth resistance.
© 2014 Elsevier Ltd. All rights reserved.
Keywords: Connectivity; Composites; Residual stresses; Fracture strength; Toughness
1. Introduction
The variable strength in brittle materials such as glasses
and ceramics is related to the different size of critical defects,
from specimen to specimen, introduced during processing, from
machining or occurring in service. The strength cannot be char-
acterized as a single value but as a distribution function, which
is related to the defect size distribution in the material.1 Increas-
ing strength in glasses and ceramics can be attained by reducing
the size of critical defects (e.g. through colloidal processing)2 or
introducing surface compressive residual stresses (e.g. strength-
ening in glass)3,4 to enhance the resistance of the material to
∗ Corresponding author. Tel.: +01 814 865 2262; fax: +01 814 865 8262.
E-mail addresses: [email protected], [email protected]
(G.L. Messing).
crack propagation. However, significant reduction of strength
variability may not be achieved. Rather than reducing critical
flaw size, a “flaw-tolerant” approach has been developed to build
ceramic composites by combining layers of two different materi-
als/microstructures in a periodic architecture with 2–2 multilayer
connectivityd.5–13 Two main approaches regarding the fracture
energy of the layer interfaces are particularly useful, which aim
to generate “weak” or “strong” interfaces. In particular, 2–2
layered composites designed with strong interfaces can present
enhanced mechanical behavior through microstructural design
d Connectivity is defined as the number of dimensions in which each com-
ponent (e.g. material or microstructure) is self-connected.5 In two-component
composites, a 2–2 composite is one in which both components are self-connected
in two dimensions, i.e. a laminate. More details on the connectivity and its
schematic illustration are available in the supplemental file.
http://dx.doi.org/10.1016/j.jeurceramsoc.2014.09.017
0955-2219/© 2014 Elsevier Ltd. All rights reserved.

632 Y. Chang et al. / Journal of the European Ceramic Society 35 (2015) 631–640
(e.g. grain size, layer composition) and/or due to the presence of
compressive residual stresses, acting as a barrier to crack propa-
gation. Under certain conditions, the compressive stresses may
arrest the propagation of surface cracks, yielding a so-called
“threshold strength”, i.e. a minimum stress level below which
failure does not occur despite the presence of relatively large
cracks.
Threshold strength was first reported for alumina-mullite lay-
ered composites, where the propagation of indentation cracks
under bending was arrested between two compressive layers.14
The concept of designing ceramics with a “minimum strength”
was further extended to other alumina-based 2–2 layered com-
posites (e.g. alumina–Si3N4, alumina–zirconia) under different
loading configurations.7,8,10,11 In alumina–zirconia systems,
high compressive stresses in the embedded layers are devel-
oped during cooling from the sintering temperature because of
the differences in thermal expansion coefficients between lay-
ers of different composition.15 The profile of the tensile and
compressive stresses can be tailored by combinations of com-
position, stacking sequence and layer thickness.7,10,15–17 Recent
advances in fracture mechanics modeling have shown that an
optimized non-periodic 2–2 layered architecture can result in
pronounced crack growth resistance and minimum strength
using thin outer tensile layers and thicker internal compres-
sive layers.18 Although much progress has been achieved in
improving the resistance to crack propagation in 2–2 multilayer
composites, the potential of complex architectural design has not
been sufficiently exploited or explored. This is very important
because spatial control and composite connectivity of the indi-
vidual layers of a composite are ultimately the key to developing
and controlling useful and unique properties.
From the functional point of view, the dependence of prop-
erties on connectivity is especially pronounced in ceramic
components that are fabricated with complex connectivities for
piezoelectric transducer, magnetic field sensor, low temperature
co-fired electronic package and solid oxide fuel cell applications
etc.5,19–22 However, from the structural integrity point of view,
residual stresses related to the combination of different mate-
rials (e.g. metal electrodes, ceramic parts) may initiate cracks,
which can propagate during service and reduce the component
functionality.23 The development of structural composites with
various connectivities (e.g. 3–1, 1–1) in three-dimensional struc-
tures might allow access to unique mechanical properties never
before achieved in 2–2 composites. To our knowledge, few stud-
ies focused on designing and understanding the properties of
structural composites with such higher levels of complexity are
available in the literature.
In this work, we explore novel 3–1 connected composites to
understand how this connectivity can be used to affect the resis-
tance to crack propagation and fracture behavior in a ceramic
composite. Alumina–zirconia was chosen as the model system
due to its highly useful mechanical properties that warrant fur-
ther exploration. Four types of 3–1 connected alumina–zirconia
based composites with ‘shallow’ and ‘deep’ regions, defined rel-
ative to the distance of the embedded compressive layers from
the surface, were fabricated. Crack propagation was investigated
by four-point bending of indented 3–1 specimens and compared
to that of 2–2 composites. The effects of location and thickness
of the embedded compressive layers on the fracture strength
and fracture toughness of 3–1 composites were determined.
A fracture mechanics model, based on a weight function analy-
sis, was implemented to interpret the results.
2. Experimental
The 3–1 connected alumina–zirconia composites consist
of two components: layers of 95 vol% alumina and 5 vol%
Y2O3-stabilized zirconia (ATZ), and embedded layers of
70 vol% alumina and 30 vol% monoclinic zirconia (AMZ). In
3–1 connected alumina–zirconia composites, ATZ and AMZ
components are self-connected in three and one dimensions,
respectively. The addition of 5 vol% tetragonal zirconia in ATZ
has the effect of limiting alumina grain growth during sinter-
ing. The 30 vol% of monoclinic zirconia was used in the AMZ
layers to generate a large strain mismatch between the AMZ
and ATZ layers as a result of the ∼5% volume change dur-
ing the tetragonal-monoclinic transformation at ∼730 ◦C upon
cooling,24 and thus induce a high residual compressive stress
when embedded in the ATZ matrix.24,25
The composite was assembled with a symmetric and
non-periodic distribution of the embedded AMZ layers. The
symmetric architecture of the composite avoids warpage dur-
ing sintering. The non-periodic design enables the distribution
of layers at different locations and depths within a particular
region, while having a constant total volume ratio between the
two materials. The design and properties of the four types of
composites, including the AMZ layer thicknesses (tAMZ) and
the corresponding first layer thickness ratios (t1stATZ:t1st
AMZ),
are shown in Fig. 1 and listed in Table 1. The total volume ratio of
ATZ:AMZ materials is 12.0 ± 0.2 for all 3–1 composites stud-
ied. Two main regions can be defined in each 3–1 composite,
hereinafter referred to ‘shallow’ and ‘deep’ regions, associated
with the distance (t1stATZ) from the surface to the first AMZ
embedded layer. The nomenclature used for the four types of
3–1 composites is AF, BE, CD and GH, where the regions
A, B, C, D, E, F, G and H correspond to depths (t1stATZ) of
1222 �m, 802 �m, 458 �m, 382 �m, 382 �m, 382 �m, 382 �m
and 150 �m for the first AMZ embedded layers, respectively.
The AMZ layer is 75 �m thick in all cases except for GH where
the AMZ layers are 150 �m thick in region H.
2.1. Fabrication of 3–1 alumina–zirconia composites
Composites were produced from 0.28 �m �-Al2O3 powders
(AKP50, Sumitomo Chemical Co. Ltd., Tokyo, Japan), 0.60 �m
yttria stabilized zirconia powder (TZ-3Y, Tosoh, Yamaguchi,
Japan), and 0.30 �m monoclinic zirconia powder (TZ-0, Tosoh,
Yamaguchi, Japan). The ATZ and AMZ tape casting slurries
were prepared by ball milling the powders for 48 h in a 50:50
(weight ratio) xylenes ± ethanol solution containing blown men-
haden fish oil. Binder and plasticizers (polyvinyl butyral, butyl
benzyl phthalate, and polyalkylene glycol) were then added,
followed by an additional 24 h milling/mixing step.26

Y. Chang et al. / Journal of the European Ceramic Society 35 (2015) 631–640 633
Fig. 1. Schematics of the four types of 3–1 composites (xz plane) studied.
Table 1
Properties of 3–1 composites with an ATZ:AMZ volume ratio of 12.0 ± 0.2 as a function of AMZ layer location and thickness.
Composite Region tAMZ (�m) t1stATZ:t1st
AMZ σf (MPa) Kapt (MPa m1/2) Kmax# (MPa m1/2)
AF A 75 16.3:1 – 2.7 ± 0.1 6.8
F 75 5.1:1 259 ± 4 10.1 ± 0.3 11.0
BE B 75 10.7:1 148 ± 3 6.4 ± 0.1 9.0
E 75 5.1:1 250 ± 9 9.5 ± 0.2 11.0
CD C 75 6.1:1 218 ± 4 8.0 ± 0.1 10.6
D 75 5.1:1 250 ± 9 9.4 ± 0.2 11.0
GH G 75 5.1:1 299 ± 13 11.0 ± 0.3 11.0
H 150 1.0:1 470 ± 8 – 17.6
# Maximum fracture toughness as predicted by the fracture mechanics model.
Single ATZ tapes were prepared by tape casting.26 The
ATZ and AMZ slurries were co-cast27,28 with the component
interfaces parallel to the length of the single tape. Each co-
cast tape was composed of three segments with the two outer
segments having the same composition. The cast and co-cast
tapes were dried, cut, and stacked to obtain the four types of
3–1 ATZ–AMZ composites shown in Fig. 1 and illustrated in
Fig. 2a for a BE composite. The stacked tapes were laminated at
75 ◦C and 20 MPa to fabricate the green composites. The binder
was removed by heating the composites in air at 0.2 ◦C/min to
600 ◦C for 3 h. After cold isostatic pressing at 200 MPa, green
composites were heated at 5 ◦C/min in air to 1550 ◦C and held
for 4 h. Composite plates of approximately 45 mm by 45 mm
by 3.9 mm were obtained for the four types of 3–1 composites
studied. An optical micrograph of the x–z plane of the 3–1 BE
composite and an SEM image of the interface between the ATZ
Fig. 2. BE type 3–1 composites: (a) schematic of stacking sequence, (b) optical micrograph of part of the xz plane, and (c) SEM image of the ATZ and AMZ interface.
634 Y. Chang et al. / Journal of the European Ceramic Society 35 (2015) 631–640
and AMZ components in the composite are shown in Figs. 2b
and c, respectively.
2.2. Residual stress determination
The differential thermal strain, �ε, between ATZ and AMZ
was estimated by thermomechanical analysis (TMA) of sin-
tered ATZ and AMZ monoliths using a differential dilatometer
(PT1000, Linseis GmbH, Selb, Germany). The thermal cycle
consisted of heating at 2 ◦C/min until 1250 ◦C, where the temper-
ature was held for around 20 min, followed by cooling to room
temperature at the same rate. Assuming 1200 ◦C as the reference
temperature, Tref, above which the composite is considered to be
stress-free, the corresponding coefficients of thermal expansion
(CTE) of ATZ and AMZ components are αATZ = 9.8 ± 0.1 ppm
and α AMZ= 8.0 ± 0.1 ppm between 25 ◦C and 1200 ◦C. The
lower average CTE of AMZ monolith is a consequence of the
compensating expansion of the phase transformation and ther-
mal contraction during cooling.
The residual stress distribution in the 3–1 composites was cal-
culated under plain strain conditions with a 2D parametric finite
element model (FEM) using ANSYS 14.0. Stresses calculated
in regions far from the junctions were compared with analytical
calculations corresponding to 2–2 ATZ–AMZ composites (far
from the free edges) in order to validate the model. The analyt-
ical calculation considers a homogeneous and biaxial residual
stress state in the interior of the layers. The stress magnitude
σres,i in layer i can be calculated as8
σres,i =Ei
1 − νi
(α − αi) �T (1)
where Ei, vi and αi are the elastic modulus, Poisson ratio and
CTE of the ith layer, respectively, and α is the average thermal
expansion coefficient for the composite. For a layered composite
consisting of A and B materials, α of the composite is given by18
α =
(
EAαA1−νA
×∑nA
i=1tA,i +EBαB1−νB
×∑nB
i=1tB,i
)
(
EA1−νA
×∑nA
i=1tA,i +EB
1−νB×
∑nBi=1tB,i
) (2)
where nA and nB are the numbers of layers of materials A and
B, respectively, and tA and tB are the thicknesses of the A and
B layers, respectively.
2.3. Indentation–strength test of 3–1 composites
The 3–1 composites were cut perpendicular to the y-direction
to obtain 3–1 bend bars (Fig. 3). To study the effects of the inner
compressive layer position and thickness on the fracture behav-
ior of the 3–1 composites, at least 48 bend bars of each type
of composites were prepared. One surface and one lateral face
of the bending bars were polished to a 3 �m finish, and the
other surface was ground. The following combinations of Vick-
ers indents were placed longitudinally on composite surfaces
with a separation distance of 2.5 mm to avoid crack interaction29:
(1) 20, 50, 100 N; (2) 20, 100, 50 N; (3) 50, 100, 20 N; (4) 50,
20, 100 N; (5) 100, 20, 50 N; (6) 100, 50, 20 N; (7) 50, 100,
Fig. 3. The orientation of the sample cuts for BE type 3–1 composite.
200 N; (8) 50, 200, 100 N; (9) 100, 50, 200 N; (10) 100, 200,
50 N (11) 200, 50, 100 N (12) 200, 100, 50 N (13) 20, 20, 20 N
(14) 50, 50, 50 N (15) 100, 100, 100 N; (16) 200, 200, 200 N.
For each combination of three indents noted above, the middle
indent was above the junction region, while the outer indents
were above the two different 2–2 regions and far from the junc-
tion region, respectively. In all cases, the set of three indents
was within the inner span used during four-point bending, and
thus under constant bending moment. Cracks emanating from
the corner of the indentations were measured with an optical
microscope. The pre-crack sizes c induced by the indentation
loads of 20 N, 50 N, 100 N, 200 N were (at the surface) approx-
imately 52 ± 3 �m, 98 ± 7 �m, 152 ± 9 �m and 243 ± 16 �m,
respectively. Based on earlier observations of indentation cracks
in ATZ layers of 2–2 composites,30 the crack-shape was assumed
to be semi-elliptical, with c/a ≈ 1.25; a being the crack depth.
All indented samples were fractured under four-point bending at
0.1 mm/min on a screw-driven universal testing machine (model
5866, Instron Ltd. Grove City, PA) at 25 ◦C and 40% relative
humidity. The fracture strength σf was determined according to
ASTM C-1161.31
The 2–2 composites were also fabricated for indentation-
strength measurements by cutting 3–1 composites perpendicular
to the x-direction (Fig. 3). The following combinations of Vick-
ers indents were placed longitudinally on each specimen surface:
(1) 20, 20, 20 N; (2) 50, 50, 50 N; (3) 100, 100, 100 N; (4)
200, 200, 200 N. The pre-crack sizes were similar to those mea-
sured in the 3–1 composites. All samples were fractured under
four-point bending at 0.1 mm/min.
2.4. Apparent fracture toughness assessment of 3–1
composites
The apparent fracture toughness Kapt was experimentally
determined using the Single Edge V-Notch Beam method
(SEVNB) specimens according to the ISO 23146 standard
procedure.32 A pre-notch, made with a thin high speed diamond
saw (150 �m thick blade), was sharpened with an automatic
razor blade machine to a radius of ≤10 �m to minimize the
influence of notch radius on KIc.33 Notched 3–1 bend bars were
loaded to fracture in four-point bending at 0.1 mm/min on a
screw-driven universal testing machine (model 5866, Instron
Ltd. Grove City, PA) at ambient conditions (i.e. 25 ◦C and 40%
relative humidity). The same procedure was conducted on the
2–2 composite bars. A total of eight specimens were tested for
each composite design.
Y. Chang et al. / Journal of the European Ceramic Society 35 (2015) 631–640 635
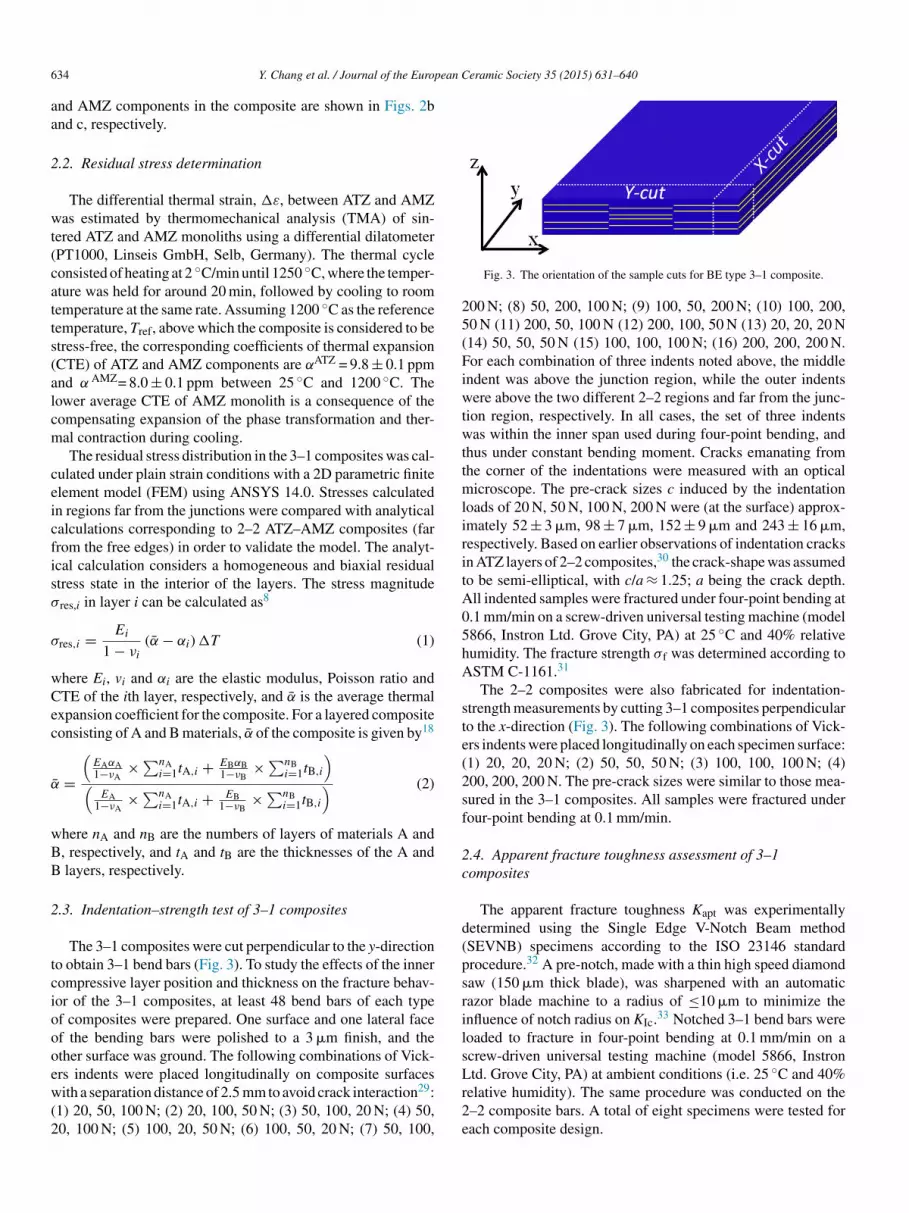
Fig. 4. Residual stress distribution (σxx in-plane and σzz out-of-plane) through the thickness of the BE 3–1 composite in region E, region B and junction BE. The
contour plot shows the stress distribution in the x-direction, indicating compressive and tensile stresses in the AMZ and ATZ materials, respectively.
3. Results and discussion
3.1. Residual stress profile in 3–1 composites
The predicted stress distribution in the 3–1 BE composite
is shown as an example in Fig. 4. The ATZ layers are under
a nominal (in-plane) constant tensile stress of +65 MPa, while
the embedded AMZ layers are under a constant (in-plane) com-
pressive stress of −720 MPa. The thermal expansion mismatch
between the ATZ and AMZ components also causes a residual
stress near the junction regions. The graphs in Fig. 4 represent
the in-plane and out-of-plane stresses (σxx parallel to the layer
plane, and σzz perpendicular to the layers) in the ATZ and AMZ
layers in region B, region E and junction BE, respectively. It can
be seen that the in-plane stresses in the ATZ and AMZ layers of
both regions are the same. In these two regions the stress perpen-
dicular to the layers, σzz, is negligible. However, the stresses in
the junction BE are different from those in the B and E regions.
The stress component parallel to the layers, σxx, in the junction is
negligible because there is no thermo-elastic material mismatch
along this path, whereas the tensile stress perpendicular to the
layers, σzz, reaches a maximum of +90 MPa. The “ruffle” seen
in the stress distribution in the junction region (Fig. 4) is associ-
ated with the alternating ATZ and AMZ layers in that region; the
maximum σzz value near the edge of the AMZ layers decreases
when entering the ATZ material.
A tensile stress of around 65 ± 2 MPa in the ATZ layers
and a compressive stress of ∼720 ± 5 MPa in the AMZ layers
were predicted using Eq. 1, considering a “mean” volume ratio
VATZ/VAMZ = 12.0 ± 0.2. The low scatter in the average stresses
for the composites is a result of the small variation in the vol-
ume ratios between the different 3–1 composites tested. These
values are in good agreement with the maximal stresses calcu-
lated by FEM for the ATZ and AMZ layers as shown in Fig. 4.
As described in the literature,18 if the influence of the external
surfaces is neglected, and the 2–2 composite is assumed to be
an infinite plate in x and y-directions, then the magnitude of
the residual stresses depends only on the total volume ratio of
the two components and not on the individual layer thicknesses.
Since the total volume ratio between ATZ and AMZ of the eight
regions (i.e. A to H) in the four types of 3–1 composites is the
same, the residual stresses in each ATZ and AMZ material must
be the same, respectively.
3.2. Indentation-strength results of 3–1 composites
Different combinations of Vickers indents were placed on the
surface of the ATZ monoliths and the 3–1 composites. Examina-
tion of broken ATZ monolith after four-point bending showed
that failure occurred from the largest pre-crack, generated by
the largest indentation load (i.e. larger critical flaw size), as
expected for brittle materials. However, failure in the 3–1 com-
posites occurred from one of the three indentation pre-cracks and
was not necessarily associated with the highest indentation load.
All AF, BE and GH 3–1 composites failed from the indents in
regions A, B or G, respectively (i.e. where the first ATZ tensile
layer is thicker), and independent of the original combination
of Vickers indents listed in Section 2.3. A similar outcome was
observed in the indented CD composites, where most of the spec-
imens failed in region C and only a small number of samples
failed in region D.
The variation of the fracture strength, σf, with the indenta-
tion load, P, is logarithmically plotted in Fig. 5a for the A, B,
C and G regions (‘deep’ regions) in AF, BE, CD and GH 3–1
composites, and for the ATZ monolith, respectively. The fracture
strength is the average of 12 specimens per 3–1 composite tested.
A linear regression analysis of the strengths in Fig. 5a shows
that fracture strength, σf, of the ATZ monolith decreases with
increasing indentation load, P, following a power law charac-
teristic of brittle materials, σf ∝ P−k, with k = 0.30.34 For region
A in AF composites, with the first ATZ layer around 1222 �m
in thickness, the fracture strength also decreases with increasing
indentation load (i.e. increasing initial flaw size) and region A
fails at a lower fracture strength at each indentation load than
the ATZ monolith. The lower strength is a consequence of the
residual tensile stress in the ATZ layers. Region B in the BE

636 Y. Chang et al. / Journal of the European Ceramic Society 35 (2015) 631–640
Fig. 5. The variation of the average fracture strength of 12 specimens per composite type with the indentation load (P) (plotted logarithmically) for (a) indented 3–1
AF, BE, CD and GH composites failed in ‘deep’ regions (i.e. A, B, C and G) and (b) indented 3–1 D, E, F and H composites. Indented ATZ monolith is also shown
for comparison. The error bars represent the standard deviation for each sample.
composite, with a ∼802 �m thick first ATZ layer, has a frac-
ture strength of ∼148 MPa that is nearly independent of the
original indentation flaw size. Region C of the CD composites,
with a thickness of around 458 �m for the first ATZ layer, has
almost constant fracture strength of ∼218 MPa. Compared with
the monolith, most of the fracture strengths are higher for the
CD composites, pointing out the enhanced mechanical behav-
ior of the composites. Region G of the GH composites, with a
thickness of around 382 �m, has the highest average strength of
∼299 MPa. The fracture strengths (σf) with the standard devi-
ations corresponding to the A, B, C and G regions of the 3–1
composites are listed in Table 1.
In order to analyze the fracture behavior in D, E, F, and H
regions (i.e. ‘shallow’ regions), 2–2 indented composites were
also tested. The variation of the average fracture strengths, σf,
is plotted as a function of the logarithm of indentation load, P,
in Fig. 5b. Results for the ATZ monolith are plotted for compar-
ison. The samples have the same indentation-size independence
as observed for the 3–1 composites. All 2–2 composites have
higher fracture strengths than the monoliths at each indent size.
It is worth pointing out that in regions D, E, and F (i) the
first AMZ compressive layer is 75 �m thick, (ii) the first ATZ
layer thickness is the same (382 �m), and (iii) only the loca-
tions of the second AMZ layer are different. For these particular
regions, a nearly constant strength was measured, ranging from
∼250 MPa to ∼259 MPa. This result indicates that the inter-
nal structure beyond the first two layers does not significantly
influence the indentation-strengths of the 2–2 composites. For
2–2 H composites, the first ATZ/AMZ layer thickness ratio is
around 1.0:1, and the thickness of the first AMZ compressive
layer is 150 �m or twice that in the D, E and F regions. The
almost constant strength of 2–2 bars reached ∼470 MPa, which
is much higher than those obtained in the other three regions.
The average strengths (σf) with the standard deviations corre-
sponding to the D, E, F and H 2–2 composites are also listed in
Table 1.
In summary, the 3–1 composites have fracture strengths
nearly independent of indentation crack size and the strengths
are strongly influenced by the distribution of the AMZ com-
pressive layers in the composites. It is shown that placing the
Fig. 6. Typical stress–displacement curves of ATZ monolith, and 3–1 CD and
GH composites failed at 100 N indentation load. The “pop-in” events in the
CD and GH composites correspond to the propagation of the initial indentation
(200 N, 100 N, and 50 N) cracks.
first AMZ compressive layer closer to the surface increases the
indentation strength of the composites.
3.3. Analysis of crack arrest in 3–1 composites
Fig. 6 shows typical stress–displacement curves of the 3–1
CD and GH indented composites (with 100 N, 50 N and 200 N
indents) which failed in the C and G regions, respectively. Data
for an indented ATZ monolith is also plotted for comparison. The
ATZ monolith failed at a lower stress than the composites and
in a brittle manner. However, the 3–1 CD and GH composites
showed “pop-in” events in the stress-displacement curves, i.e.
load drops, associated with the propagation of indentation cracks
during loading, as observed in other 2–2 multilayer systems.18
The mechanical behavior of the 3–1 composites as observed
in Fig. 6 can be described as follows: During four-point bending
of indented specimens, every indentation crack rapidly grew
through the tensile layer normal to the first ATZ layer at a stress
corresponding to the “pop-in” events in the stress-displacement
curves. The stress at which the “pop-in” event occurs depends
on the size of the indentation crack. The three “pop-in” events
observed in each composite curve correspond to propagation of
the 200 N, 100 N and 50 N indentation cracks, respectively. An

Y. Chang et al. / Journal of the European Ceramic Society 35 (2015) 631–640 637
Fig. 7. Stress intensity factor (Kappl) and calculated material fracture toughness
(KR) as a function of the crack length in indented C region. The crack propa-
gation of three pre-cracks (indents) under applied stress σappl is schematically
represented. “Pop-in” events in the load–displacement curves are defined as the
intersects between Kappl and KR for a given initial pre-crack size.
instantaneous drop in load can be observed right after the abrupt
growth of each indentation crack. It is noteworthy that the “pop-
in” events in the CD and GH composites occur at similar stress
levels. This can be explained by the fact that the residual tensile
stress in the ATZ layers containing the indents is the same in
both systems. In contrast to the catastrophic failure of the ATZ
monolith, the sudden indentation crack extensions in the first
ATZ layer do not result in failure of the composite.
In order to interpret the initial propagation of indentation
cracks and explain the different strengths obtained in the dif-
ferent regions of the 3–1 composites a linear elastic fracture
mechanics model, based on a weight function approach,35,36 was
implemented. The “apparent” fracture toughness in a multilayer
system with residual stresses, KR, depends on the location of the
crack tip within the layers. If the crack tip is in the layer with
tensile residual stresses, KR(a) decreases with the crack length,
a; if the crack tip is in the compressive layer, shielding occurs
and KR(a) increases with a. Thus, KR(a) can be expressed as
follows:
KR(a) = KIc −
a∫
0
h(a, x)σres(x)dx (3)
where KIc is the intrinsic fracture toughness of each individual
layer, x is the distance along the crack length measured from the
surface, a is the crack length, and h(a,x) is the weight function.
To account for the contribution of the residual stresses in a mul-
tilayer (Kres), the stress distribution, σres, of the corresponding
layer needs be introduced into Eq. (3). The weight function h(a,
x) is considered the same for all four multilayers, as given in
Ref. [36].
For the calculation of KR in a specific region of a 3–1 com-
posite, we consider the corresponding geometry and the residual
stress distribution as calculated with the FE model. Fig. 7 repre-
sents the applied stress intensity factor (Kappl) and the calculated
material fracture toughness (KR) as a function of the crack length
for indented C region as an example. For simplicity, only a dis-
tance corresponding to the first four layers is plotted. The crack
length parameter, â = Y(a)1/2, enables the representation of the
applied stress intensity factor, Kappl, as a straight line, the slope
corresponding to the applied stress, σappl, as inferred from the
Griffith/Irwin equation37:
Kappl(a) = σapplY (a)1/2 (4)
where Y is a geometric factor corresponding to four-point bend-
ing for the SEVNB geometry.
In Fig. 7, it can be observed that toughness KR decreases in the
ATZ layers with a tensile residual stress state and increases very
significantly within the AMZ layers with compressive resid-
ual stresses (something like steeply R-curve behavior) as â
increases. The conditions for stable/unstable crack growth in
region C can be directly established in Fig. 7 (see Ref. [10] for
more details). For the 50 N indent (as an example), according to
the Griffth criterion, when Kappl reaches KR (i.e. Kappl ≥ KR) the
indentation crack corresponding to the 50 N indent will experi-
ence unstable propagation in the tensile ATZ layer. This occurs
when one of the represented Kappl lines intersects KR (Fig. 7).
However, the propagation does not lead to catastrophic fail-
ure. This is observed in Fig. 6 as a drop in the applied load
(i.e. pop-in). The reason by which the load-drop does not go
to zero (i.e. specimen failure) is that the “unstable” growth of
the initial indentation crack is hindered and gets arrested by the
compressive AMZ layer. Under this situation, the propagating
crack would require additional applied stress to further propa-
gate. Indeed, the same reasoning applies for the 20 N, 100 N and
200 N indentation cracks.
The propagation of the initial indentation cracks occurs
at different applied stress levels (represented in Fig. 7 as
σpop-in,20N, σpop-in,50N and σpop-in,100N), as measured experimen-
tally (Fig. 6). We caution the reader that the pop-in stress values
predicted by the model (i.e. slope of the curve at the intersect
Kappl = KR) were slightly different than those in Fig. 6. This
can be due to: (i) the model considers an “edge crack” and not
an “indent crack”, and (ii) the sub-critical growth of the indent
before pop-in is not taken into account. Once the crack has been
arrested at the compressive layer, further propagation (now sta-
ble propagation) requires increasing the applied stress, σappl.
According to Griffith criterion, when Kappl overcomes the max-
imum KR, the crack will unstably propagate up to failure, which
corresponds to the maximum stress intensity factor (Kmax), and
thus maximum applied stress measured in Fig. 5. Below such
stress level, the indentation cracks cannot cause catastrophic fail-
ure. The maximum applied stress can be defined as a “minimum
strength” (σmin), as was found in most of the 3–1 regions of the
composites investigated.
3.4. Crack growth resistance in different regions of 3–1
composites: Experiments and modeling
The fracture toughness Kapt was determined experimentally
with the SEVNB method for each region and is given in Table 1.

638 Y. Chang et al. / Journal of the European Ceramic Society 35 (2015) 631–640
Fig. 8. Apparent fracture toughness, KR, versus crack length parameter, Y(a)1/2, for all the regions of different 3–1 composites: (a) AF, (b) BE, (c) CD, and (d)
GH. The straight lines represent the applied stress intensity factor, Kappl, the slope being the applied stress, σappl. Post-fracture optical micrographs of indented 3–1
composites are also shown.
It can be seen that the fracture toughness in the 3–1 compos-
ites is strongly influenced by the location of the compressive
layers in the different regions. Decreasing the thickness of the
first tensile ATZ layer significantly enhances the fracture tough-
ness of the composites. For instance, a Kapt of ∼11.0 MPa m1/2
was obtained in region G with the first ATZ/AMZ layer thick-
ness ratio of around 5.1:1, which is much higher than the
3.2 MPa m1/2 of the ATZ monolith. Due to the thinness of the
first ATZ layer in region H (i.e. ca. 150 �m) it was not possible
to measure Kapt experimentally via the SEVNB method in that
region.
In order to compare the different regions in all four multi-
layer systems, the apparent toughness, KR, calculated according
to Eq. (3), is represented in Fig. 8 as a function of a crack
length parameter Y(a)1/2. Fig. 8a–d represents the crack growth
resistance in regions AF, BE, CD and GH, respectively. The min-
imum strength (σmin) and the maximum crack growth resistance
(Kmax) can be derived, which differ from laminate to laminate
and region to region (see Fig. 8). The calculated Kmax values
for the eight regions are listed in Table 1. As predicted by Ses-
takova et al.,18 the thicknesses of the first ATZ tensile and AMZ
compressive layers mainly influence the maximal toughness and
minimum strength in a layered system. The highest KR values
can be obtained in designs which have thin (tensile) outer lay-
ers (in our case the ATZ layer) followed by a relatively thicker
compressive layer (in this case the AMZ layer). In Fig. 8a and b,
regions F and E have a thickness ratio between the first two lay-
ers of ATZ:AMZ = 5.1:1, whereas regions A and B have higher
ratios, of ATZ:AMZ = 16.3:1 and ATZ:AMZ = 10.7:1, respec-
tively (see Table 1). That is, the first ATZ tensile layers in regions
A and B (‘deep’ regions) are significantly thicker than those in
regions F and E (‘shallow’ regions). As a result, regions F and
E lead to higher Kmax values (i.e. Kmax,F and Kmax,E) as well
as higher minimum strengths (i.e. σmin,F and σmin,E). As a con-
sequence, failure will occur through the “deep” regions (A and
B), as observed experimentally. In the case of region A, due
to the relatively thick first ATZ layer, no minimum strength was
found for the sizes of indentation cracks introduced in these sam-
ples. In system CD, both regions have a similar thickness ratio
between the first two layers (i.e. ATZ:AMZ = 6.1:1 for region C
and ATZ:AMZ = 5.1:1 for region D). As a consequence, similar
Kmax and σmin are expected (see Fig. 8c). This is also the reason
that some 3–1 indented specimens in system CD failed through
the C region and others through the D region, as reported above.
The Kmax values predicted by the model corresponding to
regions F, E and D, are around 11 MPa m1/2 (see Fig. 8),

Y. Chang et al. / Journal of the European Ceramic Society 35 (2015) 631–640 639
which is in good agreement (although slightly overestimated)
with the SEVNB measurements in such regions, as reported
in Table 1. Minimum strengths calculated from Eq. (3) for the
maximal toughness values at the corresponding crack length
(i.e. a = tATZ + tAMZ) ranges between 275 and 300 MPa, which
is also in agreement with the measured minimum strength (i.e.
∼250 MPa) in these three regions, as reported in Table 1.
In region H, significantly higher Kmax and σmin (compared
to regions F, E and D) can be observed (see Fig. 8d), where the
first ATZ layer is as thin as ∼150 �m and the first AMZ layer is
as thick as ∼150 �m (see Table 1). In this case, Kmax values of
approx. 17 MPa m1/2 and σmin as high as 530 MPa are predicted
with the model. Although experimental values for KR could not
be measured (according to the SEVNB standards32) due to the
thinness of the first ATZ layer, a fracture strength of ∼470 MPa
was experimentally obtained (see Table 1) in the H region; in
good agreement with the predicted minimum strength value.
Very interesting is the KR distribution in region G (see Fig. 8d).
In this region the first peak in the KR curve (obtained at the end
of the first compressive AMZ layer) does not correspond to the
maximum value of KR for region G (see Kmax G and K∗max G in
Fig. 8d). According to this calculation a higher apparent tough-
ness could be achieved at the second compressive AMZ layer
(see Fig. 8d). This might also lead to slightly higher minimum
strength (as the slope of the straight line up to the second AMZ
layer, i.e. σ∗min,G, slightly increases compared to σmin,G). In fact,
the measured fracture strength for the G region is ∼300 MPa
(in contrast to 250 MPa for regions F, E and D), although all of
them have the same layer thickness ratio of the first two layers
(see Table 1). This suggests the possible presence of a second
crack arrest (at the second AMZ compressive layer). This finding
raises the question about whether such a combination of com-
pressive layers may yield higher performance (in terms of flaw
tolerance) than provided by a single-crack-arrest configuration,
and will be investigated in future work.
Post-fracture optical micrographs of indented 3–1 compos-
ites are presented in Fig. 8. It can be seen that each 3–1 composite
failed in the region with the thicker first tensile layer (i.e.
‘deep’ region), as predicted by the model. In addition, a typ-
ical step-wise fracture can be observed in the composites, as
compared to the straight character typically exhibited during
fracture of monolithic ceramic materials. This is associated with
the compressive stresses in all AMZ layers, hindering and/or
deviating the crack propagation, as found in other 2–2 layered
composites.30
From the above results, it can be summarized that the fig-
ures of merit of the 2–2 composites, such as significantly
enhanced fracture toughness and the existence of minimum
strength, are also applicable to 3–1 composites. In addi-
tion, 3–1 composites have some unique characteristics that
2–2 composites do not possess. In particular, fracture in
2–2 laminates may occur from any potential surface defect
which propagates toward the compressive layer. In con-
trast, the fracture location of the 3–1 composites can be
tailored by the appropriate location of the embedded com-
pressive layers. The ‘deep’ region in the 3–1 composites
(i.e. the region with lower crack growth resistance) provides
the preferential path for cracks (initiated at the surface) to
propagate, thus protecting potential features which may be
located in the ‘shallow’ regions. The improved fracture tough-
ness and strength, and more importantly, the spatially-dependent
fracture behavior make 3–1 composites good candidates for
structural applications.
4. Conclusions
A new design concept based on 3–1 connectivity of two dif-
ferent components was tested in alumina-zirconia composites
consisting of a higher thermal expansion matrix (ATZ) and inter-
persed regions of lower thermal expansion (AMZ) which led to
tensile stresses in the matrix of +65 MPa and internal compres-
sive residual stresses up to −720 MPa. The 3–1 composites were
fabricated by altering the stacking sequence of patterned and
unpatterned tapes, thus allowing different regions within a 3–1
composite by tailoring of the spatial distribution and thickness
of the internal AMZ layers. Four-point bending tests on indented
3–1 composites showed crack arrest in the first AMZ compres-
sive layer and a fracture strength independent of indent size (i.e.
minimum strength). Failure occurred in the region with thicker
outer ATZ layers (‘deep’ region). A minimum strength as high as
470 MPa was achieved in a region with a relatively thicker AMZ
compressive layer located close to the tensile surface (‘shallow’
region). The 3–1 design concept is based on the placement of
‘deep’ and ‘shallow’ embedded regions to tailor the associated
stress distribution, and consequently, to manipulate preferential
locations/surfaces for crack propagation. We believe this work
demonstrates that 3–1 and other composite connectivities open
new possibilities for design of multilayer structures with tailored
crack growth resistance.
Appendix A. Supplementary data
Supplementary data associated with this article can be
found, in the online version, at http://dx.doi.org/10.1016/
j.jeurceramsoc.2014.09.017.
References
1. Wachtman JB. Mechanical properties of ceramics. New York, Chicester:
John Wiley; 1996.
2. Lange FF. Powder processing science and technology for increased reliabil-
ity. J Am Ceram Soc 1989;72:3–15.
3. Green DJ, Tandon R, Sglavo VM. Crack arrest and multiple cracking
in glass through the use of designed residual stress profiles. Science
1999;283:1295–7.
4. Sglavo VM, Larentis L, Green DJ. Flaw-insensitive ion-exchanged glass: I,
Theorectical aspects. J Am Ceram Soc 2001;84:1827–31.
5. Newnham R, Skinner D, Cross L. Connectivity and
piezoelectric–pyrolelectric composites. Mater Res Bull 1978;13:525–36.
6. Clegg WJ, Kendall K, Alford NM, Button TW, Birchall JD. A simple way
to make tough ceramics. Nature 1990;347:455–7.
7. Lugovy M, Slyunyayev V, Subbotin V, Orlovskaya N, Kübler J. Crack arrest
in Si3N4-based layered composites with residual stress. Compos Sci Technol
2004;64:1947–57.
8. Sglavo VM, Paternoster M, Bertoldi M. Tailored residual stresses in
high reliability alumina-mullite ceramic laminate. J Am Ceram Soc
2005;88:2826–32.

640 Y. Chang et al. / Journal of the European Ceramic Society 35 (2015) 631–640
9. Lube T, Pascual J, Chalvet F, de Portu G. Effective fracture toughness in
Al2O3–Al2O3/ZrO2 laminates. J Eur Ceram Soc 2007;27:1449–53.
10. Bermejo R, Pascual J, Lube T, Danzer R. Optimal strength and toughness
of Al2O3–ZrO2 laminates designed with external or internal compressive
layers. J Eur Ceram Soc 2008;28:1575.
11. Chlup Z, Hadraba H, Slabakova L, Drdlik D, Dlouhy I. Fracture
behaviour of alumina and zirconia thin layered laminate. J Eur Ceram Soc
2012;32:2057–61.
12. Quinn GD, Melandri C, de Portu G. Edge chipping resistance of alu-
mina/zirconia laminates. J Am Ceram Soc 2013;96:2283–91.
13. Zhang W, Telle R, Uebel J. R-curve behaviour in weak interface-
toughened SiC–C laminates by discrete element modeling. J Eur Ceram
Soc 2014;34:217–27.
14. Rao M, Sanchez-Herencia AJ, Beltz G, McMeeking RM, Lange F.
Laminar ceramics that exhibit a threshold strength. Science 1999;286:
102–5.
15. Pontin MG, Rao MP, Sánchez-Herencia AJ, Lange FF. Laminar ceramics uti-
lizing the zirconia tetragonal-to-monoclinic phase transformation to obtain
a threshold strength. J Am Ceram Soc 2002;85:3041–8.
16. Dancer CEJ, Yahya NA, Berndt T, Todd RI, de Portu G. Effect of residual
compressive surface stress on severe wear of alumina-silicon carbide two-
layered composites. Tribol Int 2014;74:87–92.
17. Dancer CEJ, Achintha M, Salter CJ, Fernie JA, Todd RI. Residual stress
distribution in a functionally graded alumina–silicon carbide material. Scr
Mater 2012;67:281–4.
18. Sestakova L, Bermejo R, Chlup Z, Danzer R. Strategies for fracture tough-
ness, strength and reliability optimisation of ceramic-ceramic laminates. Int
J Mat Res 2011;102:613–26.
19. Bosse PW, Challagulla KS, Venkatesh TA. Effects of foam shape and poros-
ity aspect ratio on the electromechanical properties of 3-3 piezoelectric
foams. Acta Mater 2012;60:6464–75.
20. Nelson GJ, Grew KN, Izzo JR, Lombardo JJ, Harris WM, Faes A, et al.
Three-dimensional microstructural changes in the Ni–YSZ solid oxide fuel
cell anode during operation. Acta Mater 2012;60:3491–500.
21. Yang TN, Hu JM, Nan CW, Chen LQ. On the elastically coupled mag-
netic and ferroelectric domains: a phase-field model. Appl Phys Lett
2014;104:052904.
22. Babu I, de With G. Highly flexible piezoelectric 0–3 PZT–PDMS composites
with high filler content. Compos Sci Technol 2014;91:91–7.
23. Deluca M, Bermejo R, Pletz M, Supancic P, Danzer R. Strength and frac-
ture analysis of silicon-based components for embedding. J Eur Ceram Soc
2011;31:549–58.
24. Bermejo R, Baudin C, Moreno R, Llanes L, Sanchez-Herencia AJ.
Processing optimisation and fracture behavior of layered ceramic compos-
ites with highly compressive layers. Compos Sci Technol 2007;67:1930–8.
25. Sánchez-Herencia AJ, Pascual C, He J, Lange FF. ZrO2/ZrO2 layered com-
posites for crack bifurcation. J Am Ceram Soc 1999;82:1512–8.
26. Pavlacka R, Bermejo R, Chang Y, Green DJ, Messing GL. Fracture behavior
of layered alumina microstructural composites with highly textured layers.
J Am Ceram Soc 2013;96:1577–85.
27. Messing GL, Kupp ER, Lee SH, Juwondo GY, Stevenson AJ. Method for
manufacture of transparent materials. US patent:7799267.
28. Kupp ER, Messing GL, Anderson JM, Gopalan V, Dumm JQ, Kraisinger
C, et al. Co-casting and optical characteristics of transparent segmented
composite Er:YAG laser ceramics. J Mater Res 2010;25:476–83.
29. Moon H, Pontin MG, Lange F. Crack interactions in laminar ceramics that
exhibit a threshold strength. J Am Ceram Soc 2004;87:1694–700.
30. Bermejo R, Torres Y, Sanchez-Herencia AJ, Baudin C, Anglada M, Llanes
L. Fracture behavior of an Al2O3–ZrO2 multi-layered ceramic with resid-
ual stresses due to phase transformations. Fatigue Fract Eng Mater Struct
2006;29:71–8.
31. ASTM. Standard test methods for flexural strength of advanced ceramics
at ambient temperature. In: ASTM C 1161-02c. West Conshohocken, PA,
USA: American Society for Testing and Materials; 2002.
32. ISO. Fine ceramics (advanced ceramics, advanced technical ceramics) –
test methods for fracture toughness of monolithic ceramics – single-edge
V-notch beam (SEVNB) method. In: ISO 23146. ISO; 2008.
33. Damani R, Gstrein R, Danzer R. Critical notch-root radius effect in SENB-S
fracture toughness testing. J Eur Ceram Soc 1996;16:695–702.
34. Marshall DB, Lawn BR. Residual stress effects in sharp contact cracking:
I, Indentation fracture mechanics. J Mater Sci 1979;14:2001–12.
35. Fett T. Stress intensity factors and weight functions for the edge cracked
plate calculated by the boundary collocation method. Karlsruhe: Kern-
forschungszentrum Karlsruhe; 1990.
36. Fett T, Munz D. Stress intensity factors and weight functions. Southampton:
Computational Mechanics Publications; 1997.
37. Griffith AA. The phenomenon of rupture and flow in solids. Philos Trans R
Soc Lond 1920;A221:163–98.
Copyright © 2022 FDOKUMEN