Design, Fabrication, and Impedance Characterization of a Capacitance-Based Salinity Sensor for...
6
Design, Fabrication, and Impedance Characterization of a Capacitance-Based Salinity Sensor for Marine Applications Abdur Rub Abdur Rahman, z Shreyas Bhat, and Shekhar Bhansali * Department of Electrical Engineering, University of South Florida, Tampa, FL 33620, USA We report on the fabrication and electrochemical impedance characterization of a parallel plate capacitance sensor for ocean water salinity monitoring. The standard printed circuit board PCB fabricated and assembled sensor shows excellent response to changes in salinity with a sensitivity of 3.3 k/PSU. Use of the standard PCB process, necessitated by the requirement of low cost and ease of fabrication, posed challenges such as electrode corrosion and fouling. We investigated two polymeric materials as possible electrode passivation coatings, Novolac resin polymer Novolac and a proprietary commercial organic polymer Accu- flo. By performing electrochemical impedance spectroscopy EIS and electrical equivalent-circuit-based model fitting, we show that Accuflo has better stability and passivation characteristics in comparison with Novolac. The pore resistance of Accuflo was found to be 3 orders of magnitude higher than that of Novolac, which indicates that Accuflo is relatively less porous than Novolac. Optical observations of the Accuflo- and Novolac-coated sensors after 48 h of immersion in ocean water show that Accuflo maintains its structural integrity, whereas Novolac is severely compromised and the underlying electrode has undergone corrosion, in agreement with EIS analysis. This confirms that Accuflo is a better choice as an electrode coating for underwater applications. © 2008 The Electrochemical Society. DOI: 10.1149/1.2981045 All rights reserved. Manuscript submitted May 5, 2008; revised manuscript received August 19, 2008. Published October 7, 2008. The oceanic studies began in the 1930s with the search for pe- troleum, continued with the emphasis for improved naval warfare, and more recently have been driven by a need to understand and protect the ecosystem. Among the different facets of oceanography, physical oceanography relates to the study of physical properties and dynamics of the ocean, the primary interests being the ocean- atmosphere interaction, the oceanic heat budget, and the coastal dy- namics. No discussion on oceanography is complete without men- tion of parameters such as salinity, temperature, pressure, and density. Salinity is commonly defined as the ratio between the weight of dissolved material in the seawater sample and the weight of the sample. 1 This ratio is generally expressed in parts per thou- sand. The dissolved material includes dissolved gases but excludes fine suspended particles and other solids that are in contact with seawater. Salinity is also conveniently referred to as total dissolved salts. Together, salinity and temperature determine seawater density and buoyancy, driving the extent of ocean stratification, mixing, and water mass formation. In this paper we develop a salinity sensor for deployment in ocean water salinity sensing. Particularly, we evaluate two different polymeric materials for their effectiveness as electrode passivation layers for the salinity sensor. The electrode passivation layers serve as barrier layers against electrode corrosion in the ocean environ- ment. The electrode passivation materials used in this study are No- volac resin polymer Novolac and a proprietary commercial poly- mer, Accuflo, marketed by Honeywell, Inc. These polymeric films were subjected to calibrated ocean water samples and their barrier properties evaluated by electrochemical impedance measurements. The ocean environment is high in chlorine content, by virtue of which the corrosion processes are accelerated. 2 The passivation properties of polymer film are important in long-term survival of the electrode in the ocean environment. Electrochemical impedance spectroscopy EIS was used to study the electrode–polymer– electrolyte interface. EIS has long been successfully employed to study electrochemical kinetics of processes such as corrosion, elec- trodeposition, fuel cell kinetics, etc. 3 EIS has also been employed to study relaxation phenomenon in polymeric chains, such as rotational polarization. 4 Polymer coatings on metal electrodes act as barriers to prevent corrosion, separating the metal from the surrounding electrolyte. However, the reliability of these polymers is limited by the fact that over time, diffusion of ions through the coating can establish contact between the electrolyte and the electrode surface. This can have undesirable effects, particularly in capacitive sensing applications where the absorption of electrolyte by the dielectric material can alter its dielectric properties. This can lead to erroneous results due to a time-dependent drift in the sensor characteristics. Hence, it be- comes imperative to study the effectiveness of these barrier layers before making a final selection of the coating. In this research, we use EIS to characterize the barrier properties of polymer coatings. In EIS, the impedance of the material or system under study is recorded at various frequencies. It is often employed in corrosion monitoring of bare and coated metals. 5,6 A corroding metal in direct contact with the electrolyte is represented by a parallel combination of a resistance charge transfer and a capacitance double layer in series with a resistance solution resistance. In the case of diffusion- limited processes, a series diffusion element can be added. Usually, the diffusion element is of the Warburg type, characterized by a 45° inclined spur in the complex plane. In the case of a polymer-coated metal, in addition to the parallel combination of resistance R and capacitance C due to double layer and charge transfer, another parallel R and C due to pore resistance and capacitance have to be added. 7-9 In this work, EIS data of the capacitive salinity sensor were recorded at various salinities and temperatures. The data were then fit to models representing corrosion processes, using equivalent cir- cuit models and the least-squares fitting technique. The EIS data and modeling were correlated with documented optical observations. Materials and Methods The detailed fabrication and assembly of the sensor used in this work is reported elsewhere. 7 Briefly, copper plates of 2 1 cm di- mension were coated with polymer material and assembled in a parallel plate configuration with a 600 M spacer to set the distance between the plates. The fabrication process flow of the salinity sen- sor is illustrated in Fig. 1a-g. Figure 1h is the photograph of the fabricated salinity sensors. The cell constant is 0.03 /cm, which yields an empty cell capacitance of 2.951 10 -12 farad. Because the area of the plates is much greater than the distance between the plates, a uniform field distribution can be assumed and the effects of fringe fields can be neglected. 10 An Agilent 4294A impedance analyzer is used to record the im- pedance and phase angle in the frequency range between 1 and 500 kHz, using an excitation signal of 25 mV. Fixture compensation and open and short calibration were performed as per the instrument manual to null the measurement setup and fixturing effects. Imped- ance measurements were performed at open-circuit potential with no applied dc bias. The ac and dc signal monitor facilities of the ana- lyzer were utilized to check the ac signal levels and to ensure that there was no applied dc bias. Calibrated standard seawater solution * Electrochemical Society Active Member. z E-mail: [email protected] Journal of The Electrochemical Society, 155 12 J355-J360 2008 0013-4651/2008/15512/J355/6/$23.00 © The Electrochemical Society J355 Downloaded 19 Feb 2009 to 131.247.11.234. Redistribution subject to ECS license or copyright; see http://www.ecsdl.org/terms_use.jsp
Transcript of Design, Fabrication, and Impedance Characterization of a Capacitance-Based Salinity Sensor for...

Journal of The Electrochemical Society, 155 12 J355-J360 2008 J355
Design, Fabrication, and Impedance Characterization of aCapacitance-Based Salinity Sensor for Marine ApplicationsAbdur Rub Abdur Rahman,z Shreyas Bhat, and Shekhar Bhansali*
Department of Electrical Engineering, University of South Florida, Tampa, FL 33620, USA
We report on the fabrication and electrochemical impedance characterization of a parallel plate capacitance sensor for ocean watersalinity monitoring. The standard printed circuit board PCB fabricated and assembled sensor shows excellent response tochanges in salinity with a sensitivity of 3.3 k/PSU. Use of the standard PCB process, necessitated by the requirement of low costand ease of fabrication, posed challenges such as electrode corrosion and fouling. We investigated two polymeric materials aspossible electrode passivation coatings, Novolac resin polymer Novolac and a proprietary commercial organic polymer Accu-flo. By performing electrochemical impedance spectroscopy EIS and electrical equivalent-circuit-based model fitting, we showthat Accuflo has better stability and passivation characteristics in comparison with Novolac. The pore resistance of Accuflo wasfound to be 3 orders of magnitude higher than that of Novolac, which indicates that Accuflo is relatively less porous than Novolac.Optical observations of the Accuflo- and Novolac-coated sensors after 48 h of immersion in ocean water show that Accuflomaintains its structural integrity, whereas Novolac is severely compromised and the underlying electrode has undergone corrosion,in agreement with EIS analysis. This confirms that Accuflo is a better choice as an electrode coating for underwater applications.© 2008 The Electrochemical Society. DOI: 10.1149/1.2981045 All rights reserved.
Manuscript submitted May 5, 2008; revised manuscript received August 19, 2008. Published October 7, 2008.
0013-4651/2008/15512/J355/6/$23.00 © The Electrochemical Society
The oceanic studies began in the 1930s with the search for pe-troleum, continued with the emphasis for improved naval warfare,and more recently have been driven by a need to understand andprotect the ecosystem. Among the different facets of oceanography,physical oceanography relates to the study of physical propertiesand dynamics of the ocean, the primary interests being the ocean-atmosphere interaction, the oceanic heat budget, and the coastal dy-namics. No discussion on oceanography is complete without men-tion of parameters such as salinity, temperature, pressure, anddensity. Salinity is commonly defined as the ratio between theweight of dissolved material in the seawater sample and the weightof the sample.1 This ratio is generally expressed in parts per thou-sand. The dissolved material includes dissolved gases but excludesfine suspended particles and other solids that are in contact withseawater. Salinity is also conveniently referred to as total dissolvedsalts. Together, salinity and temperature determine seawater densityand buoyancy, driving the extent of ocean stratification, mixing, andwater mass formation.
In this paper we develop a salinity sensor for deployment inocean water salinity sensing. Particularly, we evaluate two differentpolymeric materials for their effectiveness as electrode passivationlayers for the salinity sensor. The electrode passivation layers serveas barrier layers against electrode corrosion in the ocean environ-ment. The electrode passivation materials used in this study are No-volac resin polymer Novolac and a proprietary commercial poly-mer, Accuflo, marketed by Honeywell, Inc. These polymeric filmswere subjected to calibrated ocean water samples and their barrierproperties evaluated by electrochemical impedance measurements.
The ocean environment is high in chlorine content, by virtue ofwhich the corrosion processes are accelerated.2 The passivationproperties of polymer film are important in long-term survival of theelectrode in the ocean environment. Electrochemical impedancespectroscopy EIS was used to study the electrode–polymer–electrolyte interface. EIS has long been successfully employed tostudy electrochemical kinetics of processes such as corrosion, elec-trodeposition, fuel cell kinetics, etc.3 EIS has also been employed tostudy relaxation phenomenon in polymeric chains, such as rotationalpolarization.4
Polymer coatings on metal electrodes act as barriers to preventcorrosion, separating the metal from the surrounding electrolyte.However, the reliability of these polymers is limited by the fact thatover time, diffusion of ions through the coating can establish contactbetween the electrolyte and the electrode surface. This can have
* Electrochemical Society Active Member.z E-mail: [email protected]
Downloaded 19 Feb 2009 to 131.247.11.234. Redistribution subject to E
undesirable effects, particularly in capacitive sensing applicationswhere the absorption of electrolyte by the dielectric material canalter its dielectric properties. This can lead to erroneous results dueto a time-dependent drift in the sensor characteristics. Hence, it be-comes imperative to study the effectiveness of these barrier layersbefore making a final selection of the coating. In this research, weuse EIS to characterize the barrier properties of polymer coatings.
In EIS, the impedance of the material or system under study isrecorded at various frequencies. It is often employed in corrosionmonitoring of bare and coated metals.5,6 A corroding metal in directcontact with the electrolyte is represented by a parallel combinationof a resistance charge transfer and a capacitance double layer inseries with a resistance solution resistance. In the case of diffusion-limited processes, a series diffusion element can be added. Usually,the diffusion element is of the Warburg type, characterized by a 45°inclined spur in the complex plane. In the case of a polymer-coatedmetal, in addition to the parallel combination of resistance R andcapacitance C due to double layer and charge transfer, anotherparallel R and C due to pore resistance and capacitance have to beadded.7-9
In this work, EIS data of the capacitive salinity sensor wererecorded at various salinities and temperatures. The data were thenfit to models representing corrosion processes, using equivalent cir-cuit models and the least-squares fitting technique. The EIS data andmodeling were correlated with documented optical observations.
Materials and Methods
The detailed fabrication and assembly of the sensor used in thiswork is reported elsewhere.7 Briefly, copper plates of 2 1 cm di-mension were coated with polymer material and assembled in aparallel plate configuration with a 600 M spacer to set the distancebetween the plates. The fabrication process flow of the salinity sen-sor is illustrated in Fig. 1a-g. Figure 1h is the photograph of thefabricated salinity sensors. The cell constant is 0.03/cm, whichyields an empty cell capacitance of 2.951 10−12 farad. Becausethe area of the plates is much greater than the distance between theplates, a uniform field distribution can be assumed and the effects offringe fields can be neglected.10
An Agilent 4294A impedance analyzer is used to record the im-pedance and phase angle in the frequency range between 1 and500 kHz, using an excitation signal of 25 mV. Fixture compensationand open and short calibration were performed as per the instrumentmanual to null the measurement setup and fixturing effects. Imped-ance measurements were performed at open-circuit potential with noapplied dc bias. The ac and dc signal monitor facilities of the ana-lyzer were utilized to check the ac signal levels and to ensure thatthere was no applied dc bias. Calibrated standard seawater solution
CS license or copyright; see http://www.ecsdl.org/terms_use.jsp
J356 Journal of The Electrochemical Society, 155 12 J355-J360 2008J356
Ocean Scientific International Limited, United Kingdom of34.996 PSU salinity was used in this study. Data were recorded atdifferent PSU levels by controlled dilution of the calibrated sample.
Impedance spectra are commonly analyzed by the method ofequivalent-circuit analysis. Based on the knowledge of the physicalsystem, a suitable circuit is selected and plausible values are as-signed to its components. The circuit response is simulated and com-pared with the experimentally observed response iteratively until aminimum of the squared difference between them is found. Com-plex nonlinear squares CNLS is one such least-squares minimiza-tion technique that fits frequency response or transient data to anequivalent electrical-circuit model.11 LEVM is a CNLS-based fittingand parameter extraction software with numerous circuit andweighting possibilities. The utility of this software for fitting data toa wide range of material responses as well as its details such asweighting possibilities and various distributed circuit elements arecovered in depth by its author.12 This fitting program has been usedin all the fitting carried out in this work. Henceforth it is referred toas CNLS in this paper.
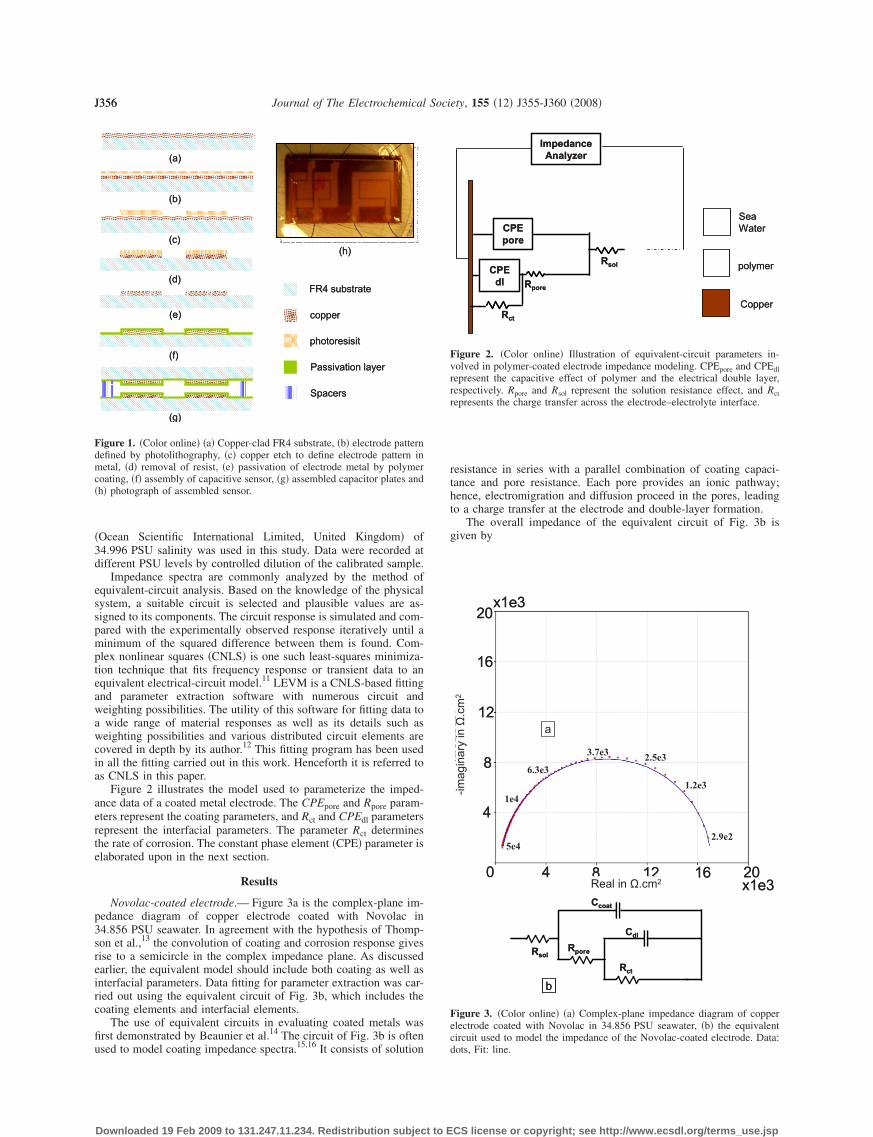
Figure 2 illustrates the model used to parameterize the imped-ance data of a coated metal electrode. The CPEpore and Rpore param-eters represent the coating parameters, and Rct and CPEdl parametersrepresent the interfacial parameters. The parameter Rct determinesthe rate of corrosion. The constant phase element CPE parameter iselaborated upon in the next section.
Results
Novolac-coated electrode.— Figure 3a is the complex-plane im-pedance diagram of copper electrode coated with Novolac in34.856 PSU seawater. In agreement with the hypothesis of Thomp-son et al.,13 the convolution of coating and corrosion response givesrise to a semicircle in the complex impedance plane. As discussedearlier, the equivalent model should include both coating as well asinterfacial parameters. Data fitting for parameter extraction was car-ried out using the equivalent circuit of Fig. 3b, which includes thecoating elements and interfacial elements.
The use of equivalent circuits in evaluating coated metals wasfirst demonstrated by Beaunier et al.14 The circuit of Fig. 3b is oftenused to model coating impedance spectra.15,16 It consists of solution
(g)
(f)
(e)
(d)
(c)
(b)
(a)
(h)
FR4 substrate
copper
photoresisit
Passivation layer
Spacers
(g)
(f)
(e)
(d)
(c)
(b)
(a)
(h)
FR4 substrate
copper
photoresisit
Passivation layer
Spacers
Figure 1. Color online a Copper-clad FR4 substrate, b electrode patterndefined by photolithography, c copper etch to define electrode pattern inmetal, d removal of resist, e passivation of electrode metal by polymercoating, f assembly of capacitive sensor, g assembled capacitor plates andh photograph of assembled sensor.
Downloaded 19 Feb 2009 to 131.247.11.234. Redistribution subject to E
resistance in series with a parallel combination of coating capaci-tance and pore resistance. Each pore provides an ionic pathway;hence, electromigration and diffusion proceed in the pores, leadingto a charge transfer at the electrode and double-layer formation.
The overall impedance of the equivalent circuit of Fig. 3b isgiven by
Copper
polymer
SeaWater
ImpedanceAnalyzer
RporeCPEdl
CPEpore
Rct
Rsol
Copper
polymer
SeaWater
ImpedanceAnalyzer
RporeCPEdl
CPEpore
Rct
Rsol
Figure 2. Color online Illustration of equivalent-circuit parameters in-volved in polymer-coated electrode impedance modeling. CPEpore and CPEdlrepresent the capacitive effect of polymer and the electrical double layer,respectively. Rpore and Rsol represent the solution resistance effect, and Rctrepresents the charge transfer across the electrode–electrolyte interface.
b
a
Rsol RporeRct
2.9e2
Ccoat
1.2e3
2.5e33.7e3
6.3e3
1e4
5e4
Real
-Imaginary
Cdl
4
8
12
16
4 8 12 16x1e3
x1e3
0
20
20Real in Ω.cm2
-imaginaryinΩ.cm2
b
a
Rsol RporeRct
2.9e2
Ccoat
1.2e3
2.5e33.7e3
6.3e3
1e4
5e4
Real
-Imaginary
Cdl
4
8
12
16
4 8 12 16x1e3
x1e3
0
20
20Real in Ω.cm2
-imaginaryinΩ.cm2
Figure 3. Color online a Complex-plane impedance diagram of copperelectrode coated with Novolac in 34.856 PSU seawater, b the equivalentcircuit used to model the impedance of the Novolac-coated electrode. Data:dots, Fit: line.
CS license or copyright; see http://www.ecsdl.org/terms_use.jsp

J357Journal of The Electrochemical Society, 155 12 J355-J360 2008 J357
ZAZ =1
1
Rpore +1
1
Rct+ jCdl
+ jCcoat+ Rsol
where Rpore is the pore resistance, Rct is the charge-transfer resis-tance, Ccoat is the coating capacitance, Cdl is the double-layer ca-pacitance, and Rsol is the solution resistance.
The main disadvantage of the equivalent-circuit approach is thatdifferent combinations of RC elements could lead to the same fre-quency response if appropriate values are assigned to components.This is because of equivalence in electrical networks. Due to theinherent ambiguity associated with equivalent-circuit analysis,17 theEIS experiment was performed with variables such as temperatureand concentration to alleviate this ambiguity.18
Concentration and temperature dependence.— Figure 4a depictsthe complex-plane impedance diagram of the salinity sensor forvarious salinities at room temperature. Figure 4b is the complex-plane impedance response as a function of temperature at34.856 PSU. The plots of Fig. 4a and b were parameterized with theequivalent circuit in Fig. 3b; the parameters are summarized inTables I and II.
Table I contains the extracted parameters of the metal-coatingNovolac-electrolyte system for various salinities, listed in the firstcolumn of Table I. The three resistive elements of the equivalentcircuit, namely, the solution Rsol, charge transfer Rct, and poreresistance Rpore, decrease with increasing salinity. This is due tothe inverse relationship between concentration and resistivity in thecase of Rsol and Rpore. The charge-transfer resistance derives its de-pendence on concentration from the Butler–Volmer BV kinetics,19
where the current depends directly on the concentration and in-versely on the exponential of temperature. Hence, we see a decreasein Rct with concentration. The double-layer capacitance exhibits theexpected increase with salinity.20
Table II contains the extracted parameters of the metal-coating-electrolyte system for various temperatures at 34.856 PSU, listed inthe first column of Table II. The solution and pore resistance inTable II decrease with an increase in temperature, consistent withthe inverse relationship between temperature and resistance. Thecharge–transfer resistance increases with temperature as expectedfrom the BV kinetics equation.
In a study of thermal cycling of polymers for accelerated corro-sion testing, Bierwagen et al.16 indicated that an increase in tempera-ture increases the water uptake of the coating and that elevatedtemperature degrades coating. They listed the effect on individualparameters as i an increase in coating capacity due to an increasein water uptake, ii a decrease in film resistance, iii a decrease incharge-transfer resistance, and iv an increase in double-layer ca-pacity using an equivalent circuit of the type shown in Fig. 3b. Theobservations reported in Tables I and II are consistent with the afore-mentioned observations reported by Bierwagen et al.
Accuflo-coated electrode.— Figure 5a is the complex-plane im-pedance plot of the Accuflo-coated copper electrode. The shape of
Table I. Estimated parameters of circuit in Fig. 3b at various salinitieand resistances are in cm2. The standard deviation (SD) of the pa
Salinity PSUCdl
10−9
%SD10−3Cpore
10−9
%SD10−3
34.85600 1.2199.76 1.8809.0534.89100 1.2289.41 1.8848.9434.92600 1.24111.1 1.86510.534.96100 1.2449.58 1.8749.2534.99600 1.2468.63 1.8998.41
Downloaded 19 Feb 2009 to 131.247.11.234. Redistribution subject to E
the curve indicates a low-frequency CPE process in series with aparallel combination of pore capacitance and pore resistance.
The circuit of Fig. 5b represents a circuit for a good coating,indicated by the absence of charge-transfer resistance, which repre-
ovolac-coated electrode. The units of capacitances are in faradsÕcm2
ter is expressed in brackets.
Rsol102
%SD10−2Rpore
103
%SD10−2Rct
104
%SD10−3
2.1083.01 3.6562.30 1.4866.662.0862.98 3.6422.27 1.4476.511.9983.60 3.4922.56 1.4297.041.9923.17 3.4642.27 1.4055.891.9822.82 3.3962.16 1.3895.76
0 5000 10000 150000
2000
4000
6000
8000
10000
12000
14000
16000
Resistance in Ω.cm2
-Reactancein
Ω.cm2
34.99634.96134.92634.89134.856
0 5000 10000 150000
2000
4000
6000
8000
10000
12000
14000
16000
Resistance in Ω.cm2
-Reactancein
Ω.cm2
20°C25°C30°C35°C40°C
b
a
0 5000 10000 150000
2000
4000
6000
8000
10000
12000
14000
16000
Resistance in Ω.cm2
-Reactancein
Ω.cm2
34.99634.96134.92634.89134.856
0 5000 10000 150000
2000
4000
6000
8000
10000
12000
14000
16000
Resistance in Ω.cm2
-Reactancein
Ω.cm2
20°C25°C30°C35°C40°C
b
a
Figure 4. Color online a Complex-plane impedance diagram of the sa-linity sensor coated with Novolac for various salinities at room temperature.b Complex-plane impedance response as a function of temperature at34.856 PSU.
s for Nrame
CS license or copyright; see http://www.ecsdl.org/terms_use.jsp

J358 Journal of The Electrochemical Society, 155 12 J355-J360 2008J358
sents the corrosion process. This circuit was used to model the im-pedance data of Fig. 5a. The overall impedance of this circuit isgiven by
ZACC = Rsol +1
1
Rpore +1
jndlAdl
+ jncoatAcoat
where is the angular frequency. CPE1 is a CPE which representspore capacitance. The impedance of a CPE is given by the expres-sion 1/A j −n, where A is the magnitude of the element, = 2 pi f is the angular frequency, and f is the frequency in hertz.The parameter n is equal to − 1, where is such that if = 0, theimpedance of a CPE is that of an ideal capacitor, and when = 1,the CPE is a pure resistor. The parameter CPE2 represents the elec-trical double-layer effects. Even though the use of CPE yielded bet-
Table II. Estimated parameters of circuit in Fig. 3b at various tempcapacitances are in faradsÕcm2 and resistances are in cm2. The SD
T °CCdl
10−9
%SD10−3Cpore
10−9
%SD10−3
22 1.1286.67 2.0877.7525 1.1878.84 1.9578.6130 1.2239.96 1.8889.2635 1.29711.3 1.77910.740 1.42513.6 1.60814.3
b
a
1.7e3
2.5e3
5.8e3
1e42e4
Real
-Imaginary
5e4
CPE 1
CPE 2
Rsol
Rpore
2
4
6
8
2 4 6 8x1e6
x1e6
0Real in Ω.cm2
-imaginaryinΩ.cm2
b
a
1.7e3
2.5e3
5.8e3
1e42e4
Real
-Imaginary
5e4
CPE 1
CPE 2
Rsol
Rpore
2
4
6
8
2 4 6 8x1e6
x1e6
0Real in Ω.cm2
-imaginaryinΩ.cm2
Figure 5. Color online a Complex-plane impedance diagram of copperelectrode coated with Accuflo in 34.856 PSU seawater; b the equivalentcircuit used to model the impedance of the Accuflo-coated electrode. Data:dots, Fit: line.
eratures at 34.856 PSU salinity for Novolac-coated electrode. The units ofof the parameter is expressed in brackets.
Rsol102
%SD10−2Rpore
103
%SD10−2Rct
104
%SD10−2
3.4722.13 4.8782.85 1.3149.762.2502.69 3.9322.46 1.3826.731.9823.18 3.5422.34 1.4307.111.5624.48 3.0742.21 1.4797.060.8886.82 2.5602.13 1.5679.86
Downloaded 19 Feb 2009 to 131.247.11.234. Redistribution subject to E
0 5 10x 106
0
2
4
6
8
10
12
x 106
Resistance in Ω.cm2
-Reactancein
Ω.cm2
20°C25°C30°C35°C
0.5 1 1.5 2 2.5x 10⁶
6.55
6.6
6.65
6.7
6.75
6.8
6.85x 10⁶
Resistance in Ω.cm2
-Reactancein
Ω.cm2
20°C25°C30°C35°C
0 5 10x 106
0
2
4
6
8
10
12x 106
Resistance in Ω.cm2
-Reactancein
Ω.cm2
34.99634.96134.92634.89134.856
0.6 0.8 1 1.2 1.4 1.6x 10⁶
5.1
5.15
5.2
5.25
5.3
5.35
5.4x 10⁶
Resistance in Ω.cm2
-Reactancein
Ω.cm2
34.99634.96134.92634.89134.856
0 5 10x 106
0
2
4
6
8
10
12
x 106
Resistance in Ω.cm2
-Reactancein
Ω.cm2
20°C25°C30°C35°C
0.5 1 1.5 2 2.5x 10⁶
6.55
6.6
6.65
6.7
6.75
6.8
6.85x 10⁶
Resistance in Ω.cm2
-Reactancein
Ω.cm2
20°C25°C30°C35°C
0 5 10x 106
0
2
4
6
8
10
12x 106
Resistance in Ω.cm2
-Reactancein
Ω.cm2
34.99634.96134.92634.89134.856
0.6 0.8 1 1.2 1.4 1.6x 10⁶
5.1
5.15
5.2
5.25
5.3
5.35
5.4x 10⁶
Resistance in Ω.cm2
-Reactancein
Ω.cm2
34.99634.96134.92634.89134.856
Figure 6. Color online a Complex-plane impedance diagram of the sa-linity sensor coated with Accuflo for various salinities at room temperature.b Complex-plane impedance response as a function of temperature at34.856 PSU. Insets Zoomed sections of the complex plane plot.
CS license or copyright; see http://www.ecsdl.org/terms_use.jsp

J359Journal of The Electrochemical Society, 155 12 J355-J360 2008 J359
ter quality than using discrete capacitances, the CPE power factor, n,is close to unity, indicating proximity to pure capacitor behavior.The overall impedance response might also be affected by the poly-mer film relaxation,4,21 introducing the slight frequency dependenceto film and interfacial capacity.
Concentration and temperature dependence.— Figure 6a is thecomplex-plane impedance diagram of the salinity sensor passivatedwith Accuflo for various salinities. Figure 6b is the complex imped-ance diagram of the salinity sensor at 34.856 salinity and varyingtemperatures. The plots of Fig. 6a and b were parameterized with theequivalent circuit in Fig. 5b; the parameters are summarized inTables III and IV.
Table III summarizes the impedance parameters of the Accuflo-coated sensor at various salinities. Similar to observations withNovolac-coated electrodes, the resistance parameters decrease withconcentration and the capacitance-related parameters increase withconcentration. The pore resistance is 3 orders of magnitude higher inthe case of Accuflo. This indicates that the pore dimensions in Ac-cuflo are much smaller than the Novolac coating. The magnitude Aof the CPE, which represents the coating capacitance of Accuflo, is2 orders of magnitude smaller than the coating capacitance of No-volac, which indicates much less water uptake in Accuflo than inNovolac. The double-layer CPE magnitude is similarly 2 orders ofmagnitude less for Accuflo, reflecting the relatively small area that isin contact with the electrolyte as compared to Novolac. Table IVlists the parameters of the circuit in Fig. 5b as a function of tem-perature. Consistent with expectations, the pore and solution resis-tance decrease with temperature. The two CPE magnitudes increasewith temperature.
The analysis of temperature and concentration dependence ofimpedance data and the systematic dependence of the model param-eters on these variables, in accordance with theoretical expectations,validate the model for system parameterization.
Discussion
Figure 7 is the photograph of two sensors, one coated with No-volac and the other coated with Accuflo, after 48 h of immersion inocean water. The Novolac coating is severely compromised after48 h exposure to ocean water at room temperature, whereas the
Table III. Estimated parameters of circuit in Fig. 5b at various salinitthe parameter A of CPE is in farad snÕcm2. The parameter n is dim
Salinity PSU
CPE1
A0 10−11
%SD10−210−1
%SD10−3A
%
34.99600 1.0671.82 9.4871.72 1.234.96100 0.9522.45 9.6842.37 1.034.92600 0.9102.55 9.7322.46 1.034.89100 0.8812.77 9.7722.67 1.034.85600 0.8233.07 9.8472.96 1.0
Table IV. Estimated parameters of circuit in Fig. 5b for various tempresistances are in cm2, and the parameter A of CPE is in faradexpressed in brackets.
T °C
CPE1
A0 10−11
%SD10−210−1
%SD10−3A0 1
%SD
22 1.0335.19 105.39 1.10925 1.0551.67 9.4581.52 1.28730 2.0357.49 9.4777.47 0.97035 3.4433.68 8.9123.69 1.502
Downloaded 19 Feb 2009 to 131.247.11.234. Redistribution subject to E
Accuflo coating maintained its structural integrity during the periodof exposure. These observations are consistent with the EIS analysisof the two polymers, where it was found that the pore resistance ofNovolac was 3 orders of magnitude lower than that of Accuflo. Poreresistance is proportional to the cross-sectional dimension of theelectrolytic pathway that connects the electrolyte to the electrodemetal. The shape of the Nyquist plot provides a good inferential toolto predict coating failure. The low-frequency portion of the Nyquistplot of Accuflo is projected away from the real axis, as opposed toNovolac, for which it is approaching the real axis. The approach toreal axis indicates a resistive mechanism at low frequencies, whichis the corrosion mechanism. A straight linelike low-frequency be-havior parallel to the imaginary axis, such as the one seen for Ac-cuflo, indicates a capacitive blocking behavior at low frequencies,which indicate an absence or small amount of corrosion. Thus, vi-sual observation of these plots could be used as visual corrosiondiagnostics.
In Fig. 5b, which is the electrical equivalent circuit for modelingthe Accuflo-coated electrode impedance, the charge-transfer resis-
r Accuflo-coated electrode. The units of resistances are in cm2, andless. The SD of the parameter is expressed in brackets.
CPE2
Rsol103
%SD10−2Rpore
106
%SD10−3−11
0−310−1
%SD10−4
4.92 9.3983.67 1.1743.58 2.5444.624.82 9.5373.56 2.1422.18 3.4724.884.81 9.540357 2.1762.17 3.5964.965.03 9.5423.72 2.2162.24 3.7305.245.19 9.5543.84 2.3662.22 4.0165.55
res at 34.856 PSU salinity for Accuflo-coated electrode. The units of2. The parameter n is dimensionless. The SD of the parameter is
CPE2
Rsol103
%SD10−2Rpore
106
%SD10−310−1
%SD10−4
9.5763.59 3.411.12 5.0306.74 9.3925.94 1.1165.15 2.2048.66 9.760421.9 0.2526.47 1.5462.19 9.4846− — 0.590−
Novolac ACCUFLONovolac ACCUFLO
Figure 7. Color online Photograph of Novolac- and Accuflo-coated elec-trodes after 48 h of immersion in ocean water.
ies foension
0 10SD1
8060606146
eratusnÕcm
0−11
10−3
4.987.973.073.99
CS license or copyright; see http://www.ecsdl.org/terms_use.jsp

J360 Journal of The Electrochemical Society, 155 12 J355-J360 2008J360
tance has been omitted. This is because, in a parallel combination ofelectrical elements, the current has a tendency to travel through theelement, which offers less opposition to its flow. Hence, in the par-allel Rct–Cdl combination, Rct, which is of higher impedance thanthe Cdl, is not a preferred pathway to the passage of current. Theinclusion of this element does not lead to the parameter being welldetermined in the least-squares routine. In impedance spectroscopy,although many elements exist in the electrical model, which ele-ments play a dominant role in the impedance spectrum depends onthe frequency range of the investigation. In the frequency rangeinvestigated in our work, the Rct is large, and hence insignificantcurrent flows through it, leading it to have an insignificant contribu-tion to the impedance data in this frequency range.
An important observation in the four tables is the nearly 2 ordersof magnitude difference between the pore capacitance and double-layer capacitance of Novolac and the magnitude of CPEs represent-ing these quantities in Accuflo. These differences could be ascribedto increased water uptake in Novolac. Water uptake in polymersleads to plasticizing, swelling, and other mechanical and structuralchanges.22 This causes higher coating capacitance23 and larger poresize, leading to higher double-layer capacitance in Novolac.24 Evi-dence for this is found by comparing the pore resistance, which ismuch smaller for Novolac than for Accuflo Tables I and II. Yin andWu,24 Bierwagen et al.,16 and Zahra et al.25 also noted that an in-crease in water uptake is characterized by a decrease in pore andcharge-transfer resistance and an associated increase in double-layerand coating capacitances, which is consistent with the observationsin comparing the parameterized impedance data between Novolacand Accuflo. Water uptake can also lead to degradation of polymerby hydrolysis of the polymer network;22 evidence of such degrada-tion can be seen in Fig. 7, in which the Novolac coating has beenseverely degraded after 48 h of immersion in seawater. In contrast toNovolac, Accuflo, which is spin on glass, has physical and chemicalcharacteristics similar to those of SiO2,26,27 which lends it the sta-bility and structural integrity necessary to function as a barrier coat-ing in a corrosive environment.
Conclusion
The barrier properties of Novolac resin polymer and a commer-cial proprietary polymer, Accuflo, were investigated to determinetheir effectiveness in corrosion protection of electrodes employed inocean salinity sensing. It was found that Novolac coating is porous,allowing access of metal by the electrolyte, while Accuflo exhibitsgood corrosion-protection properties. The pore resistance in Accuflo
Downloaded 19 Feb 2009 to 131.247.11.234. Redistribution subject to E
was determined to be 3 orders of magnitude higher than in Novolac,indicating a dramatic reduction in corrosion pathway. Temperature-and concentration-dependence experiments established the validityof the model selected to represent the experimental data. Opticalobservations correlated well with EIS data in indicating that Accuflowas indeed effective in protecting electrodes in ocean water as com-pared to Novolac. The sensitivity of the salinity sensor reported inthis work was 3.3 k/PSU.
University of South Florida assisted in meeting the publication costs ofthis article.
References1. T. Garrison, Essentials of Oceanography, Brooks/Cole Publishing Company, Bel-
mont, MA 2000.2. P. R. Roberge, Handbook of Corrosion Engineering, McGraw-Hill Professional,
New York 2000.3. N. Bonanos, B. C. H. Steele, and E. P. Butler, in Impedance Spectroscopy, 2nd ed.,
D. J. R. M. Evgenij Barsoukov, Editor, pp. 205–537, John Wiley & Sons, Hoboken,NJ 2005.
4. S. Duval, M. Keddam, M. Sfaira, S. Rhiri, and H. Takenouti, J. Electrochem. Soc.,149, B520 2002.
5. F. Mansfeld, J. Appl. Electrochem., 25, 187 1995.6. F. Mansfeld, Electrochim. Acta, 35, 1533 1990.7. K. M. Yin and H. Z. Wu, Surf. Coat. Technol., 106, 167 1998.8. I. Thompson and D. Campbell, Corros. Sci., 37, 67 1995.9. D. Loveday, P. Peterson, and B. Rodgers, J. Coat. Technol., 15, 137 2004.
10. W. Heerens, J. Phys. E, 15, 137-141 1982.11. J. R. Macdonald, CNLS (Complex Nonlinear Least Squares) Immittance, Inversion,
and Simulation Fitting Programs for MS WINDOWS and MS-DOS, v. 8.07 2005.12. J. R. Macdonald, Solid State Ionics, 58, 97 1992.13. I. Thompson and D. Campbell, Corros. Sci., 37, 67 1995.14. L. Beaunier, I. Epelboin, J. C. Lestrade, and H. Takenouti, Surf. Technol., 4, 237
1976.15. D. Loveday, P. Peterson, and B. Rodgers, J. Coat. Technol., 2, 22 2005.16. G. P. Bierwagen, L. He, J. Li, L. Ellingson, and D. E. Tallman, Prog. Org. Coat.,
39, 67 2000.17. R. Macdonald, Bull. Am. Phys. Soc., 30, 587A 1985.18. R. Macdonald, J. Appl. Phys., 65, 4845 1989.19. A. J. Bard and L. R. Faulkner, Electrochemical Methods: Fundamentals and Ap-
plications, John Wiley & Sons, New York 2001.20. R. Parsons, Chem. Rev. (Washington, DC), 90, 813 1990.21. W. Strunz, C. A. Schiller, and J. Vogelsang, Electrochim. Acta, 51, 1437 2006.22. M. G. McMaster and D. S. Soane, IEEE Trans. Compon., Hybrids, Manuf. Tech-
nol., 12, 373 1989.23. J. T. Zhang, J. M. Hu, J. Q. Zhang, and C. N. Cao, Prog. Org. Coat., 49, 293
2004.24. K. M. Yin and H. Z. Wu, Surf. Coat. Technol., 106, 167 1998.25. Z. Ranjbar, S. Moradian, and M. Attar, Prog. Org. Coat., 51, 87 2004.26. A. Ergul, Master’s thesis, Stockholm, Sweden 2005.27. T. Nguyen nhu, Spin-On Glass: Materials and Applications in Advanced IC Tech-
nologies, http://purl.org/utwente/14094 2008.
CS license or copyright; see http://www.ecsdl.org/terms_use.jsp