Performing Very Low Frequency Capacitance-Voltage ...
15
Performing Very Low Frequency Capacitance-Voltage Measurements on High Impedance Devices Using the 4200A-SCS Parameter Analyzer –– APPLICATION NOTE
-
Upload
khangminh22 -
Category
Documents
-
view
2 -
download
0
Transcript of Performing Very Low Frequency Capacitance-Voltage ...
Performing Very Low Frequency Capacitance-Voltage Measurements on High Impedance Devices Using the 4200A-SCS Parameter Analyzer
––APPLICATION NOTE

2 | WWW.TEK.COM
Performing Very Low Frequency Capacitance-Voltage Measurements on High Impedance Devices Using the 4200A-SCS Parameter Analyzer
APPLICATION NOTE
IntroductionCapacitance measurements on semiconductor devices
are usually made using an AC technique with a bridge-
type instrument. These AC instruments typically make
capacitance and impedance measurements at frequencies
ranging from megahertz down to possibly tens of hertz.
However, even lower frequency capacitance measurements
are often necessary to derive specific test parameters of
devices such as MOScaps, thin film transistors (TFTs), and
MEMS structures. Low frequency C-V measurements are
also used to characterize the slow trapping and de-trapping
phenomenon in some materials. Instruments capable of
making quasistatic (or almost DC) C-V measurements are
often used for these low frequency impedance applications.
However, the 4200A-SCS Parameter Analyzer uses a
new narrow-band technique that takes advantage of
the low current measurement capability of its integrated
source measure unit (SMU) instruments to perform C-V
measurements at specified low frequencies in the range of
10 mHz to 10 Hz. This new method is called the Very Low
Frequency C-V (VLF C-V) Technique.
The VLF C-V Technique makes it possible to measure
very small capacitances at a precise low test frequency.
This patent-pending, narrow-band sinusoidal technique
allows for low frequency C-V measurements of very high
impedance devices, up to >1E15 ohms. Other AC impedance
instruments are usually limited to impedances up to about
1E6 to 1E9 ohms. The VLF C-V approach also reduces the
noise that may occur when making traditional quasistatic C-V
measurements.
The 4200A-SCS Parameter Analyzer comes with
preconfigured tests and a user library to perform impedance
measurements automatically using this very low frequency
technique. Because this approach uses the 4200A-SCS’s
SMU instruments, no additional hardware or software is
necessary if low current I-V characterization is already
required. This application note describes the VLF C-V
technique, explains how to make connections to the DUT,
shows how to use the provided software, and describes
optimizing VLF C-V measurements using the 4200A-SCS.
Very Low Frequency C-V TechniqueFigure 1 is a simplified diagram of the SMU instrument
configuration used to generate the low frequency impedance
measurements. This configuration requires a 4200A-SCS
system with two SMU instruments installed, with 4200-PA
preamps connected to either side of the device under test.
SMU1 outputs the DC bias with a superimposed AC signal
and also measures the voltage. SMU2 measures the resulting
AC current while sourcing 0 V DC.
Force HI Force HI
A
Force LO
Capacitor
Test Device
(Internally Connected)
A SMU2smu_sense
SMU1 with preamp:Outputs DCV with
superimposed ACV andmeasures AC voltage.
SMU2 with preamp:Measures AC current
at 0 V DC.
SMU1smu_src
Figure 1. Connections for very low frequency C-V measurements.
Basically, while the voltage is forced, voltage and current
measurements are obtained simultaneously over several
cycles. The magnitude and phase of the DUT impedance is
extracted from the discrete Fourier transform (DFT) of a ratio
of the resultant voltage and current sinusoids. This narrow-
band information can be collected at varying frequencies
(10mHz to 10Hz) to create a complex, multi-element of the
DUT. The resulting output parameters include the impedance
(Z), phase angle (θ), capacitance (C), conductance (G),
resistance (R), reactance (X), and the dissipation factor (D).
WWW.TEK.COM | 3
APPLICATION NOTEPerforming Very Low Frequency Capacitance-Voltage Measurements on High Impedance Devices Using the 4200A-SCS Parameter Analyzer
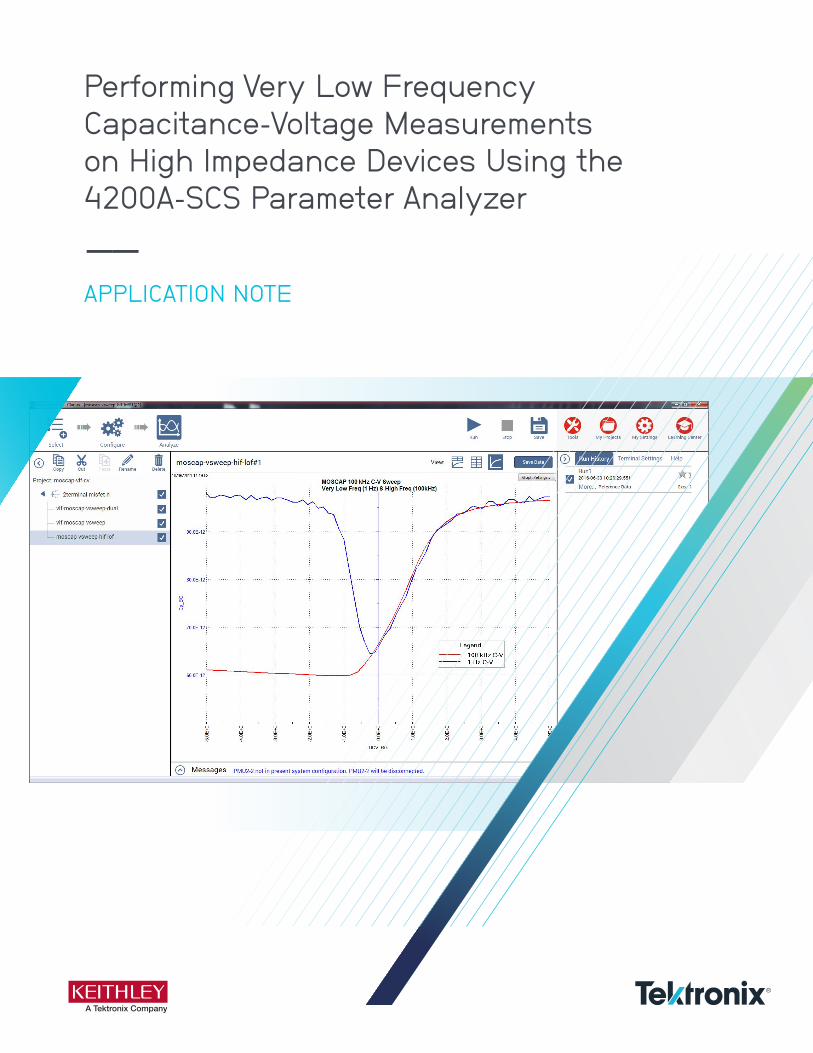
Because the very low frequency method works over a
limited frequency range, the capacitance of the device under
test (DUT) should be in the range of 1pF to 10nF. Table 1
summarizes the VLF C-V specifications (see Appendix A for
complete specifications).
Table 1. Very Low Frequency C-V specifications.
Measurement Parameters Cp, Gp, F, Z, θ, R, X, Cs, Rs, D, time
Frequency Range 10 mHz to 10 Hz
Measurement Range 1 pF to 10 nF
Typical Resolution 3.5 digits, minimum typical 10 fF
AC Signal 10 mV to 3 V RMS
DC Bias±20 V on the High terminal, minus the AC signal, 1 µA maximum
Required Hardware for VLF C-V MeasurementsTo make very low frequency impedance measurements, the
following hardware is required:
• 4200A-SCS with Clarius software
• Two SMU instruments (4200-SMU, 4201-SMU, 4210-SMU, or 4211-SMU)
• Two 4200-PA Preamps
• Optional: 4210-CVU or 4215-CVU Capacitance Voltage Unit (CVU) for making high frequency C-V measurements
Making Connections to the DeviceTo make VLF C-V measurements on a device, connect
the DUT between the two Force HI terminals of two SMU
instruments (4200-SMU, 4201-SMU, 4210-SMU or 4211-SMU)
with 4200-PA Preamps (Figures 1, 2). The preamp option is
necessary because measuring very high impedances requires
measuring very small currents. With the 4200-PAs, currents
of <1E-12A can be measured. Because the VLF C-V method
requires measuring small currents, it is best to use the triax
cables that come with the SMU instruments to make these
connections. The method does not support any switching
instrumentation between the SMU instrument preamp and
the device under test (DUT). One SMU outputs both the DC
and AC voltage (SMU1 in Figures 1 and 2) and measures
the AC voltage. The other SMU instrument measures the AC
current (SMU2 in Figures 1 and 2). The SMU instrument used
to measure the AC current should be connected to the high
impedance terminal of the device (Figure 2).
Force HI Force HI
A
Force LO
Prober Chuck
MOSCaps on wafer
PreAmp PreAmp
(Internally Connected)
A SMU2smu_sense
smr.src is connectedto the chuck. This SMUapplies the DC and ACvoltage and measures
the voltage.
smu_sense isconnected to the gateof the MOScap and
measures the current.
SMU1smu_src
Figure 2. VLF C-V measurement setup for a MOScap on wafer.
An example of a MOSCap circuit connected for VLF C-V
measurements is shown in Figure 2. Most MOSCaps have
only a single pad on the top of the wafer, with the backside
of the wafer used as the common contact for all MOSCaps.
SMU1 outputs the AC+DC voltage and is connected to
the chuck. The SMU that outputs the voltage is known as
“smu_src” in the software that is included with the system.
The high impedance terminal of the MOSCap is the gate
and is connected to SMU2, which is called “smu_sense” in
the software.
Using the Clarius Software to Perform VLF C-V MeasurementsThe system includes a user library called VLowFreqCV that
contains several user modules that you can use to make low
frequency C-V measurements. Clarius includes example tests
and projects that are based on these user modules that you
can use as templates to develop tests. The example tests and
projects are available in the Library.
You can also build custom tests using these user modules.
The VLowFreqCV User Library contains several modules,
4 | WWW.TEK.COM
Performing Very Low Frequency Capacitance-Voltage Measurements on High Impedance Devices Using the 4200A-SCS Parameter Analyzer
APPLICATION NOTE
listed in Table 2, that can be used in a test in a project. To
build a custom test, in the Library, select Custom Test and
select the option “Choose a test from the pre-programmed
library (UTM)”. Select Configure. In the right pane, for the
User Library, select VLowFreqCV User Library and then
select the appropriate User Module.
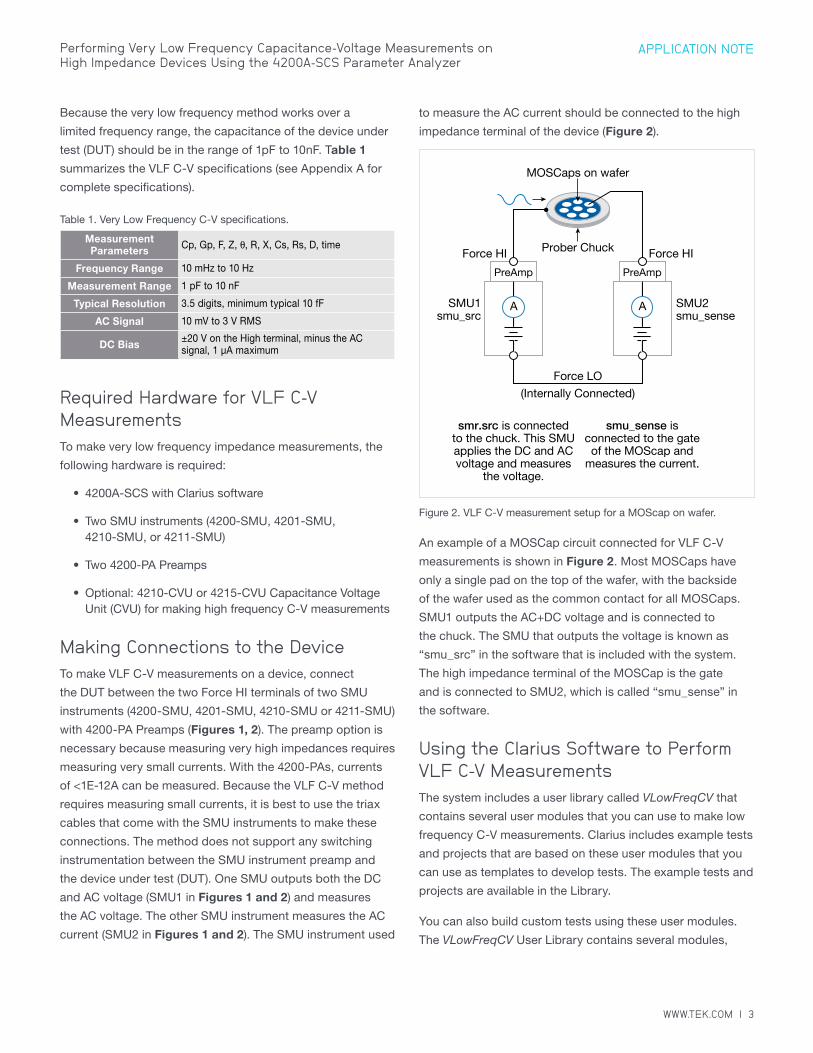
Figure 3. Screen capture of vlfcv_measure_dual_sweep_bias_fixed_range user module
Table 2. User Modules in the VLowFreqCV User Library.
User Module Description
vlfcv_measure Measures C, G, Z, theta, R+jX at a fixed DC bias.
vlfcv_measure_dual_sweep_bias
Measures C, G, Z, theta, R+jX, time while sweeping the DC voltage. Optional dual sweep allows sweeping from dcv_bias_start to dcv_bias_stop, with 1 measure point at dcv_bias_stop, then back down to dcv_bias_start.
vlfcv_measure_dual_sweep_bias_fixed_range
Measures C, G, Z, theta, R+jX, time while sweeping the DC voltage. Measurements are made on a fixed current range which is determined by the expected_C, expected_R and maximum DC voltage. Optional dual sweep allows sweeping from dcv_bias_start to dcv_bias_stop, with 1 measure point at dcv_bias_stop, then back down to dcv_bias_start.
vlfcv_measure_sweep_freq
Measures C, G, Z, theta, R+jX, time at multiple user-specified test frequencies.
vlfcv_measure_sweep_time
Measures C, G, Z, theta, R+jX, time as a function of time.
Once you’ve added a new module to a project, you need
to input a few parameters. Many of the parameters are
common to all the modules; however, each module has some
unique parameters. Figure 3 illustrates the Key Parameters
view of the vlfcv_measure_dual_sweep_bias_fixed_range
User Module showing all the user-defined parameters. The
adjustable parameters for all the modules are listed in Tables
3 through 6.
The values of the expected capacitance (expected_C) and
the expected parallel resistance (expected_R) determine
which current range will be used to make the measurement.
However, choosing specific values is generally not required,
as setting expected_C = 0 will allow the test routines to
estimate the C and R to use.
The simplest module is vlfcv_measure. It is used in the
Capacitor VLF C-V Measurement (vlf-cap-one-point) test in
the Capacitor VLF-CV Project. This test performs a single
measurement. The module does not perform any sweeping,
but it allows for all test parameters to be controlled (Table 3).
Note that the maximum voltage possible is a combination
of both the AC and DC voltages. The maximum negative DC
WWW.TEK.COM | 5
APPLICATION NOTEPerforming Very Low Frequency Capacitance-Voltage Measurements on High Impedance Devices Using the 4200A-SCS Parameter Analyzer
bias voltage = –20 + (acv_RMS * √__2). The maximum positive
DC bias voltage = +20 – (acv_RMS * √__2). Use expected_C = 0
to have the routine auto-detect the estimated C and R values.
Table 3. Adjustable parameters in vlfcv_measure User Module.
Parameter Range Description
smu_src SMUnSMU instrument to source DC + AC voltage waveform and measure AC volts: SMU1, SMU2, SMU3…
smu_sense SMUn SMU t instrument o measure AC current: SMU1, SMU2, SMU3…
frequency 0.01 to 10 Test frequency in hertz, from 0.01 to 10.
expected_C 1e-12 to 1e-8 Estimate of DUT capacitance in Farads, use 0 for auto-detect of DUT C and R.
expected_R 1e6 to 1e14 Estimate of resistance parallel to DUT, in ohms
acv_RMS 30e-3 to 3 AC drive voltage in volts RMS
dcv_bias ±20 less (acv_RMS * √
_2) The DC voltage applied to the device
Table 4. Adjustable parameters in the vlfcv_measure_dual_sweep_bias_fixed_range User Modules.
Parameter Range Description
smu_src SMUnSMU instrument to source DC + AC voltage waveform and measure AC volts: SMU1, SMU2, SMU3…
smu_sense SMUn SMU instrument to measure AC current: SMU1, SMU2, SMU3…
frequency 0.01 to 10 Test frequency in hertz, from 0.01 to 10.
expected_C 1e-12 to 1e-8 Estimate of DUT capacitance in Farads, use 0 for auto-detect of DUT C and R.
expected_R 1e6 to 1e14 Estimate of resistance parallel to DUT, in ohms
acv_RMS 30e-3 to 3 AC drive voltage in volts RMS
dcv_start ±20 less (acv_RMS * √
_2) Starting DC voltage of the sweep
dcv_stop ±20 less (acv_RMS * √
_2) Stop DC voltage of the sweep
dcv_step ±20 less (acv_RMS * √
_2)
Step size of the DC voltage. Number of steps limited to 512.
dual_sweep 0 or 1 Enter 0 for single sweep; enter 1 for dual sweep
Table 5. Adjustable parameters in the vlfcv_measure_dual_sweep_freq user module.
Parameter Range Description
smu_src SMUnSMU instrument to source DC + AC voltage waveform and measure AC volts: SMU1, SMU2, SMU3…
smu_sense SMUn SMU instrument to measure AC current: SMU1, SMU2, SMU3…
frequency 0.01 to 10Array of Test frequencies in Hertz. Maximum number of entries limited to 512, from 0.01 to 10.
expected_C 1e-12 to 1e-8 Estimate of DUT capacitance in Farads, use 0 for auto-detect of DUT C and R.
expected_R 1e6 to 1e14 Estimate of resistance parallel to DUT, in ohms
acv_RMS 30e-3 to 3 AC drive voltage in volts RMS
dcv_bias ±20 less (acv_RMS * √
_2) The DC Voltage applied to the device
Table 6. Adjustable parameters in the vlfcv_measure_sweep_time user module.
Parameter Range Description
smu_src SMUnSMU instrument to source DC + AC voltage waveform and measure AC volts: SMU1, SMU2, SMU3…
smu_sense SMUn SMU instrument to measure AC current: : SMU1, SMU2, SMU3…
frequency 0.01 to 10 Test frequency in Hertz, from 0.01 to 10.
expected_C 1e-12 to 1e-8 Estimate of DUT capacitance in Farads, use 0 for auto-detect of DUT C and R.
expected_R 1e6 to 1e14 Estimate of resistance parallel to DUT, in ohms
acv_RMS 30e-3 to 3 AC drive voltage in volts RMS
dcv_bias ±20 less (acv_RMS * √
_2) The DC Voltage applied to the device
num_points 1 to 512 Number of points to take as a function of time
Once any test is executed, several test parameters will be
returned to the Sheet in the Analyze view and can be saved
as an .xls file. These test parameters can also be plotted on
the Graph. Table 7 lists the returned test parameters and
their descriptions. From these returned test parameters, more
device extractions can be performed using the mathematical
functions in the Formulator. Note that the tests return all
typical C-V measurement parameters. For example, both
Cp-Gp and Cs-Rs are always returned, even if the test device
response only matches the parallel (Cp-Gp).

6 | WWW.TEK.COM
Performing Very Low Frequency Capacitance-Voltage Measurements on High Impedance Devices Using the 4200A-SCS Parameter Analyzer
APPLICATION NOTE
Table 7. Measurements returned for the modules in the VLowFreqCV Library.
Returned Test Parameters Description
StatusError code from test module execution. Definitions of the returned errors are listed at the bottom of the Definition tab in the UTM Description.
times Calculated time difference between readings.
dcv_bias Programmed DC voltage applied to the device.
meas_Cp Measured capacitance in parallel (Cp-Gp).
meas_Gp Measured conductance in parallel (Cp-Gp)
meas_freq Measured test frequency.
meas_Z Measured impedance (Z-theta).
meas_Theta Measured phase angle in degrees (Z-theta).
meas_R Real component of the impedance (R + jX).
meas_X Imaginary component of the impedance (R + jX).
meas_Cs Measured AC capacitance in series (Cs-Rs).
meas_Rs Measured resistance in series (Cs-Rs).
meas_D Calculated dissipation factor, D.
meas_irange The SMU instrument current range that the measurement was taken.
Using the Example Tests and Projects in the LibraryThe Clarius software comes with example tests of very low
frequency C-V measurements on various devices. Choose
Select to search for the examples in either the Test or Project
Libraries. Enter VLF in the search box from either the Test
or Project tab. The Tests or Projects will automatically be
displayed in the Library. Select the desired Test or Project
and add it to the Project tree on the left. Even though the
test and projects were created using specific devices, these
examples can be used on other devices. Descriptions of the
very low frequency C-V projects that can be found in the
Project Library are described in the following paragraphs.
Figure 4. Project tree of MOSFET VLF-CV project
MOSFET VLF-CV Project
In the MOSFET VLF-CV Project, there are three tests for
the n-fet devices, as shown in Figure 4. Figure 6 shows
the results of generating a very low frequency dual C-V
sweep on an n-MOSFET measured between the Gate
terminal and the Drain/Source/Bulk terminals tied together
(Figure 5). This C-V sweep was generated using the
MOSFET VLF-CV Sweep (vlf-nmosfet-vsweep-dual) test.
Tests for measuring capacitance as a function of frequency
(vlf-nmostfet-freq-sweep), as well as a high frequency C-V
test (cvu-nmostfet, taken with the CVU) are also included in
the project.
DUT
GDS
B
SMU 1
FORCESENSE
SMU 2Triax cable
Force
PreAmp
PreAmp
FORCESENSE
Triax cableForce
smu_sense
smu_src
Figure 5. Connection for MOSFET with the gate connected to SMU2 and, with the drain-source-bulk tied together and connected to SMU1 (smu_sense).
Figure 6. VLF C-V Sweep of an n-MOSFET measured between the gate to drain/source/bulk. This graph is from the vlf_nmosfet_vsweep_dual test (user module vlfcv_measure_dual_sweep_bias_fixed_range).

WWW.TEK.COM | 7
APPLICATION NOTEPerforming Very Low Frequency Capacitance-Voltage Measurements on High Impedance Devices Using the 4200A-SCS Parameter Analyzer
Capacitor VLF-CV Project
Using the VLF C-V method, capacitors can be measured
in the range of 1 pF to 10 nF, and connections are made as
shown in Figure 7. The project has four tests for measuring
capacitors (Figure 8). The Capacitor VLF-CV C-t Sweep (vlf-
cap-time) Test measures the capacitance of a 1pF capacitor
as a function of time (Figure 9). The results of performing
a C-V sweep on a 1 pF capacitor are shown in Figure 10.
This small capacitance was measured at a test frequency of
1 Hz with capacitance measurement noise levels at less than
±5E-15F. The Formulator can be used to determine the noise
and average capacitance readings easily.
SMU 1smu_src
FORCESENSE
SMU 2smu_sense
Triax cableForce
PreAmp
PreAmp
FORCESENSE
Triax cableForce
DUT
Figure 7. VLF C-V connections for the capacitor. If the test device is on wafer, see the MOSCap diagram (Figure 2) for connections.
Figure 8. Capacitor tests in the Capacitor VLF-CV Project.
Figure 9. Results of C-t measurements of nominal 1 pF reference capacitor, using VLF capacitance technique at a test frequency of 1 Hz. This graph is from the vlf-cap-time test (user module vlfcv_measure_sweep_time).
Figure 10. VLF C-V results, at 1 Hz, of a voltage sweep on a 1 pF reference capacitor. This graph is from the vlf-cap-vsweep test (vlfcv_measure_dual_sweep_bias_fixed_range user module).
8 | WWW.TEK.COM
Performing Very Low Frequency Capacitance-Voltage Measurements on High Impedance Devices Using the 4200A-SCS Parameter Analyzer
APPLICATION NOTE
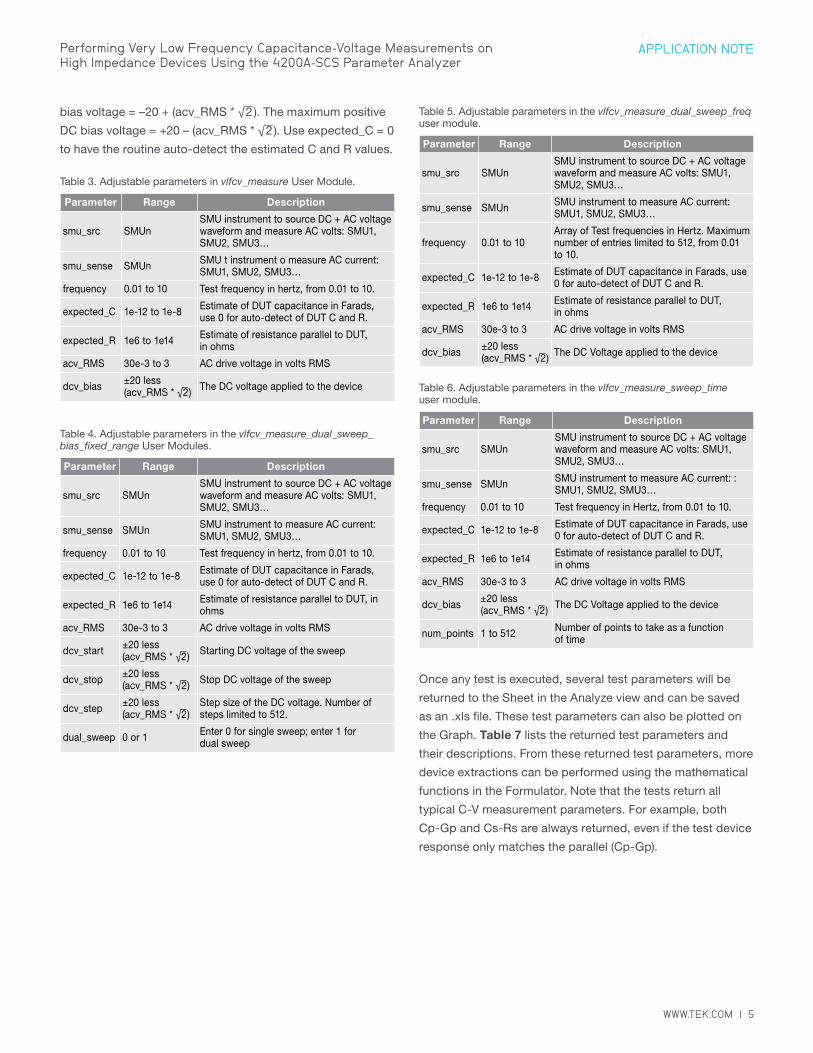
Figure 11. A VLF C-V sweep of a MOScap at various frequences from 100mHz to 10Hz created using the MOS Capacitor VLF-CV Project. This graph is from the vlf-moscap-vsweep-dual test (vlfcv_measure_sweep_bias_fixed_range user module).
MOS Capacitor VLF-CV Project
The MOScap Project has three tests; all are DC bias sweeps
with two using SMUs for the VLF C-V test DC bias voltage
sweep (vlf-moscap-vsweep-dual and vlf-moscap-vsweep)
and the other using the 4210-CVU or 4215-CVU for higher
frequency testing (cvu-moscap-vsweep). An example of
a MOScap VLF-CV dual sweep generated with various
test frequencies ranging from 0.1 Hz to 10 Hz is shown in
Figure 11. This test was performed on a chuck at room
temperature. This sweep is the result of executing the
vlf-moscap-vsweep-dual test in the project. From the low
frequency C-V data, characteristics about the MOScap can
be determined. The built-in math functions are helpful in
performing the analysis of these devices from the C-V data.
The connection diagram for the MOSCap is shown in Figure
2. The dual sweep functionality aids in determining any
hysteresis behavior in the inversion region of the MOScap
device, where frequency dependence is also observed. Note
that the SMU instrument measuring the low current is not
connected to the chuck. Connecting the sensitive (i.e., low-
current measurement) instrument to the chuck will result in
noisier measurements.
In addition to the test that generates VLF C-V measurements
on the MOScap, the project includes a test to measure high
frequency C-V on the MOScap. The high frequency C-V
measurements were generated using the CVU, which has a
test frequency range of 1 kHz to 10 MHz, with the example
data taken at 100 kHz.
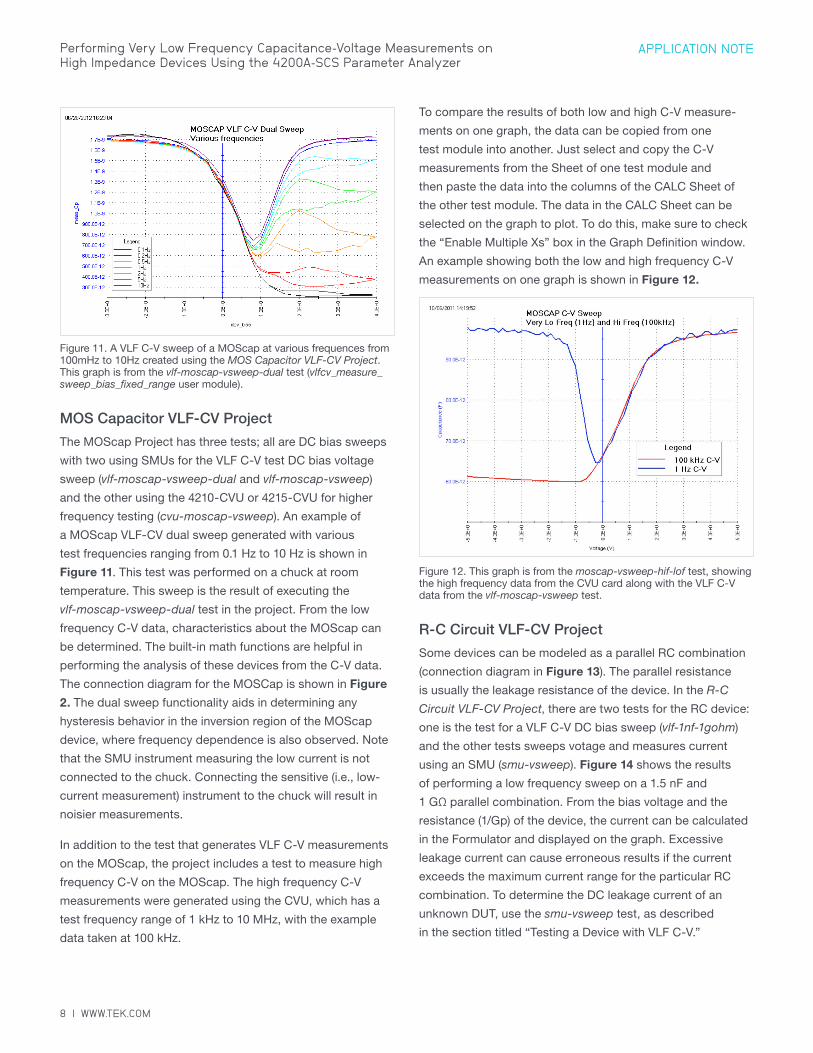
To compare the results of both low and high C-V measure-
ments on one graph, the data can be copied from one
test module into another. Just select and copy the C-V
measurements from the Sheet of one test module and
then paste the data into the columns of the CALC Sheet of
the other test module. The data in the CALC Sheet can be
selected on the graph to plot. To do this, make sure to check
the “Enable Multiple Xs” box in the Graph Definition window.
An example showing both the low and high frequency C-V
measurements on one graph is shown in Figure 12.
Figure 12. This graph is from the moscap-vsweep-hif-lof test, showing the high frequency data from the CVU card along with the VLF C-V data from the vlf-moscap-vsweep test.
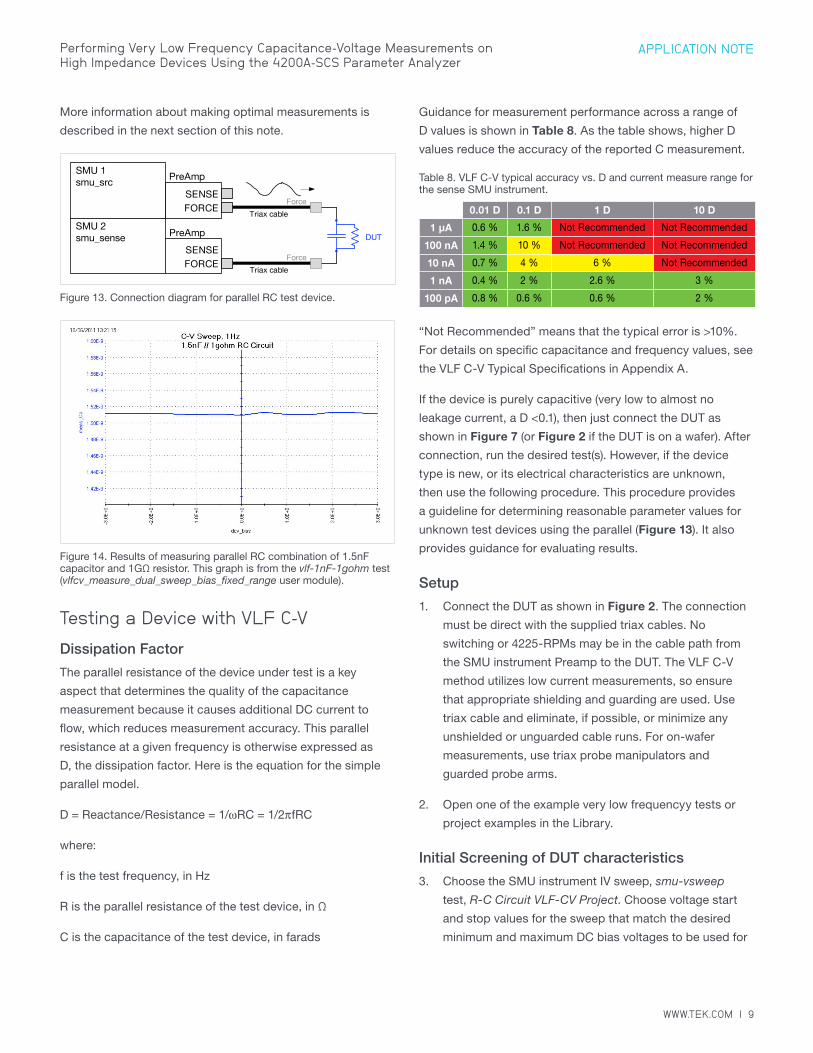
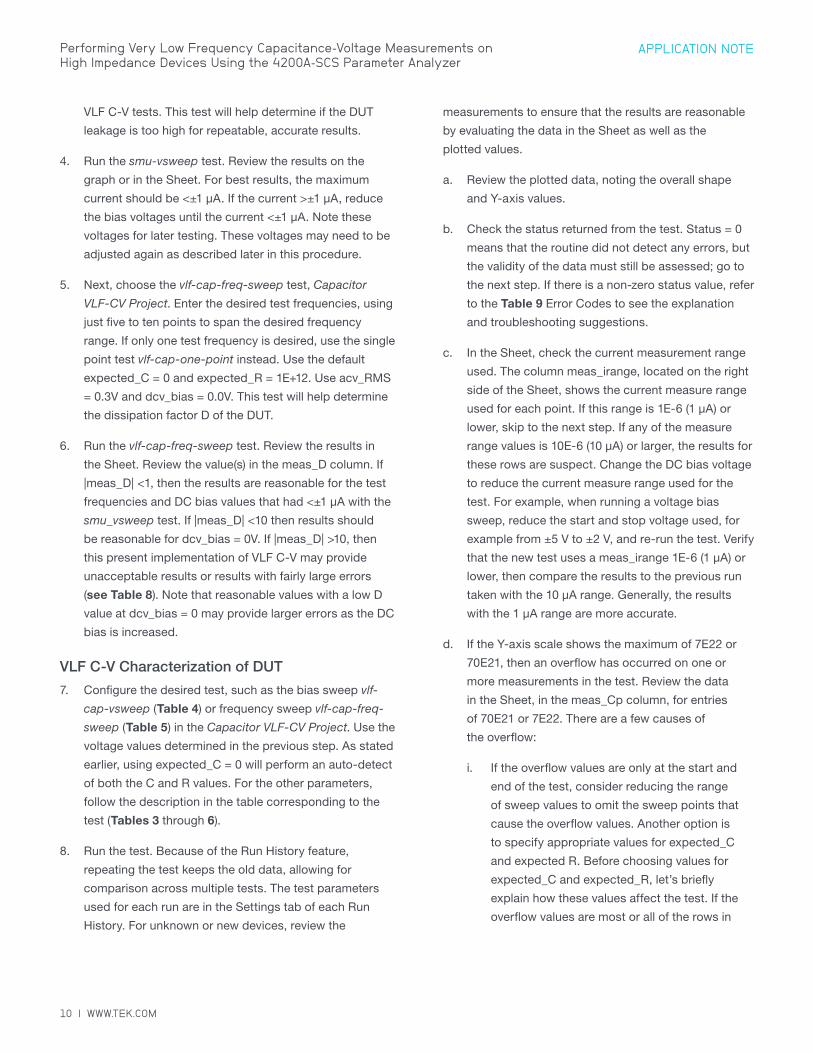
R-C Circuit VLF-CV Project
Some devices can be modeled as a parallel RC combination
(connection diagram in Figure 13). The parallel resistance
is usually the leakage resistance of the device. In the R-C
Circuit VLF-CV Project, there are two tests for the RC device:
one is the test for a VLF C-V DC bias sweep (vlf-1nf-1gohm)
and the other tests sweeps votage and measures current
using an SMU (smu-vsweep). Figure 14 shows the results
of performing a low frequency sweep on a 1.5 nF and
1 GΩ parallel combination. From the bias voltage and the
resistance (1/Gp) of the device, the current can be calculated
in the Formulator and displayed on the graph. Excessive
leakage current can cause erroneous results if the current
exceeds the maximum current range for the particular RC
combination. To determine the DC leakage current of an
unknown DUT, use the smu-vsweep test, as described
in the section titled “Testing a Device with VLF C-V.”
WWW.TEK.COM | 9
APPLICATION NOTEPerforming Very Low Frequency Capacitance-Voltage Measurements on High Impedance Devices Using the 4200A-SCS Parameter Analyzer
More information about making optimal measurements is
described in the next section of this note.
SMU 1smu_src
FORCESENSE
SMU 2smu_sense
Triax cableForce
PreAmp
PreAmp
FORCESENSE
Triax cableForce
DUT
Figure 13. Connection diagram for parallel RC test device.
Figure 14. Results of measuring parallel RC combination of 1.5nF capacitor and 1GΩ resistor. This graph is from the vlf-1nF-1gohm test (vlfcv_measure_dual_sweep_bias_fixed_range user module).
Testing a Device with VLF C-V
Dissipation Factor
The parallel resistance of the device under test is a key
aspect that determines the quality of the capacitance
measurement because it causes additional DC current to
flow, which reduces measurement accuracy. This parallel
resistance at a given frequency is otherwise expressed as
D, the dissipation factor. Here is the equation for the simple
parallel model.
D = Reactance/Resistance = 1/ωRC = 1/2πfRC
where:
f is the test frequency, in Hz
R is the parallel resistance of the test device, in Ω
C is the capacitance of the test device, in farads
Guidance for measurement performance across a range of
D values is shown in Table 8. As the table shows, higher D
values reduce the accuracy of the reported C measurement.
Table 8. VLF C-V typical accuracy vs. D and current measure range for the sense SMU instrument.
0.01 D 0.1 D 1 D 10 D
1 µA 0.6 % 1.6 % Not Recommended Not Recommended
100 nA 1.4 % 10 % Not Recommended Not Recommended
10 nA 0.7 % 4 % 6 % Not Recommended
1 nA 0.4 % 2 % 2.6 % 3 %
100 pA 0.8 % 0.6 % 0.6 % 2 %
“Not Recommended” means that the typical error is >10%.
For details on specific capacitance and frequency values, see
the VLF C-V Typical Specifications in Appendix A.
If the device is purely capacitive (very low to almost no
leakage current, a D <0.1), then just connect the DUT as
shown in Figure 7 (or Figure 2 if the DUT is on a wafer). After
connection, run the desired test(s). However, if the device
type is new, or its electrical characteristics are unknown,
then use the following procedure. This procedure provides
a guideline for determining reasonable parameter values for
unknown test devices using the parallel (Figure 13). It also
provides guidance for evaluating results.
Setup
1. Connect the DUT as shown in Figure 2. The connection
must be direct with the supplied triax cables. No
switching or 4225-RPMs may be in the cable path from
the SMU instrument Preamp to the DUT. The VLF C-V
method utilizes low current measurements, so ensure
that appropriate shielding and guarding are used. Use
triax cable and eliminate, if possible, or minimize any
unshielded or unguarded cable runs. For on-wafer
measurements, use triax probe manipulators and
guarded probe arms.
2. Open one of the example very low frequencyy tests or
project examples in the Library.
Initial Screening of DUT characteristics
3. Choose the SMU instrument IV sweep, smu-vsweep
test, R-C Circuit VLF-CV Project. Choose voltage start
and stop values for the sweep that match the desired
minimum and maximum DC bias voltages to be used for
10 | WWW.TEK.COM
Performing Very Low Frequency Capacitance-Voltage Measurements on High Impedance Devices Using the 4200A-SCS Parameter Analyzer
APPLICATION NOTE
VLF C-V tests. This test will help determine if the DUT
leakage is too high for repeatable, accurate results.
4. Run the smu-vsweep test. Review the results on the
graph or in the Sheet. For best results, the maximum
current should be <±1 µA. If the current >±1 µA, reduce
the bias voltages until the current <±1 µA. Note these
voltages for later testing. These voltages may need to be
adjusted again as described later in this procedure.
5. Next, choose the vlf-cap-freq-sweep test, Capacitor
VLF-CV Project. Enter the desired test frequencies, using
just five to ten points to span the desired frequency
range. If only one test frequency is desired, use the single
point test vlf-cap-one-point instead. Use the default
expected_C = 0 and expected_R = 1E+12. Use acv_RMS
= 0.3V and dcv_bias = 0.0V. This test will help determine
the dissipation factor D of the DUT.
6. Run the vlf-cap-freq-sweep test. Review the results in
the Sheet. Review the value(s) in the meas_D column. If
|meas_D| <1, then the results are reasonable for the test
frequencies and DC bias values that had <±1 µA with the
smu_vsweep test. If |meas_D| <10 then results should
be reasonable for dcv_bias = 0V. If |meas_D| >10, then
this present implementation of VLF C-V may provide
unacceptable results or results with fairly large errors
(see Table 8). Note that reasonable values with a low D
value at dcv_bias = 0 may provide larger errors as the DC
bias is increased.
VLF C-V Characterization of DUT
7. Configure the desired test, such as the bias sweep vlf-
cap-vsweep (Table 4) or frequency sweep vlf-cap-freq-
sweep (Table 5) in the Capacitor VLF-CV Project. Use the
voltage values determined in the previous step. As stated
earlier, using expected_C = 0 will perform an auto-detect
of both the C and R values. For the other parameters,
follow the description in the table corresponding to the
test (Tables 3 through 6).
8. Run the test. Because of the Run History feature,
repeating the test keeps the old data, allowing for
comparison across multiple tests. The test parameters
used for each run are in the Settings tab of each Run
History. For unknown or new devices, review the
measurements to ensure that the results are reasonable
by evaluating the data in the Sheet as well as the
plotted values.
a. Review the plotted data, noting the overall shape
and Y-axis values.
b. Check the status returned from the test. Status = 0
means that the routine did not detect any errors, but
the validity of the data must still be assessed; go to
the next step. If there is a non-zero status value, refer
to the Table 9 Error Codes to see the explanation
and troubleshooting suggestions.
c. In the Sheet, check the current measurement range
used. The column meas_irange, located on the right
side of the Sheet, shows the current measure range
used for each point. If this range is 1E-6 (1 µA) or
lower, skip to the next step. If any of the measure
range values is 10E-6 (10 µA) or larger, the results for
these rows are suspect. Change the DC bias voltage
to reduce the current measure range used for the
test. For example, when running a voltage bias
sweep, reduce the start and stop voltage used, for
example from ±5 V to ±2 V, and re-run the test. Verify
that the new test uses a meas_irange 1E-6 (1 µA) or
lower, then compare the results to the previous run
taken with the 10 µA range. Generally, the results
with the 1 µA range are more accurate.
d. If the Y-axis scale shows the maximum of 7E22 or
70E21, then an overflow has occurred on one or
more measurements in the test. Review the data
in the Sheet, in the meas_Cp column, for entries
of 70E21 or 7E22. There are a few causes of
the overflow:
i. If the overflow values are only at the start and
end of the test, consider reducing the range
of sweep values to omit the sweep points that
cause the overflow values. Another option is
to specify appropriate values for expected_C
and expected R. Before choosing values for
expected_C and expected_R, let’s briefly
explain how these values affect the test. If the
overflow values are most or all of the rows in
WWW.TEK.COM | 11
APPLICATION NOTEPerforming Very Low Frequency Capacitance-Voltage Measurements on High Impedance Devices Using the 4200A-SCS Parameter Analyzer
the meas_Cp column, it is possible that an
incorrect measure range was used for the test.
This means that the current measure range used
for the test was too small for the test parameters
and DUT. The measure range used for the test
is contained in the meas_irange in the Sheet.
The current measure range for the sense SMU
instrument is based on the expected_C and
expected_R values.
ii. To change the current measure range for a test,
supply an expected_C value that is larger than
the meas_Cp value. Review the values in the
meas_Cp column and choose a representative,
non-overflow value and use it to calculate the
expected_C = 2 * chosen meas_Cp value. To
choose a value for expected_R, review the
meas_Gp column for a representative value. Set
expected_R = 1/(2 * chosen meas_Gp).
e. If one or more of the meas_Cp values is negative:
i. Ensure that the DUT connections are good.
ii. The D may be too high, or the DC current
leakage is too high compared to the
capacitance.
1. Review the Sheet for meas_D and meas_
irange values. If D > ~10 and or meas_
irange is ≥10 nA, the results may have a
larger error.
2. Consult Table 8. Compare the current
measure range (in the meas_irange) column
to the corresponding row in Table 8.
Note that the higher D values are more
difficult to test.
3. Try one or more of the following
adjustments: a) reduce the DC bias voltage;
b) increase the acv_RMS = 0.3 V; c)
increase the test frequency.
4. If the meas_Cp values seem noisy or
inconsistent, append several tests with
identical parameter values and review the
data. If the results are different across
each run, this indicates that the system is
operating at or near the noise floor, which
means that the capacitance value of the
test device is small, or the test device has a
higher D value (Table 8).
5. If none of these adjustments provides
reasonable results, try a higher frequency
C-V test using the CVU, if available.
9. Add tests, such as the capacitance vs. time (test vlf-
cap-time) or more DC bias sweeps at additional test
frequencies. Recall that data may be saved in .xls or
.csv file formats by using the Save Data button in the
Analyze pane.
12 | WWW.TEK.COM
Performing Very Low Frequency Capacitance-Voltage Measurements on High Impedance Devices Using the 4200A-SCS Parameter Analyzer
APPLICATION NOTE
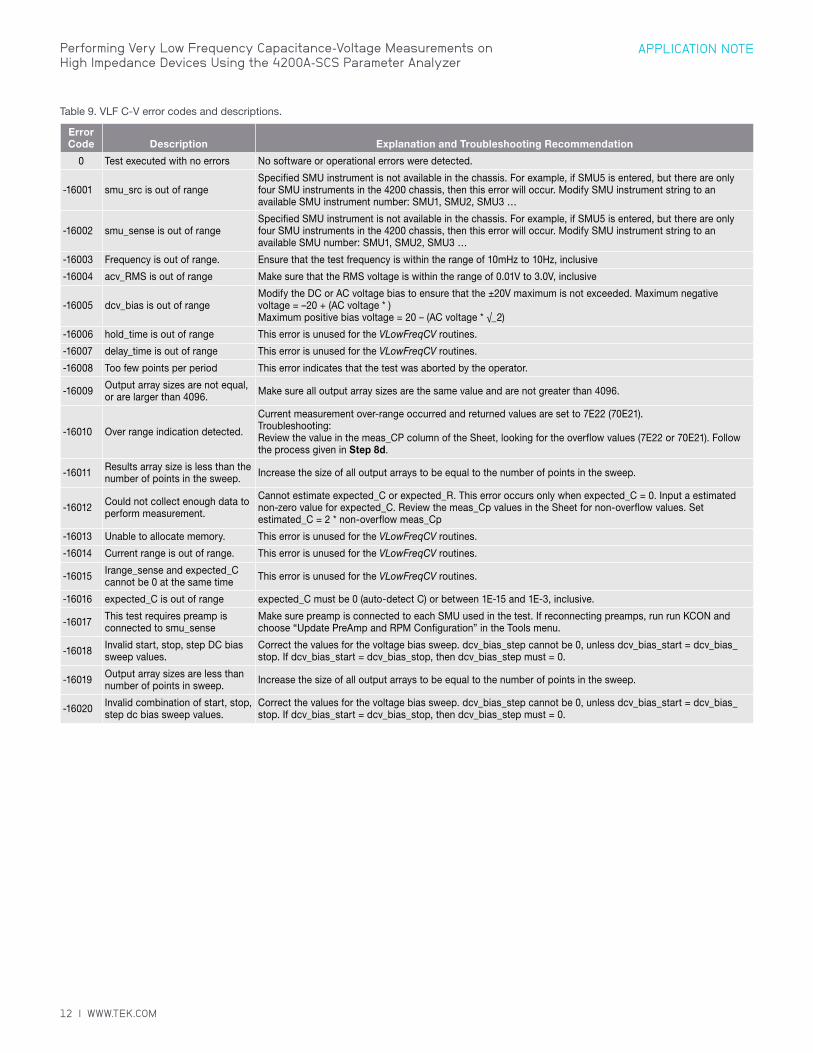
Table 9. VLF C-V error codes and descriptions.
Error Code Description Explanation and Troubleshooting Recommendation
0 Test executed with no errors No software or operational errors were detected.
-16001 smu_src is out of rangeSpecified SMU instrument is not available in the chassis. For example, if SMU5 is entered, but there are only four SMU instruments in the 4200 chassis, then this error will occur. Modify SMU instrument string to an available SMU instrument number: SMU1, SMU2, SMU3 …
-16002 smu_sense is out of rangeSpecified SMU instrument is not available in the chassis. For example, if SMU5 is entered, but there are only four SMU instruments in the 4200 chassis, then this error will occur. Modify SMU instrument string to an available SMU number: SMU1, SMU2, SMU3 …
-16003 Frequency is out of range. Ensure that the test frequency is within the range of 10mHz to 10Hz, inclusive
-16004 acv_RMS is out of range Make sure that the RMS voltage is within the range of 0.01V to 3.0V, inclusive
-16005 dcv_bias is out of rangeModify the DC or AC voltage bias to ensure that the ±20V maximum is not exceeded. Maximum negative voltage = –20 + (AC voltage * )Maximum positive bias voltage = 20 – (AC voltage * √_2)
-16006 hold_time is out of range This error is unused for the VLowFreqCV routines.
-16007 delay_time is out of range This error is unused for the VLowFreqCV routines.
-16008 Too few points per period This error indicates that the test was aborted by the operator.
-16009 Output array sizes are not equal, or are larger than 4096. Make sure all output array sizes are the same value and are not greater than 4096.
-16010 Over range indication detected.
Current measurement over-range occurred and returned values are set to 7E22 (70E21).Troubleshooting:Review the value in the meas_CP column of the Sheet, looking for the overflow values (7E22 or 70E21). Follow the process given in Step 8d.
-16011 Results array size is less than the number of points in the sweep. Increase the size of all output arrays to be equal to the number of points in the sweep.
-16012 Could not collect enough data to perform measurement.
Cannot estimate expected_C or expected_R. This error occurs only when expected_C = 0. Input a estimated non-zero value for expected_C. Review the meas_Cp values in the Sheet for non-overflow values. Set estimated_C = 2 * non-overflow meas_Cp
-16013 Unable to allocate memory. This error is unused for the VLowFreqCV routines.
-16014 Current range is out of range. This error is unused for the VLowFreqCV routines.
-16015 Irange_sense and expected_C cannot be 0 at the same time This error is unused for the VLowFreqCV routines.
-16016 expected_C is out of range expected_C must be 0 (auto-detect C) or between 1E-15 and 1E-3, inclusive.
-16017 This test requires preamp is connected to smu_sense
Make sure preamp is connected to each SMU used in the test. If reconnecting preamps, run run KCON and choose “Update PreAmp and RPM Configuration” in the Tools menu.
-16018 Invalid start, stop, step DC bias sweep values.
Correct the values for the voltage bias sweep. dcv_bias_step cannot be 0, unless dcv_bias_start = dcv_bias_stop. If dcv_bias_start = dcv_bias_stop, then dcv_bias_step must = 0.
-16019 Output array sizes are less than number of points in sweep. Increase the size of all output arrays to be equal to the number of points in the sweep.
-16020 Invalid combination of start, stop, step dc bias sweep values.
Correct the values for the voltage bias sweep. dcv_bias_step cannot be 0, unless dcv_bias_start = dcv_bias_stop. If dcv_bias_start = dcv_bias_stop, then dcv_bias_step must = 0.
WWW.TEK.COM | 13
APPLICATION NOTEPerforming Very Low Frequency Capacitance-Voltage Measurements on High Impedance Devices Using the 4200A-SCS Parameter Analyzer
Guidelines for Making Optimal Measurements and Troubleshooting TechniquesWhen making high impedance, very low frequency C-V
measure ments using the SMU instruments, various
techniques must be used to optimize measurement accuracy.
These techniques include implementing low current
measurement practices and choosing the appropriate
settings in the software.
Implementing Low Current Measurement Techniques
Because using the very low frequency impedance
measurement method involves measuring picoamp
to femtoamp current levels, low current measurement
techniques must be implemented. Use the triax cables
that come with the 4200A-SCS, which are shielded and
will allow making a guarded measurement, if necessary.
To reduce the noise due to electrostatic interference,
make sure the device is shielded by placing it in a metal
enclosure with the shield connected to the Force LO terminal
of the 4200A-SCS. Detailed information on low current
measurement techniques can be found in Keithley’s Low
Level Measurements Handbook. Also, ensure that the triax
cable is directly connected to the DUT or probe pins; do not
use any switching matrix or 4225-RPM in the SMU instrument
signal path.
Choosing the Correct “expected_C” and “expected_R” Values
In most cases, expected_C should be 0 and the expected_R
= 1E12 (both are the default values). When expected_C = 0,
the VLF C-V routine will determine estimated values for both
C and R of the device under test. The estimated R and C
values determine the SMU instrument measurement range. If
these values are chosen incorrectly, measurement errors or
measurement range overflow may result (see Table 9, error
code -16010 for more information). However, in some cases,
entering a non-zero estimated capacitance for expected_C
may provide better results for higher D devices or larger DC
bias tests. To calculate a value of expected_C, multiply a non-
overflow value from the meas_Cp column by two and enter
this value into the test definition expected_C.
To determine if a device is compatible with the present
VLF C-V approach, measure the DC resistance of the DUT,
performing an I-V test using the smu-vsweep test, R-C
Circuit VLF-CV Project. Use the same test voltages in the I-V
sweep that will be used in the impedance measurements.
Additionally, performing a single measurement (test vlf-cap-
one-point) or frequency sweep (test vlf-cap-freq-sweep) at
a DC bias of 0 V will determine the D of the device. Refer to
“Testing a Device with VLF C-V” and Table 8 for additional
information.
ConclusionThe 4200A-SCS contains a tool for performing very low
frequency C-V measurements using the SMU instruments
and preamps. This method enables the user to perform low
capacitance measurements at a precise test frequency in the
range of 10 mHz to 10 Hz. The Clarius software included with
the system enables the user to execute these low impedance
measurements easily and extract important parameters about
the DUT. When combined with the 4210-CVU or 4215-CVU
Capacitance Voltage Unit, the 4200A-SCS offers the user a
single system that can perform both high and low frequency
measurements.
14 | WWW.TEK.COM
Performing Very Low Frequency Capacitance-Voltage Measurements on High Impedance Devices Using the 4200A-SCS Parameter Analyzer
APPLICATION NOTE
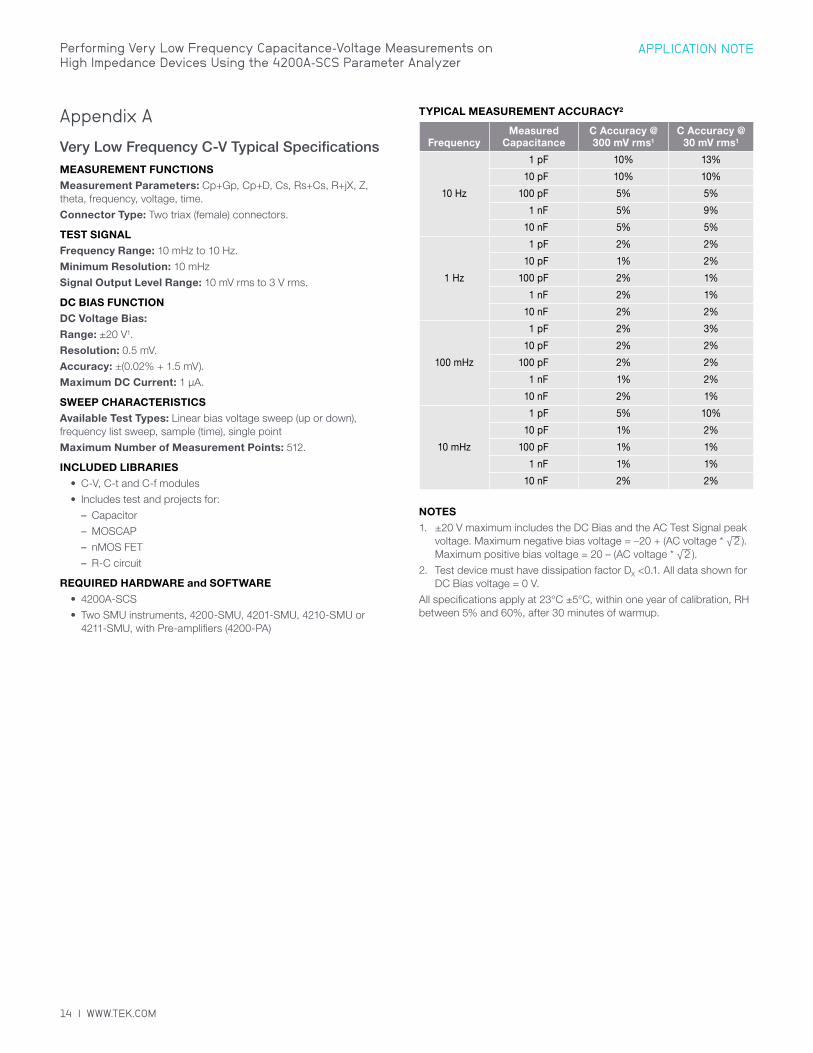
Appendix A
Very Low Frequency C-V Typical SpecificationsMEASUREMENT FUNCTIONS
Measurement Parameters: Cp+Gp, Cp+D, Cs, Rs+Cs, R+jX, Z, theta, frequency, voltage, time.
Connector Type: Two triax (female) connectors.
TEST SIGNAL
Frequency Range: 10 mHz to 10 Hz.
Minimum Resolution: 10 mHz
Signal Output Level Range: 10 mV rms to 3 V rms.
DC BIAS FUNCTION
DC Voltage Bias:
Range: ±20 V1.
Resolution: 0.5 mV.
Accuracy: ±(0.02% + 1.5 mV).
Maximum DC Current: 1 µA.
SWEEP CHARACTERISTICS
Available Test Types: Linear bias voltage sweep (up or down), frequency list sweep, sample (time), single point
Maximum Number of Measurement Points: 512.
INCLUDED LIBRARIES
• C-V, C-t and C-f modules
• Includes test and projects for:
– Capacitor
– MOSCAP
– nMOS FET
– R-C circuit
REQUIRED HARDWARE and SOFTWARE
• 4200A-SCS
• Two SMU instruments, 4200-SMU, 4201-SMU, 4210-SMU or 4211-SMU, with Pre-amplifiers (4200-PA)
TYPICAL MEASUREMENT ACCURACY2
FrequencyMeasured
CapacitanceC Accuracy @ 300 mV rms1
C Accuracy @ 30 mV rms1
10 Hz
1 pF 10% 13%
10 pF 10% 10%
100 pF 5% 5%
1 nF 5% 9%
10 nF 5% 5%
1 Hz
1 pF 2% 2%
10 pF 1% 2%
100 pF 2% 1%
1 nF 2% 1%
10 nF 2% 2%
100 mHz
1 pF 2% 3%
10 pF 2% 2%
100 pF 2% 2%
1 nF 1% 2%
10 nF 2% 1%
10 mHz
1 pF 5% 10%
10 pF 1% 2%
100 pF 1% 1%
1 nF 1% 1%
10 nF 2% 2%
NOTES
1. ±20 V maximum includes the DC Bias and the AC Test Signal peak voltage. Maximum negative bias voltage = –20 + (AC voltage * √
__2 ).
Maximum positive bias voltage = 20 – (AC voltage * √__2 ).
2. Test device must have dissipation factor DX <0.1. All data shown for DC Bias voltage = 0 V.
All specifications apply at 23°C ±5°C, within one year of calibration, RH between 5% and 60%, after 30 minutes of warmup.

WWW.TEK.COM | 15
APPLICATION NOTEPerforming Very Low Frequency Capacitance-Voltage Measurements on High Impedance Devices Using the 4200A-SCS Parameter Analyzer
Contact Information: Australia 1 800 709 465
Austria* 00800 2255 4835
Balkans, Israel, South Africa and other ISE Countries +41 52 675 3777
Belgium* 00800 2255 4835
Brazil +55 (11) 3759 7627
Canada 1 800 833 9200
Central East Europe / Baltics +41 52 675 3777
Central Europe / Greece +41 52 675 3777
Denmark +45 80 88 1401
Finland +41 52 675 3777
France* 00800 2255 4835
Germany* 00800 2255 4835
Hong Kong 400 820 5835
India 000 800 650 1835
Indonesia 007 803 601 5249
Italy 00800 2255 4835
Japan 81 (3) 6714 3086
Luxembourg +41 52 675 3777
Malaysia 1 800 22 55835
Mexico, Central/South America and Caribbean 52 (55) 56 04 50 90
Middle East, Asia, and North Africa +41 52 675 3777
The Netherlands* 00800 2255 4835
New Zealand 0800 800 238
Norway 800 16098
People’s Republic of China 400 820 5835
Philippines 1 800 1601 0077
Poland +41 52 675 3777
Portugal 80 08 12370
Republic of Korea +82 2 565 1455
Russia / CIS +7 (495) 6647564
Singapore 800 6011 473
South Africa +41 52 675 3777
Spain* 00800 2255 4835
Sweden* 00800 2255 4835
Switzerland* 00800 2255 4835
Taiwan 886 (2) 2656 6688
Thailand 1 800 011 931
United Kingdom / Ireland* 00800 2255 4835
USA 1 800 833 9200
Vietnam 12060128
* European toll-free number. If not
accessible, call: +41 52 675 3777Rev. 02.2018
Find more valuable resources at TEK.COM
Copyright © Tektronix. All rights reserved. Tektronix products are covered by U.S. and foreign patents, issued and pending. Information in this publication supersedes that in all previously published material. Specification and price change privileges reserved. TEKTRONIX and TEK are registered trademarks of Tektronix, Inc. All other trade names referenced are the service marks, trademarks or registered trademarks of their respective companies.
122819 SBG 1KW-60644-0