Derivation of genetic interaction networks from quantitative phenotype data
10
Genome Biology 2005, 6:R38 comment reviews reports deposited research refereed research interactions information Open Access 2005 Drees et al. Volume 6, Issue 4, Article R38 Method Derivation of genetic interaction networks from quantitative phenotype data Becky L Drees ¤ , Vesteinn Thorsson ¤ , Gregory W Carter ¤ , Alexander W Rives, Marisa Z Raymond, Iliana Avila-Campillo, Paul Shannon and Timothy Galitski Address: Institute for Systems Biology, 1441 N. 34th Street, Seattle, WA 98103, USA. ¤ These authors contributed equally to this work. Correspondence: Timothy Galitski. E-mail: [email protected] © 2005 Drees et al.; licensee BioMed Central Ltd. This is an Open Access article distributed under the terms of the Creative Commons Attribution License (http://creativecommons.org/licenses/by/2.0), which permits unrestricted use, distribution, and reproduction in any medium, provided the original work is properly cited. Yeast genetic interaction networks <p>Genetic interaction networks were derived from quantitative phenotype data by analyzing agar-invasion phenotypes of mutant yeast strains, which showed specific modes of genetic interaction with specific biological processes.</p> Abstract We have generalized the derivation of genetic-interaction networks from quantitative phenotype data. Familiar and unfamiliar modes of genetic interaction were identified and defined. A network was derived from agar-invasion phenotypes of mutant yeast. Mutations showed specific modes of genetic interaction with specific biological processes. Mutations formed cliques of significant mutual information in their large-scale patterns of genetic interaction. These local and global interaction patterns reflect the effects of gene perturbations on biological processes and pathways. Background Phenotypes are determined by complex interactions among gene variants and environmental factors. In biomedicine, these interacting elements take various forms: inherited and somatic human gene variants and polymorphisms, epigenetic effects on gene activity, environmental agents, and drug ther- apies including drug combinations. The success of predictive, preventive, and personalized medicine will require not only the ability to determine the genotypes of patients and to clas- sify patients on the basis of molecular fingerprints of tissues. It will require an understanding of how genetic perturbations interact to affect clinical outcome. Recent advances afford the capability to perturb genes and collect phenotype data on a genomic scale [1-7]. To extract the biological information in these datasets, parallel advances must be made in concepts and computational methods to derive and analyze genetic- interaction networks. We report the development and appli- cation of such concepts and methods. Results and discussion Phenotype data and genetic interaction A genetic interaction is the interaction of two genetic pertur- bations in the determination of a phenotype. Genetic interac- tion is observed in the relation among the phenotypes of four genotypes: a reference genotype, the 'wild type'; a perturbed genotype, A, with a single genetic perturbation; a perturbed genotype, B, with a perturbation of a different gene; and a doubly perturbed genotype, AB. Gene perturbations may be of any form (such as null, loss-of-function, gain-of-function, and dominant-negative). Also, two perturbations can interact in different ways for different phenotypes or under different environmental conditions. Published: 31 March 2005 Genome Biology 2005, 6:R38 (doi:10.1186/gb-2005-6-4-r38) Received: 3 December 2004 Revised: 4 February 2005 Accepted: 1 March 2005 The electronic version of this article is the complete one and can be found online at http://genomebiology.com/2005/6/4/R38
Transcript of Derivation of genetic interaction networks from quantitative phenotype data
com
ment
reviews
reports
deposited research
refereed researchinteractio
nsinfo
rmatio
n
Open Access2005Dreeset al.Volume 6, Issue 4, Article R38MethodDerivation of genetic interaction networks from quantitative phenotype dataBecky L Drees¤, Vesteinn Thorsson¤, Gregory W Carter¤, Alexander W Rives, Marisa Z Raymond, Iliana Avila-Campillo, Paul Shannon and Timothy Galitski
Address: Institute for Systems Biology, 1441 N. 34th Street, Seattle, WA 98103, USA.
¤ These authors contributed equally to this work.
Correspondence: Timothy Galitski. E-mail: [email protected]
© 2005 Drees et al.; licensee BioMed Central Ltd. This is an Open Access article distributed under the terms of the Creative Commons Attribution License (http://creativecommons.org/licenses/by/2.0), which permits unrestricted use, distribution, and reproduction in any medium, provided the original work is properly cited.Yeast genetic interaction networks<p>Genetic interaction networks were derived from quantitative phenotype data by analyzing agar-invasion phenotypes of mutant yeast strains, which showed specific modes of genetic interaction with specific biological processes.</p>
Abstract
We have generalized the derivation of genetic-interaction networks from quantitative phenotypedata. Familiar and unfamiliar modes of genetic interaction were identified and defined. A networkwas derived from agar-invasion phenotypes of mutant yeast. Mutations showed specific modes ofgenetic interaction with specific biological processes. Mutations formed cliques of significant mutualinformation in their large-scale patterns of genetic interaction. These local and global interactionpatterns reflect the effects of gene perturbations on biological processes and pathways.
BackgroundPhenotypes are determined by complex interactions amonggene variants and environmental factors. In biomedicine,these interacting elements take various forms: inherited andsomatic human gene variants and polymorphisms, epigeneticeffects on gene activity, environmental agents, and drug ther-apies including drug combinations. The success of predictive,preventive, and personalized medicine will require not onlythe ability to determine the genotypes of patients and to clas-sify patients on the basis of molecular fingerprints of tissues.It will require an understanding of how genetic perturbationsinteract to affect clinical outcome. Recent advances afford thecapability to perturb genes and collect phenotype data on agenomic scale [1-7]. To extract the biological information inthese datasets, parallel advances must be made in conceptsand computational methods to derive and analyze genetic-
interaction networks. We report the development and appli-cation of such concepts and methods.
Results and discussionPhenotype data and genetic interactionA genetic interaction is the interaction of two genetic pertur-bations in the determination of a phenotype. Genetic interac-tion is observed in the relation among the phenotypes of fourgenotypes: a reference genotype, the 'wild type'; a perturbedgenotype, A, with a single genetic perturbation; a perturbedgenotype, B, with a perturbation of a different gene; and adoubly perturbed genotype, AB. Gene perturbations may beof any form (such as null, loss-of-function, gain-of-function,and dominant-negative). Also, two perturbations can interactin different ways for different phenotypes or under differentenvironmental conditions.
Published: 31 March 2005
Genome Biology 2005, 6:R38 (doi:10.1186/gb-2005-6-4-r38)
Received: 3 December 2004Revised: 4 February 2005Accepted: 1 March 2005
The electronic version of this article is the complete one and can be found online at http://genomebiology.com/2005/6/4/R38
Genome Biology 2005, 6:R38
R38.2 Genome Biology 2005, Volume 6, Issue 4, Article R38 Drees et al. http://genomebiology.com/2005/6/4/R38
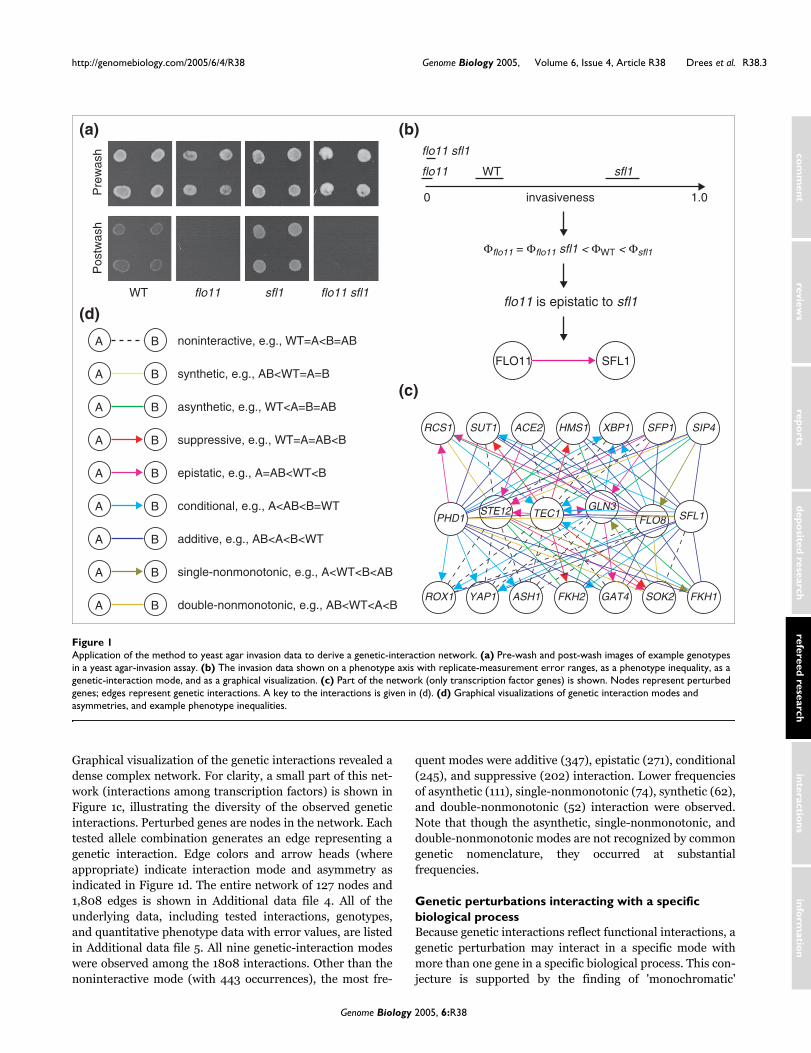
Geneticists recognize biologically informative modes ofgenetic interaction, for example, epistasis and synthesis.These two modes can illustrate the general properties ofgenetic interactions. An epistatic interaction occurs when twosingle mutants have different deviant (different from wild-type) phenotypes, and the double mutant shows the pheno-type of one of the single mutants. Analysis of epistatic inter-actions can reveal direction of information flow in molecularpathways [8]. If we represent a phenotype of a given geno-type, X, as ΦX, then we can write a phenotype inequality rep-resenting a specific example of epistatic genetic interaction,for example, ΦA < ΦWT < ΦB = ΦAB. Likewise, a synthetic inter-action occurs when two single mutants have a wild-type phe-notype and the double mutant shows a deviant phenotype, forexample, ΦWT = ΦA = ΦB < ΦAB. Synthetic interactions revealmechanisms of genetic 'buffering' [1,9].
Some modes of genetic interaction are symmetric; othermodes are asymmetric. This symmetry or asymmetry is evi-dent in phenotype inequalities, and is biologically informa-tive. Epistasis illustrates genetic-interaction asymmetry. Ifmutation A is epistatic to B, then B is hypostatic to A. Theasymmetry of epistasis, and the form of the mutant alleles(gain or loss of function), indicates the direction of biologicalinformation flow [8]. Conversely, synthetic interactions aresymmetric. If mutation A is synthetic with B, then B is syn-thetic with A. The symmetry of genetic synthesis reflects themutual requirement for phenotype buffering [1,9].
The representation of genetic interactions as phenotype ine-qualities accommodates all possibilities without assumptionsabout how genetic perturbations interact. In addition, itdemands quantitative (or at least ordered) phenotypes. Inprinciple, all phenotypes are measurable; complex pheno-types (for example, different cell-type identities) are amalga-mations of multiple underlying phenotypes. There is a total of75 possible phenotype inequalities for WT, A, B, and AB.Using a hybrid approach combining the mathematical prop-erties of phenotype inequalities and familiar genetic-interac-tion concepts and nomenclature, the 75 phenotypeinequalities were grouped into nine exclusive modes ofgenetic interaction, some of which are genetically asymmetric(Additional data file 1). This approach can be extended to theinteractions of more than two perturbations as well. The nineinteraction modes include familiar ones: noninteractive, epi-static, synthetic, conditional, suppressive, and additive; andmodes that certainly occur but, to our knowledge, have notbeen previously defined: asynthetic, single-nonmonotonic,and double-nonmonotonic. All interaction modes are definedin the Materials and methods; brief descriptions follow for theunfamiliar (previously undefined) modes. In asynthetic inter-action, A, B, and AB all have the same deviant phenotype. Insingle-nonmonotonic interaction, a mutant gene shows oppo-site effects in the WT background and the other mutant back-ground (for example, ΦWT < ΦA and ΦAB < ΦB). In double-
nonmonotonic interaction, both mutant genes show oppositeeffects.
Genetic-interaction networksImplementation of the foregoing principles renders genetic-interaction-network derivation fully computable from dataon any measured cell property with any interacting perturba-tions. We developed an open-source cross-platform softwareimplementation called PhenotypeGenetics, available at [10],a plug-in for the Cytoscape general-purpose network visuali-zation and analysis platform [11]. PhenotypeGenetics sup-ports an XML specification for loading any dataset, allowsuser-defined genetic-interaction modes, and supports all ofthe analyses described in this paper. It was used to derive andanalyze a genetic-interaction network from yeast invasionphenotype data.
In response to growth on low-ammonium agar, Saccharomy-ces cerevisiae MATa/α diploid yeast cells differentiate fromthe familiar ovoid single-cell growth form to a filamentousform able to invade the agar substrate [12]. Invasive filamen-tous-form growth is regulated by a mitogen-activated proteinkinase (MAPK) kinase cascade, the Ras/cAMP pathway, andmultiple other pathways [13,14]. We investigated geneticinteraction among genes in these pathways and processes.Quadruplicate sets of homozygous diploid single-mutant anddouble-mutant yeast strains were constructed (Materials andmethods). Two purposes guided the selection of genes andmutant combinations to study: to represent key pathways andprocesses regulating invasion; and to ensure a diversity ofinvasion phenotypes (non-invasive, hypo-invasive, wild type,and hyper-invasive) to permit the detection of diverse geneticinteractions. A set of 19 mutant alleles of genes in key path-ways controlling invasive growth, including 13 plasmid-bornedominant or multicopy wild-type alleles and 6 gene deletions,was crossed against a panel of 119 gene deletions. All mutantalleles used in this study are listed in Additional data file 2.
We developed a quantitative invasion-phenotype assay. Yeastagar-substrate invasion can be assessed by growing colonieson low-ammonium agar, removing cells on the agar surfaceby washing, and observing the remaining growth of cellsinside the agar. Replicate quantitative invasion-phenotypedata with error ranges were extracted from images of pre-wash and post-wash colonies. Each tested interaction wasrecorded as an inequality, and assigned a genetic-interactionmode. This process is detailed in the Materials and methodsand illustrated in Figures 1a and 1b, using the example of theepistasis of a deletion of the FLO11 gene, a major determinantof invasiveness, to a deletion of the SFL1 gene, encoding arepressor of FLO11. Note that the error-bounded intervals(black bars) for the genotypes in Figure 1b are representativeof the entire dataset. These errors are: flo11, 0.02; flo11 sfl1,0.01; WT, 0.05; sfl1, 0.06. Additional data file 3 shows a plotof error values for all genotypes sorted by error magnitude.The median error is 0.04.
Genome Biology 2005, 6:R38
http://genomebiology.com/2005/6/4/R38 Genome Biology 2005, Volume 6, Issue 4, Article R38 Drees et al. R38.3
com
ment
reviews
reports
refereed researchdepo
sited researchinteractio
nsinfo
rmatio
n
Graphical visualization of the genetic interactions revealed adense complex network. For clarity, a small part of this net-work (interactions among transcription factors) is shown inFigure 1c, illustrating the diversity of the observed geneticinteractions. Perturbed genes are nodes in the network. Eachtested allele combination generates an edge representing agenetic interaction. Edge colors and arrow heads (whereappropriate) indicate interaction mode and asymmetry asindicated in Figure 1d. The entire network of 127 nodes and1,808 edges is shown in Additional data file 4. All of theunderlying data, including tested interactions, genotypes,and quantitative phenotype data with error values, are listedin Additional data file 5. All nine genetic-interaction modeswere observed among the 1808 interactions. Other than thenoninteractive mode (with 443 occurrences), the most fre-
quent modes were additive (347), epistatic (271), conditional(245), and suppressive (202) interaction. Lower frequenciesof asynthetic (111), single-nonmonotonic (74), synthetic (62),and double-nonmonotonic (52) interaction were observed.Note that though the asynthetic, single-nonmonotonic, anddouble-nonmonotonic modes are not recognized by commongenetic nomenclature, they occurred at substantialfrequencies.
Genetic perturbations interacting with a specific biological processBecause genetic interactions reflect functional interactions, agenetic perturbation may interact in a specific mode withmore than one gene in a specific biological process. This con-jecture is supported by the finding of 'monochromatic'
Application of the method to yeast agar invasion data to derive a genetic-interaction networkFigure 1Application of the method to yeast agar invasion data to derive a genetic-interaction network. (a) Pre-wash and post-wash images of example genotypes in a yeast agar-invasion assay. (b) The invasion data shown on a phenotype axis with replicate-measurement error ranges, as a phenotype inequality, as a genetic-interaction mode, and as a graphical visualization. (c) Part of the network (only transcription factor genes) is shown. Nodes represent perturbed genes; edges represent genetic interactions. A key to the interactions is given in (d). (d) Graphical visualizations of genetic interaction modes and asymmetries, and example phenotype inequalities.
WT flo11 sfl1 flo11 sfl1
Pre
was
hP
ostw
ash
SOK2
HMS1
FLO8 SFL1
ASH1
PHD1STE12 TEC1
FKH2 GAT4
GLN3
RCS1
YAP1
XBP1
ROX1
SUT1 ACE2 SFP1 SIP4
FKH1
Φflo11 = Φflo11 sfl1 < ΦWT < Φsfl1
flo11 is epistatic to sfl1
invasiveness0 1.0
WT
flo11 sfl1
sfl1flo11
FLO11 SFL1synthetic, e.g., AB<WT=A=BA B
asynthetic, e.g., WT<A=B=ABA B
additive, e.g., AB<A<B<WTA B
double-nonmonotonic, e.g., AB<WT<A<BA B
noninteractive, e.g., WT=A<B=ABA B
suppressive, e.g., WT=A=AB<BA B
epistatic, e.g., A=AB<WT<BA B
conditional, e.g., A<AB<B=WTA B
single-nonmonotonic, e.g., A<WT<B<ABA B
(a) (b)
(d)
(c)
Genome Biology 2005, 6:R38
R38.4 Genome Biology 2005, Volume 6, Issue 4, Article R38 Drees et al. http://genomebiology.com/2005/6/4/R38
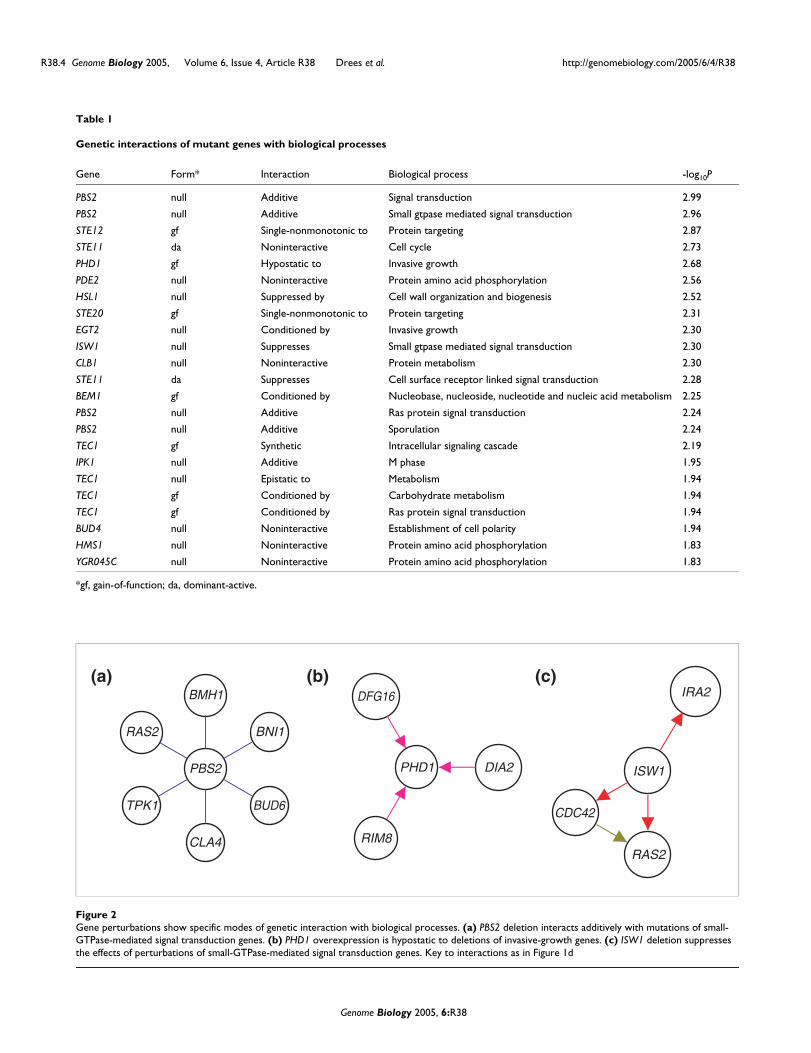
Table 1
Genetic interactions of mutant genes with biological processes
Gene Form* Interaction Biological process -log10P
PBS2 null Additive Signal transduction 2.99
PBS2 null Additive Small gtpase mediated signal transduction 2.96
STE12 gf Single-nonmonotonic to Protein targeting 2.87
STE11 da Noninteractive Cell cycle 2.73
PHD1 gf Hypostatic to Invasive growth 2.68
PDE2 null Noninteractive Protein amino acid phosphorylation 2.56
HSL1 null Suppressed by Cell wall organization and biogenesis 2.52
STE20 gf Single-nonmonotonic to Protein targeting 2.31
EGT2 null Conditioned by Invasive growth 2.30
ISW1 null Suppresses Small gtpase mediated signal transduction 2.30
CLB1 null Noninteractive Protein metabolism 2.30
STE11 da Suppresses Cell surface receptor linked signal transduction 2.28
BEM1 gf Conditioned by Nucleobase, nucleoside, nucleotide and nucleic acid metabolism 2.25
PBS2 null Additive Ras protein signal transduction 2.24
PBS2 null Additive Sporulation 2.24
TEC1 gf Synthetic Intracellular signaling cascade 2.19
IPK1 null Additive M phase 1.95
TEC1 null Epistatic to Metabolism 1.94
TEC1 gf Conditioned by Carbohydrate metabolism 1.94
TEC1 gf Conditioned by Ras protein signal transduction 1.94
BUD4 null Noninteractive Establishment of cell polarity 1.94
HMS1 null Noninteractive Protein amino acid phosphorylation 1.83
YGR045C null Noninteractive Protein amino acid phosphorylation 1.83
*gf, gain-of-function; da, dominant-active.
Gene perturbations show specific modes of genetic interaction with biological processesFigure 2Gene perturbations show specific modes of genetic interaction with biological processes. (a) PBS2 deletion interacts additively with mutations of small-GTPase-mediated signal transduction genes. (b) PHD1 overexpression is hypostatic to deletions of invasive-growth genes. (c) ISW1 deletion suppresses the effects of perturbations of small-GTPase-mediated signal transduction genes. Key to interactions as in Figure 1d
BMH1
RAS2
TPK1 BUD6
BNI1
PBS2
CLA4
PHD1
RIM8
DIA2
DFG16
RAS2
CDC42
ISW1
IRA2(a) (b) (c)
Genome Biology 2005, 6:R38
http://genomebiology.com/2005/6/4/R38 Genome Biology 2005, Volume 6, Issue 4, Article R38 Drees et al. R38.5
com
ment
reviews
reports
refereed researchdepo
sited researchinteractio
nsinfo
rmatio
n
interaction among biological-process modules [15]. Table 1lists 23 interactions in a specific mode between a mutantallele and a biological process. The statistical validation ofthese interactions is detailed in the Materials and methods.Figure 2 shows three examples. In Figure 2a, a PBS2 genedeletion is additive with mutations of small-GTPase-medi-ated signal transduction genes (P = 0.001). These includegenes in the Rho signal transduction/cell polarity pathway(BNI1, CLA4, BUD6) and the Ras/cAMP signaling pathway(RAS2, BMH1, TPK1). These signaling pathways contribute toinvasive growth phenotype in concert with the stressresponse regulated by the Pbs2 MAPK kinase [16]. In Figure2b, deletions of invasive-growth genes DFG16, RIM8, andDIA2 are epistatic to overexpression of the invasion-activat-ing Phd1 transcription factor (P = 0.002). The combination ofthis epistasis with the forms of the interacting alleles (PHD1overexpression is a gain of function, whereas the others arenull alleles) leads to the suggestion that DFG16, RIM8, andDIA2 may be regulated by Phd1. In Figure 2c, a deletion of theISW1 gene suppresses the effects of perturbations of small-GTPase-mediated signal transduction genes CDC42, RAS2,and IRA2 (P = 0.005). ISW1 encodes an ATP-dependentchromatin-remodeling factor [17]. Halme et al. [18] haveshown that invasiveness of yeast cells is controlled epigeneti-cally. High-frequency spontaneous mutations of IRA1 andIRA2 relieve epigenetic silencing of invasion genes. The sup-pression of an IRA2 mutation by ISW1 mutation suggests thepossibility that ISW1-dependent chromatin remodelingmediates effects of IRA2 mutation. Table 1 and Figure 2 illus-trate local interaction patterns among mutant genes and bio-logical processes.
Mutually informative patterns of genetic interactionThe phenotypic consequences of combinatorial genetic per-turbations are complex, in a strict sense; knowing the pheno-types of two single perturbations, there are no simple rules toknow the combinatorial phenotype. Counteracting this com-plexity, large sets of genetic-interaction data may containlarge-scale patterns. We examined the possibility that thereare pairs of perturbations with mutually informative patternsof genetic interaction with their common interaction part-ners. In other words, knowing the interactions of one pertur-bation may allow one to know, to some quantifiable extent,the interactions of another perturbation, and vice versa.Mutual information, and significance thereof, was calculatedfor all pairs of perturbations sharing tested interactions withother genes. For all 171 pairs of the 19 mutant alleles of genesin key pathways, mutual information was based on theirinteractions with the panel of 119 gene deletions. Similarly,among all 7,021 pairs of the 119 gene deletions, mutual infor-mation was based on their interactions with the 19 mutantalleles of genes in key pathways. Among all possible pairs, 23showed significant (P < 0.001) mutual information (Materi-als and methods and Additional data file 6).
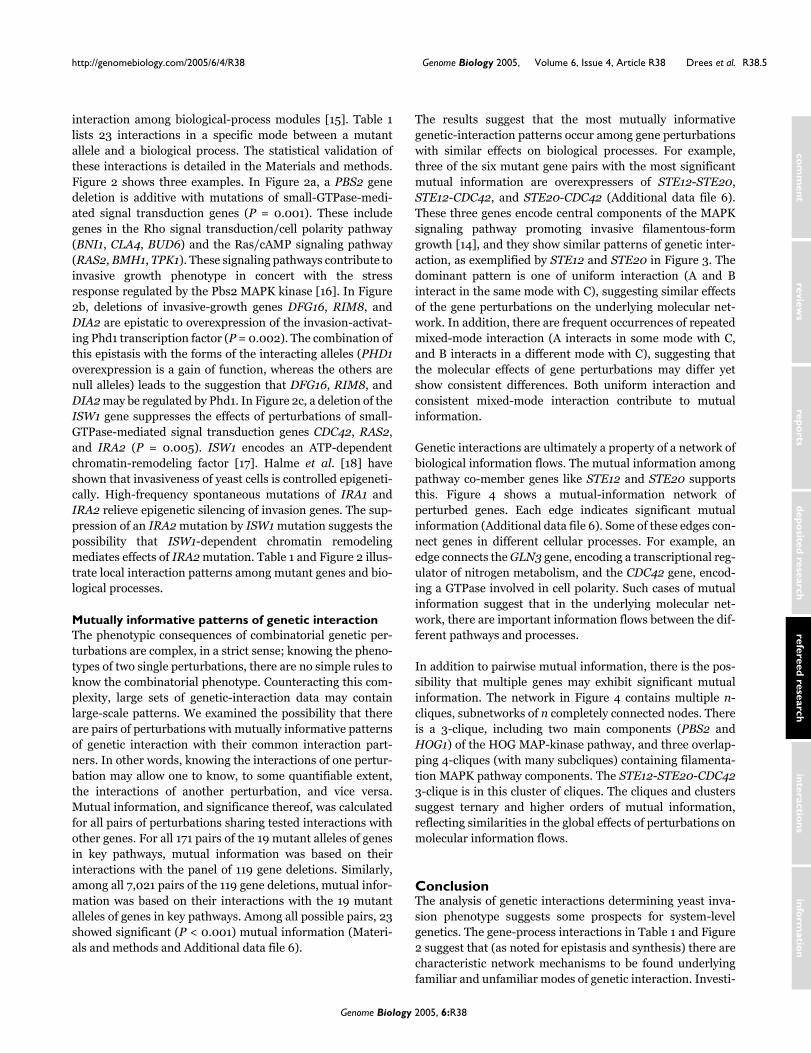
The results suggest that the most mutually informativegenetic-interaction patterns occur among gene perturbationswith similar effects on biological processes. For example,three of the six mutant gene pairs with the most significantmutual information are overexpressers of STE12-STE20,STE12-CDC42, and STE20-CDC42 (Additional data file 6).These three genes encode central components of the MAPKsignaling pathway promoting invasive filamentous-formgrowth [14], and they show similar patterns of genetic inter-action, as exemplified by STE12 and STE20 in Figure 3. Thedominant pattern is one of uniform interaction (A and Binteract in the same mode with C), suggesting similar effectsof the gene perturbations on the underlying molecular net-work. In addition, there are frequent occurrences of repeatedmixed-mode interaction (A interacts in some mode with C,and B interacts in a different mode with C), suggesting thatthe molecular effects of gene perturbations may differ yetshow consistent differences. Both uniform interaction andconsistent mixed-mode interaction contribute to mutualinformation.
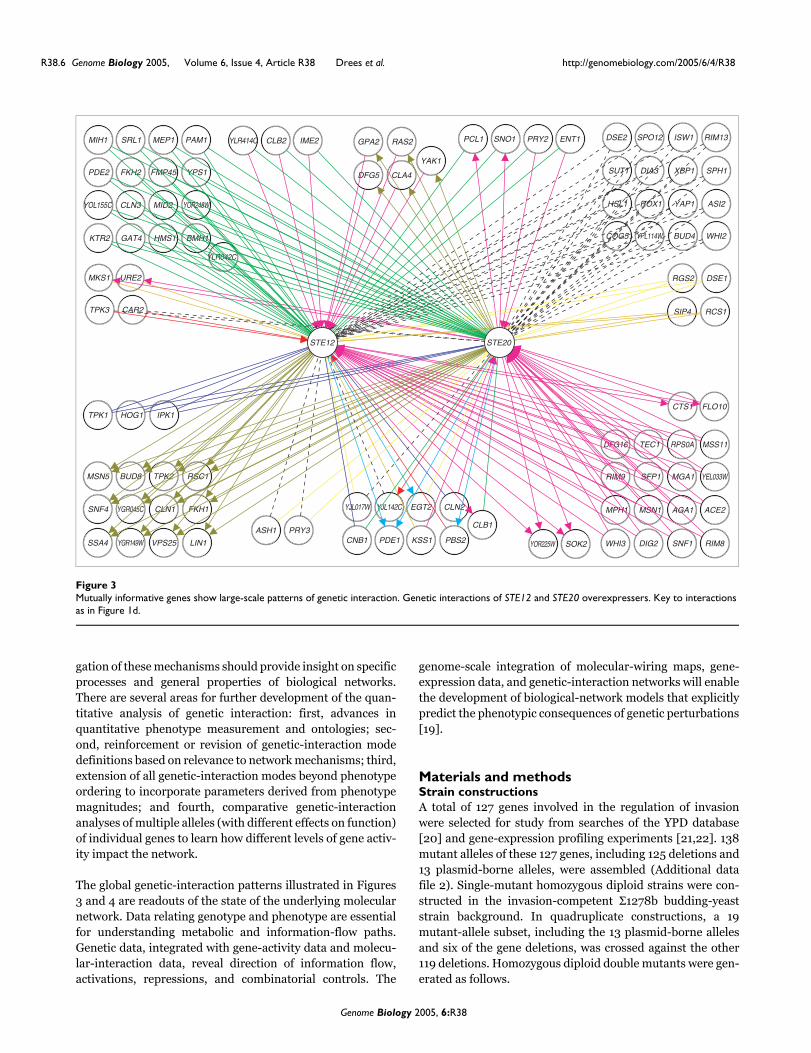
Genetic interactions are ultimately a property of a network ofbiological information flows. The mutual information amongpathway co-member genes like STE12 and STE20 supportsthis. Figure 4 shows a mutual-information network ofperturbed genes. Each edge indicates significant mutualinformation (Additional data file 6). Some of these edges con-nect genes in different cellular processes. For example, anedge connects the GLN3 gene, encoding a transcriptional reg-ulator of nitrogen metabolism, and the CDC42 gene, encod-ing a GTPase involved in cell polarity. Such cases of mutualinformation suggest that in the underlying molecular net-work, there are important information flows between the dif-ferent pathways and processes.
In addition to pairwise mutual information, there is the pos-sibility that multiple genes may exhibit significant mutualinformation. The network in Figure 4 contains multiple n-cliques, subnetworks of n completely connected nodes. Thereis a 3-clique, including two main components (PBS2 andHOG1) of the HOG MAP-kinase pathway, and three overlap-ping 4-cliques (with many subcliques) containing filamenta-tion MAPK pathway components. The STE12-STE20-CDC423-clique is in this cluster of cliques. The cliques and clusterssuggest ternary and higher orders of mutual information,reflecting similarities in the global effects of perturbations onmolecular information flows.
ConclusionThe analysis of genetic interactions determining yeast inva-sion phenotype suggests some prospects for system-levelgenetics. The gene-process interactions in Table 1 and Figure2 suggest that (as noted for epistasis and synthesis) there arecharacteristic network mechanisms to be found underlyingfamiliar and unfamiliar modes of genetic interaction. Investi-
Genome Biology 2005, 6:R38
R38.6 Genome Biology 2005, Volume 6, Issue 4, Article R38 Drees et al. http://genomebiology.com/2005/6/4/R38
gation of these mechanisms should provide insight on specificprocesses and general properties of biological networks.There are several areas for further development of the quan-titative analysis of genetic interaction: first, advances inquantitative phenotype measurement and ontologies; sec-ond, reinforcement or revision of genetic-interaction modedefinitions based on relevance to network mechanisms; third,extension of all genetic-interaction modes beyond phenotypeordering to incorporate parameters derived from phenotypemagnitudes; and fourth, comparative genetic-interactionanalyses of multiple alleles (with different effects on function)of individual genes to learn how different levels of gene activ-ity impact the network.
The global genetic-interaction patterns illustrated in Figures3 and 4 are readouts of the state of the underlying molecularnetwork. Data relating genotype and phenotype are essentialfor understanding metabolic and information-flow paths.Genetic data, integrated with gene-activity data and molecu-lar-interaction data, reveal direction of information flow,activations, repressions, and combinatorial controls. The
genome-scale integration of molecular-wiring maps, gene-expression data, and genetic-interaction networks will enablethe development of biological-network models that explicitlypredict the phenotypic consequences of genetic perturbations[19].
Materials and methodsStrain constructionsA total of 127 genes involved in the regulation of invasionwere selected for study from searches of the YPD database[20] and gene-expression profiling experiments [21,22]. 138mutant alleles of these 127 genes, including 125 deletions and13 plasmid-borne alleles, were assembled (Additional datafile 2). Single-mutant homozygous diploid strains were con-structed in the invasion-competent Σ1278b budding-yeaststrain background. In quadruplicate constructions, a 19mutant-allele subset, including the 13 plasmid-borne allelesand six of the gene deletions, was crossed against the other119 deletions. Homozygous diploid double mutants were gen-erated as follows.
Mutually informative genes show large-scale patterns of genetic interactionFigure 3Mutually informative genes show large-scale patterns of genetic interaction. Genetic interactions of STE12 and STE20 overexpressers. Key to interactions as in Figure 1d.
SOK2
URE2
HMS1
RPS0A
BMH1
YEL033W
RAS2
VPS25
IPK1
GPA2
YPS1
TPK1
COG5
CLN1
RIM9
MIH1 CLB2
EGT2 MSN1
TPK3
RSC1
CLN3
YAK1
ASH1
PAM1
RIM8PDE1
CAR2
MPH1
RIM13
DIG2 SNF1
YPL114W
LIN1
ASI2
MSN5
SSA4
IME2
PRY3
YLR414C
SPH1
TEC1
ENT1
CLN2
TPK2
MKS1
FKH2
YJL142C
BUD4
DSE1
KTR2
ISW1
GAT4
DFG5
MGA1
WHI2
YLR042C
FLO10
RCS1
PRY2
FMP45
YAP1
CNB1
YOR248W
XBP1
MSS11
ROX1
DFG16
PDE2
SRL1
PBS2
BUD8
YOR225W
YOL155C
WHI3
YJL017WYGR045C
SUT1
ACE2
MEP1
HOG1
RGS2
PCL1
MID2
CLA4
SNF4
DIA3
CLB1
KSS1
SFP1
SPO12
SIP4
AGA1
DSE2SNO1
FKH1
CTS1
YGR149W
HSL1
STE12 STE20
Genome Biology 2005, 6:R38
http://genomebiology.com/2005/6/4/R38 Genome Biology 2005, Volume 6, Issue 4, Article R38 Drees et al. R38.7
com
ment
reviews
reports
refereed researchdepo
sited researchinteractio
nsinfo
rmatio
n
Single-gene deletions in the invasion-competent Σ1278byeast background were constructed. 'Barcode' gene deletion-insertion alleles [5] were PCR amplified with several hundredbase pairs of flanking sequences from their noninvasive strainbackground. Using the G418 drug-resistance cassette of thesealleles, strain G85 (MATa/α ura3∆0/ura3∆0 his3∆0::hisG/his3∆0::hisG) was transformed with the PCR products. Genedisruption and the presence of the KanMX4 insertion wereverified by PCR. The heterozygous diploids were sporulatedand the resulting tetrads were dissected and screened toselect G418-resistant MATa and MATα haploids. These werecrossed to obtain homozygous diploid gene-deletion strains.
Some of the double mutants were generated by transformingthe homozygous deletion strains with either low-copy plas-mids bearing dominant alleles or multicopy (2 µm-based)plasmids bearing wild-type alleles. All plasmids utilizednative gene promoters. Plasmid transformations were per-formed using an adapted version of a multiwell transforma-tion protocol [5,23]. Four independent transformants werestocked and assayed for each transformation. Strains werealso transformed with empty vector plasmids.
The high-throughput construction of diploid homozygousdouble-deletion strains required the use of three drug-resist-ance markers to be able to select for the desired diploids andintermediate strains. For each deletion, the KanMX4 drug-resistance marker was converted to two other drug-resistance
markers, HygMX4 (hygromycin resistance) and NatMX4(nourseothricin resistance). MATα gene-deletion strainswere transformed with the NatMX4 cassette amplified frompAG25 [24]; NatR G418S transformants were stocked. MATagene-deletion strains were transformed with the HygMX4cassette amplified from pAG32 [24]; HygR G418S transform-ants were stocked.
The high-throughput construction of diploid homozygousdouble-deletion strains required the ability to select haploidsof each mating type separately. To accomplish this, we uti-lized the recessive resistance to canavanine caused by the dis-ruption of the CAN1 gene, encoding a transporter, incombination with fusions of the HIS3 ORF to the promotersof genes expressed in a specific mating type. A deletion of theCAN1 gene was constructed without introducing any markergenes or sequences. A double-stranded 60mer oligonucle-otide containing 30 bases from the upstream region fuseddirectly to 30 bases from the downstream region of the CAN1open reading frame (5'-GTAAAAACAAAAAAAAAAAAAGGCATAGCAATAT-GACGTTTTATTACCTTTGATCACATT-3') was amplified with60mer primers containing additional CAN1 flankingsequences (forward primer 5'-CGAAAGTTTATTTCAGAGT-TCTTCAGACTTCTTAACTCCTGTAAAAACAAAAAAAAAAAA-3',reverse primer 5'-GTGTATGACTTATGAGGGTGAGAATGCGAAATGGCGT-GGAAATGTGATCAAAGGTAATAA-3'). The resulting PCRproduct was used to transform two strains to canavanineresistance. Full deletion of the CAN1 gene was confirmed byPCR. This generated strains G264 (MATa his3∆::hisG can1∆)and G266 (MATα his3∆::hisG can1∆). To construct fusions ofthe HIS3 ORF to mating-type specific genes, the S. kluyveriHIS3 gene was amplified from pFA6-His3MX6 [25] withprimers containing ORF-flanking sequences for the MFA1locus (forward primer 5'-GTTTCTCGGATAAAACCAAAATAAGTACAAAGCCATCGAATAGAAATGGCAGAACCAGCCCAAAA-3', reverse primer 5'-AAGGAAGA-TAAAGGAGGGAGAACAACGTTTTTGTA CGCAGAAATCA-CATCAAAACACCTTTGTT-3') and with primers containingflanking sequences for the MFα 1 locus (forward primer 5'-GATTACAAACTATCAAT TTCATACACAATATAAACGAT-TAAAAGAATGGCAGAACCAGCCCAAAA-3', reverse primer5'-ACAAAGTCGACTTTGTTACATCTACACTGTTGTTATCAGTCGGGCTCACATCAAAACACCTTTGGT-3'). Theresulting PCR products were used to transform G264 andG266, respectively, to create strains G544 (MATahis3∆::hisG can1∆mfa1::HIS3) and G546 (MATαhis3∆::hisG can1∆mfα1::HIS3).
Crosses and sporulations were carried out to introduce thecanavanine-resistance marker and the mating-type-specific-His+ markers. MATα NatR deletion strains were crossed withG544. NatR Ura+ diploids were selected; all were CanS andHis-. These diploids were sporulated; from random spore
Networks of mutual information in patterns of genetic interaction show cliquesFigure 4Networks of mutual information in patterns of genetic interaction show cliques. Nodes represent perturbed genes (see Additional data file 2). gf indicates a gain-of-function allele; lf indicates a loss-of-function allele. Edges connect gene pairs with significant mutual information in their patterns of genetic interaction (see Additional data file 6).
STE20(gf) STE12(gf)
FLO8(gf)TEC1(gf)
BEM1(gf)
CDC42(gf)
MID2(lf)
RGS2(lf)
EGT2(lf)
GLN3(gf)
PBS2(lf)
HSL1(lf)
HOG1(lf)
SFL1(lf)
YJL142C(lf)
YAP1(lf) ISW1(lf)
FKH2(lf)
Genome Biology 2005, 6:R38
R38.8 Genome Biology 2005, Volume 6, Issue 4, Article R38 Drees et al. http://genomebiology.com/2005/6/4/R38
preparations NatR CanR His+ Ura- MATa haploids were iden-tified. MATa HygR deletion strains were crossed with G546.These diploids were sporulated; from random spore prepara-tions HygR CanR His+ Ura- MATα haploids were identified.
To make the diploid homozygous double-deletion strains, aseries of high-throughput crosses and sporulations, in whichall the desired intermediate cell types and deletion genotypescould be selected, was carried out [1]. At all stages, multiplestrains were individually verified. NatR MATa single-deletionstrains were crossed to an array of MATα G418R single-dele-tion strains. HygR MATα single-deletion strains were crossedto an array of MATa G418R single-deletion strains. Fromthese crosses NatR G418R diploids and HygR G418R diploidswere selected, respectively. Diploids from each cross weresporulated. Haploid double-deletion strains were selected:His+ CanR (MATa haploid) G418R NatR double-deletion segre-gants, and His+ CanR (MATα haploid) G418R HygR double-deletion segregants, respectively. The resulting arrays ofMATa and MATα haploid double-deletion strains weremated and subjected to selection for G418R, NatR, and HygR
to generate diploid homozygous double-deletion strains.
Assay of yeast invasivenessStrains were inoculated from frozen stocks into liquid mediain 96-well plates and incubated 18 hours at 30°C. Each plateincluded at least eight wells containing wild-type controls.Cells were transferred with a 96-Floating-Pin Replicator andcolony copier (V & P Scientific) onto SLAD agar [12] in anomnitray. Each 96-well plate was pinned in quadruplicate,resulting in a total of 384 colonies per SLAD-agar plate. Notethat each genotype was constructed in quadruplicate andassayed on separate plates. Therefore, each genotype wasassayed with a total of 16 replicates. Plates were incubated for4 days at 30°C. After incubation, cell material was removedfrom the agar surface while rinsing the plate under runningwater. A 300 d.p.i. grayscale image of each plate was gener-ated before and after the wash by placing the plate face downon a flatbed scanner and scanning with transmitted light.Images were inverted using Adobe Photoshop 6 and saved asTIFF files for quantitative image analysis.
Processing of invasion-assay dataColony growth and invasion were quantified using Dapple[26], software originally designed for the analysis of DNAmicroarray images. Each post-wash image was analyzedsimultaneously with the corresponding pre-wash image toenable reliable definition of colony boundaries and directcomparison of cell material. Subtraction of local backgroundintensity yielded un-normalized values for growth (G) andinvasion (U) and invasiveness ratio (R = U/G). A normaliza-tion factor for each plate, Np, was obtained from multiplewild-type controls on each plate. For each replicate q on platep, we obtained the wild-type invasiveness ratio Rwt
q,p =Uwt
q,p/Gwtq,p and defined the plate normalization factor Np as
Np = medianq(Rwtq,p)/medianp(medianq(Rwt
q,p)). For a given
genotype g, the normalized invasiveness ratio is given by Rgq,p
= (Ugq,p/Gg
q,p)/Np = Rgi where in the final equality we renum-
bered into a single ordinal index the N replicates i = 1,2,..,N(N ≤ 16). We excluded any genotype g for which N < 5 due, forexample, to deficient growth. From normalized data, wederived phenotype values and measurement errors. Weobtained the median ratio Rg = mediani(Rg
i), and the medianabsolute deviation MADg = MAD(Rg
i) = mediani(|Rgi-Rg|). As
a lower bound in error estimates we used MADQ = 0.1, the tenthpercentile of all MADg. Thus, the phenotype values arereported as Rg, with error Eg = max(MADg, MADQ = 0.1). Thefrequencies of genetic-interaction modes were insensitive toincreases of the error lower bound to the 50th percentile.Directed checks of individual components of the automatedprocessing were made throughout. These included: visualinspection of each individual image, check of colony morphol-ogy, spot checking of well-characterized individual strainsfrom start to finish in the analysis pipeline, screening for sys-tematic errors in assay intensities. We confirmed that theplate-wise normalization did not lead to error amplificationdue to division by small numbers.
Derivation of phenotype inequalitiesThe following steps were carried out using PhenotypeGenet-ics software. Phenotypes and errors of genotypes WT, A, B,and AB [(Rwt,Ewt), (RA,EA), (RB,EB), and (RAB, EAB)] wereassigned a phenotype inequality relation. This was done byfirst defining the error-bounded interval Ig = [Rg-Eg, Rg+Eg]for each genotype. All pairs of genotypes were assigned anequality, Φg1 = Φg2 if interval Ig1 overlapped with Ig2. Transi-tivity of equalities (if a = b and b = c, then a = c) was appliedto yield disjoint groups of phenotype equalities. Inequalities,greater than (>) or less than (<) were assigned for the rela-tions between equality groups. The resulting inequalitieswere assigned to genetic-interaction modes and asymmetriesas described below. The results of all tests of geneticinteraction were rendered as a graph as illustrated in Figure1d. The entire resulting network is shown in Additional datafile 4. One can obtain PhenotypeGenetics software or use it toanalyze the invasion network at [10].
Modes of genetic-interactionThe 75 possible phenotype inequalities were assigned tomodes of genetic interaction based on computable criteria.For each mode, we list the criterion for the inclusion of a phe-notype inequality. In these criteria, 'background' refers to agenotype with its complement of wild-type and mutant genes,into which other genetic perturbations are added, and 'effect'refers to a change in a phenotype, either an increase or adecrease, upon a single genetic perturbation of a background.In the examples below, additional cases may be generated byoperations such as exchanging A and B, or reversing the effectof both alleles (for example reversing the effect of the Amutant gene with ΦWT< ΦA gives ΦA < ΦWT). Additional datafile 1 lists each of the 75 phenotype inequalities and theirassigned genetic-interaction mode and asymmetries. Figure
Genome Biology 2005, 6:R38

http://genomebiology.com/2005/6/4/R38 Genome Biology 2005, Volume 6, Issue 4, Article R38 Drees et al. R38.9
com
ment
reviews
reports
refereed researchdepo
sited researchinteractio
nsinfo
rmatio
n
1d shows graph visualizations for all nine genetic-interactionmodes.
Noninteractive interactionA has no effect in the WT and B backgrounds (for example,ΦWT = ΦA < ΦB = ΦAB), or B has no effect in the A and WTbackgrounds, or both hold true (5 inequalities).
Epistatic interactionA and B have different effects (in terms of direction or magni-tude) on the wild-type background and the double mutant hasthe same phenotype as either A or B (for example, ΦA < ΦWT <ΦB = ΦAB) (12 inequalities).
Conditional interactionA has an effect only in the B background, or the B mutant hasan effect only in the A background (12 inequalities).
Suppressive interactionA has an effect on WT, but that effect is abolished by addingthe suppressor B, which itself shows no single-mutant effect(for example, ΦWT = ΦB = ΦAB <ΦA); or, the correspondingholds under exchange of A and B (4 inequalities).
Additive interactionSingle-mutant effects combine to give a double-mutant effectas per ΦWT <ΦA= ΦB<ΦAB, ΦB < ΦWT = ΦAB < ΦA, ΦWT < ΦA <ΦB < ΦAB, ΦB < ΦWT < ΦAB < ΦA, and all additional inequalitiesobtained by interchanging A and B, or reversing the effect ofboth A and B (12 inequalities).
Synthetic interactionA and B have no effect on the WT background, but the ABcombination has an effect (2 inequalities).
Asynthetic interactionA, B, and the AB combination all have the same effect on theWT background (2 inequalities).
Single-nonmonotonic interactionB shows opposing effects in the WT and A backgrounds (forexample, ΦB > ΦWT and ΦAB< ΦA); or, A shows opposingeffects in the WT and B backgrounds, but not both (8inequalities).
Double-nonmonotonic interactionBoth A and B show opposing effects in the WT backgroundand the background with the other mutant gene (18inequalities).
Genetic interaction with biological processesTo identify statistically significant correlations between agiven allele's interaction modes and biological processes, theneighbors of every allele in the network were queried forinteraction class and Gene Ontology (GO) Consortium data-base annotations [27]. Each interaction class is defined by the
interaction mode and direction, if any. For example, 'A sup-presses B' and 'A is suppressed by B' are placed in differentinteraction classes. There are 13 interaction classes and 9interaction modes (described above). Likelihood values werecomputed to find over-represented class-annotation pairingswithin each set of nearest neighbors, and P-values wereassigned relative to a cumulative hypergeometric distribu-tion. The result was a computer-generated list of biologicalstatements relating genes, interaction classes, and targetannotations, with entries such as 'A loss-of-function mutationof HSL1 is suppressed by mutations of cell wall organizationand biogenesis genes (-log10P = 2.52).' These are listed in tab-ular form in Table 1.
To calibrate the significance of the results, a parallel calcula-tion was performed for every test in the network in which thefractional probabilities of each possible outcome were addedto an overall distribution of P-values for the entire network.For example, if a given mutation interacts with N others, NC
of the interactions being of class C and NA of those neighborscarrying annotation A, there is a finite set of outcomes forNCA, the number of neighbor mutations with annotation Aconnected via interaction C. The possible values of NCA followa discrete hypergeometric distribution, and summing thesedistributions over all tests in the network yields a formallyrandomized distribution of P-values which has been con-strained by the topology of the actual network. The distribu-tions, real and theoretical, of -log10P values were thencompared by performing a chi-square test between compara-ble histograms. These tests showed a strong excess for -log10P> 1.8.
Mutual information of genetic interaction patternsWe calculated the mutual information [28] of pairs of geneticperturbations. Each perturbation, X, has an observed discreteprobability distribution of interaction classes (defined bymode and direction) with its tested interaction partners, P(x),where x ∈ X, the set of interaction classes of perturbation X,and:
Mutual information, I, of a pair of perturbations, A and B, isthe relative entropy of their joint probability distribution rel-ative to their product probability distribution. Thus:
Significance of mutual information was tested independentlyfor each allele pair by computing the likelihood of obtainingthe observed score in randomly permuted data. To removebias due to our selection of mutant alleles, randomized datawere constrained by keeping the wild type and two single-mutant phenotypes fixed and replacing interaction classes
P xx X
( ) .∈∑ = 1
I A B P a bP a b
P a P b
I A B Ib Ba A
[ ; ] ( , ) log( , )
( ) ( )
[ ; ] [
=
=∈∈∑∑ 2
and BB A; ] ≥ 0 bits.
Genome Biology 2005, 6:R38
R38.10 Genome Biology 2005, Volume 6, Issue 4, Article R38 Drees et al. http://genomebiology.com/2005/6/4/R38
only with classes that are consistent with the observed single-mutant phenotypes. The choice among possible replacementclasses was weighted by observed frequency in the entire net-work. Empirical tests showed randomized mutual informa-tion scores to be normally distributed, and multiplerandomizations were carried out to determine a mean andstandard deviation to characterize the distribution for eachtested allele pair. P-values were then calculated as theprobability of finding a mutual information score at or abovethe observed score. Allele pairs with probabilities below thecutoff of P < 0.001 are listed in Additional data file 6, andshown as a graph in Figure 4.
Additional data filesThe following data are available with the online version of thispaper. Additional data file 1 is a table showing 75 genetic-interaction inequalities in nine modes of genetic interaction.Additional data file 2 lists the gene perturbations used in thisstudy. Additional data file 3 is a figure plotting phenotypeerror values in the entire dataset. Additional data file 4 showsthe entire genetic interaction network derived from yeastinvasion-phenotype data. Additional data file 5 lists pheno-type data for all tested interactions. Additional data file 6 listsmutual information in genetic-interaction patterns.Additional File 1A table showing 75 genetic-interaction inequalities in nine modes of genetic interaction. As described in Materials and methods, all 75 possible phenotype inequalities were classified into nine modes of genetic interaction. The results are listed here.Click here for fileAdditional File 2Gene perturbations used in this study. This file lists all genes, mutant alleles, and allele forms (for example, null, gain-of-func-tion, etc.)Click here for fileAdditional File 3Phenotype error values in the entire dataset. This plot shows the phenotype error values (Materials and methods) plotted against percentile of all genotypes ordered by error magnitude.Click here for fileAdditional File 4Entire genetic interaction network derived from yeast invasion-phenotype data. Figure 1c shows a small part of the genetic-inter-action network. This file contains an image including all tested interactions.Click here for fileAdditional File 5Phenotype data for all tested interactions. This file lists all tested genetic interactions as well as the phenotype and error values for all genotypes, WT, A, B, and AB.Click here for fileAdditional File 6Mutual information in genetic-interaction patterns. This file lists the mutual information, and significance, among pairs of genes connected by edges in Figure 4.Click here for file
AcknowledgementsWe thank J. Aitchison, C. Aldridge, G. Church, L. Hood, S. Istrail, A.Markiel, S. Prinz, F. Roth, D. Segre, and J. Taylor for their contributions.This work was funded in part by Merck & Co. V.T. was supported by NIHGrant P20 GM64361. T.G. is a recipient of a Burroughs Wellcome FundCareer Award in the Biomedical Sciences.
References1. Tong AH, Evangelista M, Parsons AB, Xu H, Bader GD, Page N, Rob-
inson M, Raghibizadeh S, Hogue CW, Bussey H, et al.: Systematicgenetic analysis with ordered arrays of yeast deletionmutants. Science 2001, 294:2364-2368.
2. Tong AH, Lesage G, Bader GD, Ding H, Xu H, Xin X, Young J, BerrizGF, Brost RL, Chang M, et al.: Global mapping of the yeastgenetic interaction network. Science 2004, 303:808-813.
3. Fraser AG, Kamath RS, Zipperlen P, Martinez-Campos M, SohrmannM, Ahringer J: Functional genomic analysis of C. elegans chro-mosome I by systematic RNA interference. Nature 2000,408:325-330.
4. Tewari M, Hu PJ, Ahn JS, Ayivi-Guedehoussou N, Vidalain PO, Li S,Milstein S, Armstrong CM, Boxem M, Butler MD, et al.: Systematicinteractome mapping and genetic perturbation analysis of aC. elegans TGF-beta signaling network. Mol Cell 2004,13:469-482.
5. Winzeler EA, Shoemaker DD, Astromoff A, Liang H, Anderson K,Andre B, Bangham R, Benito R, Boeke JD, Bussey H, et al.: Func-tional characterization of the S. cerevisiae genome by genedeletion and parallel analysis. Science 1999, 285:901-906.
6. Strausberg RL, Schreiber SL: From knowing to controlling: apath from genomics to drugs using small molecule probes.Science 2003, 300:294-295.
7. Swedlow JR, Goldberg I, Brauner E, Sorger PK: Informatics andquantitative analysis in biological imaging. Science 2003,300:100-102.
8. Avery L, Wasserman S: Ordering gene function: the interpreta-tion of epistasis in regulatory hierarchies. Trends Genet 1992,8:312-316.
9. Hartman JLt, Garvik B, Hartwell L: Principles for the buffering of
genetic variation. Science 2001, 291:1001-1004.10. Galitski Lab [http://labs.systemsbiology.net/galitski]11. Shannon P, Markiel A, Ozier O, Baliga NS, Wang JT, Ramage D, Amin
N, Schwikowski B, Ideker T: Cytoscape: a software environmentfor integrated models of biomolecular interaction networks.Genome Res 2003, 13:2498-2504.
12. Gimeno CJ, Ljungdahl PO, Styles CA, Fink GR: Unipolar cell divi-sions in the yeast S. cerevisiae lead to filamentous growth:regulation by starvation and RAS. Cell 1992, 68:1077-1090.
13. Lengeler KB, Davidson RC, D'Souza C, Harashima T, Shen WC,Wang P, Pan X, Waugh M, Heitman J: Signal transduction cas-cades regulating fungal development and virulence. MicrobiolMol Biol Rev 2000, 64:746-785.
14. Gancedo JM: Control of pseudohyphae formation in Saccharo-myces cerevisiae. FEMS Microbiol Rev 2001, 25:107-123.
15. Segre D, DeLuna A, Church GM, Kishony R: 'Monochromatic'modularity of epistatic interaction network in yeastmetabolism. Nat Genet 2005, 37:77-83.
16. O'Rourke SM, Herskowitz I: The Hog1 MAPK prevents crosstalk between the HOG and pheromone response MAPKpathways in Saccharomyces cerevisiae. Genes Dev 1998,12:2874-2886.
17. Tsukiyama T, Palmer J, Landel CC, Shiloach J, Wu C: Characteriza-tion of the imitation switch subfamily of ATP-dependentchromatin-remodeling factors in Saccharomyces cerevisiae.Genes Dev 1999, 13:686-697.
18. Halme A, Bumgarner S, Styles C, Fink GR: Genetic and epigeneticregulation of the FLO gene family generates cell-surface var-iation in yeast. Cell 2004, 116:405-415.
19. Galitski T: Molecular networks in model systems. Annu RevGenomics Hum Genet 2004, 5:177-187.
20. Csank C, Costanzo MC, Hirschman J, Hodges P, Kranz JE, Mangan M,O'Neill K, Robertson LS, Skrzypek MS, Brooks J, et al.: Three yeastproteome databases: YPD, PombePD, and CalPD(MycoPathPD). Methods Enzymol 2002, 350:347-373.
21. Galitski T, Saldanha AJ, Styles CA, Lander ES, Fink GR: Ploidy regu-lation of gene expression. Science 1999, 285:251-254.
22. Prinz S, Avila-Campillo I, Aldridge C, Srinivasan A, Dimitrov K, SiegelAF, Galitski T: Control of yeast filamentous-form growth bymodules in an integrated molecular network. Genome Res2004, 14:380-390.
23. Saccharomyces Genome Deletion Project [http://www-sequence.stanford.edu/group/yeast_deletion_project/transprot.html]
24. Goldstein AL, McCusker JH: Three new dominant drug resist-ance cassettes for gene disruption in Saccharomycescerevisiae. Yeast 1999, 15:1541-1553.
25. Wach A: PCR-synthesis of marker cassettes with long flankinghomology regions for gene disruptions in S. cerevisiae. Yeast1996, 12:259-265.
26. Dapple: image analysis software for DNA microarrays [http://www.cs.wustl.edu/~jbuhler/research/dapple]
27. Ashburner M, Ball CA, Blake JA, Botstein D, Butler H, Cherry JM,Davis AP, Dolinski K, Dwight SS, Eppig JT, et al.: Gene ontology:tool for the unification of biology. The Gene OntologyConsortium. Nat Genet 2000, 25:25-29.
28. Shannon CE: A mathematical theory of communication. BellSystem Tech J 1948, 27:379-423.
Genome Biology 2005, 6:R38
http://www.ncbi.nlm.nih.gov/entrez/query.fcgi?cmd=Retrieve&db=PubMed&dopt=Abstract&list_uids=1365397
http://www.ncbi.nlm.nih.gov/entrez/query.fcgi?cmd=Retrieve&db=PubMed&dopt=Abstract&list_uids=1365397
http://www.ncbi.nlm.nih.gov/entrez/query.fcgi?cmd=Retrieve&db=PubMed&dopt=Abstract&list_uids=1547504
http://www.ncbi.nlm.nih.gov/entrez/query.fcgi?cmd=Retrieve&db=PubMed&dopt=Abstract&list_uids=1547504
http://www.ncbi.nlm.nih.gov/entrez/query.fcgi?cmd=Retrieve&db=PubMed&dopt=Abstract&list_uids=9744864