Plasma-enhanced chemical vapour deposition growth of carbon nanotubes on different metal underlayers
Upload
khangminh22Category
view
2download
0
ABSTRACT
BARUA, DIPAK. Deposition of metal and metal oxide thin films from metal organic
precursors in supercritical carbon dioxide solution. (Under the direction of Gregory N.
Parsons)
Thin films of metals and metal-oxides are deposited in batch (Chemical Fluid Deposition)
and cyclic (Atomic Layer Deposition) processes from metal organic precursors in
supercritical carbon dioxide solutions. New materials have been introduced in the deposition
processes. Deposited films are analyzed in details in order to evaluate their quality and
chemical composition. Analyzing techniques, X-ray photoelectron spectroscopy (XPS),
ellipsometry, Fourier transform infrared spectroscopy (FTIR), atomic force microscopy
(AFM), and auger electron spectroscopy (AES) are adopted to characterize the films.
Capacitance-voltage measurements are performed to prove the device quality deposition of
metal oxide films. The process establishes a new approach in metal oxide deposition, and
controllable growth of metal and metal oxide films in supercritical carbon dioxide.

Deposition of Metal and Metal Oxide Thin Films from Metal Organic Precursors in Supercritical Carbon Dioxide Solution
by
Dipak Barua
A thesis submitted to the Graduate Faculty of
North Carolina State University
In partial fulfillment of the
Requirements for the degree of
Master’s of Science
Chemical and Biomolecular Engineering
Raleigh, North Carolina
2005
Approved by:
________________________ _________________________
_______________________
Dr. Carl Osburn
Dr. Ruben G. Carbonell
__
Dr. Gregory N. Parsons

DEDICATION
This thesis is dedicated to my parents, Mr. Joysen Barua and Mrs. Jharna Barua, for their
loving supports throughout my life.
ii

BIOGRAPHY
Dipak Barua was born in Cox’s bazar, a small city in Bangladesh. He was brought up in
Chandpur, a different town in the same country, where he attended his high school (up to
twelfth grade).In March 2002, he graduated with a bachelor of science degree in chemical
engineering from Bangladesh University of Engineering and Technology, Dhaka,
Bangladesh. In August 2003, he moved to United States in pursue of his graduate study at
North Carolina State University in Raleigh, NC. He completed his Master’s of Science in
chemical engineering from North Carolina State University in May 2005, working under the
direction of Dr. Gregory N. Parsons.
iii
ACKNOWLEDGMENTS
I would like to thank first and foremost Dr. Gregory N. Parsons for his support,
encouragement and guidance throughout the course of my research work. His invaluable
direction as a mentor, teacher and a friend was essential at every step of this work. I am also
grateful to him for giving me the opportunity to work in this exciting field of electronic
materials.
I greatly appreciate my committee members, Dr. Ruben G. Carbonell and Dr. Carl
Osburn, for their interest, comments and advice in my work. I am grateful to Dr. Ruben G.
Carbonell for his invaluable suggestions and cooperation in this project from the very
beginning. My thanks to Dr. Carl Osburn for his integrated circuit fabrication and design
course, which gave me a broad overview about semiconductor processing and
manufacturing.
My next thank goes to Dr.Theodosia Gougousi for her immense contribution to this
project at its earlier stage. I am indebted to her for all her assistance, teaching and advice.
I am grateful to my fellow group members Jason M. Kelly, Kie Jin Park, David B.
Terry, Changwoong Chu, Elisa Rosa and others for their assistance and ever needed help
throughout my work. My thanks to Erin D. Young for her help in the experiments.
I am grateful to Dr. Genzer for allowing me using his laboratory facilities. My special
thanks to Michael Tomilson and Rajendra Bhatt for training me the ellipsometer in their lab.
My special thanks to Kit Yeung, our instrument maker, for his help and suggestions
in many cases.
I also acknowledge the financial support from National Science Foundation for
carrying out my personal research traineeship in North Carolina State University.
iv

TABLE OF CONTENTS
LIST OF TABLES............................................................................................. vii
LIST OF FIGURES .......................................................................................... viii
CHAPTER ONE ...................................................................................................1
1 INTRODUCTION ..........................................................................................1
1.1 OVERVIEW OF THE THESIS............................................................................ 1
1.2 THIN FILM DEPOSITION: HIGH K DIELECTRICS AND GATE METALS . 2
1.2.1 High K Dielectric.................................................................................................. 2
1.2.2 Gate Metal and Metal-Oxides............................................................................... 3
1.3 SUPERCRITICAL CARBON DIOXIDE IN THIN FILM DEPOSITION.......... 4
1.3.1 Chemical Fluid Deposition ................................................................................... 5
1.3.2 Atomic layer deposition........................................................................................ 6
1.4 OVERVIEW OF THE FOLLOWING CHAPTERS ................................................ 7
1.5 REFERENCES ...............................................................................................8
MY CONTRIBUTION TO THE FOLLOWING PAPER....................................9
CHAPTER TWO ................................................................................................10
2 Metal-oxide thin films deposited from metal organic precursors in
supercritical CO2 solutions. ................................................................................10
2.1 INTRODUCTION .................................................................................................. 12
v
2.2 EXPERIMENTAL METHODS.............................................................................. 14
2.3 RESULTS ............................................................................................................... 16
I. Deposition of Al2O3 films............................................................................................ 16
I.a Batch Deposition Method ...................................................................................... 16
I.b Cyclic Deposition Method..................................................................................... 19
II. Batch Deposition of other Metal-Oxide Films........................................................... 21
II.a Zr based films ....................................................................................................... 21
II.b Ru based films ...................................................................................................... 22
II.c Mn based films...................................................................................................... 23
2.4 DISCUSSION.......................................................................................................... 24
2.5 CONCLUSIONS..................................................................................................... 25
2.6 ACKNOWLEDGEMENS ...................................................................................... 27
2.7 REFERENCES ....................................................................................................... 28
CHAPTER THREE ............................................................................................46
3 Cyclic/Atomic Layer depositions of Metal-Oxide and Metal Thin Films
from Metal Organic Precursors in Supercritical CO2 Solution ..........................46
3.1 INTRODUCTION .................................................................................................. 46
3.2 EXPERIMENTAL METHOD................................................................................ 48
3.3 RESULTS AND DISCUSSION ............................................................................. 51
3.4 CONCLUSION....................................................................................................... 57
3.5 ACKNOWLEDGEMENTS.................................................................................... 58
3.6 REFERENCES ....................................................................................................... 59
CHAPTER FOUR...............................................................................................74
4.1 WORK SUMMARY............................................................................................... 74
4.2 FUTURE WORK.................................................................................................... 75
vi

LIST OF TABLES
Table 2.1 ............................................................................................................... 31
Table 3.1 List of metal and metal oxide films, precursors, experimental conditions and
net results............................................................................................................... 63
Table 3.2 Number of deposition cycle, corresponding film thickness, and oxygen to
aluminum atomic ratio in deposited films from three different sets of precursors...............64
vii

LIST OF FIGURES
Figure 2.1 A schematic of the deposition system ......................................................... 32
Figure2.2 XPS survey scan for an Al based film deposited from Al(acac) and H O at at
120°C and 1700 psi . Peaks assigned to Al 2s, Al 2p , C1s and O1s core electrons can be
distinguished.
3 2 2
......................................................................................................... 33
Figure 2.3 High resolution scans for the (a) Al 2p, (b) C1s and (c) O1s peaks for XPS survey
scan for an Al based film deposited from Al(acac) and H O at 120°C and 1700 psi on Si
substrates with native oxide. From the location and width of the peaks we conclude that the
film is a mixture of Al O , Al(OH)O and Al-carbonate.
3 2 2
2 3 ................................................ 34
Figure 2.4 Transmission IR spectrum for an Al-based film deposited from Al(acac) and
H O at 120°C and 1700 psi on Si substrates with native oxide. Curve (i) shows a
measurement taken after film deposition and curve (ii) shows a spectrum taken after the film
was annealed at 600°C in N for 5 min. Spectrum (i) exhibits features at 1200-1700 cm
associated with several carbonate species. The broad peak at 3000-3600 cm is due to the O-
H stretching modes of both undissociated H O molecules and surface H-bonded OH species.
Al-O bonding is detected by the borad peak at 400-800cm . Mild anneal result in the
disappearance of the IR signature of the carbonates and hydroxides.
3
2 2
2-1
-1
2
-1
............................... 35
Figure 2.5 Transmission IR spectrum for an Al-based film deposited from Al(hfac) and
H O at 130°C and 2500 psi. The spectrum shows features compatible with the presence of
H O in the film (3600-3000 cm ) and Al-O bonding (850-500cm ). Well resolved peaks at
1700cm and 1300-1150cm are attributed to the presence of carbonate type and C-F
3
2 2
2-1 -1
-1 -1
viii

bonding in the film. A mild anneal for 10 min at 600°C in N removes most of the IR
signature of these impurities, and reinforces the Al-O peak.
2
........................................... 36
Figure 2.6 Frequency dependence (a) and hysteresis (b) of the C vs. V measurements for Al-
based film deposited from Al(acac) and H O at 80°C , 2060 psi and annealed at 600°C in
N for 10 min. Change of frequency from 1MHz to 100 KHz does not change the shape of
the curve substantially indicating good quality interface. However, the hysteresis is quite
large ~500 mV.
3 2 2
2
....................................................................................................... 37
Figure 2.7 High resolution XP scans for the (a) Al 2p, (b) C1s, and (c) O1s peaks for two
aluminum based films deposited via reagent cycling. Both films were deposited at 120°C,
and 1600 psi. Film marked HP was deposited form Al(acac) and H O , while film TBP was
deposited from Al(acac) and tert-butyl peracetate
3 2 2
3 ........................................................ 38
Figure 2.8 High resolution XP scans for the (a) Zr 3d, (b) C1s, and (c) O1s peaks for a Zr
based film deposited from Zr(acac) and tert-butyl peracetate at 150°C, and 1700psi. The
film composition can best be described a hydroxycarbonate.
4
.......................................... 39
Figure 2.9 XP survey spectrum for a Ru based film deposited from Ru(tmhd) and H O at
150°C, 3600 psi. The presence of the Ru 3d and Ru 3p peaks verify the deposition of a Ru-
based film on Si substrate.
3 2 2
........................................................................................ 40
Figure 2.10 High resolution XP scans for the (a) Ru 3d- C1s, and (b) O1s peaks for a Ru
based film deposited from Ru(tmhd) and H O at 150°C, 3600 psi. The film contains a
mixture of Ru oxides and possibly carbonates and hydroxides.
3 2 2
....................................... 41
ix
Figure2.11 XP survey spectrum for a Ru based film deposited from ruthenocene and H O at
130°C, 3120 psi. The presence of the Ru 3d and Ru 3p peaks verify the deposition of a Ru-
based film on Si substrate.
2 2
........................................................................................ 42
Figure2.12 High resolution XP scans for the (a) Ru 3d- C1s, and (b) O1s peaks for a Ru
based film deposited from ruthenocene and H O at 130°C, and 3120 psi. The film contains a
mixture of Ru oxides and possibly carbonates and hydroxides.
2 2
....................................... 43
Figure2.13 XP survey spectrum for a Mn based film deposited from Mn(hfac) and H O at
150°C and 3500 psi. Fluorine from the precursor is observed in the film.
3 2 2
......................... 44
Figure2.14 High resolution XP scans for the (a) C1s, (b) O1s and (c) Mn 2p peaks for a Mn
based film deposited from Mn(hfac) and H O at 150°C and 3500 psi. The highlighted area
on plots b and c show the range of binding energies available to O 1s and M2p electrons due
to the large number of oxidation states available to the Mn atoms. The film contains a
mixture of Mn oxides with carbonates and hydroxides.
3 2 2
................................................. 45
Figure 3.1 Schematic diagram of the experimental set-up .............................................65
Figure 3.2 Ellipsometric thickness data for Al-based film deposited from Al(hfac)3-H2O2 at
100°C and ~2000 psi on Si(100) with native oxide. Figure shows linear growth behavior.
Longer precursor time shows high rate of film growth. For same precursor exposure time (30
seconds), different growth rates are observed for two different sample orientations. .......... 66
Figure 3.3 AFM image of Al-based film deposited in 23 cycles from Al(hfac)3-H2O2, at
100°C and ~2000 psi. JTB treated native Si(100) is used as the substrate. The RMS value for
x

the film is ±2.3 nm while the ellipsometric thickness is 117 Å. The gray scale of this image
spans 100 Å from dark to light and each unit in the z-direction corresponds to 50 nm……..67
Figure 3.4 High-resolution XPS peaks for I. Al 2p, II. O 1s, and III. C 1s deposited from
a)Al(hfac)3-H2O2 at 100°C,~2000 psi, b)Al(acac)3-H2O2 at 120°C, ~1600 psi, and c)
Al(acac)3-TBP at 120°C and ~1600 psi. Native Si(100) is used as the substrate. Comparative
chemical states are evaluated from the relative peak positions for the different sets of
precursors. ............................................................................................................. 68
Figure 3.5 High resolution XP-Spectra for a) C1s, b) Pd 2p,and c) O1s for palladium film
deposited from Pd(hfac)2-H2 in 20 cycles. Native Si(100) is used as the substrate. Deposition
temperature is 70°C and pressure ~2000 psi. Ligand and precursor derived contamination
from fluorine, carbon and oxygen is anticipated. .......................................................... 69
Figure 3.6 Comparative XPS peaks for Pd3d and Si 2p.Palladium film is deposited from
Pd(hfac)2-H2 in different two different number of cycles. Si(100) with native oxide is used as
the substrate. The large difference in Pd3d to Si2p peak-height ratio in two cases indicates
multilayer film growth in each cycle........................................................................... 70
Figure 3.7 AES survey spectra for RuOx film deposited from ruthenocene (RuCp2) and
H2O2 in 10 cycles. Reaction temperature is 100° C and pressure ~2000 psi. Si(100) with
native oxide is used for deposition. The inset shows high- resolution peak for Ru LMM. ... 71
Figure 3.8 High resolution XP-spectra showing a) Ru3p and b) Si 2p peaks for the RuOx
films deposited on chemically oxidized surface of Si(100) at 200°C and ~1500 psi. The
attenuating intensity of Si 2p signal indicates growing film thickness with increasing number
of deposition cycle................................................................................................... 72
xi

Figure 3.9 AFM images of Ru/RuOx film deposited from RuCp2 and H2O2 at 200°C and
~1500 psi: a) 8 cycles, b)20 cycles, and c)30 cycles. Chemically oxidized Si(100) was used
for the deposition. Figure shows increasing surface roughness with increasing number of
deposition cycles. Change in interface morphology indicates non-ideal ALD growth. ........ 73
xii

CHAPTER ONE
1 INTRODUCTION
1.1 OVERVIEW OF THE THESIS
At the end of the twentieth century, the semiconductor industry went through a
technology boom and an unprecedented progress was achieved in this field. The advent of
high technology processes and newer inventions lead to an exponential increase in quality
and quantity in semiconductor device processing and characterization. In spite of this
revolution, the basic and key issues for microfilm deposition, the core of semiconductor
processing, remained unresolved, and imposing a great challenge against this on going
momentum. Therefore, newer approaches in thin film deposition processes are essential at
this moment.
Current thin film deposition techniques are based on high vacuum processes which
involve several limitations such as high process temperature, low precursor volatility,
thermodynamic instability at heterogeneous interface, non-conformal deposition on high
aspect ratio surface, etc. In order to overcome these limitations, extensive researches are now
focused on exploring and utilizing the possibilities of different deposition techniques such as
chemical vapor deposition (CVD), plasma enhanced chemical vapor deposition (PECVD),
photon assisted chemical vapor deposition (PACVD), atomic layer deposition (ALD), etc. In
addition to these better-known high-vacuum processes, supercritical carbon dioxide (Sc CO2)
based deposition of microfilm is at its infantry and almost unexplored. My research in the
Department of Chemical and Biomolecular Engineering of North Carolina State University is
to develop a supercritical carbon dioxide based deposition system and explore its potential or
low temperature deposition of ultra-thin, high k dielectric materials and gate metals using
1

metal organic precursors. The goal of this dissertation is to present a rigorous analysis of the
deposited film in quest of the following:
1. Viability of supercritical carbon based deposition process for metal and dielectric
deposition in parallel to its high vacuum counterparts.
2. Potential application of supercritical carbon dioxide for film growth in atomic layer
deposition (ALD) process.
3. Evaluation of deposited films in terms of their chemical composition and film purity
A Sc CO2 based high pressure deposition system has been developed and used to deposit
different metal oxides (aluminum oxide, zirconium oxide, manganese oxide, ruthenium
oxide, and yttrium oxide), and metals (palladium and ruthenium) from metal organic
precursors in Sc CO2 solution. Experiments are conducted in two different modes, chemical
fluid deposition (CFD) 1 and atomic layer deposition (ALD).2 New sets of materials are
introduced in the deposition processes and device quality metal oxide films are obtained
from the CFD process. The ALD process has been proven to give tunable film thickness
although this process does not obtain atomically controlled growth. Both processes show low
temperature (70-200°C) deposition although film composition and surface morphology are
not up to expectation in many cases.
1.2 THIN FILM DEPOSITION: HIGH K DIELECTRICS AND GATE METALS
1.2.1 High K Dielectric
Silicon dioxide (SiO2) has been used as the gate dielectric in metal-oxide-
semiconductor (MOS) devices for past 30 years. Rapid reduction in device dimension is a
challenge for SiO2 gate dielectric in future MOS devices. As devices dimension goes smaller,
2

it becomes necessary to reduce the thickness of the gate oxide in order to meet the target
device capacitance. The capacitance of a dielectric can be expressed as C = εrε0/tox, where
dielectric constant, k=εr, tox is the gate oxide thickness and C is the gate capacitance per unit
area. Reduced thickness leads to an exponential increase in electron tunneling through gate
oxide. Therefore, a replacement of SiO2 with some high dielectric constant material is
necessary for advanced MOS devices. A high dielectric constant would allow a thicker film
in place of SiO2 thereby minimizing the leakage current but still giving the same capacitance.
Metal oxides such as, aluminum oxide, (Al2O3), tantalum oxide (Ta2O5), zirconium oxide
(ZrO2), hafnium oxide (HfO2), titanium oxide (TiO2), and SrTiO3, yttrium oxide (Y2O3), with
a k value ranging 10-40 3, are potential candidates for high k gate dielectric applications. In
this work, we introduced the Sc CO2 based deposition of high k metal oxides for the first
time.
1.2.2 Gate Metal and Metal-Oxides
In current CMOS devices, highly doped p-type and n-type polysilicon are used as
gate electrodes on top of the gate dielectric layers. The high resistance of the polysilicon-
gate and its dopant depletion is a significant issue against its use for sub-100 nm scale
semiconductor devices. The resistance of a polysilicon gate can be reduced by increasing its
dopant concentration although the maximum concentration of the dopant is limited by its
solubility in polysilicon. Further, high doping can enhance boron penetration into the
dielectric underneath which degrades the device performance. The dopant depletion in
polysilicon increases the equivalent gate-oxide thickness, which in turn reduces the effective
capacitances per unit area. For these reasons, metal gates are now being considered as a
replacement of polysilicon gates in future CMOS devices. Metal electrodes would impose a
3
lower contanct resistance than the polysilicon in smaller devices. Also high k dielectric
layers are now being considered for gate-oxide applications, which seem to be more
compatible with a metal than with polysilicon. Two different type metals are now being
considered for gate electrode applications: high work function metals in place of a p-doped
polysilicon and low work function metals in place of an n-doped polysilicon. In this study we
focused on two high work function metal/metal oxide (palladium and ruthenium oxide), both
having a work function close to 5.0 eV. Although not a metal, ruthenium oxide is a conductor
and therefore considered as a potential candidate for gate electrode applications.
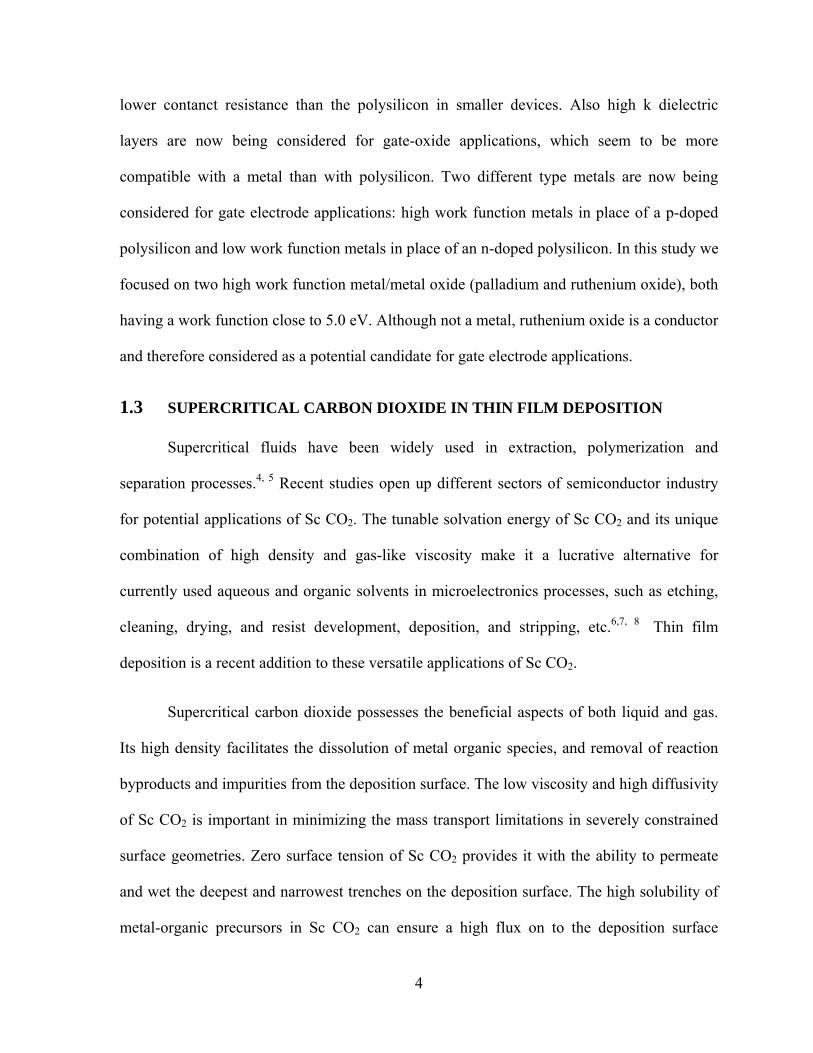
1.3 SUPERCRITICAL CARBON DIOXIDE IN THIN FILM DEPOSITION
Supercritical fluids have been widely used in extraction, polymerization and
separation processes.4, 5 Recent studies open up different sectors of semiconductor industry
for potential applications of Sc CO2. The tunable solvation energy of Sc CO2 and its unique
combination of high density and gas-like viscosity make it a lucrative alternative for
currently used aqueous and organic solvents in microelectronics processes, such as etching,
cleaning, drying, and resist development, deposition, and stripping, etc.6,7, 8 Thin film
deposition is a recent addition to these versatile applications of Sc CO2.
Supercritical carbon dioxide possesses the beneficial aspects of both liquid and gas.
Its high density facilitates the dissolution of metal organic species, and removal of reaction
byproducts and impurities from the deposition surface. The low viscosity and high diffusivity
of Sc CO2 is important in minimizing the mass transport limitations in severely constrained
surface geometries. Zero surface tension of Sc CO2 provides it with the ability to permeate
and wet the deepest and narrowest trenches on the deposition surface. The high solubility of
metal-organic precursors in Sc CO2 can ensure a high flux on to the deposition surface
4

thereby enhancing the film growth rate. Supercritical carbon dioxide is expected to broaden
the range of applicable precursors since the process is not limited by the precursor volatility.
Its non-toxic nature, amenable operating conditions and low cost of production make it a
unique choice among all other supercritical fluids.
In high vacuum processes, the kinetics of surface reaction including surface
adsorption/desorption of chemical species, oxidation, and reduction are driven by thermally
heating the solid substrate. The enhanced solvation energy of Sc CO2 can be a supplement
for a part of this thermal energy and minimize the deposition temperature thereby. Effective
use of solvation force effects is well established in electroplating and electroless deposition
processes.
1.3.1 Chemical Fluid Deposition
Hansen and his coworkers, in 1992, first demonstrated Sc CO2 assisted deposition of Indium
thin film from thermal decomposition of Indium acetylacetonate at 600°C.9 Later, in 1999,
Watkins and his coworkers deposited platinum thin film from hydrogen- reduction of a
platinum metal organic precursor in supercritical carbon dioxide at a temperature at 80ºC.1
The process, named chemical fluid deposition (CFD) by Watkins and his coworkers, is a
batch deposition process where the dissolved species in Sc CO2 react and form the metal film
on the deposition surface. To date, deposited films by CFD include Pt, Pd, Ru, In, Rh, Cu,
Au, and Ag. We introduced the deposition of metal oxides such as, Al2O3, ZrO2, RuOx, Y2O3
and MnO2 by this process.
Chemical fluid deposition seems to be a promising alternative for CVD and
electroless deposition processes since it combines the beneficial aspects of both the processes
5

while eliminating their limitations. CVD process is restricted by a few volatile precursors and
high reaction temperatures. Low volatility of precursors in CVD results in low gas phase
concentration, which reduces mass transfer in tortuous geometries. High processing
temperatures in CVD induce thermal and mechanical stresses, internal diffusion, and
interlayer reaction. Recent development of few metal organics and fluorinated precursors
allows low temperature MOCVD, but lowering of reaction temperature further exacerbates
film quality since surface desorption of reaction byproducts is kinetically driven by surface
heating. Use of liquid solvents in electroless deposition facilitates dissolution of chemical
species although high viscosity, high surface tension and low molecular diffusion in liquid
phase inhibit mass transport in constrained areas of the deposition surface.
1.3.2 Atomic layer deposition
Atomic layer deposition was first introduced by Suntola in 1970. The process
involves an alternate exposure of the substrate to reactants and intermediate purging of the
reactor after each exposure. During each exposure, the reactant species react with the surface
to form a chemisorbed monolayer. Therefore, film growth proceeds in a self limiting fashion
with a maximum thickness of one monolayer in each cycle. The thickness of ultra thin film
can be tuned by varying the number of deposition cycles. Film growth takes place in atomic
level on the interface while not affecting the bulk of the substrate. Low temperature
deposition, multi-level processing, better film quality and uniformity over large area are the
other benefits of ALD.
No previous work has been reported on supercritical carbon dioxide based ALD
process. In this study, we introduced the supercritical carbon dioxide based ALD for the first
time. Experiments were carried out in a typical ALD mode with alternate precursor
6

exposures and intermediate flushing of the reaction cell with liquid/Sc CO2. Deposited films
by this process include aluminum oxide, palladium and ruthenium/ruthenium oxide.
1.4 OVERVIEW OF THE FOLLOWING CHAPTERS
Chapter two focuses on analyzing the chemical composition of different metal-oxide
films deposited from metal organic precursors. Also it compares the effect of different
materials used in the process. Detailed analysis leads to the fact that in deposited metal
oxides, the metals stay in multiple oxidation states. Formation of carbonates having different
metal content is observed depending on the oxidant used in the process. Post deposition
annealing has a significant effect on film composition. Electrical measurement proves device
quality deposition of metal oxide.
Chapter three aims at the atomic layer deposition process in supercritical carbon
dioxide medium. Detailed analyses are made to evaluate the process viability. Linear film
growth with deposition cycles has been established although atomic level growth is not
proved in this case. Compositional analyses are performed on the aluminum oxide and
palladium films. Surface morphologies of metal-oxide and metal films are evaluated to
justify this process.
7

1.5 REFERENCES
1. James J. Watkins, Jason M. Blackburn and Thomas J. McCarthy, “Chemical Fluid Deposition: Reactive Deposition of Platinum Metal from Carbon Dioxide Solution, Chemistry of Materials 11, 213-215 (1999)
2. Tuomo Suntola, Jaakko Hyvarinen, “ATOMIC LAYER EPITAXY”, Annual Review
of Materials Science 15, 177-195(1985)
3. E.P. Gusev, E. Cartier, D.A. Buchanan, M. Gribelyuk, M. Copel, H. Okron-Schmidt, C.D’Emic, “Ultrathin high-K metal oxides on silicon: processing, characterization and integration issues, Microelectronic Engineering 59, 341-349 (2001)
4. M. Angela, A. Meireles, “Supercritical extraction from solid: process design date
(2001-2003)”, Current Opinion in Solid State and Materials Science 7, 321-330 (2003)
5. Andrew I. Cooper, “Polymer synthesis and processing using supercritical carbon
dioxide”, Journal of Materials Chemistry 10, 207-234(2000)
6. Charles A. Jones, III, Dongxing Yang, Eugene A. Irene, Stephen M. Gross, Mark Wagner, James DeYoung, and Joseph M. DeSimone, “HF Etchant Solutions in Supercritical Carbon Dioxide for “Dry” Etch Processing of Microelectronic Devices”, Chemistry of Materials 15, 2867-2869(2003)
7. Gina L. Weibel, Christopher K. Ober, “An overview of supercritical CO2 application
in microeletronics processing”, Microelectronic Engineering 65, 145-152 (2003)
8. David J. Mount, Laura B. Rothman, Raymond J. Robey, Mir K. Ali, “The technology behind cleaning with supercritical fluids”, Solid State Tchnology, 103-106(2002)
9. Brian N. Hansen, Brooks M. Hybertson, Robert M. Barkley, and Robert E. Sievers,
“Supercritical Fluid Transport-Chemical Deposition of Films”, Chemistry of Materials 4, 749-752 (1992)
8

MY CONTRIBUTION TO THE FOLLOWING PAPER
The following paper, written by Dr. Theodosia Gougousi, includes my name as the second
author, reflects my participation in some of the experiments and analytical measurements.
Dr. Theodosia Gougousi was working as a post doctorate fellow here, and she was
conducting the research on this project. During the later stages of her work, I joined this
project and I was working with her as an assistant. Some of the experiments were done
before I joined here, although I took part in the analytical measurements for those
experiments (C-V measurement, Ellipsometry, FTIR) as per her guidance.
The data that I acquired by analytical measurements include figure 2.4 (FTIR), 2.5 (FTIR),
2.6 (Capacitance-Voltage), ellipsometry (we both did it together for several samples).
For the XPS measurements, I was with her during the XPS operation and data collection,
although I could not take part actively because of my technical ignorance of XPS at that
time.
During the experiments, I was with Dr. Theodosia Gougousi and I was learning the process
from her. My other contribution to the process is to build up the temperature controlling
system for the experimental set-up.
9

CHAPTER TWO
2 Metal-oxide thin films deposited from
metal organic precursors in supercritical CO2
solutions.
Theodosia Gougousi,*† Dipak Barua, Erin D. Young,‡ and Gregory N. Parsons
Department of Chemical and Biomolecular Engineering
North Carolina State University
Raleigh, NC 27695
RECEIVED DATE
ABSTRACT: Metal Oxide thin films, including Al2O3, ZrO2, MnOx and RuOx were
deposited on Si(100) substrates using metal-organic and precursors and oxidizing agents
dissolved in liquid and supercritical CO2 at pressures ranging from 1600 to 3600 psi using a
hot wall reactor. Precursors included Al(acac)3, Al(hfac)3, Zr(acac)4, Mn(hfac)4 and
* to whom correspondence should be addressed. E-mail: [email protected]
† Current address: Department of Physics, University of Maryland, Baltimore County, 1000 Hilltop Circle,
Baltimore, MD 21250
‡ Current address: Department of Chemical Engineering, University of Virginia, 102 Engineers' Way
P.O. Box 400741, Charlottesville, VA 22904-4741
10

Ru(tmhd)4. Aqueous H2O2 (30% weight) and tert-butyl-peracetate (50% in mineral spirits)
solutions were used as oxidizing agents. Growth was investigated at temperatures between
80°C and 200°C and compositional analysis of the films by X-ray photoelectron
spectroscopy, Auger electron spectroscopy and infrared transmission confirmed metal oxide
formation, although carbon content can be large under some conditions. Capacitance vs.
voltage analysis for the Al2O3 films annealed after deposition show that the films have good
dielectric properties. Utilization of supercritical carbon dioxide may provide an avenue for
the low temperature deposition of high quality metal-oxide thin films.
KEYWORDS: supercritical fluids, thin film deposition, high-k dielectrics, metal-oxide films,
Al2O3, ZrO2, MnOx, RuOx
11

2.1 INTRODUCTION
In most deposition and etching processes used for nano-electronic device fabrication,
kinetically controlled reactions, such as reactant adsorption, surface oxidation (or reduction),
and by-product removal are driven by energy delivered to the surface via substrate heating.
Other means for energy delivery includes plasmas and photon or ion bombardment, and often
the specific effects of these energy delivery approaches result to severe damage to the
deposited material. Another means to deliver energy is the use of solvation forces. These
forces are not commonly applied in thin film processing, but they could be utilized to help
enhance and expand the range of materials and conditions over which thin film deposition
and etching processes could be applied. In principle, energy associated with reactant or
product solvation or dissolution could be used to promote a desired reaction step. For
example, additional energy provided by solvation forces could enable deposition of metals at
very low temperatures on organic surfaces, where the solvent strength and structure is
designed to remove the unwanted metal-organic ligand without affecting the molecular
growth surface. Eventually, solvent assisted deposition could provide a means to stabilize
desired reaction intermediates during deposition, to enable tuning of the structure and
composition of the deposited film. Solution-based processes that involve solvation force
effects are widely used for electroplating or autocatalytic (electroless) deposition [1], [2], and
other applications, but these approaches are generally not amenable to a wide range of
materials.
The enhanced solvent characteristics of supercritical fluids [3] have been widely
utilized for extraction, separation, polymerization,[4] and other chemical processes including
metal thin film deposition.[5], [6], [7] Supercritical fluids are attractive solvents because
12

they provide high solubility of many species, due in part to high fluid density, and they
maintain beneficial aspects of gases, including low viscosity and high diffusivity.[3] For
example, the density of supercritical CO2 (critical temperature 31°C and critical pressure
7.4x10⁶ Pa) can exceed that of liquids, but the diffusivity of species dissolved in CO2 is
between that of species in liquid (~10-5 cm2/s ) and gases (~1 cm2/s) under typical process
conditions. Supercritical CO2 can suspend a significant density of molecular H2, and the
relatively high diffusivity can therefore enable a high flux of hydrogen or other soluble
reactive species to be delivered to a deposition surface [7], [8]. For these studies,
supercritical CO2 was used because it has an easily accessible supercritical point, and is safe
to work with.
Metal oxide materials are widely used in electronic devices for applications including
high dielectric constant insulators in transistor structures [9], magnetic tunnel junctions in
spintronic devices[10], as well as for optical coatings, barrier layers, and catalytic materials.
In this article, we demonstrate preparation of metal oxide films from metal alkoxide
precursors and oxidizing agents dissolved in liquid and supercritical carbon dioxide.
In most solvent-based thin film deposition processes, the substrate is exposed
simultaneously to the precursor and oxidants (or reductants), leading to continuous growth,
where the rate is determined by precursor supply or the rate of surface kinetic rate processes.
An alternate approach, widely used in vapor-phase deposition, is to supply reactants
sequentially, where individual adsorption and reaction steps are controlled individually.
Atomic layer deposition, for example, involves sequential reactant exposure where each
reaction step is self-limiting. In this article, we demonstrate both continuous and time-
13

sequenced chemical deposition of metal oxide films from precursors dissolved in liquid or
supercritical CO2.
2.2 EXPERIMENTAL METHODS
The films were deposited on native oxide or H-terminated Si (100) surfaces. Both
types of substrates were prepared by wet cleaning (JTB-100 Baker clean), deionized water
rinse and blown dry with N2. For the H-terminated surfaces the dry substrates were dipped in
Buffered Oxide Etch (BOE) typically for 5 to 10s until they appeared dewetted upon
removal. The precursors were purchased from commercial sources (Sigma-Adrich and Strem
Chemicals) and used without further treatment. Coleman grade CO2 with a 99.99% purity
was used for all the experiments.
All films were deposited in a homemade high-pressure ~20 mL stainless steel cell
with sapphire windows. Two different deposition methodologies were explored: 1) batch
processing, where all reactants were introduced to the deposition vessel simultaneously; and
2) cyclic processing, where reactants were introduced in a sequential repeated time sequence
to build films layer-by-layer. A piece of pretreated Si was placed inside the cell along with a
known mass, usually 0.3-0.5 wt.%, of the relevant precursor. The cell was then sealed and
heated to 45°C using resistive heaters. Once the temperature of the cell equilibrated, usually
within 15-20min, the cell was filled with pressurized CO2 from an ISCO 260D syringe pump
through a high-pressure manifold. Then the temperature was raised to the desired reaction
temperature and the precursor was allowed to dissolve. For some of the fluorinated metal
organic precursors this was accomplished within a few minutes and the dissolution could be
monitored through the window. For less soluble precursors such as the acetylacetonates the
precursors were allowed about 30 min to saturate the solution. Then ~0.3ml of the oxidizer
14

solution was injected inside the high-pressure manifold and CO2 from the syringe pump was
used to push it inside the cell. Two oxidizers were tested in the course of this work; a 30%
aqueous solution of H2O2 and a 50% solution of tert-butyl peracetate in mineral spirits. The
H2O2 has very poor solubility in sc CO2 while tert butyl peracetate has very high solubility.
In both cases the oxidizer to precursor molar ratio was approximately 50x, and the reagents
were permitted to react for 30 – 90 min. The experimental set up is shown on Fig 2.1 and it
follows the technique developed by Watkins et al.
For the cyclic deposition process the substrate was exposed sequentially to the
precursor and the oxidizer imitating the Atomic Layer Deposition technique (ALD)
developed for vacuum based thin film deposition. For that purpose a precursor solution in
supercritical carbon dioxide was prepared in a high pressure generator (~60 mL). The
alternating exposure can be described as follows: Initially, the reaction cell was purged and
then pressurized with CO2 at ~1500psi at the desired reaction temperature. Then, a small
amount of the oxidizer solution was admitted in the reaction cell. For H2O2 the fluid was
injected as described above for the batch process. Tert-butyl peracetate is soluble in sc CO2
and a solution in supercritical carbon dioxide (~60°C) was prepared in a large volume
(~100mL) high-pressure cell. The oxidizer solution was permitted to equilibrate and saturate
the substrate surface for 3-5 min. Then the cell was flashed slowly, using a continuous CO2
stream to avoid oxidizer precipitation on the substrate. From atmospheric pressure the cell
was pressurized again to ~1500 psi and the precursor solution was injected in the cell.
Substrate exposure times were comparable to the oxidizing step. Following exposure the cell
was evacuated and the process repeated. The duration of each cycle was between 20 and 45
min.
15

The samples were characterized using X-ray Photoelectron Spectroscopy (XPS),
transmission Fourier Transform Infrared Spectroscopy (FTIR), and capacitance vs. voltage
measurements (C-V). The XPS measurements were performed with a Riber LAS3000
(MAC2 analyzer, Mg Kα hv=1253.6 eV, non-monochromatic X-ray source) at 75º take-off-
angle with 0.1eV step size. We compensated for sample charge effects by setting the
adventitious C 1s peak to a binding energy of 285.0 eV. A ThermoNicolet IR bench
equipped with a Deuterated Tri-Glycine Sulfate detector (KBr beamsplitter) was used in the
transmission mode and for a typical spectrum we collect 256 scans at 4 or 8 cm-1 resolution.
The instrument was purged using purified air with low concentrations of moisture and CO2.
A background spectrum was collected after each measurement using a substrate fragment
that originates from the same wafer as the deposited substrate.
For electrical analysis aluminum top and back-contacts were formed by resistive-
heating evaporation using shadow masks. Capacitances vs. voltage measurements were
performed with an HP 4284A impedance meter at 1MHz. Typical capacitor area was
~4.3x10⁻⁴cm2. Flatband voltage (VFB) and equivalent oxide thickness (EOT) were obtained
by processing the C-V characteristics with the NCSU C-V program that includes corrections
for the quantum mechanical effects.[9]
2.3 RESULTS
I. Deposition of Al2O3 films
I.a Batch Deposition Method
Aluminum oxide films were deposited on Si substrates via both the batch and the
cyclic deposition approach using aluminum acetylacetonate (Al(acac)3) and its fluorinated
16

equivalent, aluminum hexafluoroacetylacetonate (Al(hfac)3), as precursors. Figure 2.2
shows the XPS survey spectrum for a film that was deposited using the batch approach on
native oxide Si substrate at 120°C and 1700 psi using Al(acac)3 and H2O2. In the spectrum,
features associated with the O1s, C1s and Al 2s and 2p core electron are observed confirming
the presence of these elements in the film. Si peaks are not visible indicative of film at least
50Å in thickness. For more information regarding the bonding environment in the film, high
resolution scans of the Al 2p, C1s and O1s peaks are presented in Figure 2.3. In the more
detailed Al 2p spectral region shown in Fig 2.3(a) a broad feature located at 74.3 eV is
observed. The width of the peak suggests that Al is present in the film in more than one
oxidation state. The 2p3/2 electrons from elemental Al have a binding energy of 72.8 eV[11],
while 2p3/2 electrons from Al bound to O in Al2O3 have a binding energy of 74.6 eV [12].
The Al 2p3/2 electrons in AlO(OH) have a binding energy of 76.7eV[13], and range[14],[13]
from 74.3 eV to 75.9 eV in Al(OH)3. The high-resolution scan for the O1s region (Fig. 2.3c)
shows a fairly broad peak at 532.4 eV, also consistent with a range of binding environments.
The O1s electron binding energy for Al2O3 is 531.4 eV [15], which is similar to the O1s
binding energy for Al(OH)3 at 531.53eV[16] and that for AlO(OH) at 531.5.[14] The O1s
electrons in carbonate species are also known to have binding energies[17], [18] around ~532
eV. The C1s high-resolution scan shown on Fig. 2.3b confirms the presence of bound carbon
atoms in the film. Two peaks are clearly resolved; the one at 285 eV can be ascribed to
adventitious C while the peak at 289.5 eV is indicative of C bonded to a more
electronegative element, probably oxygen.
Transmission infrared spectroscopy can be used to confirm the presence of carbonate
species in the film. Figure 2.4 shows the infrared spectrum for an Al2O3 film prepared under
similar conditions (curve i). The 1200-1700 cm-1 spectral range is associated with
17
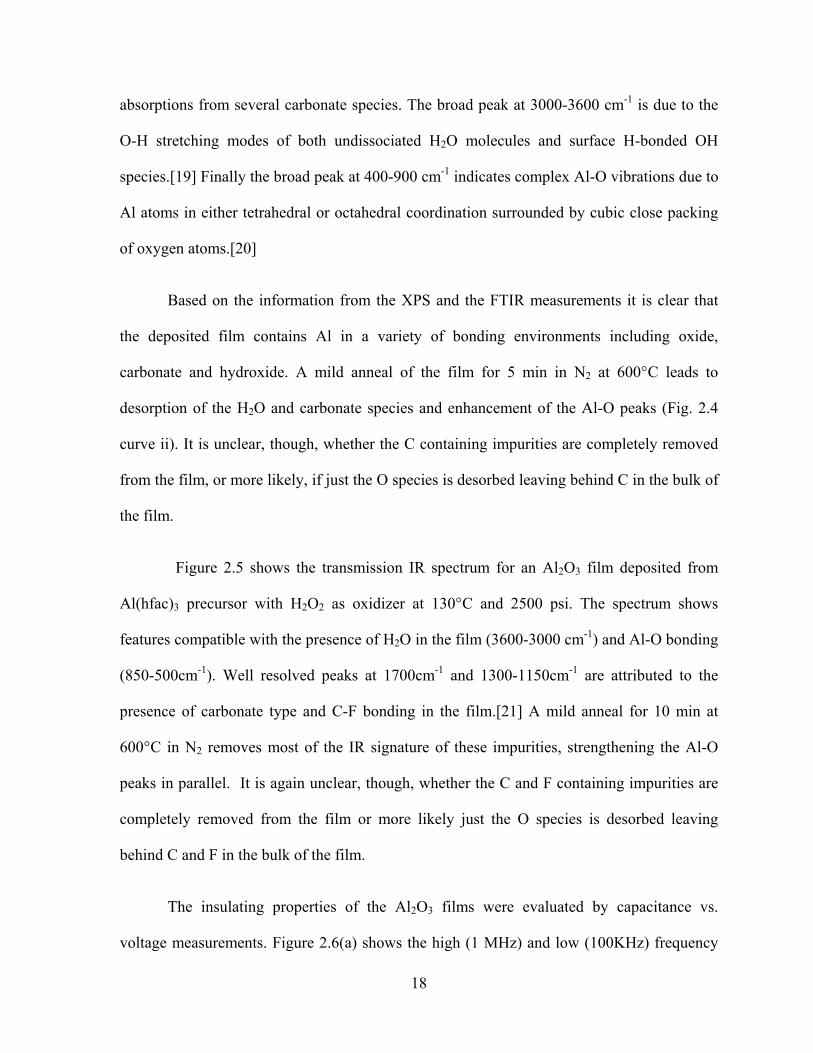
absorptions from several carbonate species. The broad peak at 3000-3600 cm-1 is due to the
O-H stretching modes of both undissociated H2O molecules and surface H-bonded OH
species.[19] Finally the broad peak at 400-900 cm-1 indicates complex Al-O vibrations due to
Al atoms in either tetrahedral or octahedral coordination surrounded by cubic close packing
of oxygen atoms.[20]
Based on the information from the XPS and the FTIR measurements it is clear that
the deposited film contains Al in a variety of bonding environments including oxide,
carbonate and hydroxide. A mild anneal of the film for 5 min in N2 at 600°C leads to
desorption of the H2O and carbonate species and enhancement of the Al-O peaks (Fig. 2.4
curve ii). It is unclear, though, whether the C containing impurities are completely removed
from the film, or more likely, if just the O species is desorbed leaving behind C in the bulk of
the film.
Figure 2.5 shows the transmission IR spectrum for an Al2O3 film deposited from
Al(hfac)3 precursor with H2O2 as oxidizer at 130°C and 2500 psi. The spectrum shows
features compatible with the presence of H2O in the film (3600-3000 cm-1) and Al-O bonding
(850-500cm-1). Well resolved peaks at 1700cm-1 and 1300-1150cm-1 are attributed to the
presence of carbonate type and C-F bonding in the film.[21] A mild anneal for 10 min at
600°C in N2 removes most of the IR signature of these impurities, strengthening the Al-O
peaks in parallel. It is again unclear, though, whether the C and F containing impurities are
completely removed from the film or more likely just the O species is desorbed leaving
behind C and F in the bulk of the film.
The insulating properties of the Al2O3 films were evaluated by capacitance vs.
voltage measurements. Figure 2.6(a) shows the high (1 MHz) and low (100KHz) frequency
18

C-V curve for a film that was deposited from Al(acac)3 and H2O2 at 80°C, 2060psi, and was
annealed at 600°C in N2 for 10min. The two curves are fairly similar indicating the absence
of substantial concentration of interface traps.[22] Based on the C-V data the Equivalent
Oxide Thickness (EOT) of the film is 71Å, and the flatband voltage is ~ -0.14eV indicating
the presence of a small amount of positive fixed charge. However, in Fig. 2.6(b) the
hysteresis for the 1MHz curve for the same film is quite large (~500mV) indicating large
concentrations of mobile charge in the bulk of the film.[22] This is probably due to bulk
carbonate and hydroxide species detected by XPS and IR measurements. The post-
deposition anneal has probably removed most of the IR signature of these species, however,
it is not clear what happens to the C in the film. Previous work on LaSiO films has shown
that formation of carbonates and hydroxides may recur even after high temperature anneals
of the films. [23]
I.b Cyclic Deposition Method
The cyclic process was also used to deposit Al2O3 films from Al(acac)3 precursor
with either H2O2 or tert-butyl peracetate solutions as oxidizers. Both oxidizers were used
under similar temperature and pressure conditions, at 120°C, and 1600psi. For the H2O2
process, for 9 cycles we measured a film thickness of ~40Å using spectroscopic
ellipsometry, while for the tert-butyl peracetate based process for 12 cycles we measured a
film thickness of 35Å. Thickness values from ellipsometry measurements were obtained
assuming optical constants for Al2O3 on SiO2. Figure 2.7 shows the high resolution XP
spectra for Al 2p C1s and O1s core electrons for both films. The Al 2p spectrum (Fig. 2.7a)
is substantially different for the two samples. For the film deposited with H2O2 (labeled HP)
a peak is observed at 74.8 eV indicative of Al-O bonds. For the film deposited using tert
butyl peracetate (labeled TBP) the peak is shifted to higher binding energy (~75.5eV) which
19

indicates bonding of the Al atoms with more electronegative species. The C 1s spectrum
shows the existence of adventitious C (peak at 285 eV) for both samples. For sample HP a
second peak at 289.3eV is well resolved evidence of carbonate formation in the film. For
sample TBP the C1s spectrum tails toward the higher binding energies with a shoulder at
~289.5 eV. The O1s spectra for both samples are quite similar containing contributions from
SiO2, Al2O3 and various hydroxides and carbonates.
From the relative intensity of the Al 2p peak (note the 10x multiplication factor for
the tert-butyl peracetate sample) we can conclude that the Al content of the TBP film is
significantly lower than for the HP and/or the TBP film is much thinner. Based on the
binding energies of the O 1s electrons in Al2O3 (74.6eV), AlO(OH) (76.7eV) and
Al(OH)3(74.3-75.9eV) we can conclude that the two films show evidence for hydroxides and
carbonates. However, the proportion of these components in each film appears to be quite
different. From the location of the Al2p peak we conclude that a) film TBP has a small Al2O3
content and most of the Al is bonded as AlO(OH) and b) film HP has a higher Al2O3 and
Al(OH)3 content and some carbonate content. The carbon content is difficult to analyze by
ex-situ XPS due to the adventitious carbon from the environment. The higher OH content
for film HP can be justified from the use of the aqueous H2O2 solution during the oxidation
reaction. The process cycle for TBP film does not include exposure to H2O, however, Al
oxides are hydrophilic and most likely the film absorbed H2O from the ambient after removal
from the high pressure cell. It is not clear whether the carbonate formation occurs during the
reaction or after ambient exposure. Other group III based oxides and silicates are very
susceptible to reactions with atmospheric carbon dioxide to form various types of carbonate
species.[23]
20
II. Batch Deposition of other Metal-Oxide Films
In addition to Al2O3 several other metal organic precursors were tested in similar conditions.
Table 2.1 gives a summary of all films deposited, including the precursor used, and the
oxidizing agent. Also included in the table are observations of general solubility of the
precursors, and whether film formation was observed. The following section contains XPS
characterization data for some of these films.
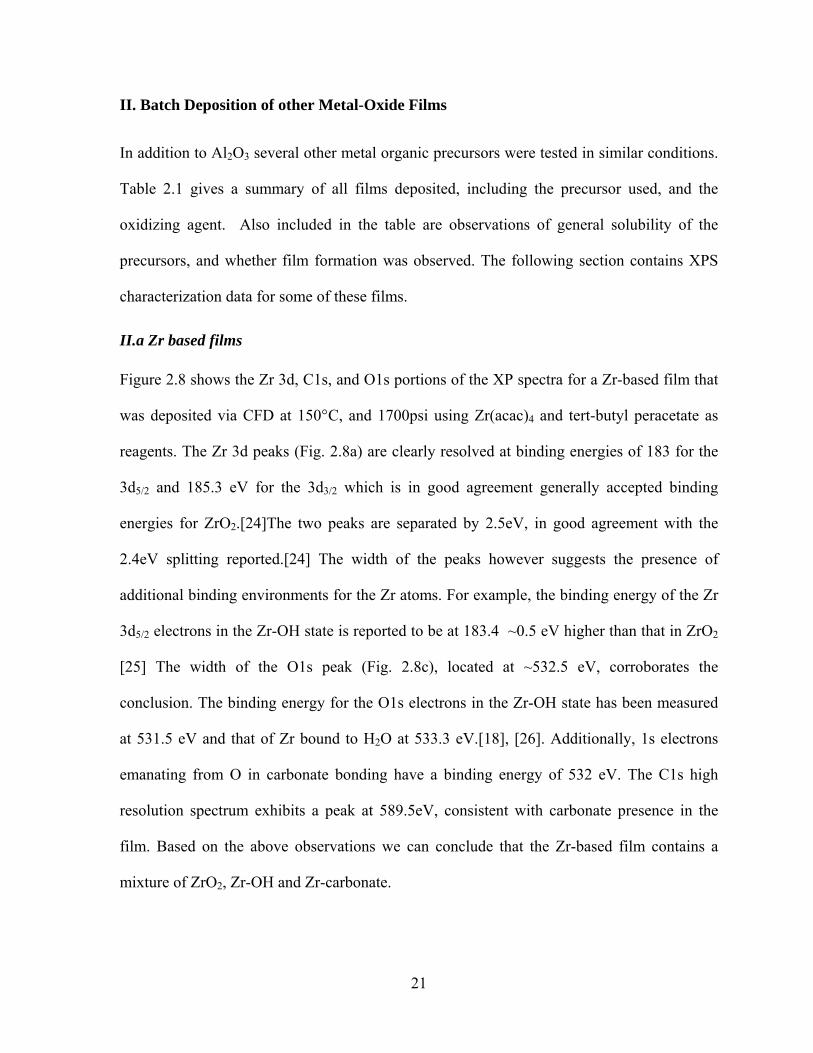
II.a Zr based films
Figure 2.8 shows the Zr 3d, C1s, and O1s portions of the XP spectra for a Zr-based film that
was deposited via CFD at 150°C, and 1700psi using Zr(acac)4 and tert-butyl peracetate as
reagents. The Zr 3d peaks (Fig. 2.8a) are clearly resolved at binding energies of 183 for the
3d5/2 and 185.3 eV for the 3d3/2 which is in good agreement generally accepted binding
energies for ZrO2.[24]The two peaks are separated by 2.5eV, in good agreement with the
2.4eV splitting reported.[24] The width of the peaks however suggests the presence of
additional binding environments for the Zr atoms. For example, the binding energy of the Zr
3d5/2 electrons in the Zr-OH state is reported to be at 183.4 ~0.5 eV higher than that in ZrO2
[25] The width of the O1s peak (Fig. 2.8c), located at ~532.5 eV, corroborates the
conclusion. The binding energy for the O1s electrons in the Zr-OH state has been measured
at 531.5 eV and that of Zr bound to H2O at 533.3 eV.[18], [26]. Additionally, 1s electrons
emanating from O in carbonate bonding have a binding energy of 532 eV. The C1s high
resolution spectrum exhibits a peak at 589.5eV, consistent with carbonate presence in the
film. Based on the above observations we can conclude that the Zr-based film contains a
mixture of ZrO2, Zr-OH and Zr-carbonate.
21

II.b Ru based films
Figure 2.9 shows the survey spectrum for a Ru based film deposited from Ru(tmhd)3
and H2O2 at 150°C, 3600 psi. The Ru 3p and Ru 3d peaks are clearly visible, along with the
O1s, C1s and Si 2p peaks. High resolution spectra of the Ru 3d region at 270-295 eV and the
O1s region at 525-535 eV is shown on Fig. 2.10a and 2.10b respectively. The Ru 3d peaks
overlap partially with the C1s peak, but the lowest binding energy for a carbon peak is that of
adventitious carbon at 285. Based on that, the peak at ~281.1 eV is assigned to the 3d5/2
component. The existence of the Ru 3p peaks in the survey spectrum corroborates the
presence of Ru in the film and the previous peak assignment. Ru can form several oxides that
vary in the binding energy of the Ru 3d peaks. For RuO2 the 3d5/2 electrons appear at
280.6eV [27] while the ones from RuO3 at 282.5eV [28]. The location of the observed peak
at 281.1eV may indicate the existence of both RuO2 and RuO3 in the film. On the O1s
spectrum presented on Fig. 10b the locations are marked for the O1s electron signals from
RuO2 (529.4eV [28]) and RuO3 (530.7eV [27]). The peak in Figure 2.10(b) is fairly broad
and confirms that both oxidation states are present in the film. However, based on the O1s
data we can not exclude the presence of Ru-OH or Ru carbonate species either.
RuOx deposition was also achieved by using Bis (cyclopentadienyl) ruthenium
(ruthenocene) and H2O2 at 130°C and 3120 psi. Figure 2.11 shows the survey spectrum that
includes the Ru 3p, Ru 3d O1s, C1s and Si 2p peaks. Figure 2.12 shows the O1s, Ru3d/C1s
regions in high resolution. The conclusions regarding the composition of the film are pretty
similar to the previous Ru-based film deposited from Ru(tmhd)3 and H2O2.
22

II.c Mn based films
Finally Figure 2.13 presents the survey spectrum for a Mn based film, deposited from
Mn(hfac)3 and H2O2 at 150°C and 3500psi. There are several peaks in the survey spectrum;
the most intense are the Mn2p, O1s, C1s, F1s and Si2p. High resolution spectrum for C1s,
O1s and Mn2p are shown on Fig 2.14(a),(b), and (c) respectively. For the Mn 2p peaks the
2p3/2 and 2p5/2 are located at 653.9 eV and 642 eV and show a splitting of 11.9 eV in good
agreement with the 11.7 eV generally cited. [29] Mn appears in oxides with a variety of
oxidation numbers and the 2p core electrons reflect that difference in the binding energy. For
the 2p5/2 component binding energies range from 640.5 eV for MnO [30] to 642.2 eV for
MnO2 [31]. Other Mn-based oxides are Mn2O3 with a binding energy of 642 eV [29] and
Mn3O4 with a binding energy of 641.2 [30]. Finally, Mn bound in MnO(OH) has a binding
energy of 641.7 eV. [30] On Fig. 2.14 c we shade the extended region where these peaks
occupy and classify all the oxides as MnOx. Most likely the film contains most or all of these
oxides and hydroxides. Also, since the Mn peaks occupy a more extended region than the
MnOx highlighted area we can conclude that Mn must be bound to O in other configurations
and/or bound to other elements. The C1s and O1s peaks offer nore clues in that direction. On
the C1s plot (Fig. 2.14a) we see a peak at 288.8 eV indicative of carbonate bonding. The O1s
peak (Fig. 2.14 b) is located at 531.7 eV and covers a broad range. All the MnOx-Mn(OH)O
compounds have O1s binding energies inside the highlighted area. From the peak location
we conclude that although oxide is present in the film, most likely the dominant bonding
environment is that of carbonate and hydroxide with binding energies at 532eV [17] and
532.8 eV [32].
23

2.4 DISCUSSION
Several metal oxides films have been deposited using precursors soluble in
supercritical carbon dioxide. Use of the aqueous H2O2 solutions as oxidizer generally leads to
hydroxide and carbonate concentration. It is well established that exposure of metal oxide
powders to carbon dioxide in an environment with high moisture concentration promotes the
formation of carbonate species.[33],[34] We conclude that H2O in the cell during the reaction
is likely responsible for the large extent of carbonate formation.
For the batch process the aqueous solution of H2O2 is the most successful oxidizing
agent for film growth. Both H2O2 and H2O have low solubility in sc CO2 and thus are not
considered very desirable oxidizers for this process. It is possible that the solvation energy,
along with the mild thermal energy provided in the reaction, is sufficient to liberate reactive
atomic oxygen from the peroxide. A serious drawback of using the hydrogen peroxide
solution is absorption of water into the metal oxide film as confirmed by infrared and XPS
measurements. A non aqueous oxidizer is highly desirable especially for applications
involving the hygroscopic group III metal oxides. A non-aqueous highly soluble tert-butyl
peracetate solution was tested, which has been used successfully in the removal of Cu(0)
during a sc CO2 based “dry” chemical mechanical planarization process[35]. Thin film
growth was observed using this oxidizer, but growth rates were generally low. This is
attributed to homogeneous reactions between the dissolved metal precursor and the oxidizer.
To prevent reactions of the precursor with the oxidizer in the supercritical phase the
two reagents were introduced in the cell sequentially, mimicking an ALD process. In that
scheme, since the two reagents do not coexist in the cell only surface reactions are feasible.
Using this cyclic approach, deposition of films was demonstrated using both H2O2 and tert-
24

butyl peracetate solutions as oxidizers. SE measurements analyzed using the optical
constants of Al2O3 and SiO2, indicated that the deposition rate for the process using the
organic peroxide is lower but comparable to that of H2O2. However, comparison of the XPS
Al 2p peak intensities suggests that the film TBP deposited with tert-butyl peracetate
solutions has a substantially lower Al content. IR and XPS measurements confirm the
presence of Al atoms bound in carbonate and hydroxide configurations. Based on that it
appears that the extraction of film thickness based on the two layer model maybe not be
suitable for such films. The optical constants of the deposited Al films depend on the specific
carbonate and hydroxide film content and may deviate substantially from the optical constant
of Al2O3. Since the film from tert-butyl peracetate has a lower Al2O3 content than films
from peroxide, the uncertainty in thickness obtained from the ellipsometry measurement is
substantially higher. For the films from hydrogen peroxide, the deposition rate as calculated
from ellipsometry is larger than one monolayer per cycle, where as typical deposition rates
for self-limiting vacuum based ALD are of sub-monolayer per cycle. In our high pressure
reactor, exposure of the substrate to the precursor likely leads to the deposition of several
monolayers of precursor that remain on the surface during chamber purging. When the
oxidizer is introduced into the cell, reaction with the precursor multilayer results in film
growth of 2-3 monolayers per cycle.[36]
2.5 CONCLUSIONS
We have demonstrated deposition of Al, Zr, Ru and Mn based thin oxide films using
supercritical carbon dioxide as a means for metal organic precursor dissolution and delivery.
Hydrogen peroxide aqueous solution and tert butyl peracetate solutions were tested as
oxidizing agents. Although H2O2 has very poor solubility in sc CO2 it proved a more
successful oxidizer for Al2O3 thin film deposition in a batch process. For a similar Al2O3
25

cyclic deposition process, both oxidizers resulted in film formation. Carbon and H2O
contamination in the films was detected via IR and XPS measurements. Evaluation of the
electrical properties of Al2O3 films revealed the formation of a good quality interface but the
presence of large concentrations of mobile charge in the films. Further refinement of the
experimental technique with the development of a process that does not include H2O is
expected to address some of these issues. However, the initial results presented in this article
indicate that a supercritical fluid based thin film deposition technique may provide a viable
alternative to vacuum based processes.
26

2.6 ACKNOWLEDGEMENS
Financial support from NSF (Grant# CTS-0304296) and the NSF Science and
Technology Center for Environmentally Responsible Solvents and Processes is gratefully
acknowledged. We would also like to acknowledge Ke Wang for assistance with the sc CO2
experimental set up and Ruben Carbonell for helpful discussions.
27

2.7 REFERENCES
1 N. Petrov, Y. Sverdlov, and Y. Shacham-Diamond, Journal of the Electrochemical
Society 149, C187 (2002)
2 Electroless Plating - Fundamentals and Applications; Vol., edited by G. O. Mallory
and J. B. Haydu (American Electroplaters and Surface Finishers Society, Orlando,
1990)
3 M. McHugh and K. V, Supercritical Fluid Extraction (Butterworth-Heinemann,
Boston, 1994)
4 J. M. DeSimone, E. E. Maury, Y. Z. Menceloglu, J. B. McCain, T. J. Romack, and J.
R. Combes, Science 265, 356 (1994).
5 J. M. Blackburn, D. P. Long, A. cabanas, and J. J. Watkins, Science 294, 141 (2001)
6 D.P Long, J. M. Blackburn, and J. J. Watkins, Advanced Materials 12, 913 (2000)
7 J. J. Watkins, J. M. Blackburn, and T. J. McCarthy, Chem. Mat.s 11, 213 (1999).
8 J. W. Rathke, R. J. Klinger, and T. R. Krause, Organometallics 10, 1350 (1991)
9 G. D. Wilk, R. M. Wallace, and J. M. Anthony, J. Appl. Phys. 89 (10), 5243 (2000).
10 J. M. DeTeresa, A. Barthelemy, A. Fert, J. P. Contour, F. Montaigne, and P. Seneor,
Science 286, 507 (1999).
11 K. Domen, T.J. Chuang, J. Chem. Phys. 90, 3318 (1989).
12 K. Arata, M. Hino, Appl. Catalysis 59, 197 (1990)
13 J.R. Lindsay, H.J. Rose, W.E. Swartz, P.H. Watts, K.A. Rayburn, Appl. Spectrosc.
27, 1 (1973).
14 J.A. Taylor J. Vac. Sci. Technol. 20, 751 (1982)
28

15 E. Paparazzo Appl. Surf. Sci. 25, 1 (1986).
16 C.D. Wagner, D.E. Passoja, H.F. Hillery, T.G. Kinisky, H.A. Six, W.T. Jansen, J.A.
Taylor, J. Vac. Sci. Technol. 21, 933 (1982).
17 G. Bandoli, D. Barreca, E. Brescacin, G. A. Rizzi and E. Tondello, Adv. Mater. :
Chem. Vap. Dep. 2, 238 (1996).
18 J. F. Moulder, W. F. Stickle, P. W. Sobol and K. D. Bomben, Handbook of X-ray
Photoelectron Spectroscopy, Perkin-Elmer, Physical Electronics Division, Eden
Prairie, MN, 1992.
19 G. Cerrato, S. Bondiga, S. Barbera, and C. Morterra, Appl. Surf. Sci. 115, 53 (1997).
20 P. Madhu Kumar, C. Balasubramanian, N. D. Sali, S.V. Bhoraskar, V.K. Rohatgi, and
S. Badrinarayanan, Mater. Sci. Eng. B 63, 215 (1999).
21 K. K. S. Lau, J. A. Caulfield, and K.K. Gleason, Chem. Mater., 12, 3032 (2000)
22 D. K. Schroder, Semiconductor Material and Device Characterization, Second
Edition, Wiley Interscience, New-York NY, p.338 (1998)
23 T. Gougousi, and G.N. Parsons, J. Appl. Phys. 95(3), 1391 (2004),.
24 S. Sinha, S. Badrinarayanan, A.P.B. Sinha ,J. Less-common Metals 125, 85 (1986).
25 Y. S. Li, P. C. Wang, and K. A. R. Mitchell, Appl. Surf. Sci. 89 (1995)
26 B. Basu, R. G. Vitchev, J. Vleugels, J. P. Celis and O. Van Der Biest, Key Eng.
Mater. 206-213, 783 (2002)
27 D.D. Sarma, and C.N.R. Rao, J. Electron Spectrosc. Relat. Phenom. 20, 25 (1980)
28 K.S. Kim, and N. Winograd, J. Catal. 35, 66 (1974)
29 B.J. Tan, K.J. Klabunde, and P.M.A. Sherwood, J. Am. Chem. Soc. 113, 855 (1991)
29
30 M. Oku, and K. J. Hirokawa, Electron Spectrosc. Relat. Phenom. 8, 475 (1976).
31 G.C. Allen, S.J. Harris, J.A. Jutson, and J.M. Dyke, Appl. Surf. Sci. 37, 111 (1989).
32 N. Martensson, P.A. Malmquist, S. Svensson, E. Basilier, J.J. Pireaux, U. Gelius, and
K. Siegbahn, Nouveau J. Chim. 1, 191 (1977).
33 C. Morterra, G. Cerrato, S. Di Ciero, Appl. Surf. Sci. 126 107 (1998)
34 S. Takeda, M. Fukawa, Y. Hayashi, K. Matsumoto, Thin Solid Films 339, 220 (1999)
35 C. A. Bessel, G. M. Denison, H. M. DeSimone, J. DeYoung, S. Gross, C. K. Schauer,
and P. M. Visintin, J. Am. Chem. Soc. 125, 4980 (2003).
36 D. Barua, T. Gougousi, E. D. Young and G. N. Parsons in preparation.
30

Table 2.1
Material Precursors solubility oxidizer Method Temperatures Studied (°C) Comments
30% H2O2 in H2O batch 70 - 120 thick films50% tert butyl peracetate in
mineral spirits batch 120 thinner films, precipitates
oxygen batch 120 no visible film30% H2O2 in H2O cyclic 120 multilayer growth per cycle
50% tert butyl peracetate in mineral spirits cyclic 120 thinner growth per cycle
30% H2O2 in H2O batch 80 - 120 thick films, with fluorine50% tert butyl peracetate in
mineral spirits batch 150 thin films, with Fluorine
30% H2O2 in H2O batch 120 - 200 thin film50% tert butyl peracetate in
mineral spirits batch 150 thin film
Hf acac poor 30% H2O2 in H2O batch 120 - 200 not characterized
TDEAHf precursor oxidized 30% H2O2 in H2O batch 100 - 150 precipitates
ZnOx Zn(hfac) very good 30% H2O2 in H2O batch 150 not characterizedMnOx Mn hfac very good 30% H2O2 in H2O batch 100 - 150 thin film
30% H2O2 in H2O batch 100 - 150 thin film50% tert butyl peracetate in
mineral spirits batch 100 - 120 thin film
Ru Cp2 poor 30% H2O2 in H2O batch 90 - 180 thin film
Y2O3 Y tmhd good 30% H2O2 in H2O batch 120 - 150 thick film, carbon contamination
ZrO2 Zr acac poor
HfO2
RuOx Ru tmhd
poor
poor
good
Al2O3
Al hfac very good
Al acac
Al acac
31

CO2
CO2Fixed Volume
Oxidizer, e.g. H2O2
Precursor pre-mix cell
Si
CO2
vent
Figure 2.1 A schematic of the deposition system
32

Inte
nsity
(a.u
.)
1200 1000 800 600 400 200 0
Binding Enerdy (eV)
O(KVV)
O 1s
C 1s Al 2p
Al 2s
Binding Energy (eV)
Inte
nsity
(a.u
.)
1200 1000 800 600 400 200 0
Binding Enerdy (eV)
O(KVV)
O 1s
C 1s Al 2p
Al 2s
Binding Energy (eV)
Figure2.2 XPS survey scan for an Al based film deposited from Al(acac)3 and H2O2 at at 120°C and 1700 psi . Peaks assigned to Al 2s, Al 2p , C1s and O1s core electrons can be distinguished.
33
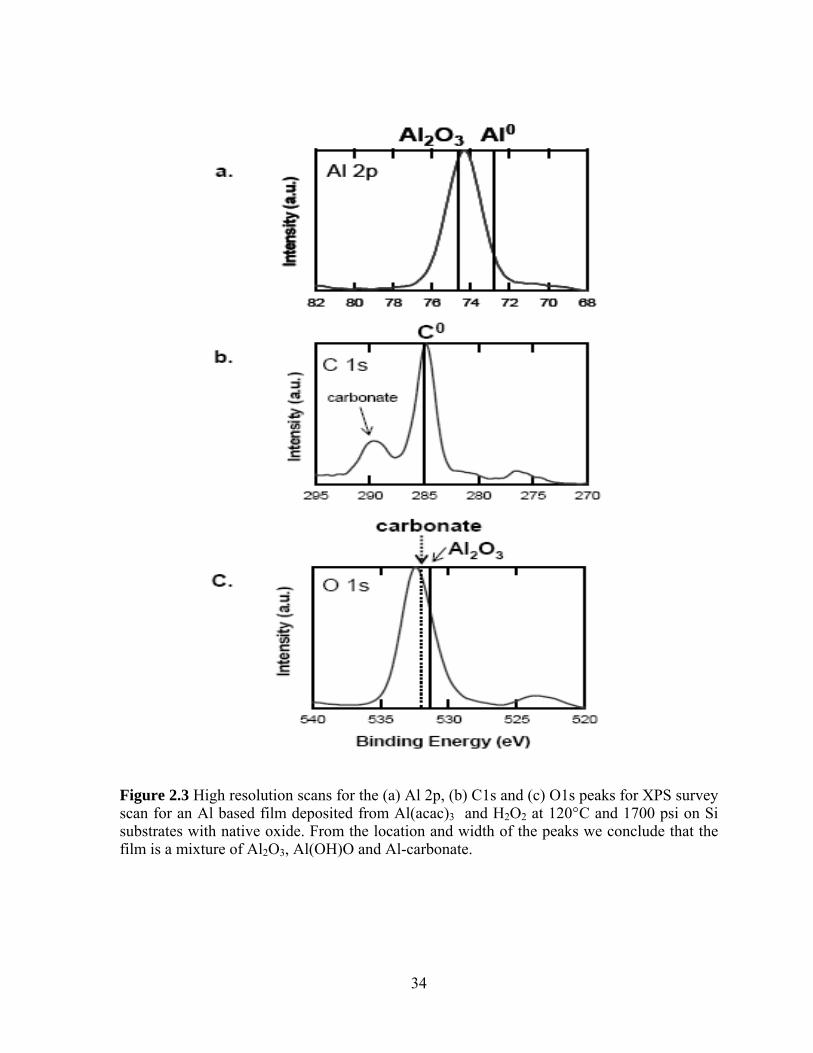
Figure 2.3 High resolution scans for the (a) Al 2p, (b) C1s and (c) O1s peaks for XPS survey scan for an Al based film deposited from Al(acac)3 and H2O2 at 120°C and 1700 psi on Si substrates with native oxide. From the location and width of the peaks we conclude that the film is a mixture of Al2O3, Al(OH)O and Al-carbonate.
34

abso
rban
ce (a
.u.)
4000 3000 2000 1000wavenumber (cm-1
)
i
ii
OHcarbonates
Al-O
abso
rban
ce (a
.u.)
4000 3000 2000 1000wavenumber (cm-1
)
i
ii
OHcarbonates
Al-O
Figure 2.4 Transmission IR spectrum for an Al-based film deposited from Al(acac)3 and H2O2 at 120°C and 1700 psi on Si substrates with native oxide. Curve (i) shows a measurement taken after film deposition and curve (ii) shows a spectrum taken after the film was annealed at 600°C in N2 for 5 min. Spectrum (i) exhibits features at 1200-1700 cm-1 associated with several carbonate species. The broad peak at 3000-3600 cm-1 is due to the O-H stretching modes of both undissociated H2O molecules and surface H-bonded OH species. Al-O bonding is detected by the borad peak at 400-800cm-1. Mild anneal result in the disappearance of the IR signature of the carbonates and hydroxides.
35

abso
rban
ce(a
.u.)
4000 3000 2000 1000
wavenumber (cm-1)
CF2C=O/COO
OH
Al-O
i
ii
Figure 2.5 Transmission IR spectrum for an Al-based film deposited from Al(hfac)3 and H2O2 at 130°C and 2500 psi. The spectrum shows features compatible with the presence of H2O in the film (3600-3000 cm-1) and Al-O bonding (850-500cm-1). Well resolved peaks at 1700cm-1 and 1300-1150cm-1 are attributed to the presence of carbonate type and C-F bonding in the film. A mild anneal for 10 min at 600°C in N2 removes most of the IR signature of these impurities, and reinforces the Al-O peak.
36

180
160
140
120
100
80
C (F
)x10
-12
-3 -2 -1 0 1 2
1Mhz100Khz
a.180
160
140
120
100
80
C (F
)x10
-12
-3 -2 -1 0 1 2
1Mhz100Khz
180
160
140
120
100
80
C (F
)x10
-12
-3 -2 -1 0 1 2
1Mhz100Khz
a.
Figure 2.6 Frequency dependence (a) and hysteresis (b) of the C vs. V measurements for Al-based film deposited from Al(acac)3 and H2O2 at 80°C , 2060 psi and annealed at 600°C in N2 for 10 min. Change of frequency from 1MHz to 100 KHz does not change the shape of the curve substantially indicating good quality interface. However, the hysteresis is quite large ~500 mV.
180
160
140
120
100
C (F
)x10
-12
-3 -2 -1 0 1 2Vg (V)
b.180
160
140
120
100
C (F
)x10
-12
-3 -2 -1 0 1 2Vg (V)
180
160
140
120
100
C (F
)x10
-12
-3 -2 -1 0 1 2Vg (V)
b.
37

Figure 2.7 High resolution XP scans for the (a) Al 2p, (b) C1s, and (c) O1s peaks for two aluminum based films deposited via reagent cycling. Both films were deposited at 120°C, and 1600 psi. Film marked HP was deposited form Al(acac)3 and H2O2, while film TBP was deposited from Al(acac)3 and tert-butyl peracetate.
38

Figure 2.8 High resolution XP scans for the (a) Zr 3d, (b) C1s, and (c) O1s peaks for a Zr based film deposited from Zr(acac)4 and tert-butyl peracetate at 150°C, and 1700psi. The film composition can best be described a hydroxycarbonate.
39

Inte
nsity
(a.u
.)
1200 1000 800 600 400 200 0
Binding Enerdy (eV)
O 1s
Ru 3p
Ru 3dC 1s
Si 2p
Binding Energy (eV)
Inte
nsity
(a.u
.)
1200 1000 800 600 400 200 0
Binding Enerdy (eV)
O 1s
Ru 3p
Ru 3dC 1s
Si 2p
Binding Energy (eV)
Figure 2.9 XP survey spectrum for a Ru based film deposited from Ru(tmhd)3 and H2O2 at 150°C, 3600 psi. The presence of the Ru 3d and Ru 3p peaks verify the deposition of a Ru-based film on Si substrate.
40

Figure 2.10 High resolution XP scans for the (a) Ru 3d- C1s, and (b) O1s peaks for a Ru based film deposited from Ru(tmhd)3 and H2O2 at 150°C, 3600 psi. The film contains a mixture of Ru oxides and possibly carbonates and hydroxides.
41

Inte
nsity
(a.u
.)
1200 1000 800 600 400 200 0
Binding Energy (eV)
O 1s
Ru 3p
Ru 3dC 1s
Si 2p
Figure2.11 XP survey spectrum for a Ru based film deposited from ruthenocene and H2O2 at 130°C, 3120 psi. The presence of the Ru 3d and Ru 3p peaks verify the deposition of a Ru-based film on Si substrate.
42

SiO2
RuO3
RuO2
O 1s
C0RuO3
RuO2
Inte
nsity
(a.u
.)
538 536 534 532 530 528
Binding Enerdy (eV)
Inte
nsity
(a.u
.)
295 290 285 280 275 270
Binding Enerdy (eV)
a.
b.
Figure2.12 High resolution XP scans for the (a) Ru 3d- C1s, and (b) O1s peaks for a Ru based film deposited from ruthenocene and H2O2 at 130°C, and 3120 psi. The film contains a mixture of Ru oxides and possibly carbonates and hydroxides.
43

Inte
nsity
(a.u
.)
1200 1000 800 600 400 200 0
Binding Enerdy (eV)
F1s
Mn2pO1s
C1sSi2p
O (KVV)
Binding Energy (eV)
Figure2.13 XP survey spectrum for a Mn based film deposited from Mn(hfac)3 and H2O2 at 150°C and 3500 psi. Fluorine from the precursor is observed in the film.
44
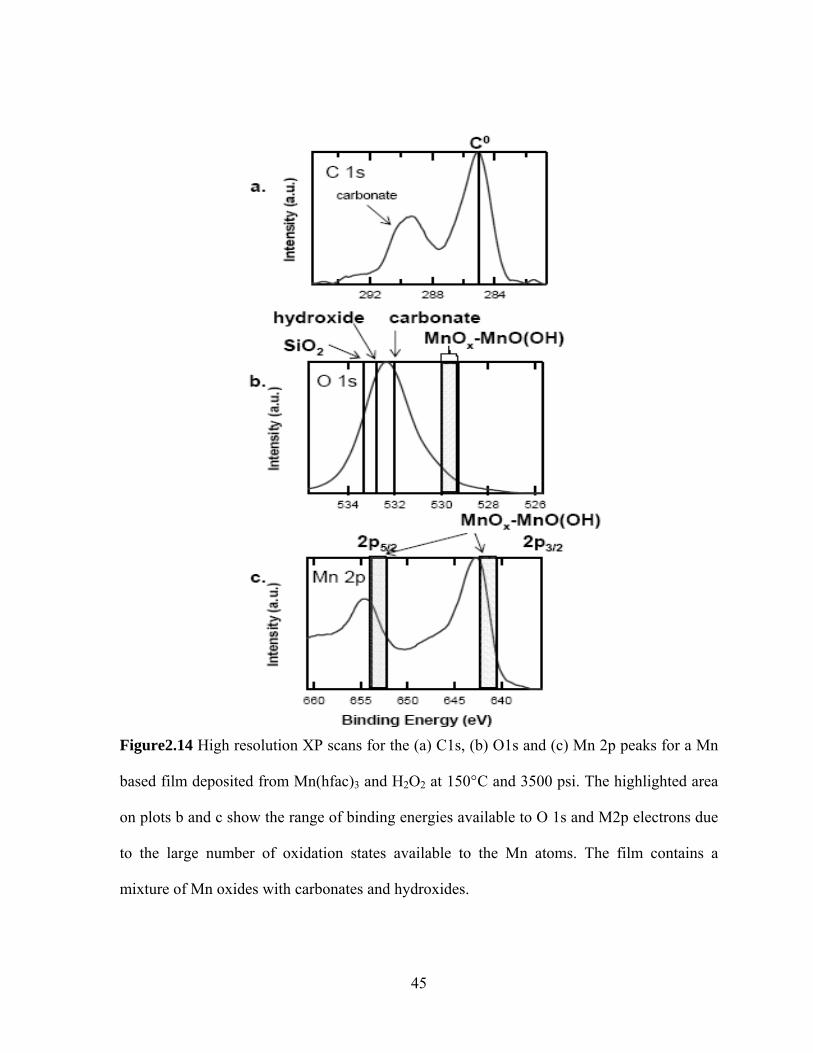
Figure2.14 High resolution XP scans for the (a) C1s, (b) O1s and (c) Mn 2p peaks for a Mn
based film deposited from Mn(hfac)3 and H2O2 at 150°C and 3500 psi. The highlighted area
on plots b and c show the range of binding energies available to O 1s and M2p electrons due
to the large number of oxidation states available to the Mn atoms. The film contains a
mixture of Mn oxides with carbonates and hydroxides.
45

CHAPTER THREE
3 Cyclic/Atomic Layer depositions of Metal-Oxide and Metal Thin Films from Metal Organic Precursors in Supercritical CO2 Solution
3.1 INTRODUCTION
Supercritical carbon dioxide (Sc CO2) based deposition of metal and metal oxide thin
film is a new area of interest in microelectronics. Recently, a few studies reported Sc CO2
assisted metal deposition at lower temperatures (~60-125°C) 1-3 compared to the high
vacuum processes. All previous metal depositions in Sc CO2 were performed in a batch
process named Chemical Fluid Deposition (CFD). 1-5 In this study, we used Sc CO2 in
depositing metal oxides and gate metals by atomic layer deposition (ALD) process. ALD is a
cyclic deposition process where the deposition surface undergoes sequential exposure to the
reactants.6-9 The self-limiting adsorption of precursors on the substrate and subsequent
reaction limit the film growth in monolayer/sub-monolayer thickness in each cycle.7
Therefore, ALD allows tuning the thickness of a highly conformal ultra-thin film in case of
restricted surface geometries.7-9 Low process temperature, better film quality, multilayer
processing ability, and uniformity of film on large area are the other advantages of ALD.7
We anticipate added benefits to ALD by incorporating the beneficial aspects of Sc CO2 in the
process.
ScCO2 based deposition can overcome certain limitation of conventional high
vacuum and solvent based deposition processes because of its unique physiochemical
properties.1-3, 5 The density of Sc CO2 can approach or exceed that of a liquid while its
diffusivity lies in between a gas and a liquid.1, 3, 5 The high density of Sc CO2 facilitates
46
dissolution of a broad range of metal organic species which overcomes the volatility
constraint of many precursors in high vacuum processes.1-5 Also the high diffusivity, low
viscosity and zero surface tension of Sc CO2 eliminate the mass transport constraint 1-5
observed in other solvent based techniques such as electroplating and electroless deposition.
The high solvation energy of Sc CO2 can be a substitute of part of the heat energy in
thermally activated surface reactions. Effective use of solvation energy in metal deposition is
evident from electroplating and electroless processes12, which involve low-temperature
deposition in a liquid medium. The high density and low mass transport resistance of Sc CO2
can also facilitate the removal of reaction by products from the deposition surface which can
ensure enhanced film purity.1-3, 5
In this study, we demonstrated cyclic deposition of aluminum oxide (Al2O3),
palladium (Pd) and ruthenium oxide (RuOx) film with a Sc CO2 based ALD system. From
microelectronics point of view, Al2O3 is important as a high k dielectric material.10, 13, 15 Pd
is important as a contact material in integrated circuits2 while RuOx is a promising candidate
for future gate electrode applications.16
In our experiments, we chose metal organic precursors as the metal source because
they are soluble in Sc CO2 medium. We established linear growth of Al2O3 film with the
number of deposition cycles. The dependence of qualitative Pd and RuOx film thickness on
deposition cycle was established. For RuOx deposition, different surface morphology was
observed for different number of deposition cycles. Chemical states of Al2O3 and Pd films
were analyzed using X-ray Photoelectron Spectroscopy (XPS).
47

3.2 EXPERIMENTAL METHOD
The depositions were carried out in a home built hot-wall, stainless steel high-
pressure reaction cell (internal volume 21.19 cm3) shown schematically in figure 3.1. Two
sapphire windows were used as view ports at the two ends of the reaction cell. A bigger high-
pressure cell (~100 ml) was used as the precursor premix cell where the precursors were
dissolved and stored in supercritical carbon dioxide for subsequent use during the
experiment. Before each experiment, the cleaned premix cell was flushed with CO2, and
approximately 20-30 mg of precursor was loaded into the cell through one of its side ports.
The premix cell was then pressurized with CO2 at 1200-1500 psi and heated to 70-80°C.
After reaching the set point temperature of the premix cell, ~30 minutes was allowed to
ensure maximum dissolution of the precursor in the Sc CO2. An ISCO 260D syringe pump
was used to compress and deliver the carbon dioxide at the required pressure. High-pressure
stainless steel tubing was used to make the CO2 flow-connections, and high-pressure valves
(max rated pressure ~15000 psi) were used to regulate the CO2 flow. Resistive heaters with
feedback control were used to maintain the temperature of the reaction cell within ±1°C of
the set point value. The lines used to deliver the precursor were sometimes heated to prevent
condensation and clogging.
The films were deposited on native oxide or chemical oxide on Si(100). Substrates
with native oxide were prepared by JTB cleaning [JTB-100 Baker clean (5 minutes),
deionized water rinse (10 minutes), and nitrogen-blow dry]. Chemically oxidized surfaces
were prepared as described elsewhere14 and dried with nitrogen flow.
48

At the beginning of the process, the cleaned reaction cell was heated to 40-50˚C. The
samples were placed inside the cell, the windows were closed and the cell was flushed
thoroughly with CO2 for 1 or 2 minutes. The reaction cell was then pressurized above the
critical pressure of CO2 and heated to reach the set point temperature. After the temperature
of the reaction cell equilibrated to the set point, the pressure inside the cell was adjusted to
the set point value.
Precursors for deposition included aluminum acetylacetonate (99%) (Al(acac)3)
[Al(CH3COCHCOCH3)3 ], aluminum hexafluoroacetylacetonate (min. 98%) (Al(hfac)3)
[Al(CF3COCHCOCF3)3] and bis(cyclopentadienyl)ruthenium (99%, 99.9%-Ru)
(Ruthenocene) [(C5H5)2Ru], purchased from Strem Chemicals. Palladium (II)
hexafluoroacetylacetonate (Pd(hfac)2) [(C4HF6O)2Pd] was obtained from Sigma Aldrich. All
precursors were used as received. The fluorinated precursors, Al(hfac)3 and Pd(hfac)2 were
stored in a well sealed desiccator to prevent any reaction with outside air or moisture.
The experiments were carried out in ABAB cycles as in a typical atomic layer
deposition process.15 A small amount of precursor solution (A) was injected from the premix
cell to the pressurized reaction cell such that the pressure inside the reaction cell goes up by
30-50 psi. In case of the fluorinated precursors, the approximate concentration of solution
injected from the premix cell was 0.05-0.1wt%. The concentrations of non-fluorinated
precursors correspond to their solubility in Sc CO2 at the pre-mix cell temperature. After the
needed exposure of samples to the precursor (varies with experiments, from 30 seconds to 3
minutes) the reaction cell was vented and then flushed with liquid/supercritical CO2 to
remove the remaining precursor including any weakly adsorbed on the deposition surface.
The purged CO2 from the reaction cell was filtered in an activated charcoal bed before
49

venting out to the outside air. The reaction cell was then re-pressurized to the needed
pressure with Sc CO2. An oxidizing or a reducing agent (B) was confined inside a fixed
length of the depressurized high-pressure tubing and subsequently driven into the reaction
cell with high pressure CO2 flow. For aluminum oxide deposition, 0.2-0.4 ml of liquid
oxidizer (30% aqueous solution of H2O2 or 50% tert-butyl peracetate (TBP) in mineral
spirits) was injected in each cycle. For ruthenium deposition, H2O2 solution was used in the
same quantity. For palladium deposition, ultra high purity H2 (99.999%) was used as the
reducing agent. In every case, the molar quantity of the injected oxidant/reductant was
hundreds of times higher than that needed for stoichiometric reaction since only a minute
quantity of adsorbed precursor took part in the reaction. After the reaction (1-3 minutes
depending on the experiments) the reaction cell was vented and then flushed with
liquid/supercritical carbon dioxide to remove the reaction byproducts from the cell volume
and from the deposition surface. After a complete AB cycle, the reaction cell was re-
pressurized with Sc CO2 for the next cycle.
On an average it took ~20 minutes to complete a full deposition cycle. The manual
operation of the high pressure valves lead to uncertainty in regulating precursor and CO2
flow. Imperfect sealing of the reaction cell and the degraded high-pressure valves often
caused pressure variation inside the reaction cell, occasionally as high as a few hundreds of
psi. Experimental difficulties often impeded the injection of the same volume of liquid
oxidant in every cycle.
Deposited films were analyzed by ellipsometry, X-ray photoelectron spectroscopy
(XPS), Auger electron spectroscopy (AES) and atomic force microscopy (AFM). A Rudolf
ellipsometer (632.8 nm, 70˚ fixed angle) was used to measure the oxide thickness. XPS was
50

conducted using a Riber LAS3000 (MAC2 analyzer, Mg Kα hv=1253.6 eV, non-
monochromatic X-ray source) at 75º take-off-angle with 0.1eV step size. A Physical
Electronics Model 3017 AES subsystem with a Model 15-155A cylindrical mirror analyzer
was used for the AES measurement. AES data were collected with samples normal to the
analyzer with an acceleration voltage of 5 KV. A DI3000 AFM with silicon tip (Veeco
Nanoprobe, Model No. OTESPA) was used in tapping mode to measure the surface
roughness of the deposited films.
3.3 RESULTS AND DISCUSSION
A true atomic layer deposition process possesses two essential criteria, first the
adsorption of the precursor should be self-limiting on the deposition surface and second, the
film growth should proceed in a linear fashion with cycle number. Due to the self-saturating
nature of ALD, film growth takes place in sub-monolayer level in each cycle. Previous
studies reported 0.9-1.2 Å/cycle growth of ALD Al2O3 from Al(CH3)3 and water.9-11
In our study, we did several ALD depositions of Al2O3 from Al (hfac)3 and H2O2 at
fixed temperature (100°C) and pressure (~2000 psi). Figure 3.2 represents the ellipsometry
data for Al2O3 films deposited from these experiments. Each data point was obtained by
taking an arithmetic average of the film thicknesses measured on one or more samples with
the same number of deposition cycles. Thickness values were taken from 3-7 measurements
on each sample. The figure shows fairly linear growth of Al2O3 although the high growth rate
indicates CVD type growth rather than a true self-limiting ALD. We noticed a significant
effect of Al(hfac)3 exposure time and sample orientation inside the reaction cell on the
deposition rate. For the same process conditions, an increase in precursor exposure time from
30 seconds to 3 minutes showed almost a four times increase in film growth rate (2.13 and
51

8.44 Å respectively). When the samples were placed on a horizontal sample holder, it
showed a 5.61 Å/cycle growth rate instead of 2.13 Å/cycle for the same precursor exposure
time (30 seconds). In case of the sample holder, the deposition surface (un-scribed surface of
the silicon substrate) was always faced upward and the precursor could flow from the
precursor-inlet to the deposition surface without any mass transfer constraint. When the
samples were placed without the holder, the deposition surface was placed down-faced and
the other surface was directly exposed to the precursor flow. Precursor flow in the later case
was restricted by the tortuous flow path from the precursor-inlet to the deposition surface and
also by the narrower spacing between the down-faced deposition surface and the reactor-
wall. It is to be mentioned that when the sample holder was not used, the samples sometimes
changed their position due to any abrupt pressure rise inside the reaction cell while
pressurizing with CO2.
Figure 3.3 shows the AFM image of an Al2O3 film deposited in 23 cycles from
Al(hfac)3 and H2O2 at 100°C. The AFM scan length is 1 µm and the gray scale spans 100 Å
dark to light. Each unit in z-direction corresponds to 50 nm. The RMS value for the film
surface was ±2.3 nm against the film thickness of 117 Å, which is order of magnitude higher
than typical ALD Al2O3 surface roughness. In literature, ±3Å RMS value against a 560 Å of
ALD Al2O3 has been reported.13
We introduced three different sets of precursors for cyclic deposition of aluminum
oxide: Al(hfac)3-H2O2, Al(acac)3-H2O2, and Al(acac)3 – tert-butyl peracetate (TBP). In our
previous work, we presented a detailed discussion on comparative film compositions for the
later two sets of precursors.17
52

The Al(hfac)3-H2O2 based depositions were carried out at 100ºC and ~2000 psi with
a 3 minutes of precursor exposure/cycle. Both of the Al(acac)3-H2O2 and Al(acac)3-TBP
systems were carried out at 120ºC, ~1600 psi, and 1 minute of precursor exposure/cycle. The
above three systems are represented in table 3.2 in terms of their cycle number, film
thicknesses and O to Al-atomic ratio (from XPS analysis). In case of Al(acac)3-TBP, the poor
Al-content in the deposited film ( O:Al ~14) can be related to the limited oxidizing ability of
TBP compared to H2O2. A slower growth rate was also observed in this case [35 Å/12-cycles
from Al(acac)3-TBP against 40 Å/9-cycles from Al(acac)3- H2O2] . The Al(hfac)3-H2O2
system showed a better Al-incorporation in deposited films. For this system, the 10, 20 and
30 cycles of deposition show O to Al atomic ratio, 4.9, 2.8, and 3.1 respectively. In all cases
higher O:Al values were obtained compared to the stoichiometric value, 1.5 in pure Al2O3.
The sources of this excess oxygen are the different oxygen containing species other than
Al2O3 in deposited films, which will be evident from subsequent discussions.
Figure 3.4 represents the detailed XP-spectra for I. Al2p, II. O1s, and III. C1s peaks
for films deposited from the above three sets of precursors. In the figure, (a), (b) and (c)
stand for Al(hfac)3-H2O2, Al(acac)3-H2O2 and Al(acac)3-TBP respectively. The broad
distributions of Al2p (figure 3.4 I) and O1s (figure 3.4 II) signals reveal that Al is in multiple
oxidation states in the deposited films. The literature binding energy for Al2p in Al2O3,
Al(OH)3, and AlO(OH) are 74.624, 74.3-75.925,26, 76.725 eV respectively while those for O1s
are 531.428, 531.5318, and 531.526 eV respectively. By considering both Al2p and O1s peaks,
we conclude that Al2O3 and Al (OH)3 are the dominant aluminum-species in films deposited
from Al(hfac)3-H2O2 and Al(acac)3-H2O2 while, in case of Al(acac)3-H2O2, the prime sources
of aluminum is attributed to AlO(OH).
53

Aluminum oxide films deposited from the three different sets of precursors show
substantial carbon contamination as evident from figure 3.4 III. The prime source of carbon
was attributed to the adventitious carbon (C1s at 284.8 eV18). When H2O2 was used as the
oxidant, a second peak was observed near the higher binding energy side of the C1s peak
[figure 3.4 III (a) and (b)] which was attributed to the presence of carbonate species
(289.4eV19) in the film. When TBP was used as the oxidant, no such peak was observed
[figure 3.4 III. (c)]. The reasoning behind the carbonate formation is the water used in the
30% H2O2 solution. Acidic nature of water-Sc CO2 mixture and carbonic acid formation due
to water-Sc CO2 interaction has been reported elsewhere.20 Formation of carbonate can be
due to the reaction between carbonic acid and deposited aluminum oxide. Also
‘monodentated’ bicarbonate and ‘bidentated’ carbonates are expected from adsorption of
CO2 on hydroxylated Al2O3 surface. 21,22,23
Despite different temperature, pressure and precursor exposure time, it was a
reasonable guess that the different reactant species were the key determinants of film
composition in the above three cases.
Palladium films obtained from our experiments were poorly adhesive to native oxide.
Similar results were reported by Watkins and his co-authors in their work.2 Although bright
and reflective films were obtained from the experiments, most of the films were washed
away from the sample surface while cleaning in ethanol in a bath sonicator at room
temperature. The survey spectra (figure not included) did not show any noticeable fluorine
peak although we speculated small amount of fluorine contamination in the film by analyzing
the detailed C1s spectra (figure 3.5a). The C1s peak was set at 284.8 eV since the
adventitious carbon was taken as the prime source of carbon contamination. The asymmetric
54

broadening of the C1s peak to its higher binding energy side indicates the presence of C-O,
C=O, CFx and CF3 in the film. Similar results were reported by Lin et al.30, and Senkevich et
al31 as they deposited Pd by self-reduction of Pd(hfac)2 on copper and tertrasulfide self-
assembled monolayer surface respectively. The broad hump around 286.5-289.5 was
attributed to C-O, CFx and C=O due to the thermal fragmentation of the original Pd(hafc)2
molecule30,31. The small step near 292.3 eV corresponds CF3 in an intact Pd(hfac)2 molecule
(after adjustment of adventitious C1s peak) as reported in literature.30,32
Setting the C1s peak to the adventitious carbon binding energy shifts the Pd3d peak
to the literature binding energy of elemental Pd (Pd3d5/2 at 335.5 eV33, figure 3.5b).
The absence of fluorine peak in the survey spectra and the Pd peak at the elemental
palladium indicate minute quantity of fluorine in the deposited film. The O1s signal observed
at 532.8 eV (figure 3.5c) was attributed to adventitious oxygen (532.58 eV18), oxygen
bonded to the native SiO2 (533.2 eV34) and oxygen bonded to fragmented or intact precursor
molecule (~532.3 eV30 ). Quantitative analysis from detailed O1s and Si2p peaks gives
oxygen to silicon atomic ratio of 3.4, which also confirms the presence of excess oxygen in
the deposited film.
The partial XPS survey spectra in figure 3.6 show relative Si2p and Pd 3d peaks for
two different ALD runs of palladium. The ratio of signal-intensity for the two peaks confirms
that the film thickness can be tuned by varying the number of deposition cycles and the
precursor exposure time. The 20 cycles and three minutes Pd(hfac)2 exposure/cycle gave a
much thicker film (larger Pd3d to Si2p peak-height ratio) compared to a 15cycles and one
minute Pd(hfac)2 exposure/cycle. Although actual thickness of deposited films were not
measured, the large difference in relative Pd3d/Si2p signals for a difference of only five
55

deposition cycles between the two samples indicates high, CVD type growth rather than self-
limiting monolayer deposition. We observed the same behavior in case of ALD Al2O3
deposition (figure 3.2).
Figure 3.7 shows the AES survey spectra and high-resolution peak of Ru (inset) for a
10 cycle ALD of ruthenium oxide from ruthenocene and H2O2. Deposition was carried out on
native silicon at 100°C and ~ 2000 psi. The survey spectra show substantial carbon
contamination and the ruthenium peak was difficult to identify. The high resolution Ru LMM
peak at 2252 eV confirmed the presence of ruthenium in the film. Also an O KLL peak was
observed at 517 eV.
RuOx was also deposited on chemically oxidized surface of Si(100) from ruthenocene
and H2O2 at 200°C and ~1500 psi. Depositions were carried out in 08, 20, 30 and 40 cycles.
In all cases, both the Ru3d (partially overlapped with C1s peak) and Ru 3p peaks are clearly
identified on the survey spectra (not included in the figure). Figure 3.8 represents the detailed
XP-spectra for Ru3p and Si2p peaks for the 08, 20 and 40-cycles of deposition. The figure
shows an increasing ratio of Ru3p to Si2p intensities as the number of deposition cycle
increases, which indicates growing film thickness with number of cycles.
The AFM images of RuOx films deposited in 08, 20 and 30 -cycles (as mentioned
earlier) are represented in figure 3.9a, 3.9b and 3.9c respectively. In all cases, the AFM scan
length of 1 µm, and the gray scale spanned 100 Å from dark to light. Figure 8a shows fairly
uniform deposition of oval shaped islands, which takes columnar shape as the number of
deposition cycle increases (3.9b and 3.9c). RMS values for the 8, 20 and 40-cycle
depositions
56

are ±1.06, ±1.38 and ±3.43 nm respectively. Increased surface roughness and change in
surface morphology argues for a non-ideal ALD growth.
3.4 CONCLUSION
Table 1 represents a summary of this work and its results. In this work, we introduced
a new approach in metal and metal oxide deposition by developing a supercritical carbon
dioxide based ALD process. Aluminum oxide, palladium and ruthenium oxide films were
deposited from different metal organic precursors in supercritical carbon dioxide solution.
The Al2O3 film, deposited from Al(hfac)3-H2O2 showed linear growth with ALD cycle
number. Longer precursor exposure time led to CVD type growth of Al2O3 rather than
monolayer formation. Deposited Al2O3 films from different precursors were composed of a
mixture of different aluminum-oxygen compounds such as Al2O3, Al(OH)3, AlO(OH) and
carbonate species. We speculated CVD type growth of palladium from Pd(hfac)2-H2 with
trace extent of ligand and precursor derived contamination. The RuOx film showed different
surface morphology at different deposition cycles. The overall result from this work confirms
that the process can tune the thickness of the film although it is unable to control the growth
in atomic scale.
57
3.5 ACKNOWLEDGEMENTS
Financial support from NSF (Grant# CTS- 0304296) and the NSF Science and
Technology Center for Environmentally Responsible Solvents and Processes is gratefully
acknowledged. We would also like to acknowledge Ke Wang for assistance with the sc CO2
experimental set up and Ruben Carbonell for helpful discussions.
58
3.6 REFERENCES
1. James J. Watkins, Jason M. Blackburn and Thomas J. McCarthy, “Chemical Fluid Deposition: Reactive Deposition of Platinum Metal from Carbon Dioxide Solution, Chemistry of Materials 11, 213-215 (1999)
2. Jason M. Blackburn, David P. Long, and James J. Watkins, “Reactive Deposition of Conformal Palladium Films from Supercritical Carbon Dioxide Solution”, Chemistry of Materials, 12, 2625-2631 (2000)
3. Albertina Cabanas, David P. Long, and James J. Watkins, “Deposition of Gold Films and Nanostructures from Supercritical Carbon Dioxide”, Chemistry of Materials 16, 2028-2033(2004)
4. Ephrem T. Hunde and James J. Watkins, “Reactive Deposition of Cobalt and Nickel Films from Their Metallocenes in Supercritical Carbon Dioxide Solution”, Chemistry of Materials 16, 498-503 (2004)
5. Albertina Cabanas, Xiaoying Shan, and James J. Watkins, Alcohol-Assisted Deposition of Copper Films from Supercritical Carbon Dioxide, Chemistry of Materials 15, 2910-2916 (2003)
6. Markku Leskela, Mikko Ritala, “Atomic layer deposition (ALD): from precursors to tin film structures”, Thin Solid Films 409, 138-146(2002)
7. Mikko Ritala, and Markku Leskela, “Atomic layer epitaxy-a valuable tool for nanotechnology?”, Nanotechnology 10, 19-24(1999)
8. Mathew D. Halls and Krishnan Raghavachari, “Atomic Layer Growth Reactions of Al2O3 on Si(100)-2×1”, Journal of Physical Chemistry B 108, 4058-4062(2004)
9. Riikka L. Puurunen, “Growth Per Cycle in Atomic Layer Deposition: Real Application Examples of a Theoretical Model”, Chemical Vapor Deposition 9, 327-332 (2003)
10. Y. Chang, F. Ducroquet, E. Gautier, O. Renault, J. Legrand, J.F. Damlencourt, F.
Martin, “ Surface preparation and post thermal treatment effects on interface propertires of thin Al2O3 films deposited by ALD”, Microelectronic Engineering 72, 326-331 (2004)
59

11. Jeffrey R. Wank, Steven M. Geroge, and Alan W. Weimer, “Coating Fine Nickel Particles with Al2O3 Utilizing and Atomic Layer Deposition-Fluidized Bed Reactor (ALD-FBR)”, Journal of the American Ceramic Society 87, 762-765 (2004)
12. N. Petrov, U. Sverdlov, and Y. Shacham-Diamond, “Electrochemical Study of the
Electrolesss Deposition of Co(P) and Co(W, P) alloys”, Journal of the Electrochemical Society 149, C187-C-194(2002)
13. A. W. Ott, J.W. Klaus, J.M. Johnson, S.M. George, “Al2O3 thin film growth on Si(100) using binary reaction sequence chemistry”, Thin Solid Films 292, 135-144(1997)
14. M. L. Green, M.-Y. Ho, B. Busch, G.D. Wilk, and T. Sorsch, “Nucleation and growth
of atomic layer deposited HfO2 gate dielectric layers on chemical oxide (Si-O-H) and thermal oxide (SiO2 or Si-O-N)”, Journal of Applied Physics 92, 7168-7174 (2002)
15. A. W. Ott, K.C. McCarley, J.W. Klaus, J.D. Way, S.M. George, “Atomic layer
controlled deposition of Al2O3 films using binary reaction sequence chemistry”, Applied Surface Science 107, 128-136(1996)
16. K. Frohlich, K. Husekova, D. Machajdik, J.C. Hooker, N. Perez, M. Fanciulli, S. Ferrari, C. Wiemer, A. Dimoulas, G. Vellianitis, F. Roozeboom, “Ru and RuO2 gate electrodes for advanced CMOS technology”, Materials Science and Engineering B 109, 117-121(2004)
17. Theodosia Gougousi, Dipak Barua, Erin D. Young, Gregory N. Parsons, “Metal-oxide thin films deposited from metal organic precursors in supercritical CO2 solutions” Manuscript in preparation.
18. C. D. Wagner, D.E. Passoja, H.F. Hillery, T.G. Kinisky, H.A. Six, W.T. jansen, J.A. Taylor, “Auger and photoelectron line energy relationship in aluminu,-oxygen and silicon-oxygen compounds” Journal of Vacuum Science and Technology 21, 933-944(1982)
19. J. S. Hammond, J. W. Holubka, J. E. DeVries and R.A. Dickie, “The Application of
X-Ray photo-electron Spectroscopy to a Study of Interfacial Composition in Corrosion-induced Paint De-adhesion”, Corrosion Science 21, 239-253(1981)
20. Karen L. Toews, Robert M. Shroll, and C.M. Wai, “pH-Defining Equillibrium between Water and Supercritical CO2. Influence on SFE of Organics and Metal Chelates”, Analytical Chemistry 67, 4040-4043(1995)
60

21. Maurizio Casarin, Daniele Falcomer, Antonella Glisenti, and Andrea Vittadini, “Experimental and Theoretical Study of the Interaction of CO2 with α-Al2O3”, Inorganic Chemistry 42, 436-445 (2003)
22. Maurizio Casarin, Daniele Falcomer, Andrea Vittadini, “ A theoretical study of the interaction of CO2 with hydroxylated α-alumina”, Surafce Science 566-568, 890-894(2004)
23. Hideto Tsuji, Akie Okamura-Yoshida, Tetsuya Shishido, and Hideshi Hattori, “Dynamic Behavior of Carbonate Species on Metal Oxide Surface: Oxygen Scrambling between Adsorbed Carbon Dioxide and Oxide Surface” Langmuir 19, 8793-8800 (2003)
24. K. Arata, M. Hino, “Solid Catalyst Treated with Anion.18.Benzoylation of Toluene with Benzoyl Chloride and Benzoic Anhydride Catalyzed by Solid Superacid of Sulfate-Supported Alumina” Appl. Catalysis 59, 197 (1990)
25. J.R. Lindsay, H.J. Rose, W.E. Swartz, P.H. Watts, K.A. Rayburn, “X-ray photoelectron spectra of aluminum oxides-structural effects on chemical-shift”, Applied Spectroscopy 27, 1-5(1973)
26. J.A. Taylor, “An XPS study of the oxidation of alas thin-films grown by MBE”, Journal of Vacuum Science & Technology 20, 751-755(1982)
27. Jaebum Kim, Kuntal Chakrabarti, Jinho Lee, Ki-Young Oh and Chongmu Lee,“Effects of ozone as an oxygen source on the properties of the Al2O3 thin films prepared by atomic layer deposition”, Materials Chemistry and Physics 78 733–738 (2003)
28. E. Paparazzo, “XPS analysis of iron aluminum-oxide systems, Applied Surface Science 25, 1-12(1986)
29. G. Bandoli, D. Barreca, E. Brescacin, G.A. Rizzi and E. Tondello, Chemical Vapor
Deposition 2, 238(1996)
30. Wenbin Lin, Benjamin C. Wiegand, Ralph G. Nuzzo, and Gregory S. Girolami, “Mechanistic Studies of Palladium Thin Film Growth from Palladium (II) β-Diketonates. 1. Spectroscopic Studies of the Reactions of
61
Bis(hedafluoroacetylacetonato) palladium(II) on Copper Surface, Journal of American Chemical Society 118, 5977-5987 (1996)
31. Jay J. Senkevich, Fu Tang, Diana Rogers, Jason T. Drotar, Christopher Jezewski, William A. Landford, Gwo-ching Wang, and Toh-Ming Lu, “Substrate-Independent Palladium Atomic Layer Deposition”, Chemical Vapor Deposition 9, 258-264(2003)
32. Jay J. Senkevich, Christopher J. Mitchell, G.-R. Yang, T.-M. Lu, “Reduced sulfur-terminated silanes to promote the interaction of palladium(II) hexafluoroacetylacetonate with dielectric surfaces”, Colloids and Surfaces A: Physicochem. Eng. Aspects 221, 29-37(2003)
33. Gobind Kumar, J.R. Blackburn, R.G. Albridge, W.E. Moddeman, and M.M. Jones, “Photoelectron Spectroscopy of Coordination Compounds. II. Palladium Complexes”, Inorganic Chemistry 11, 296-300(1972)
34. Taylor JA, Lancaster GM, Rabalais JW, “Chemical-reactions of N-2+Ion-beams with
group-IV elements and their oxides”, Journal of Electron Spectroscopy and related phenomena 13, 435-444(1978)
62

Table 3.1 List of metal and metal oxide films, precursors, experimental conditions and net
results
63

Table 3.2 Number of deposition cycle, corresponding film thickness, and oxygen to
aluminum atomic ratio in deposited films from three different sets of precursors.
Al(acac)3-H2O2 Al(acac)3-TBP Al(hfac)3-H2O2
No. of Cycles 9 12 10 20 30
Thickness (Å) 40 35 96 147 275
O:Al (atomic ratio) 5.6 14 4.9 2.8 3.1
64

Figur
Oxidizer, e.g. H OOxidizer, e.g. H O
e 3.1 Schematic diagram of the experimental set-up
CO2CO2
Reducer, e.g. H2
Precursor pre-mix cell
Si
2 2
High-Pressure Precursor CellHigh-Pressure
Reactor Cell
Heating Tape
Vent
SamSample Holder
CO2CO2
Reducer, e.g. H2
Precursor pre-mix cell
Si
2 2
High-Pressure Precursor CellHigh-Pressure
Reactor Cell
Heating Tape
Vent
SamSample Holder
65

F1Ls
0
50
100
150
200
250
300
0 10 20 30 40
Cycle Number
Thi
ckne
ss (Å
)
2.13 Å/Cycle
5.6 Å/Cycle
8.44 Å
Al(hfac)3 exposure time3 min
30 sec
30 sec
samples on horizontal sample holder
50
igure 3.2 Ellipsometric thickness data for Al-based film deposited from Al(hfac)3-H2O2 at 00°C and ~2000 psi on Si(100) with native oxide. Figure shows linear growth behavior. onger precursor time shows high rate of film growth. For same precursor exposure time (30 econds), different growth rates are observed for two different sample orientations.
66

Figure 3.3 AFM image of Al-based film deposited in 23 cycles from Al(hfac)3-H2O2, at 100°C and ~2000 psi. JTB treated native Si(100) is used as the substrate. The RMS value for the film is ±2.3 nm while the ellipsometric thickness is 117 Å. The gray scale of this image spans 100 Å from dark to light and each unit in the z-direction corresponds to 50 nm.
67

280282284286288290292294
Inte
nsity
( a.
u.) C 1s
CO3 C0
b)
a)c)
727374757677
Inte
nsity
(a.u
.)
Al0Al2O3AlO(OH)
Al 2p
a)
b)c)
527529531533535
Binding Energy ( eV)
Inte
nsity
(a.u
.)
SiO2 CO3 Al2O3
O1s
a)b)
c)
I
II
III
280282284286288290292294
Inte
nsity
( a.
u.) C 1s
CO3 C0
b)
a)c)
727374757677
Inte
nsity
(a.u
.)
Al0Al2O3AlO(OH)
Al 2p
a)
b)c)
527529531533535
Binding Energy ( eV)
Inte
nsity
(a.u
.)
SiO2 CO3 Al2O3
O1s
a)b)
c)
280282284286288290292294
Inte
nsity
( a.
u.) C 1s
CO3 C0
b)
a)c)
727374757677
Inte
nsity
(a.u
.)
Al0Al2O3AlO(OH)
Al 2p
a)
b)c)
527529531533535
Binding Energy ( eV)
Inte
nsity
(a.u
.)
SiO2 CO3 Al2O3
O1s
a)b)
c)
I
II
III
Figure 3.4 High-resolution XPS peaks for I. Al 2p, II. O 1s, and III. C 1s deposited from a)Al(hfac)3-H2O2 at 100°C,~2000 psi, b)Al(acac)3-H2O2 at 120°C, ~1600 psi, and c) Al(acac)3-TBP at 120°C and ~1600 psi. Native Si(100) is used as the substrate. Comparative chemical states are evaluated from the relative peak positions for the different sets of precursors.
68

280282284286288290292294
Inte
nsity
(a.u
.)
C-O286.3 eV
C=O, CFx
CF3
292.3 eV
330332334336338340342344346348350
Inte
nsity
(a.u
.)
3d 5/23d 3/2
Pd 3d
528529530531532533534535536537538
B.E. (eV)
Inte
nsity
(a.u
.)
O2SiO2
a
b
c
280282284286288290292294
Inte
nsity
(a.u
.)
C-O286.3 eV
C=O, CFx
CF3
292.3 eV
330332334336338340342344346348350
Inte
nsity
(a.u
.)
3d 5/23d 3/2
Pd 3d
528529530531532533534535536537538
B.E. (eV)
Inte
nsity
(a.u
.)
O2SiO2
280282284286288290292294
Inte
nsity
(a.u
.)
C-O286.3 eV
C=O, CFx
CF3
292.3 eV
330332334336338340342344346348350
Inte
nsity
(a.u
.)
3d 5/23d 3/2
Pd 3d
528529530531532533534535536537538
B.E. (eV)
Inte
nsity
(a.u
.)
O2SiO2
a
b
c
Figure 3.5 High resolution XP-Spectra for a) C1s, b) Pd 2p,and c) O1s for palladium film deposited from Pd(hfac)2-H2 in 20 cycles. Native Si(100) is used as the substrate. Deposition temperature is 70°C and pressure ~2000 psi. Ligand and precursor derived contamination from fluorine, carbon and oxygen is anticipated.
69
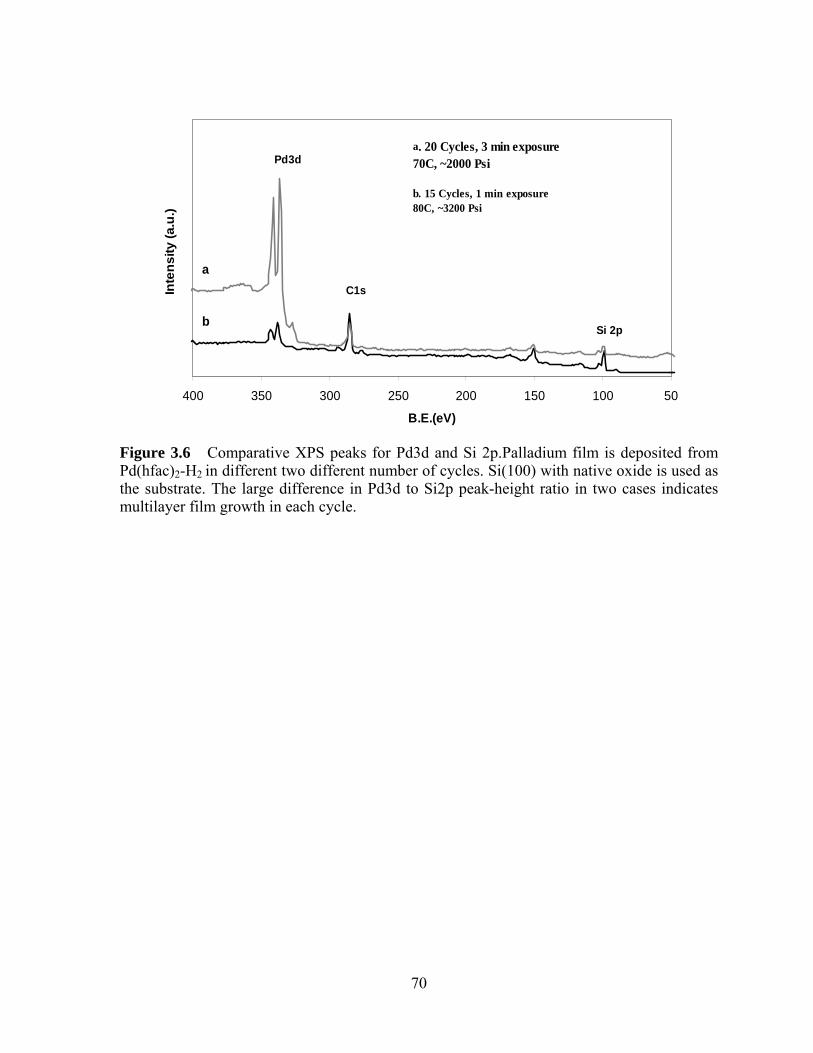
50100150200250300350400
B.E.(eV)
Inte
nsity
(a.u
.)Pd3d
C1s
Si 2p
a
b
a. 20 Cycles, 3 min exposure70C, ~2000 Psi
b. 15 Cycles, 1 min exposure80C, ~3200 Psi
Figure 3.6 Comparative XPS peaks for Pd3d and Si 2p.Palladium film is deposited from Pd(hfac)2-H2 in different two different number of cycles. Si(100) with native oxide is used as the substrate. The large difference in Pd3d to Si2p peak-height ratio in two cases indicates multilayer film growth in each cycle.
70

0 500 1000 1500 2000 2500
Kinetic Energy (eV)
E dN
(E)/d
E
C KLL
O KLLSi KLL
Ru LMM
2220 2240 2260 2280
Ru LMM
0 500 1000 1500 2000 2500
Kinetic Energy (eV)
E dN
(E)/d
E
C KLL
O KLLSi KLL
Ru LMM
2220 2240 2260 2280
Ru LMM
Figure 3.7 AES survey spectra for RuOx film deposited from ruthenocene (RuCp2) and H2O2 in 10 cycles. Reaction temperature is 100° C and pressure ~2000 psi. Si(100) with native oxide is used for deposition. The inset shows high- resolution peak for Ru LMM.
71

9698100102104
B.E. (eV)
Inte
nsity
(a.u
.)
08 cycle s
20 cycle s
40 cycle s
Si 2p
a
b
450460470480490
Inte
nsity
(a.u
. )
40 cycle s
20 cycle s
08 cycle s
Ru 3p
9698100102104
B.E. (eV)
Inte
nsity
(a.u
.)
08 cycle s
20 cycle s
40 cycle s
Si 2p
a
b
450460470480490
Inte
nsity
(a.u
. )
40 cycle s
20 cycle s
08 cycle s
Ru 3p
Figure 3.8 High resolution XP-spectra showing a) Ru3p and b) Si 2p peaks for the RuOx films deposited on chemically oxidized surface of Si(100) at 200°C and ~1500 psi. The attenuating intensity of Si 2p signal indicates growing film thickness with increasing number of deposition cycle.
72

a ba b cc
Figure 3.9 AFM images of Ru/RuOx film deposited from RuCp2 and H2O2 at 200°C and ~1500 psi: a) 8 cycles, b)20 cycles, and c)30 cycles. Chemically oxidized Si(100) was used for the deposition. Figure shows increasing surface roughness with increasing number of deposition cycles. Change in interface morphology indicates non-ideal ALD growth.
73

CHAPTER FOUR
4.1 WORK SUMMARY
In quest of a new process for metal and metal oxide thin film deposition, the
supercritical carbon dioxide based deposition process has been chosen to dig out its
unexplored possibilities. In all cases, a low deposition temperature (70-200ºC) is adopted to
verify the claim that Sc CO2 based deposition can be performed at much lower temperatures
compared to the high vacuum processes. Metal organic precursors are chosen because of
their high solubility in supercritical carbon dioxide and to facilitate the low temperature
deposition. Experiments are carried out in two processes: chemical fluid deposition (CFD)
and atomic layer deposition (ALD)
In this work, new sets of materials are established for metal and metal oxide
deposition. Deposited metal oxides include aluminum oxide, zirconium oxide, manganese
oxide, ruthenium oxide and yttrium oxide, and metals include palladium and ruthenium.
Detailed compositional analyses of the deposited films are performed in light of XPS and
FTIR measurements. Different oxidation states of metals are observed in metal oxide films.
Also carbonates species and ligand-derived contaminations are observed depending on the
precursors and other chemicals used in the process. Electrical characterization of aluminum
oxide is performed by capacitance-voltage measurement. Good electrical properties are
established from the measured data.
The ALD experiments confirm a predictable and controllable growth rate of
aluminum oxide film although high growth rate invalidate an ideal ALD process in this case.
74

The surface morphology of metal -oxide films are analyzed by atomic force microscopy
(AFM). High surface roughness and changing interface morphology confirms that the cyclic
process adopted was not an ideal ALD.
In this study, we showed the first deposition of metal oxides in supercritical carbon
dioxide. Also we established the supercritical carbon dioxide based atomic layer deposition
process for the first time. Although the quality of deposited films were not up to expectation
in many cases, and the ALD was not satisfied completely in terms of its basic criteria, a more
rigorous study can lead to process optimizations and other important findings which can
eventually make this process a parallel one with currently established high vacuum
processes.
4.2 FUTURE WORK
The metal and metal-oxide films, deposited in this study, often showed undesired
chemical composition and contamination. Results indicate the need for an optimized process
in order to ensure better quality films. The next focus of this study will be on studying the
effect of different process parameters, specifically process temperature, pressure, and
precursor concentration on the film quality and film growth. A cold-wall reactor approach
will be better suited for this purpose instead of the currently used hot- wall, high-pressure
cell.
The next step will be to deposit gate metals on high-k dielectric layer. Focus will be
on evaluating the electrical properties of devices formed thereby.
The other goal of this study will be to deposit metal films in selective deposition
approach. Recently our research group showed selective deposition of ruthenium on
octadecyltrichlorosilane (OTS) patterned silicon in a high vacuum ALD process. The same
75

approach will be taken in this Sc CO2 based system. Palladium and ruthenium are of primary
interests in this regard.
76
Copyright © 2022 FDOKUMEN