Correlation lengths, porosity and water adsorption in TiO2 thin films prepared by glancing angle...
11
Correlation lengths, porosity and water adsorption in TiO 2 thin films prepared by glancing angle deposition This article has been downloaded from IOPscience. Please scroll down to see the full text article. 2012 Nanotechnology 23 205701 (http://iopscience.iop.org/0957-4484/23/20/205701) Download details: IP Address: 83.46.9.28 The article was downloaded on 01/05/2012 at 23:16 Please note that terms and conditions apply. View the table of contents for this issue, or go to the journal homepage for more Home Search Collections Journals About Contact us My IOPscience
-
Upload
independent -
Category
Documents
-
view
1 -
download
0
Transcript of Correlation lengths, porosity and water adsorption in TiO2 thin films prepared by glancing angle...
Correlation lengths, porosity and water adsorption in TiO2 thin films prepared by glancing
angle deposition
This article has been downloaded from IOPscience. Please scroll down to see the full text article.
2012 Nanotechnology 23 205701
(http://iopscience.iop.org/0957-4484/23/20/205701)
Download details:
IP Address: 83.46.9.28
The article was downloaded on 01/05/2012 at 23:16
Please note that terms and conditions apply.
View the table of contents for this issue, or go to the journal homepage for more
Home Search Collections Journals About Contact us My IOPscience
IOP PUBLISHING NANOTECHNOLOGY
Nanotechnology 23 (2012) 205701 (10pp) doi:10.1088/0957-4484/23/20/205701
Correlation lengths, porosity and wateradsorption in TiO2 thin films prepared byglancing angle deposition
Lola Gonzalez-Garcıa1, Julian Parra-Barranco1,Juan R Sanchez-Valencia1, Angel Barranco1, Ana Borras1,Agustın R Gonzalez-Elipe1, Mari-Cruz Garcıa-Gutierrez2,Jaime J Hernandez2, Daniel R Rueda2 andTiberio A Ezquerra2
1 Instituto de Ciencia de Materiales de Sevilla (CSIC-Universidade Sevilla), Avenida Americo Vespucio49, 41092 Sevilla, Spain3
2 Instituto de Estructura de la Materia, CSIC, Serrano 121, 28006 Madrid, Spain
E-mail: [email protected]
Received 18 January 2012, in final form 6 March 2012Published 30 April 2012Online at stacks.iop.org/Nano/23/205701
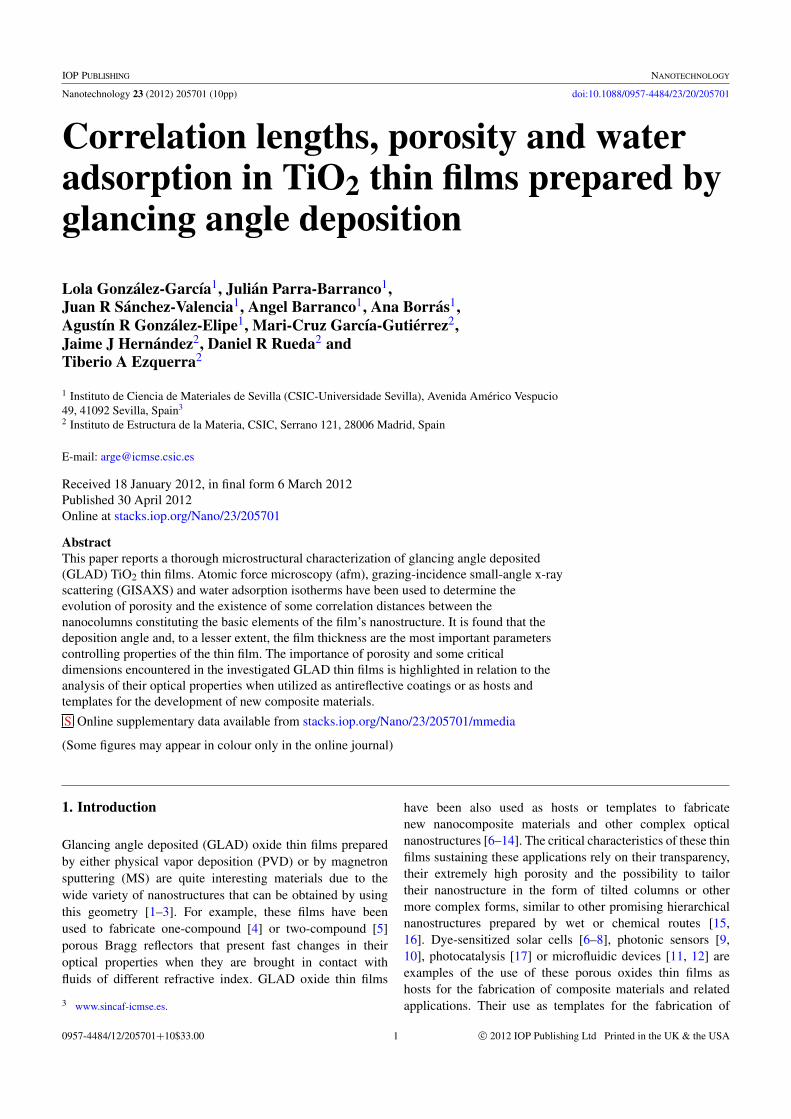
AbstractThis paper reports a thorough microstructural characterization of glancing angle deposited(GLAD) TiO2 thin films. Atomic force microscopy (afm), grazing-incidence small-angle x-rayscattering (GISAXS) and water adsorption isotherms have been used to determine theevolution of porosity and the existence of some correlation distances between thenanocolumns constituting the basic elements of the film’s nanostructure. It is found that thedeposition angle and, to a lesser extent, the film thickness are the most important parameterscontrolling properties of the thin film. The importance of porosity and some criticaldimensions encountered in the investigated GLAD thin films is highlighted in relation to theanalysis of their optical properties when utilized as antireflective coatings or as hosts andtemplates for the development of new composite materials.
S Online supplementary data available from stacks.iop.org/Nano/23/205701/mmedia
(Some figures may appear in colour only in the online journal)
1. Introduction
Glancing angle deposited (GLAD) oxide thin films preparedby either physical vapor deposition (PVD) or by magnetronsputtering (MS) are quite interesting materials due to thewide variety of nanostructures that can be obtained by usingthis geometry [1–3]. For example, these films have beenused to fabricate one-compound [4] or two-compound [5]porous Bragg reflectors that present fast changes in theiroptical properties when they are brought in contact withfluids of different refractive index. GLAD oxide thin films
3 www.sincaf-icmse.es.
have been also used as hosts or templates to fabricatenew nanocomposite materials and other complex opticalnanostructures [6–14]. The critical characteristics of these thinfilms sustaining these applications rely on their transparency,their extremely high porosity and the possibility to tailortheir nanostructure in the form of tilted columns or othermore complex forms, similar to other promising hierarchicalnanostructures prepared by wet or chemical routes [15,16]. Dye-sensitized solar cells [6–8], photonic sensors [9,10], photocatalysis [17] or microfluidic devices [11, 12] areexamples of the use of these porous oxides thin films ashosts for the fabrication of composite materials and relatedapplications. Their use as templates for the fabrication of
10957-4484/12/205701+10$33.00 c© 2012 IOP Publishing Ltd Printed in the UK & the USA
Nanotechnology 23 (2012) 205701 L Gonzalez-Garcıa et al
dichroic thin films based on plasmon resonances of metallicparticles has been also reported [13, 14].
Recently, low refractive index GLAD oxide thin filmshave been proposed as antireflective coatings for solar cellapplications [18, 19]. The high transparency (i.e., absenceof light dispersion) and the very low refractive index ofSiO2 GLAD thin films are the main properties sustainingthis application. However, despite the thorough opticalcharacterization of this type of thin film [18–21], little isknown about the possible influence of the environmentalconditions, namely the relative humidity of the medium, inmodifying their effective refractive index. The reason forthis lies in the partial or total filling of the pores withcondensed water (n = 1.3) instead of air (n = 1.0) whenthese porous films are exposed to the atmosphere. A certainlack of knowledge about these materials is also apparent inother applications [6–14] where the pore volume, pore sizedistribution or possible existence of critical dimensions inGLAD thin films are critical for the posterior synthesis ofcomposite materials. Trying to fill this gap, Brett et al [22,23] have recently reported on the determination of the porevolume of TiO2 and SiO2 GLAD thin films by means of Kradsorption experiments and on the assessment of the meandistance between the nanocolumns by analysis of the scanningelectron microscopy (SEM) images of the film surface. Alongthe same lines, our group has recently identified by GISAXS(grazing-incidence small-angle x-ray scattering) the existenceof some critical distances between the nanocolumns that formthe basic microstructure of TiO2 GLAD thin films [24].
The main purpose of the present work is to get a precisedescription of the main microstructural features of TiO2 thinfilms prepared by electron beam evaporation in a GLADconfiguration. For this study we have carried out a series ofanalyses with TiO2 thin films of different thicknesses preparedby deposition at zenith angles α, defined as the angle formedbetween the evaporation source and the normal to the films,of 60◦, 70◦, 80◦ and 85◦. The thin films have been analyzedby SEM, atomic force microscopy (AFM), GISAXS andwater adsorption isotherms using a quartz crystal monitor(QCM). This latter technique, based on measuring wateradsorption isotherms on the films [25], permits one todetermine their porosity and the pore size distribution, aswell as to assess their water adsorption capacity. In relationto the aforementioned proposal of using GLAD oxide thinfilms as antireflective coatings [18–21], this methodologyis advantageous with respect to other adsorption techniquesbecause it directly yields the amount of water incorporatedwithin the pore structure as a function of the environmentalconditions. In addition, the optical characterization of thefilms by conventional spectroscopic methods, the criticalanalysis of the obtained refractive indices and how theycan be altered by the incorporation of environmental water,complete the present study. The obtained results providerelevant information for further processing these thin filmsas hosts or templates for the manufacture of other compositematerials and for their potential use as antireflective coatingsfor solar cells and related applications.
2. Experimental details
TiO2 thin films were prepared by GLAD at room temperatureon silicon wafers and quartz plates. For the analysis ofporosity, conventional quartz crystal monitor (QCM) pieceswere also used as substrates. Evaporation was carried outin an electron bombardment evaporator, using TiO pelletsas target. Stoichiometric and columnar thin films of TiO2were obtained by evaporation at 10−4 Torr O2, placing thesubstrates with their surface normal at zenith evaporationangles α of 60◦, 70◦, 80◦ and 85◦ with respect to theevaporation source. For GISAXS experiments, the siliconsubstrates (rectangular pieces about 1 × 4 cm2 in size) werepositioned with the shortest edge parallel to the vapor flowdirection. For the other characterization techniques, smallersubstrates, of approximately 1.5 × 1.5 cm2, were used. Thefilm thicknesses varied between 50 and 600 nm, depending onthe type of characterization study.
The microstructure of the TiO2 thin films deposited ona silicon wafer was analyzed by field emission scanningelectron microscopy (FESEM) in a Hitachi S5200 microscopeby examining both their surfaces and cross-sections. Thesurface topography of the films was analyzed by AFM in aDulcinea microscope from Nanotec (Madrid, Spain) workingin tapping mode and using high-frequency cantilevers. AFMimages, taken on a 5×5 µm2 surface, were processed with theWSxM software freely available from Nanotec [26]. Besidesa conventional analysis of the surface topography to estimatethe RMS roughness values, calculations of the so-calledpower spectral density (PSD) [27], a Fourier transformoperation of the surface topography scale, have been carriedout to determine the critical correlation distances between thebasic topographical features of the thin film surfaces.
GISAXS experiments were performed at the BW4beamline (HASYLAB, Hamburg) using a wavelength of λ =0.138 nm and a sample to detector distance of 2.175 m. Amoderate microbeam focusing was achieved using berylliumrefractive lenses (beam size 42 × 22 mm2). The scatteringsignal was recorded with a 2D detector (MAR CCD camerawith 79.1 µm2 pixel size).
Optical transmission spectra for the thin films depositedon quartz plates were recorded on a Cary 100 Conc UV–visspectrophotometer.
Water adsorption/desorption isotherms were measured atroom temperature by dosing increasing amounts of watervapor in a chamber with the investigated TiO2 GLAD thinfilms deposited on quartz crystal monitor (QCM) substrates.Prior to the adsorption process, the QCM substrates wereheated under vacuum at approximately 393 K by means ofirradiation with a halogen lamp placed in their vicinity. Thepossibility of heating the samples prior to the adsorptionexperiment permits the removal of vapors tightly adsorbed inthe samples during their storage and/or their manipulation. Itwill be shown that this heating step is crucial to accuratelyestimate the porosity in GLAD thin films. Otherwise, watermight remain adsorbed in the pores after their exposureto air or to a first adsorption of water. Once the sampleshad been heated at 393 K to achieve complete removal
2
Nanotechnology 23 (2012) 205701 L Gonzalez-Garcıa et al
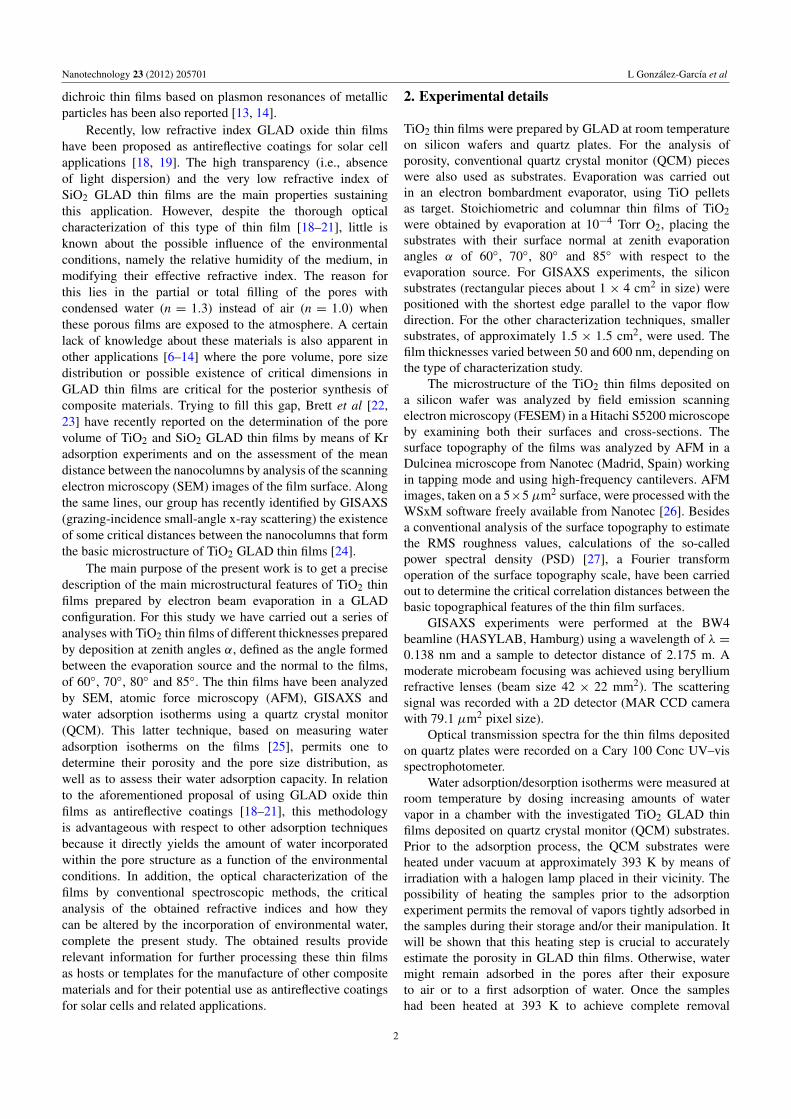
Figure 1. Cross-section SEM micrographs of TiO2 GLAD thin films of approximately 600 nm thickness prepared at the followingevaporation angles: (a) 60◦, (b) 70◦, (c) 80◦ and (d) 85◦. The inset shows, at a higher magnification scale, the formation of thinner columnsjust on the substrate at the beginning of the deposition process.
of adsorbed substances from the pores, they were cooledto room temperature under high vacuum conditions. Anadsorption isotherm was then measured by recording theQCM signal as a function of the water pressure in contactwith it during both the adsorption and desorption processes.To compare the isotherms measured for the different films,they were corrected for their mass thickness, determined byboth Rutherford back scattering (RBS) and x-ray fluorescenceanalysis. All reported data are normalized to an equivalentmass thickness of 500 nm. Total pore volume was estimatedunder the assumption that, once reaching the water vaporsaturation pressure at 298 K, all pores were filled withwater. Note that this assumption would not be correct ifnon-accessible pores exist in the films or if the existing poresdo not fill completely with water under the experimentalworking conditions. A more detailed description of themethod can be found in previous works [25, 28].
3. Results and discussion
3.1. Microstructure and topography of GLAD TiO2 thin films
Figure 1 shows a set of cross-section SEM micrographscorresponding to TiO2 thin films of similar thickness grownat different deposition angles from 60◦ to 85◦. It is apparentthat the films present a columnar microstructure formed oftilted nanocolumns which extend from the interface withthe substrate up to the external surface of the films. Thesenanocolumns are separated by large longitudinal pores, whichdefine a nanostructure open to the medium. After a closerinspection of the films at the interface (see the inset) it is alsoapparent that thin nanocolumns form in direct contact withthe substrate, where they define a kind of nucleation layerfrom which they develop into the large nanocolumns forming
the basic microstructure of the films. Another interestingfeature of this nanocolumnar microstructure is that the tiltingangle of the nanocolumns varies with the deposition angle,presenting tilting angles β of 28◦, 34◦, 44◦ and 47◦ for the thinfilms prepared at the zenith angles of 60◦, 70◦, 80◦ and 85◦,respectively. The obtained values differ from those predictedby the tangent rule [29] (i.e., tang β = k tang α) and othermodels [30] proposed to account for the tilting angle ofnanocolumns in GLAD thin films. However, they agree withrecent Monte Carlo simulations carried out in our group toaccount for the growth of oxide GLAD thin films [31].
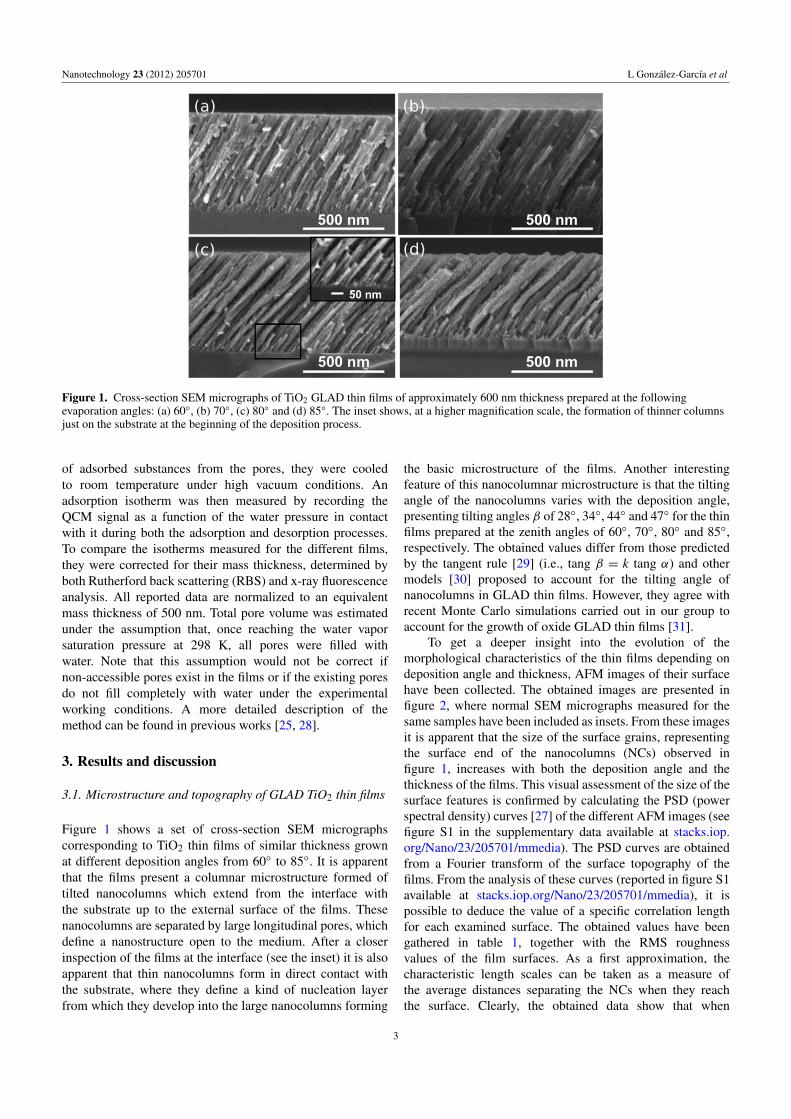
To get a deeper insight into the evolution of themorphological characteristics of the thin films depending ondeposition angle and thickness, AFM images of their surfacehave been collected. The obtained images are presented infigure 2, where normal SEM micrographs measured for thesame samples have been included as insets. From these imagesit is apparent that the size of the surface grains, representingthe surface end of the nanocolumns (NCs) observed infigure 1, increases with both the deposition angle and thethickness of the films. This visual assessment of the size of thesurface features is confirmed by calculating the PSD (powerspectral density) curves [27] of the different AFM images (seefigure S1 in the supplementary data available at stacks.iop.org/Nano/23/205701/mmedia). The PSD curves are obtainedfrom a Fourier transform of the surface topography of thefilms. From the analysis of these curves (reported in figure S1available at stacks.iop.org/Nano/23/205701/mmedia), it ispossible to deduce the value of a specific correlation lengthfor each examined surface. The obtained values have beengathered in table 1, together with the RMS roughnessvalues of the film surfaces. As a first approximation, thecharacteristic length scales can be taken as a measure ofthe average distances separating the NCs when they reachthe surface. Clearly, the obtained data show that when
3
Nanotechnology 23 (2012) 205701 L Gonzalez-Garcıa et al
Figure 2. AFM images of TiO2 GLAD thin films with different thickness from 100 to 600 nm obtained at an equivalent deposition angle of80◦ (top) and with a similar thickness of 300 nm but prepared at different deposition angles from 60◦ to 85◦ (bottom). For comparison,normal SEM images of the surface of these films taken with the same scale (small squares) are included as insets.
Table 1. Root mean square (RMS) values and surface correlation length scales determined from the AFM images in figure 2. Values arereported for thin films of different thickness prepared at a deposition angle of 80◦ and for films with a nominal thickness of 300 nm preparedat different deposition angles from 60◦ to 85◦.
Sample(figure 2)
Thin film thickness(nm)
RMS(nm)
Characteristic length scales 1/k(nm)
a 100 1.0 96.2b 200 1.8 115.1c 300 3.5 123.7d 600 5.2 221.0
Sample(figure 2)
Deposition angle (α) RMS(nm)
Characteristic length scales 1/k(nm)
A 60 1.2 96.5B 70 2.1 102.7C 80 3.5 123.7D 85 4.4 227.0
the thickness increases or the films are prepared at higherdeposition angles they become rougher and develop largercharacteristic correlation lengths. For a fixed deposition angle,the observed increase of this correlation parameter with thethickness of the films can be interpreted by assuming that,during growth, the nanocolumns are increasing in width atthe expense of other columns that grow no further in length.According to previous Monte Carlo simulations [31], thisevolution is the consequence of the shadowing effects thatthe longer NCs exert on the shorter ones, preventing theirgrowth as the films become thicker. In that work it was alsoproved, both theoretically and experimentally, that the NCwidth increases according to the expression:
ξ ≈ dp, (1)
where d is the NC length,
d = t/ sinβ, (2)
with t the film thickness, and p is a parameter that dependson the zenith deposition angle α. According to expression (1),
the increasing value of the characteristic length scales as afunction of the deposition angle (cf. table 1) must thereforereflect the influence of the different values of p on ξ . Anotherway of looking at this tendency is to consider that the size ofthe mesopore entrances defined by the NCs increases with thefilm thickness and with the deposition angle. We will later seethat this view is confirmed by the analysis of porosity reportedin section 3.3.
3.2. GISAXS analysis of GLAD TiO2 thin films
In Brett et al [23], the authors calculated the void sizesappearing at the surface of SiO2 and TiO2 films of similarthickness as function of the deposition angle. In the presentwork, we have examined both the dependence of theintercolumnar distance at the surface and the evolution ofthe average distance between the nanocolumns in the bulk ofthe films. For this purpose, besides the AFM study reportedin section 3.1, we have also carried out a GISAXS analysisof the films. In a previous work [24], we showed that the
4
Nanotechnology 23 (2012) 205701 L Gonzalez-Garcıa et al
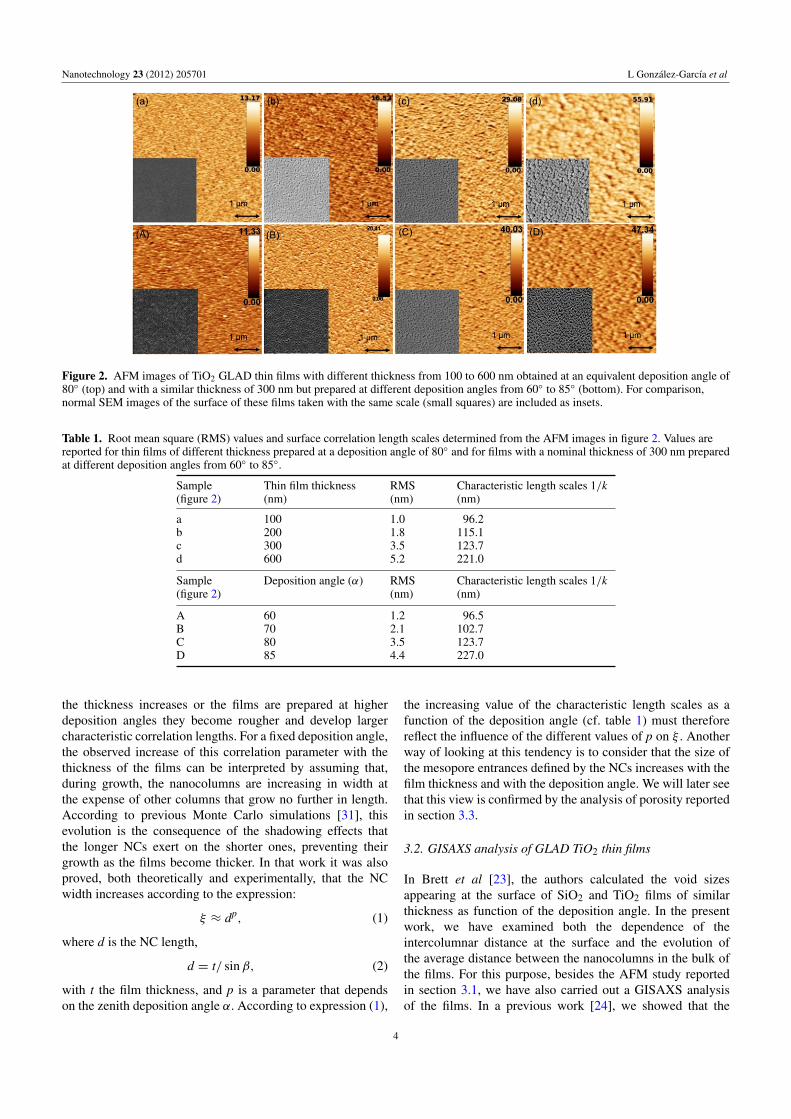
Figure 3. (Top) Scheme of the microstructure of GLAD thin films showing the tilt angle formed by the nanocolumns with respect to thesubstrate surface. (Bottom) Scheme of the GISAXS experiment when the sample is oriented with the direction of its nanocolumns along thebeam direction (σ configuration, left) or perpendicular to it (π configuration, right).
x-ray dispersion patterns of TiO2 GLAD thin films preparedat 80◦ were characterized by an unusual asymmetrical shape,where some scattering maxima revealed the existence ofa specific correlation length which varied with the filmthickness. In that work we also reported a full account of themethodology of pattern analysis and a critical evaluation ofthe meaning of the correlation parameters found. Herein, toclarify the dependence of the shape of the GISAXS patternon the experimental geometry of collection, we present infigure 3 a scheme of the experiment, highlighting the twoselected orientations of the film NCs with respect to thevertical scattering plane, as defined by the specular reflectionof the primary x-ray beam (labeled by PB and SB respectivelyin figure 3) [32]. For the σ -incidence, the TiO2 columns areparallel to the scattering plane and the GISAXS pattern isisotropic, lacking any lateral correlation peak (figure 3, left).When the sample is rotated by 90◦ (π -incidence), the TiO2NCs are tilted with respect to the scattering plane and theGISAXS pattern is not symmetric (figure 3, right), presentinga relative intensity maxima in the large wing of the scatteringpattern. These maxima can be used to estimate the criticalcorrelation lengths between the NCs [24].
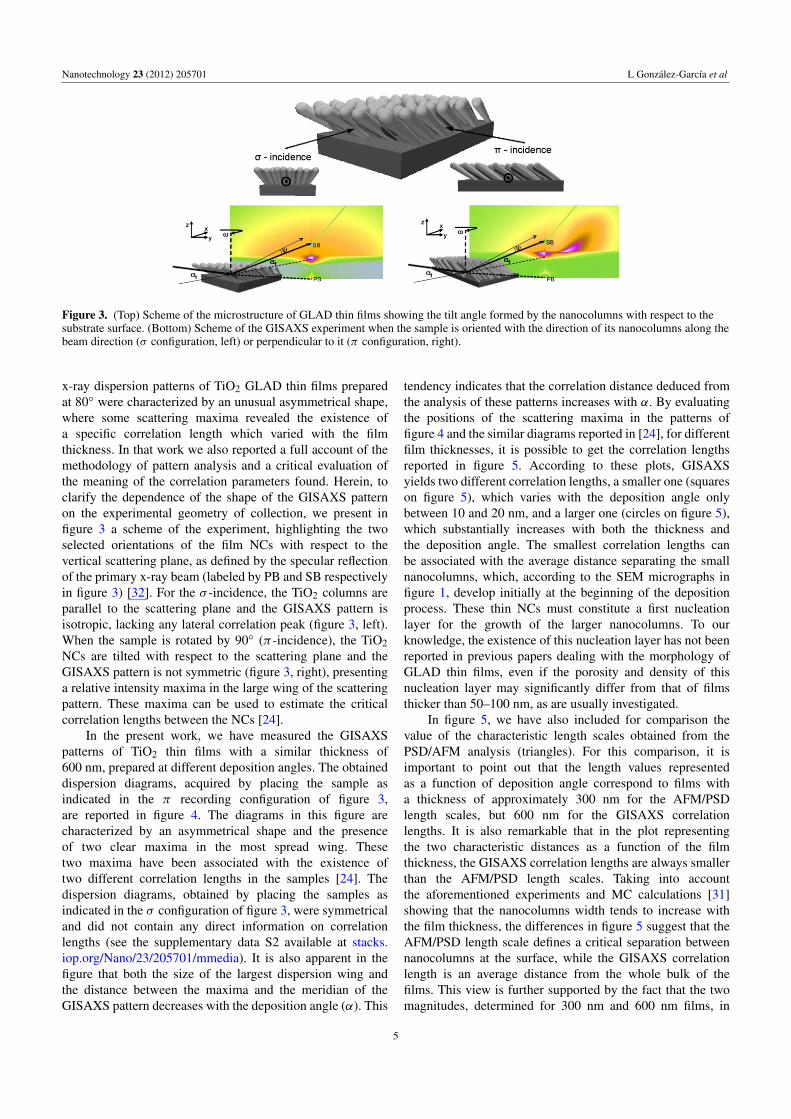
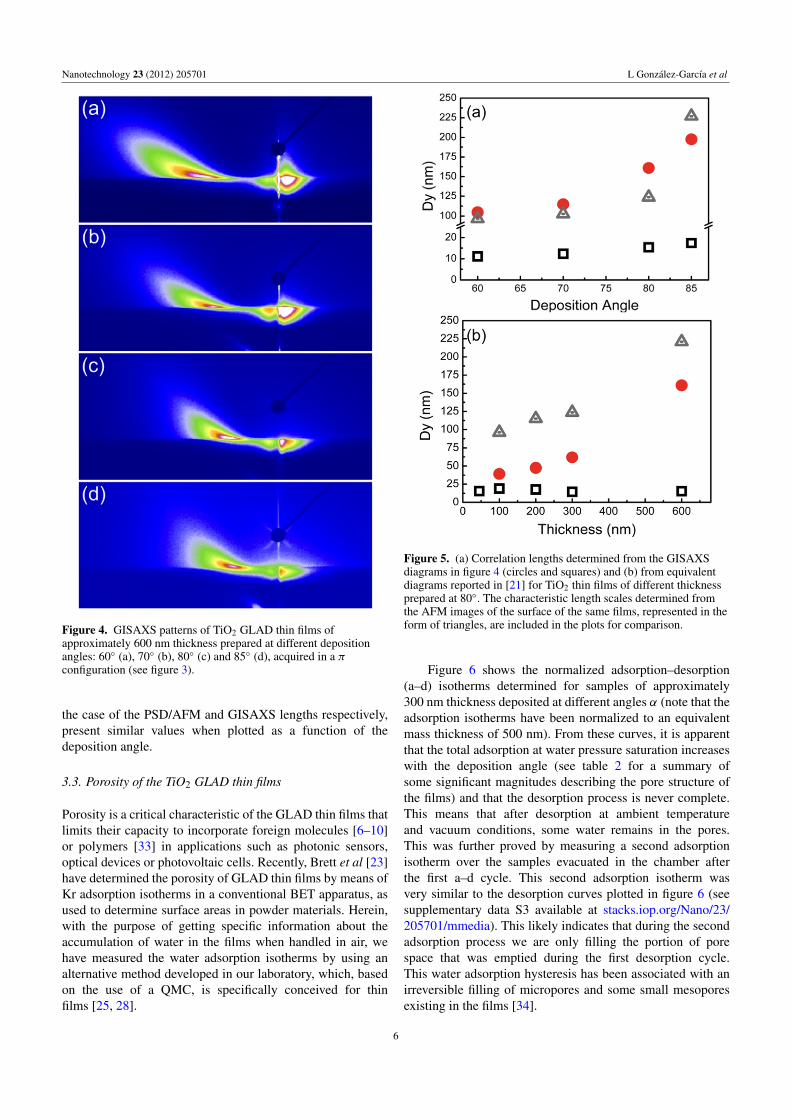
In the present work, we have measured the GISAXSpatterns of TiO2 thin films with a similar thickness of600 nm, prepared at different deposition angles. The obtaineddispersion diagrams, acquired by placing the sample asindicated in the π recording configuration of figure 3,are reported in figure 4. The diagrams in this figure arecharacterized by an asymmetrical shape and the presenceof two clear maxima in the most spread wing. Thesetwo maxima have been associated with the existence oftwo different correlation lengths in the samples [24]. Thedispersion diagrams, obtained by placing the samples asindicated in the σ configuration of figure 3, were symmetricaland did not contain any direct information on correlationlengths (see the supplementary data S2 available at stacks.iop.org/Nano/23/205701/mmedia). It is also apparent in thefigure that both the size of the largest dispersion wing andthe distance between the maxima and the meridian of theGISAXS pattern decreases with the deposition angle (α). This
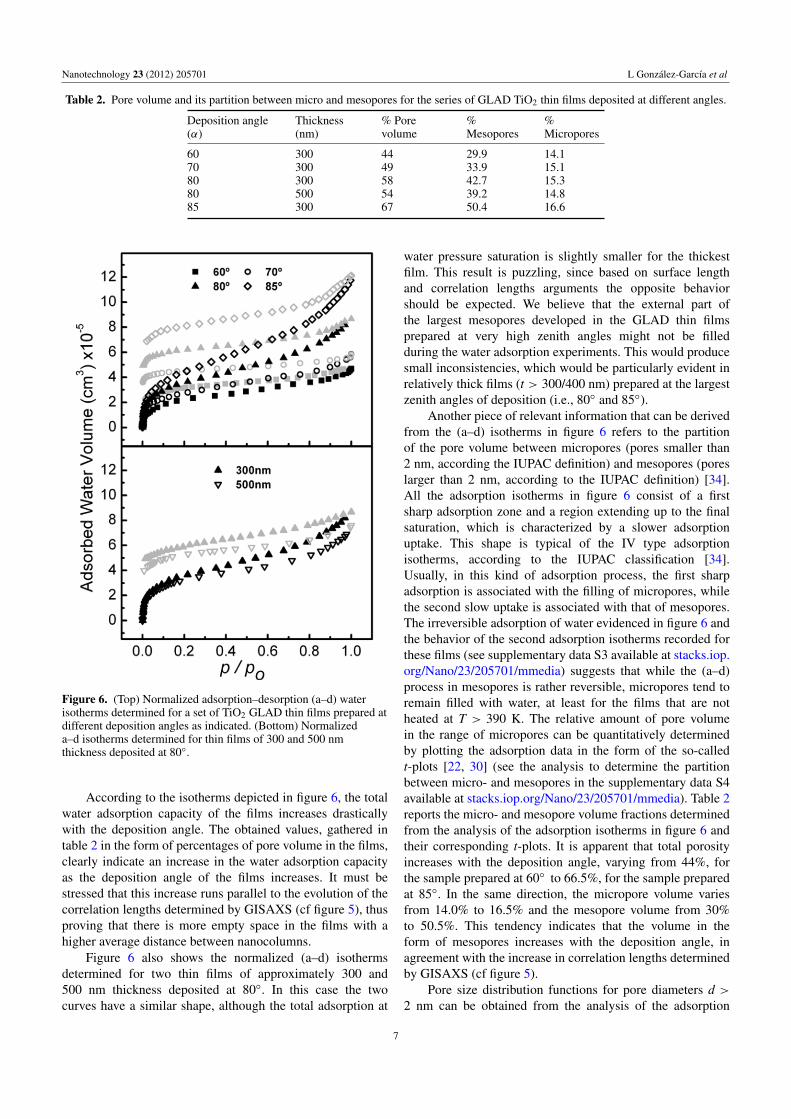
tendency indicates that the correlation distance deduced fromthe analysis of these patterns increases with α. By evaluatingthe positions of the scattering maxima in the patterns offigure 4 and the similar diagrams reported in [24], for differentfilm thicknesses, it is possible to get the correlation lengthsreported in figure 5. According to these plots, GISAXSyields two different correlation lengths, a smaller one (squareson figure 5), which varies with the deposition angle onlybetween 10 and 20 nm, and a larger one (circles on figure 5),which substantially increases with both the thickness andthe deposition angle. The smallest correlation lengths canbe associated with the average distance separating the smallnanocolumns, which, according to the SEM micrographs infigure 1, develop initially at the beginning of the depositionprocess. These thin NCs must constitute a first nucleationlayer for the growth of the larger nanocolumns. To ourknowledge, the existence of this nucleation layer has not beenreported in previous papers dealing with the morphology ofGLAD thin films, even if the porosity and density of thisnucleation layer may significantly differ from that of filmsthicker than 50–100 nm, as are usually investigated.
In figure 5, we have also included for comparison thevalue of the characteristic length scales obtained from thePSD/AFM analysis (triangles). For this comparison, it isimportant to point out that the length values representedas a function of deposition angle correspond to films witha thickness of approximately 300 nm for the AFM/PSDlength scales, but 600 nm for the GISAXS correlationlengths. It is also remarkable that in the plot representingthe two characteristic distances as a function of the filmthickness, the GISAXS correlation lengths are always smallerthan the AFM/PSD length scales. Taking into accountthe aforementioned experiments and MC calculations [31]showing that the nanocolumns width tends to increase withthe film thickness, the differences in figure 5 suggest that theAFM/PSD length scale defines a critical separation betweennanocolumns at the surface, while the GISAXS correlationlength is an average distance from the whole bulk of thefilms. This view is further supported by the fact that the twomagnitudes, determined for 300 nm and 600 nm films, in
5
Nanotechnology 23 (2012) 205701 L Gonzalez-Garcıa et al
Figure 4. GISAXS patterns of TiO2 GLAD thin films ofapproximately 600 nm thickness prepared at different depositionangles: 60◦ (a), 70◦ (b), 80◦ (c) and 85◦ (d), acquired in a πconfiguration (see figure 3).
the case of the PSD/AFM and GISAXS lengths respectively,present similar values when plotted as a function of thedeposition angle.
3.3. Porosity of the TiO2 GLAD thin films
Porosity is a critical characteristic of the GLAD thin films thatlimits their capacity to incorporate foreign molecules [6–10]or polymers [33] in applications such as photonic sensors,optical devices or photovoltaic cells. Recently, Brett et al [23]have determined the porosity of GLAD thin films by means ofKr adsorption isotherms in a conventional BET apparatus, asused to determine surface areas in powder materials. Herein,with the purpose of getting specific information about theaccumulation of water in the films when handled in air, wehave measured the water adsorption isotherms by using analternative method developed in our laboratory, which, basedon the use of a QMC, is specifically conceived for thinfilms [25, 28].
Figure 5. (a) Correlation lengths determined from the GISAXSdiagrams in figure 4 (circles and squares) and (b) from equivalentdiagrams reported in [21] for TiO2 thin films of different thicknessprepared at 80◦. The characteristic length scales determined fromthe AFM images of the surface of the same films, represented in theform of triangles, are included in the plots for comparison.
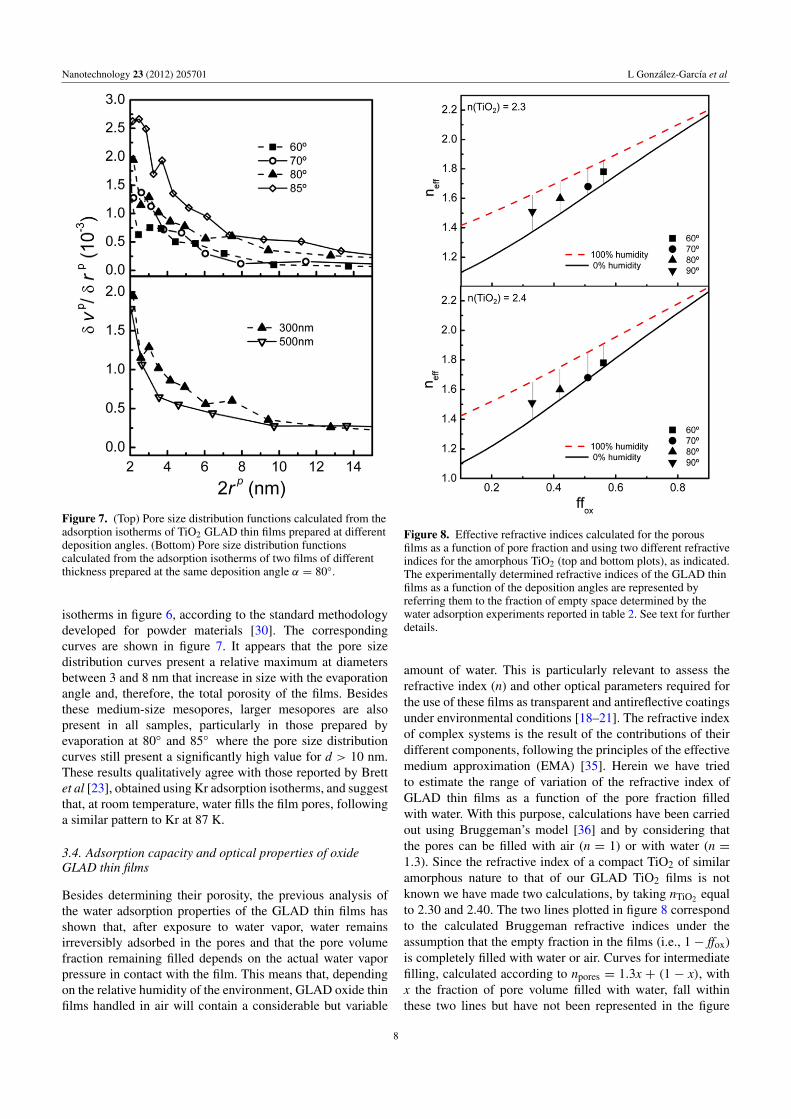
Figure 6 shows the normalized adsorption–desorption(a–d) isotherms determined for samples of approximately300 nm thickness deposited at different angles α (note that theadsorption isotherms have been normalized to an equivalentmass thickness of 500 nm). From these curves, it is apparentthat the total adsorption at water pressure saturation increaseswith the deposition angle (see table 2 for a summary ofsome significant magnitudes describing the pore structure ofthe films) and that the desorption process is never complete.This means that after desorption at ambient temperatureand vacuum conditions, some water remains in the pores.This was further proved by measuring a second adsorptionisotherm over the samples evacuated in the chamber afterthe first a–d cycle. This second adsorption isotherm wasvery similar to the desorption curves plotted in figure 6 (seesupplementary data S3 available at stacks.iop.org/Nano/23/205701/mmedia). This likely indicates that during the secondadsorption process we are only filling the portion of porespace that was emptied during the first desorption cycle.This water adsorption hysteresis has been associated with anirreversible filling of micropores and some small mesoporesexisting in the films [34].
6
Nanotechnology 23 (2012) 205701 L Gonzalez-Garcıa et al
Table 2. Pore volume and its partition between micro and mesopores for the series of GLAD TiO2 thin films deposited at different angles.
Deposition angle(α)
Thickness(nm)
% Porevolume
%Mesopores
%Micropores
60 300 44 29.9 14.170 300 49 33.9 15.180 300 58 42.7 15.380 500 54 39.2 14.885 300 67 50.4 16.6
Figure 6. (Top) Normalized adsorption–desorption (a–d) waterisotherms determined for a set of TiO2 GLAD thin films prepared atdifferent deposition angles as indicated. (Bottom) Normalizeda–d isotherms determined for thin films of 300 and 500 nmthickness deposited at 80◦.
According to the isotherms depicted in figure 6, the totalwater adsorption capacity of the films increases drasticallywith the deposition angle. The obtained values, gathered intable 2 in the form of percentages of pore volume in the films,clearly indicate an increase in the water adsorption capacityas the deposition angle of the films increases. It must bestressed that this increase runs parallel to the evolution of thecorrelation lengths determined by GISAXS (cf figure 5), thusproving that there is more empty space in the films with ahigher average distance between nanocolumns.
Figure 6 also shows the normalized (a–d) isothermsdetermined for two thin films of approximately 300 and500 nm thickness deposited at 80◦. In this case the twocurves have a similar shape, although the total adsorption at
water pressure saturation is slightly smaller for the thickestfilm. This result is puzzling, since based on surface lengthand correlation lengths arguments the opposite behaviorshould be expected. We believe that the external part ofthe largest mesopores developed in the GLAD thin filmsprepared at very high zenith angles might not be filledduring the water adsorption experiments. This would producesmall inconsistencies, which would be particularly evident inrelatively thick films (t > 300/400 nm) prepared at the largestzenith angles of deposition (i.e., 80◦ and 85◦).
Another piece of relevant information that can be derivedfrom the (a–d) isotherms in figure 6 refers to the partitionof the pore volume between micropores (pores smaller than2 nm, according the IUPAC definition) and mesopores (poreslarger than 2 nm, according to the IUPAC definition) [34].All the adsorption isotherms in figure 6 consist of a firstsharp adsorption zone and a region extending up to the finalsaturation, which is characterized by a slower adsorptionuptake. This shape is typical of the IV type adsorptionisotherms, according to the IUPAC classification [34].Usually, in this kind of adsorption process, the first sharpadsorption is associated with the filling of micropores, whilethe second slow uptake is associated with that of mesopores.The irreversible adsorption of water evidenced in figure 6 andthe behavior of the second adsorption isotherms recorded forthese films (see supplementary data S3 available at stacks.iop.org/Nano/23/205701/mmedia) suggests that while the (a–d)process in mesopores is rather reversible, micropores tend toremain filled with water, at least for the films that are notheated at T > 390 K. The relative amount of pore volumein the range of micropores can be quantitatively determinedby plotting the adsorption data in the form of the so-calledt-plots [22, 30] (see the analysis to determine the partitionbetween micro- and mesopores in the supplementary data S4available at stacks.iop.org/Nano/23/205701/mmedia). Table 2reports the micro- and mesopore volume fractions determinedfrom the analysis of the adsorption isotherms in figure 6 andtheir corresponding t-plots. It is apparent that total porosityincreases with the deposition angle, varying from 44%, forthe sample prepared at 60◦ to 66.5%, for the sample preparedat 85◦. In the same direction, the micropore volume variesfrom 14.0% to 16.5% and the mesopore volume from 30%to 50.5%. This tendency indicates that the volume in theform of mesopores increases with the deposition angle, inagreement with the increase in correlation lengths determinedby GISAXS (cf figure 5).
Pore size distribution functions for pore diameters d >2 nm can be obtained from the analysis of the adsorption
7
Nanotechnology 23 (2012) 205701 L Gonzalez-Garcıa et al
Figure 7. (Top) Pore size distribution functions calculated from theadsorption isotherms of TiO2 GLAD thin films prepared at differentdeposition angles. (Bottom) Pore size distribution functionscalculated from the adsorption isotherms of two films of differentthickness prepared at the same deposition angle α = 80◦.
isotherms in figure 6, according to the standard methodologydeveloped for powder materials [30]. The correspondingcurves are shown in figure 7. It appears that the pore sizedistribution curves present a relative maximum at diametersbetween 3 and 8 nm that increase in size with the evaporationangle and, therefore, the total porosity of the films. Besidesthese medium-size mesopores, larger mesopores are alsopresent in all samples, particularly in those prepared byevaporation at 80◦ and 85◦ where the pore size distributioncurves still present a significantly high value for d > 10 nm.These results qualitatively agree with those reported by Brettet al [23], obtained using Kr adsorption isotherms, and suggestthat, at room temperature, water fills the film pores, followinga similar pattern to Kr at 87 K.
3.4. Adsorption capacity and optical properties of oxideGLAD thin films
Besides determining their porosity, the previous analysis ofthe water adsorption properties of the GLAD thin films hasshown that, after exposure to water vapor, water remainsirreversibly adsorbed in the pores and that the pore volumefraction remaining filled depends on the actual water vaporpressure in contact with the film. This means that, dependingon the relative humidity of the environment, GLAD oxide thinfilms handled in air will contain a considerable but variable
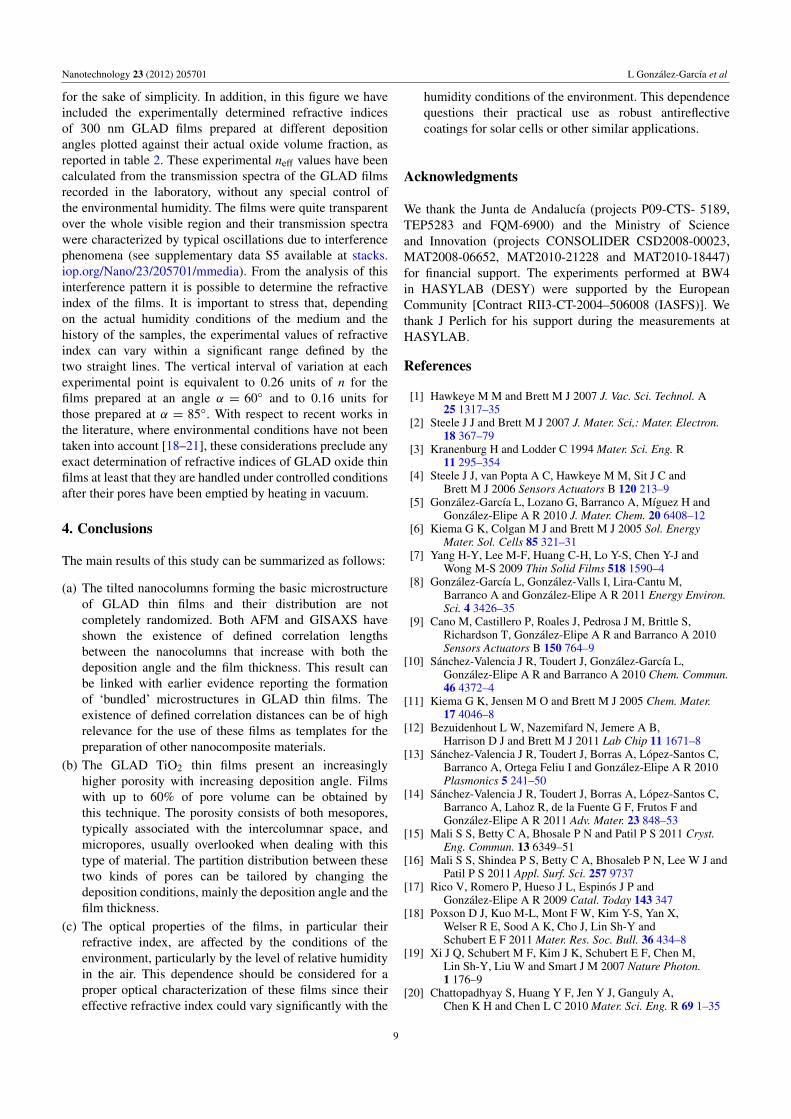
Figure 8. Effective refractive indices calculated for the porousfilms as a function of pore fraction and using two different refractiveindices for the amorphous TiO2 (top and bottom plots), as indicated.The experimentally determined refractive indices of the GLAD thinfilms as a function of the deposition angles are represented byreferring them to the fraction of empty space determined by thewater adsorption experiments reported in table 2. See text for furtherdetails.
amount of water. This is particularly relevant to assess therefractive index (n) and other optical parameters required forthe use of these films as transparent and antireflective coatingsunder environmental conditions [18–21]. The refractive indexof complex systems is the result of the contributions of theirdifferent components, following the principles of the effectivemedium approximation (EMA) [35]. Herein we have triedto estimate the range of variation of the refractive index ofGLAD thin films as a function of the pore fraction filledwith water. With this purpose, calculations have been carriedout using Bruggeman’s model [36] and by considering thatthe pores can be filled with air (n = 1) or with water (n =1.3). Since the refractive index of a compact TiO2 of similaramorphous nature to that of our GLAD TiO2 films is notknown we have made two calculations, by taking nTiO2 equalto 2.30 and 2.40. The two lines plotted in figure 8 correspondto the calculated Bruggeman refractive indices under theassumption that the empty fraction in the films (i.e., 1 − ffox)is completely filled with water or air. Curves for intermediatefilling, calculated according to npores = 1.3x + (1 − x), withx the fraction of pore volume filled with water, fall withinthese two lines but have not been represented in the figure
8
Nanotechnology 23 (2012) 205701 L Gonzalez-Garcıa et al
for the sake of simplicity. In addition, in this figure we haveincluded the experimentally determined refractive indicesof 300 nm GLAD films prepared at different depositionangles plotted against their actual oxide volume fraction, asreported in table 2. These experimental neff values have beencalculated from the transmission spectra of the GLAD filmsrecorded in the laboratory, without any special control ofthe environmental humidity. The films were quite transparentover the whole visible region and their transmission spectrawere characterized by typical oscillations due to interferencephenomena (see supplementary data S5 available at stacks.iop.org/Nano/23/205701/mmedia). From the analysis of thisinterference pattern it is possible to determine the refractiveindex of the films. It is important to stress that, dependingon the actual humidity conditions of the medium and thehistory of the samples, the experimental values of refractiveindex can vary within a significant range defined by thetwo straight lines. The vertical interval of variation at eachexperimental point is equivalent to 0.26 units of n for thefilms prepared at an angle α = 60◦ and to 0.16 units forthose prepared at α = 85◦. With respect to recent works inthe literature, where environmental conditions have not beentaken into account [18–21], these considerations preclude anyexact determination of refractive indices of GLAD oxide thinfilms at least that they are handled under controlled conditionsafter their pores have been emptied by heating in vacuum.
4. Conclusions
The main results of this study can be summarized as follows:
(a) The tilted nanocolumns forming the basic microstructureof GLAD thin films and their distribution are notcompletely randomized. Both AFM and GISAXS haveshown the existence of defined correlation lengthsbetween the nanocolumns that increase with both thedeposition angle and the film thickness. This result canbe linked with earlier evidence reporting the formationof ‘bundled’ microstructures in GLAD thin films. Theexistence of defined correlation distances can be of highrelevance for the use of these films as templates for thepreparation of other nanocomposite materials.
(b) The GLAD TiO2 thin films present an increasinglyhigher porosity with increasing deposition angle. Filmswith up to 60% of pore volume can be obtained bythis technique. The porosity consists of both mesopores,typically associated with the intercolumnar space, andmicropores, usually overlooked when dealing with thistype of material. The partition distribution between thesetwo kinds of pores can be tailored by changing thedeposition conditions, mainly the deposition angle and thefilm thickness.
(c) The optical properties of the films, in particular theirrefractive index, are affected by the conditions of theenvironment, particularly by the level of relative humidityin the air. This dependence should be considered for aproper optical characterization of these films since theireffective refractive index could vary significantly with the
humidity conditions of the environment. This dependencequestions their practical use as robust antireflectivecoatings for solar cells or other similar applications.
Acknowledgments
We thank the Junta de Andalucıa (projects P09-CTS- 5189,TEP5283 and FQM-6900) and the Ministry of Scienceand Innovation (projects CONSOLIDER CSD2008-00023,MAT2008-06652, MAT2010-21228 and MAT2010-18447)for financial support. The experiments performed at BW4in HASYLAB (DESY) were supported by the EuropeanCommunity [Contract RII3-CT-2004–506008 (IASFS)]. Wethank J Perlich for his support during the measurements atHASYLAB.
References
[1] Hawkeye M M and Brett M J 2007 J. Vac. Sci. Technol. A25 1317–35
[2] Steele J J and Brett M J 2007 J. Mater. Sci,: Mater. Electron.18 367–79
[3] Kranenburg H and Lodder C 1994 Mater. Sci. Eng. R11 295–354
[4] Steele J J, van Popta A C, Hawkeye M M, Sit J C andBrett M J 2006 Sensors Actuators B 120 213–9
[5] Gonzalez-Garcıa L, Lozano G, Barranco A, Mıguez H andGonzalez-Elipe A R 2010 J. Mater. Chem. 20 6408–12
[6] Kiema G K, Colgan M J and Brett M J 2005 Sol. EnergyMater. Sol. Cells 85 321–31
[7] Yang H-Y, Lee M-F, Huang C-H, Lo Y-S, Chen Y-J andWong M-S 2009 Thin Solid Films 518 1590–4
[8] Gonzalez-Garcıa L, Gonzalez-Valls I, Lira-Cantu M,Barranco A and Gonzalez-Elipe A R 2011 Energy Environ.Sci. 4 3426–35
[9] Cano M, Castillero P, Roales J, Pedrosa J M, Brittle S,Richardson T, Gonzalez-Elipe A R and Barranco A 2010Sensors Actuators B 150 764–9
[10] Sanchez-Valencia J R, Toudert J, Gonzalez-Garcıa L,Gonzalez-Elipe A R and Barranco A 2010 Chem. Commun.46 4372–4
[11] Kiema G K, Jensen M O and Brett M J 2005 Chem. Mater.17 4046–8
[12] Bezuidenhout L W, Nazemifard N, Jemere A B,Harrison D J and Brett M J 2011 Lab Chip 11 1671–8
[13] Sanchez-Valencia J R, Toudert J, Borras A, Lopez-Santos C,Barranco A, Ortega Feliu I and Gonzalez-Elipe A R 2010Plasmonics 5 241–50
[14] Sanchez-Valencia J R, Toudert J, Borras A, Lopez-Santos C,Barranco A, Lahoz R, de la Fuente G F, Frutos F andGonzalez-Elipe A R 2011 Adv. Mater. 23 848–53
[15] Mali S S, Betty C A, Bhosale P N and Patil P S 2011 Cryst.Eng. Commun. 13 6349–51
[16] Mali S S, Shindea P S, Betty C A, Bhosaleb P N, Lee W J andPatil P S 2011 Appl. Surf. Sci. 257 9737
[17] Rico V, Romero P, Hueso J L, Espinos J P andGonzalez-Elipe A R 2009 Catal. Today 143 347
[18] Poxson D J, Kuo M-L, Mont F W, Kim Y-S, Yan X,Welser R E, Sood A K, Cho J, Lin Sh-Y andSchubert E F 2011 Mater. Res. Soc. Bull. 36 434–8
[19] Xi J Q, Schubert M F, Kim J K, Schubert E F, Chen M,Lin Sh-Y, Liu W and Smart J M 2007 Nature Photon.1 176–9
[20] Chattopadhyay S, Huang Y F, Jen Y J, Ganguly A,Chen K H and Chen L C 2010 Mater. Sci. Eng. R 69 1–35
9
Nanotechnology 23 (2012) 205701 L Gonzalez-Garcıa et al
[21] Poxson D J, Mont F W, Schubert M F, Kim J K andSchubert E F 2008 Appl. Phys. Lett. 93 101914
[22] van Popta A C, Cheng J, Sit J C and Brett M J 2007 J. Appl.Phys. 102 013517
[23] Krause K M, Thommes M and Brett M J 2011 Micropor.Mesopor. Mater. 143 166–73
[24] Gonzalez-Garcia L, Barranco A, Munoz Paez A,Gonzalez-Elipe A R, Garcia-Gutierrez M C, Hernandez J J,Rueda D R, Ezquerra T A and Babonneau D 2010ChemPhysChem 11 2205–8
[25] Borras A, Sanchez-Valencia J R, Garrido-Molinero J,Barranco A and Gonzalez-Elipe A R 2009 Micropor.Mesopor. Mater. 118 314–24
[26] Horcas I, Fernandez R, Gomez-Rodriguez J M, Colchero J,Gomez-Herrero J and Baro A M 2007 Rev. Sci. Instrum.78 013705
[27] Barabasi A L and Stanley H E 1995 Fractal Concepts inSurface Growth (Cambridge: Cambridge University Press)
[28] Borras A, Barranco A and Gonzalez-Elipe A R 2006 J. Mater.Sci. 41 5220
[29] Nieuwenhuizen J M and Haanstra H B 1966 Philips Tech. Rev.27 87–91
[30] Tait R N, Smy T and Brett M J 1993 Thin Solid Films 226 196[31] Alvarez R, Gonzalez-Garcıa L, Romero-Gomez P, Rico V,
Cotrino J, Gonzalez-Elipe A R and Palmero A 2011J. Phys. D: Appl. Phys. 44 385302
[32] Muller-Buschbaum P 2009 A Basic Introduction to GrazingIncidence Small-Angle X-Ray Scattering (Lect. Notes Phys.vol 776) (Berlin: Springer) pp 61–89
[33] Gerein N J, Fleischauer M D and Brett M J 2010 Sol. EnergyMater. Sol. Cells 94 2343–50
[34] Gregg S J and Sing K S W 1982 Adsorption, Surface Area andPorosity (London: Academic)
[35] Aspnes D E 1982 Thin Solid Films 89 249–62[36] Flory F and Escoubas L 2004 Prog. Quantum Electron.
28 89–112
10