Democracy-assessment in cross-national surveys: A critical examination of how people evaluate their...
15
Democracy-Assessment in Cross-National Surveys: A Critical Examination of How People Evaluate Their Regime Gal Ariely Accepted: 4 November 2013 / Published online: 10 June 2014 Ó Springer Science+Business Media Dordrecht 2014 Abstract Despite doubts regarding their validity and comparability, survey questions relating to the assessment of democracy remain a common feature of cross-national studies. This paper examines the way in which they are formulated in the World Values Survey 2005 by investigating their association with questions relating to a genuine understanding of democracy and the actual level of democracy in the countries surveyed. A multilevel analysis across 47 countries revealed that the level of democracy in a country is related to the relationship between a genuine understanding of democracy and democracy- assessment. While these relations are positive in democracies, they are insignificant in non- democratic countries. The implications of these findings for examining democratic atti- tudes across countries via the use of such survey questions are discussed. Keywords Democratic attitudes Á Satisfaction from democracy Á Public opinion Á Cross-national surveys Á World Values Survey 1 Introduction As part of the ongoing attempt to examine whether democracy is consolidated in people’s minds, several cross-national surveys include items relating to the assessment of one’s democracy and/or satisfaction from democracy. The World Values Survey (WVS) 2005, for example, contains the question: And how democratically is this country being governed today? Again using a scale from 1 to 10, where 1 means that it is ‘‘not at all democratic’’ and 10 means that it is ‘‘com- pletely democratic,’’ what position would you choose? 1 G. Ariely (&) The Department of Politics and Government, Ben-Gurion University of the Negev, P.O.B. 653, 84105 Beer-Sheva, Israel e-mail: [email protected] 1 WVS weights were used to create the aggregate democracy measure. 123 Soc Indic Res (2015) 121:621–635 DOI 10.1007/s11205-014-0666-y
Transcript of Democracy-assessment in cross-national surveys: A critical examination of how people evaluate their...

Democracy-Assessment in Cross-National Surveys:A Critical Examination of How People Evaluate TheirRegime
Gal Ariely
Accepted: 4 November 2013 / Published online: 10 June 2014� Springer Science+Business Media Dordrecht 2014
Abstract Despite doubts regarding their validity and comparability, survey questions
relating to the assessment of democracy remain a common feature of cross-national
studies. This paper examines the way in which they are formulated in the World Values
Survey 2005 by investigating their association with questions relating to a genuine
understanding of democracy and the actual level of democracy in the countries surveyed. A
multilevel analysis across 47 countries revealed that the level of democracy in a country is
related to the relationship between a genuine understanding of democracy and democracy-
assessment. While these relations are positive in democracies, they are insignificant in non-
democratic countries. The implications of these findings for examining democratic atti-
tudes across countries via the use of such survey questions are discussed.
Keywords Democratic attitudes � Satisfaction from democracy � Public opinion �Cross-national surveys � World Values Survey
1 Introduction
As part of the ongoing attempt to examine whether democracy is consolidated in people’s
minds, several cross-national surveys include items relating to the assessment of one’s
democracy and/or satisfaction from democracy. The World Values Survey (WVS) 2005,
for example, contains the question:
And how democratically is this country being governed today? Again using a scale from
1 to 10, where 1 means that it is ‘‘not at all democratic’’ and 10 means that it is ‘‘com-
pletely democratic,’’ what position would you choose?1
G. Ariely (&)The Department of Politics and Government, Ben-Gurion University of the Negev, P.O.B. 653,84105 Beer-Sheva, Israele-mail: [email protected]
1 WVS weights were used to create the aggregate democracy measure.
123
Soc Indic Res (2015) 121:621–635DOI 10.1007/s11205-014-0666-y

Figure 1—which presents average democracy-assessment across countries—reflects the
problematic nature of the question. One of the countries with the highest scores is Vietnam
which cannot be considered as democracy, while respondents in the established liberal
democracies of the Netherlands and United States rated their democracy lower than
respondents in Jordan and China. The variance in meaning attributed to democracy across
countries undermines the efficacy of items that employ the general term ‘‘democracy’’
rather than adduce a specific aspect of this concept. While the majority of cross-national
surveys adopt this form of the question, it is not clear that a shared meaning of democracy
exist across countries. While some scholars (Dalton et al. 2007) contend that a similar
concept of democracy exists across countries, others (Canache et al. 2001) cast doubt on
this claim. The importance of measuring attitudes towards democracy has led to an
extensive debate regarding the best strategy for measuring democratic attitudes (Ariely and
Davidov 2011; Linde and Ekman 2003; Schedler and Sarsfield 2007). Despite the con-
troversy in which they are embroiled, these questions remain integral to studies of dem-
ocratic values and support of democracy (e.g., Diamond and Plattner 2008; Norris 2011; Qi
and Shin 2011).
This paper contributes to the debate by examining the WVS 2005 item in order to
evaluate whether the higher rating of democracy in some non-democratic countries (Fig. 1)
compromises the validity of this survey question for drawing comparisons. To this end, we
employed another set of questions, included for the first time in the WVS studies, which
relates to how respondents understand the concept of democracy. Exploratory and con-
firmatory factor analyses across the countries demonstrated the existence of a common
conception of the procedures of democracy that enables cross-national comparison.
Adopting a multilevel design, we tested to see whether this construct is related to the
assessment of democracy across countries and, if so, whether this relationship is affected
by the actual level of democracy in a specific country. This step allowed us to check
whether respondents’ assessment of their democracy reflects how they understand the
concept of democracy and/or the actual level of democracy in their regime. We also
examined alternative explanations of democracy-assessment—government effectiveness
and economic development. While previous studies primarily employed data from a single
country/region, this study uniquely adopts a multilevel approach across numerous
countries.
2 The Meaning of Democracy Across Nations
Scholars have long assumed that a democratic system’s stability depends upon the level of
legitimacy granted to it by the general public (Almond and Verba 1963; Diamond 1999;
Lipset 1959). The significance of attitudes in establishing the legitimacy of democratic
regimes is reflected in the vast empirical literature that has been devoted to measuring mass
public attitudes towards democracy (e.g., Inglehart and Welzel 2005; Norris 2011). The
worldwide expansion of democracy has enlarged the number of societies in which dem-
ocratic attitudes can be measured (Shin 2007), the proliferation of cross-national research
projects likewise playing a large role in promoting the measurement of attitudes towards
democracy—as evidenced in cross-national surveys such as the WVS, European Value
Study (EVS), International Social Survey Project (ISSP), and Gallup International Voice of
the People Project. As with various regional barometers (Heath et al. 2005; Kittilson 2007),
these cross-national surveys include questions intended to provide researchers with a
comprehensive measurement of democracy as perceived by the public.
622 G. Ariely
123

The task of constructing a valid measure of attitudes towards democracy has led to the
proposal of variant strategies. The most common question is one that explicitly asks
respondents whether they support democratic rule in their country. Others doubt the
validity of such questions and adopt alternative strategies such as the rejection of the
strong-man role and/or other non-democratic alternatives (e.g., Mishler and Rose 2001) or
open-ended questions regarding the meaning of democracy (e.g., Dalton et al. 2007).
The debate over whether these questions should explicitly contain the word ‘‘democ-
racy’’ is not merely methodological but forms part of a broader argument regarding the
proper way to conceptualize democracy (Collier and Levitsky 1997; Munck 2009).
Although multiple definitions exist, the only consensus reached to date appears to be that
8.488.137.957.847.737.657.537.447.437.42
7.167.127.077.047.027.006.996.896.866.746.736.716.606.576.536.536.526.526.476.386.346.206.136.015.835.815.745.685.60
5.205.185.094.99
4.364.334.324.214.14
12345678GhanaNorwayVietnamJordanUruguaySwitzerlandSwedenSouth AfricaSpainFinlandCanadaAustraliaArgentinaThailandMaliMalaysiaChileTaiwanJapanChinaCyprusZambiaFranceMexicoIndiaNetherlandsGermanyIndonesiaUKSouth KoreaUSABrazilTrinidad and TobagoTurkeySloveniaRomaniaPolandBurkina FasoPeruIranSerbiaMoldovaMoroccoGeorgiaRussiaBulgariaEthiopiaUkraine
Fig. 1 Democratic assessment across countries in the WVS 2005
Democracy-Assessment in Cross-National Surveys 623
123
democracy is an ‘‘essentially contested concept’’ (O’Donnell 2007). Not only is it based on
equally reasonable and legitimate—but incompatible—criteria but this circumstance
means that it can carry variant senses in diverse frameworks. Various scholars thus con-
tinue to use different concepts and measures to estimate democracy.
Democracy’s polysemic nature is also demonstrated in studies of democratic political
culture and conceptions of democracy (Shin 2007). Although people worldwide are gen-
erally overwhelmingly supportive of democracy (Inglehart 2003), the vagueness inherent
in its definition allows different and even controversial meanings to be ascribed to the
concept. Some empirical evidence suggests that explicit support for democracy does not
reflect a common understanding of the concept of democracy. The findings from a Mexican
cluster-analysis study examining the link between direct and indirect measures of demo-
cratic support indicate that while most Mexicans support democracy in the abstract the
majority also reject core principles of liberal democracy—such as political tolerance
(Schedler and Sarsfield 2007). A similar study conducted in the same country found that
variant conceptions of democracy correlate differently with how Mexicans evaluate
democracy in their country, those emphasizing socioeconomic equity being less satisfied
with democracy than those who regard liberalism as a key element (Crow 2010). Studies
conducted in the Middle East similarly show that support for democracy in the Arab world
is as high as or higher than any other region in the world (Jamal and Tessler 2008).
Subsequent use of the Arabbarometer by the same researchers, however, led them to
conclude that ‘‘People understand democracy in different ways. Often, they value it mainly
as an instrument’’ (2008: 108). Mishler and Rose (2001) seek to distinguish between an
‘‘idealistic’’ measure based on explicit employment of the word ‘‘democracy’’ and a
‘‘realistic’’ measure that relates to support for alternative regimes. Their analysis of surveys
from post-communist countries suggests that the realistic is preferable to the idealistic
measure.
Others argue that people in different countries may in fact define democracy on the
basis of common criteria. Various regional barometers have adopted the usage of open-
ended questions regarding the meaning of democracy. These requiring respondents to
define democracy in their own words, they might be perceived as providing a more
accurate basis for cross-national comparison. According to Dalton et al. (2007), the
majority of people in such surveys define democracy in terms of the freedoms, liberties,
and rights it conveys rather than its institutional elements or social benefits, most people—
even in new democracies—being capable of defining the concept in their own words.
Using the Afrobarometer open question ‘‘What, if anything, does democracy mean to
you?,’’ Michael Bratton (2010) found that while those interviewed expressed liberal and
procedural conceptions of democracy they also evinced disparate understandings of the
concept of democracy.
To date, the cross-national surveys in which the respondents from the countries included
possessed discrepant definitions of the concept of democracy provide no clear indication of
whether it is possible to comparatively measure evaluation of/satisfaction with democracy.
Given the limitations under which measuring explicit support for democracy labors, this
result should not be surprising. Schedler and Sarsfield (2007) have drawn attention to
several flaws in survey questions that explicitly use the word ‘‘democracy.’’ The first risk is
that of social desirability. Democracy referring to an ideal form of government, some
respondents tend to favor it even when they do not understand its meaning and/or endorse
undemocratic values. Secondly, being an abstract value and multidimensional concept,
respondents may feel democracy to be a state to aspire to without fully comprehending its
624 G. Ariely
123
nature. Thirdly, its multidimensionality allows respondents to attribute different meanings
to democracy.
Another shortcoming of survey questions relating to democracy-assessment and/or
satisfaction with democracy derives from the fact that they are based on single-item scales.
While single-item scales are common in cross-national surveys—this paper also focusing
on a single-item scale—they preclude both the testing of measurement equivalence—a
particularly relevant factor in studies across dissimilar national contexts (Billiet 2003)—
and control for non-random measurement errors and testing of the scale’s convergent/
discriminant validity. Thus, for example, a study looking at the measurement equivalence
of democratic endorsement in the WVS demonstrates that multiple indicator scales are not
valid across all the countries (Ariely and Davidov 2011).
These methodological limitations are compounded by a substantive issue relating to
respondents’ capacity to distinguish between support for democracy in their country and
support for the regime. When asked to evaluate the level of democracy in their country,
respondents may well have in mind the effectiveness of their government or the level of
national economic performance. Several studies have thus criticized the commonly-used
‘‘satisfaction with democracy’’ (SWD) measure prevalent in cross-national surveys—some
arguing that is not clear whether this scale measures support for one’s democracy or
support for regime performance (e.g., Canache et al. 2001; Lagos 2003; Linde and Ekman
2003). A panel analysis examining how institutional factors affect satisfaction with
democracy in Western Europe similarly demonstrates that high-quality institutions exert a
positive effect on satisfaction with democracy (Wagner et al. 2009).
In conclusion, the validity and comparability of single-item survey questions that
explicitly use the word ‘‘democracy’’ is hotly disputed, several factors raising doubt
regarding the propriety of their usage. The fact that they remain common in cross-national
surveys of political attitudes and the literature, however, demands that they be critically
investigated. In the current paper, we combine examination of the meaning respondents
attribute to democracy with a multilevel approach that analyzes whether living in a
democratic country correlates with the ability to assess its level of democracy. We also
discuss alternative country-level explanations.
3 Data
Our data is drawn from WVS 2005. Intended as a survey instrument for use across regions
and countries with widely-divergent histories, cultures, and political conditions—including
authoritarian regimes (Norris 2009)—this serves as a key source for comparative studies of
democratic attitudes (e.g., Inglehart and Welzel 2005; Norris 2011). More than half of the
countries included in our analysis only having been democracies for the past 30 years, a
relatively large section of our respondents have been accustomed to living in non-demo-
cratic regimes. WVS 2005 also includes a series of questions regarding the constitutive
elements of democracy, thereby enabling us to assess how the respondents understand the
concept of democracy. Out of the countries included in WVS 2005, we analyzed 48 that
possess the relevant items: Argentina, Australia, Brazil, Bulgaria, Burkina Faso, Canada,
Chile, China, Cyprus, Ethiopia, Finland, France, Georgia, Germany, Ghana, India, Indo-
nesia, Iran, Japan, Jordan, Malaysia, Mali, Mexico, Moldova, Morocco, the Netherlands,
Norway, Peru, Poland, Romania, the Russian Federation, Vietnam, Serbia, Slovenia, South
Africa, South Korea, Spain, Sweden, Switzerland, Taiwan, Thailand, Trinidad and Tobago,
Turkey, Ukraine, the UK, the United States, Uruguay, and Zambia.
Democracy-Assessment in Cross-National Surveys 625
123
4 Measures
Assessment of democracy is based on the question: ‘‘And how democratically is this
country being governed today? Again using a scale from 1 to 10, where 1 means that it is
‘not at all democratic’ and 10 means that it is ‘completely democratic,’ what position
would you choose?’’ The response pattern to this question is normally distributed
(mean = 6.4; SD = 2.4). Figure 1 presents the mean across the countries.
Procedural understating of democracy WVS 2005 was the first survey to include
questions relating to how people understand the concept of democracy, adduced by asking
respondents regarding their agreement with diverse definitions of democracy: ‘‘Many
things may be desirable, but not all of them are essential characteristics of democracy.
Please tell me for each of the following things how essential you think it is as a charac-
teristic of democracy. Use this scale where 1 means ‘not at all an essential characteristic of
democracy’ and 10 means it definitely is ‘an essential characteristic of democracy’’’:
• Governments tax the rich and subsidize the poor. (V152)
• Religious authorities interpret the laws. (V153)
• People choose their leaders in free elections. (V154)
• People receive state aid for unemployment. (V155)
• The army takes over when government is incompetent. (V156)
• Civil rights protect people’s liberty against oppression. (V157)
• The economy is prospering. (V158)
• Criminals are severely punished. (V159)
• People can change the laws in referendums. (V160)
• Women have the same rights as men. (V161)
As Welzel (2011) and Norris (2011) argue, these items enable an analysis of the degree
of importance respondents ascribe to various notions of democracy, some reflecting a
liberal notion of civil rights (V157), others an illiberal notion of democracy (V153), and
yet others an instrumental perspective on economic prosperity (V158). We conducted an
exploratory factor analysis (unreported) in each of the countries in order to identify which
factors allow us to assess which elements respondents attribute to democracy. The analysis
indicates that while some countries (e.g., Brazil) evinced a three-factor solution, others
(e.g., Bulgaria) only evinced a two-factor solution. The factor item loadings also vary
across countries. As expected, this finding demonstrates that the concept of democracy is
understood divergently in different countries. Four questions were nonetheless loaded onto
one factor across the majority of countries: people choose their leaders in free elections
(V154), civil rights protect people’s liberty against oppression (V157), people can change
the laws in referendums (V160), and women have the same rights as men (V161). All four
of these questions reflect a procedural or liberal understanding of democracy (Norris 2011).
Fair and free elections are a necessary condition for the existence of democracy. The
protection afforded by civil rights reflects not only the procedure of democracy but also its
consolidation. Gender equality constitutes a liberal component of democracy. The com-
monly-accepted definition of democracy should thus include these components as forming
constitutive elements of democracy.
As the confirmatory-factor analysis revealed, however, this conception of democracy
was not held universally. In one country (Ghana), the question ‘‘Civil rights protect peo-
ple’s liberty against oppression’’ was loaded negatively on the latent factor. Ghana was
therefore excluded from the analysis. The multiple-group confirmatory factor analysis
indicated that the factor is comparable and equivalent—to a certain degree—across 47 of
626 G. Ariely
123

the 48 countries.2 Despite the variation in understanding of the concept of democracy
across the countries, one construct could thus be compared across virtually the entire
sample.3
4.1 Controls
Controls included age, gender, education, and political interest—the latter reflecting a
degree of political sophistication relevant for the respondents’ capacity to assess their
democracy.
4.2 Country-Level Variable: Level of Democracy
The country level of democracy was measured by the Gastil Index of civil liberties and
political rights given in the Freedom House annual reports—a commonly-used indicator of
country level of democracy widely utilized in comparative literature due to the fact that it
focuses on a wider range of civil liberties, rights, and freedoms than other indices and thus
reflects a comprehensive definition of democracy. We obtained data for 2005 and reserved
the coding, higher scores signifying a higher level of democracy. Our sample varies from
as low a rate as 1 (e.g., Vietnam) to as high as 12 (e.g., Sweden), the mean being 9. The
lack of consensus regarding the way in which democracy should be measured noted above
also being valid for country measures (Munck 2009), we replicated the analysis using
another common measure of democracy—the Economist index of democracy. For the sake
of simplicity, only the Gastil Index results are presented in this article.
Government effectiveness was measured by the Government Effectiveness index drawn
from the World Bank Worldwide Governance Indicators Project. This data set constitutes a
well-developed attempt to measure the quality of governments around the world, being
used by numerous studies comparing government performance. The Government Effec-
tiveness index measures the ‘‘quality of public services, the quality of the civil service and
the degree of its independence from political pressures, the quality of policy formulation
and implementation, and the credibility of the government’s commitment to such policies’’
(Kaufmann et al. 2010: Economic development was measured by GDP per capita, the data
being drawn from the World Bank indicators.
5 Are All Respondents Able to Assess Their Democracy and/or Identifythe Constitutive Elements of Democracy?
Before engaging in any analysis, the issue of non-response must be addressed. While the
average non-response for procedural understanding of democracy and democracy-assess-
ment was 8.5 % across the sample—a reasonable figure—a strong variation nonetheless
obtains, ranging from countries such as South Korea, which exhibited a near zero non-
response, to China where nearly half the sample failed to respond to these items. While this
clear non-response bias can be accounted for by several methodological factors (Couper
2003), our specific interest lay in whether the bias correlated with the country level of
democracy. In less democratic countries, the lack of a full or proper understanding of the
2 For the multiple-group confirmatory factor analysis, see ‘‘Appendix’’.3 The loadings of the four items on the latent factor being virtually identical in the pooled sample, a simpleaverage was used.
Democracy-Assessment in Cross-National Surveys 627
123
concept of democracy may make people unwilling to answer such questions. In addition, in
such countries as China, respondents may be less prepared to answer these questions
candidly. Irrespective of the reason, the correlation between the country level of democ-
racy and the non-response was r = -.39—a relatively strong result for such a small
sample.4 People in less democratic countries thus appear to tend not to answer questions
relating to their evaluation of their democracy or that ask them to identify the essential
elements of democracy. Analysis of the non-response phenomenon requiring a separate
paper, we wish to note here that a possible bias that may undermine the use of these two
scales should not be ignored. Likewise, such a non-response pattern hinders the ability to
aggregate individual answers to the country-level measure of democracy as was done in
Fig. 1.
6 Analytical Approach
We adopted a hierarchical linear modeling (HLM) approach (Hox 2010)—a methodolo-
gically-appropriate strategy on two counts. Firstly, the fact that respondents are nested
within countries in the WVS data enabled us to avoid interpreting the coefficients of
variables as significant when they are not in fact. Secondly, it permitted an examination of
whether the macro condition—the country level of democracy—is related to people’s
assessment of their democracy and whether the relationship between a procedural under-
standing of democracy and democracy-assessment varies according to the country level of
democracy. This allowed us to account simultaneously for contextual- and individual-level
explanations.
7 Results
The first stage of the multilevel analysis calculated the degree to which the variance in
democracy-assessment is explained at the country level. For this purpose, the interclass
correlation coefficient (ICC) of the null model was calculated and found to be .185 = 1.1/
(1.1 ? 4.827). This represents the percentage of the variance for explaining democracy-
assessment at the country level. Such level of ICC implies that the variation in democracy-
assessment is affected by dissimilar national contexts (Hox 2010).
Model 1a in Table 1 presents the results of the analysis including the individual level
control variables.5 Education and age were found to be unrelated to democracy-assessment.
The primary control variable affecting democracy-assessment was political interest, people
interested in politics tending to give higher ratings for their democracy. Model 1b includes
the key exploratory variable—a procedural understanding of the concept of democracy.
While a strong positive relationship obtains between the procedural understanding of
democracy and democracy-assessment, this does not mean that it exists in each of the 47
countries. In fact, when the regression models were replicated for each country, a variation
obtained in both the strength and direction of the relationship. In some countries—such as
Ethiopia—a negative correlation exists between these variables. In China, in contrast, the
relationship was insignificant. The question to be discussed is thus whether this variation is
related to the country level of democracy. Model 1c examines whether the country level of
4 Following the exclusion of China, the correlation is r = -.25.5 WVS weights were used in the multilevel regression models.
628 G. Ariely
123
democracy affects the overall level of democracy-assessment. The results indicate a direct
positive effect for country level of democracy. Citizens in countries rated as democracies
tend to think their country to be more democratic. The direct effect of democracy
accounted for a 10 reduction in the unexplained variance. This ten percent relating to the
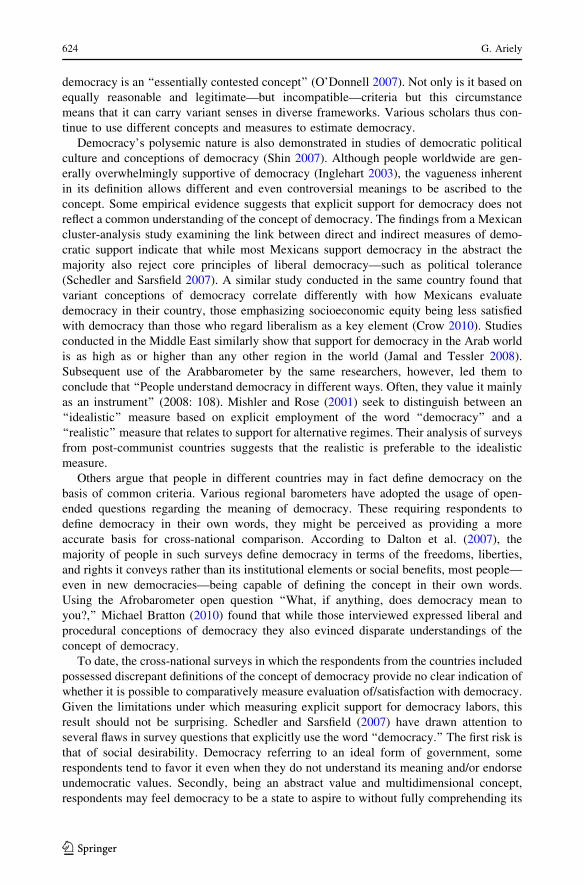
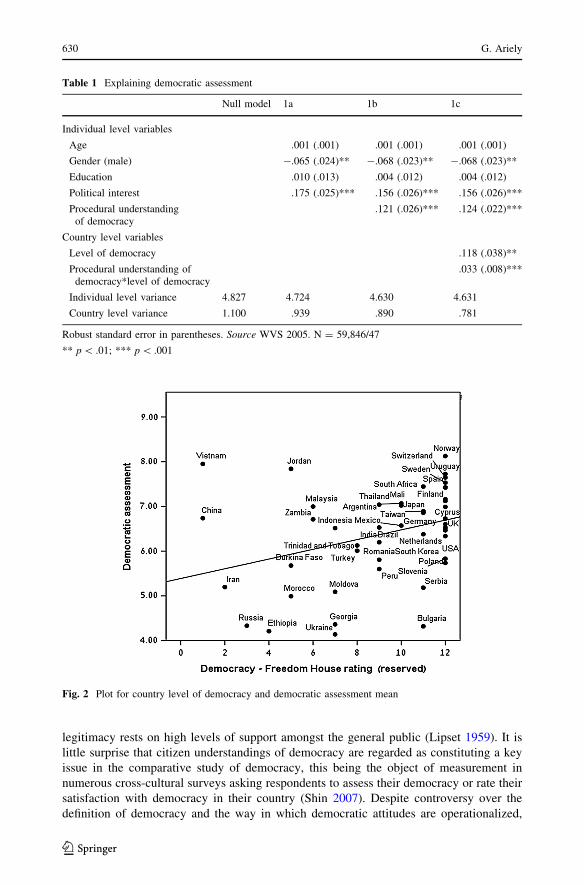
country level variance, however, this effect is rather limited. Figure 2 illustrates the rel-
atively weak relationship between the country level of democracy and democracy-
assessment. Such democratic countries as Bulgaria evince a low democracy-assessment,
less democratic countries such as Zambia and Jordan exhibiting higher ratings. The var-
iation illustrated in Fig. 2 implies that additional factors account for democracy-
assessment.
Model 1c also examines whether the country level of democracy wields an interactive
effect on the relationship between a procedural understanding of the concept of democracy
and democracy-assessment. The results indicate a strong positive effect, the relation
between a procedural understanding of the concept of democracy and democracy-assess-
ment only being positive in countries with higher levels of democracy. In countries with a
lower rating of democracy, these relations are insignificant. Figure 3 illustrates the slope
differences, the upper line signifying the upper quartile of democracy ratings. This line
indicates the strong positive relationship between a procedural understanding of democracy
and democracy-assessment. The lower line—the slope for the lower quartile of democracy
ratings—indicates a slightly negative but insignificant relationship between these two
factors. Figure 4 plots the country rating of democracy and the correlation between a
procedural understanding of the concept of democracy and democracy-assessment. While
this relation varies in less-democratic countries, the variation is smaller in more democratic
countries.6 More importantly, no negative correlation obtains between the two factors in
the highest rated democracies.7
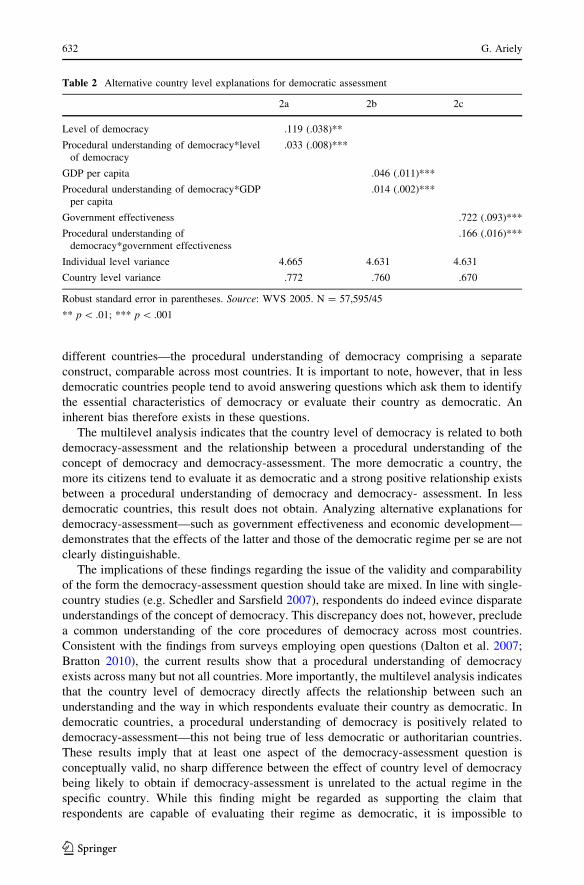
The final section of the analysis examines the effect of the country level of democracy
vis-a-vis alternative explanations—namely, government effectiveness and economic
development. These measures are strongly correlated with the measure of democracy,
reflecting the fact that, on average, democratic countries possess effective governments and
are more economically developed (Halperin et al. 2010). The distinct effects are presented
in separate models in Table 2. The results of Model 2b and 2c indicate that government
effectiveness and economic development exert similar direct and interactive effects upon
democracy. Their strong correlation precludes their inclusion in the same model due to
fears of multicollinearity.8 The results of the three models therefore support the claim that
it is difficult to distinguish between the effects of democracy and those of government
performance—both factors exerting a similar effect upon democracy-assessment.
8 Discussion and Implications
Democracy is a framework that seeks to resolve conflicts in society via consensus on core
principles that limit the power of government and empower citizens. As such, its
6 Given that the highest missing values came from China, the analysis was replicated without this country inorder to verify that the results were not biased.7 The models were replicated using the Economist Democracy Index in order to verify consistent resultsacross different measures of democracy.8 In a sample of 45 countries, government effectiveness and economic development are correlated .70 and.68 respectively with the country level of democracy.
Democracy-Assessment in Cross-National Surveys 629
123
legitimacy rests on high levels of support amongst the general public (Lipset 1959). It is
little surprise that citizen understandings of democracy are regarded as constituting a key
issue in the comparative study of democracy, this being the object of measurement in
numerous cross-cultural surveys asking respondents to assess their democracy or rate their
satisfaction with democracy in their country (Shin 2007). Despite controversy over the
definition of democracy and the way in which democratic attitudes are operationalized,
Table 1 Explaining democratic assessment
Null model 1a 1b 1c
Individual level variables
Age .001 (.001) .001 (.001) .001 (.001)
Gender (male) -.065 (.024)** -.068 (.023)** -.068 (.023)**
Education .010 (.013) .004 (.012) .004 (.012)
Political interest .175 (.025)*** .156 (.026)*** .156 (.026)***
Procedural understandingof democracy
.121 (.026)*** .124 (.022)***
Country level variables
Level of democracy .118 (.038)**
Procedural understanding ofdemocracy*level of democracy
.033 (.008)***
Individual level variance 4.827 4.724 4.630 4.631
Country level variance 1.100 .939 .890 .781
Robust standard error in parentheses. Source WVS 2005. N = 59,846/47
** p \ .01; *** p \ .001
Fig. 2 Plot for country level of democracy and democratic assessment mean
630 G. Ariely
123

questions designed to evaluate attitudes towards democracy appear likely to continue to be
included in comparative surveys because they facilitate research into the validity and
comparability of the scales. Many argue that such a multi-dimensional and defined concept
as democracy cannot be evaluated by explicit questions that ask respondents if they support
democracy or are satisfied with the way in which it functions in their country.
This study employed data from WVS 2005 in order to examine democracy-assessment
in relation to how people understand democratic procedures and the country level of
democracy. The analysis of respondents’ answers regarding the constitutive elements of
democracy indicated that people understand the concept of democracy disparately in
5.61
5.99
6.36
6.74
7.12
Ass
esse
men
t o
f d
emo
crac
y
-1.97 -0.91 0.15 1.22
Procedural understanding of democracy
Democracy lower quartile
Democracy upper quartile
Fig. 3 Slope differences for the relations between procedural understanding of democracy and democraticassessment under the effect of country level of democracy (Model 1c)
Fig. 4 Plot for country level of democracy and the correlation between procedural understanding ofdemocracy and democratic assessment (Model 1c)
Democracy-Assessment in Cross-National Surveys 631
123
different countries—the procedural understanding of democracy comprising a separate
construct, comparable across most countries. It is important to note, however, that in less
democratic countries people tend to avoid answering questions which ask them to identify
the essential characteristics of democracy or evaluate their country as democratic. An
inherent bias therefore exists in these questions.
The multilevel analysis indicates that the country level of democracy is related to both
democracy-assessment and the relationship between a procedural understanding of the
concept of democracy and democracy-assessment. The more democratic a country, the
more its citizens tend to evaluate it as democratic and a strong positive relationship exists
between a procedural understanding of democracy and democracy- assessment. In less
democratic countries, this result does not obtain. Analyzing alternative explanations for
democracy-assessment—such as government effectiveness and economic development—
demonstrates that the effects of the latter and those of the democratic regime per se are not
clearly distinguishable.
The implications of these findings regarding the issue of the validity and comparability
of the form the democracy-assessment question should take are mixed. In line with single-
country studies (e.g. Schedler and Sarsfield 2007), respondents do indeed evince disparate
understandings of the concept of democracy. This discrepancy does not, however, preclude
a common understanding of the core procedures of democracy across most countries.
Consistent with the findings from surveys employing open questions (Dalton et al. 2007;
Bratton 2010), the current results show that a procedural understanding of democracy
exists across many but not all countries. More importantly, the multilevel analysis indicates
that the country level of democracy directly affects the relationship between such an
understanding and the way in which respondents evaluate their country as democratic. In
democratic countries, a procedural understanding of democracy is positively related to
democracy-assessment—this not being true of less democratic or authoritarian countries.
These results imply that at least one aspect of the democracy-assessment question is
conceptually valid, no sharp difference between the effect of country level of democracy
being likely to obtain if democracy-assessment is unrelated to the actual regime in the
specific country. While this finding might be regarded as supporting the claim that
respondents are capable of evaluating their regime as democratic, it is impossible to
Table 2 Alternative country level explanations for democratic assessment
2a 2b 2c
Level of democracy .119 (.038)**
Procedural understanding of democracy*levelof democracy
.033 (.008)***
GDP per capita .046 (.011)***
Procedural understanding of democracy*GDPper capita
.014 (.002)***
Government effectiveness .722 (.093)***
Procedural understanding ofdemocracy*government effectiveness
.166 (.016)***
Individual level variance 4.665 4.631 4.631
Country level variance .772 .760 .670
Robust standard error in parentheses. Source: WVS 2005. N = 57,595/45
** p \ .01; *** p \ .001
632 G. Ariely
123

conclusively ascertain whether the effect derives from the country level of democracy or
other factors—such as governmental effectiveness or economic development.
As previous studies have demonstrated, survey questions that explicitly include the
word ‘‘democracy’’ should be used with caution, requiring that special attention be paid to
how such questions are understood. As single-item scales, they preclude measurement
equivalence and allow for the possibility that comparison might be compromised by
systematic measurement error. Contra some scholars, however, they are not entirely non-
operationizable. Forming the basis of findings that a procedural understanding of the
concept of democracy is positively related to democracy-assessment in democratic
countries but not in less democratic or authoritarian countries—thus implying the existence
of a common conception of democracy—they can be used for drawing cautious
comparisons.
What are the practical implications for future studies? First and foremost, cross-
contextual studies whose survey questions contain the word ‘‘democracy’’ must ensure
that they possess theoretical validation. This can be obtained—as in the present study—
by using questions that address the respondents’ understanding of the concept of
democracy or by relating to items that reflect a genuine understanding of democracy,
such as political tolerance. Secondly, studies examining democratic- assessment in non-
democratic countries must take account of potential response- pattern biases. Many
respondents in non-democratic countries may be unable or unwilling to evaluate their
regime according to democratic standards. Thirdly, multilevel analyses integrating
democracy indices across a large set of countries must recognize the difficulty in dis-
tinguishing between democracy indices and government effectiveness or economic
development.
Comparative cross-national surveys face various methodological challenges. The wider
the sample and the greater number of countries from dissimilar political contexts in the
analysis proportionately increasing the difficulty of the task. At the same time, it is
precisely difference in context that makes such cross-national studies valuable—especially
when examining such issues as democratic attitudes. This paper demonstrates the pros and
cons of a question that asks respondents to assess their democracy. While the findings
indicate that such questions should be used with caution they also call for the integration
of other methods—such as in-depth cross-country interviews—in order to validate
assumptions regarding people’s conceptions of the multi-dimensional notion of
democracy.
Fig. 5 The measurement model
Democracy-Assessment in Cross-National Surveys 633
123
Appendix: Multiple group Confirmatory Factor Analysis for Democratic Assessment
We examined whether the procedural understanding of democracy scale was equivalent
across the countries. For that, we constructed a measurement model (Fig. 5), examined it in
each country and across the countries. The single country CFA reveals that in most
countries the model had good fits and sufficient factor loadings on the constructs. In Ghana
however, we found that V157 was loaded negatively on the latent factor, so Ghana was
excluded from the analysis. In addition, in some countries the covariance between the
errors of V160 (e3) and V161 (e4) had to be released. The multiple group confirmatory
factor analysis across 47 countries indicates that partial metric equivalence can be estab-
lished. The reduction in the CFI between the configural model and the partial metric model
was .012 and there was no REMSA reduction which fits Chen’s 2007 recommended
criteria.
References
Almond, G. A., & Verba, S. (1963). The civic culture: Political attitudes and democracy in five nations.Princeton, NJ: Princeton University Press.
Ariely, G., & Davidov, E. (2011). Can we rate public support for democracy in a comparable way? Cross-national equivalence of democratic attitudes in the world value survey. Social Indicators Research,104(2), 271–286.
Billiet, J. (2003). Cross-cultural equivalence with structural equation modeling. In J. A. Harkness, van deVijver, J. R. Fons, & P. P. Mohler, (eds.) Cross-cultural survey methods (pp. 247–264). New York:John Wiley.
Bratton, M. (2010). Anchoring the ‘‘D-word’’ in Africa. Journal of Democracy, 21(4), 106–113.Canache, D., Mondak, J. J., & Seligson, M. A. (2001). Meaning and measurement in cross-national research
on satisfaction with democracy. Public Opinion Quarterly, 65(4), 506–528.Chen, F. F. (2007). Sensitivity of goodness of fit indexes to lack of measurement invariance. Structural
Equation Modeling, 14(3), 464–504.Collier, D., & Levitsky, S. (1997). Democracy with adjectives: Conceptual innovation in comparative
research. World Politics, 49(3), 430–451.Couper, M., & De Leeuw E. (2003). Non-response in cross-cultural and cross-national surveys. In J.
A. Harkness, van de Vijver, J. R. Fons, & P. P. Mohler, (eds.) Cross-cultural survey methods (pp.157–178). New Jersey: John Wiley.
Crow, D. (2010). The party’s over: Citizen conceptions of democracy and political dissatisfaction inMexico. Comparative Politics, 43(1), 41–61.
Dalton, R., Shin, D. C., & Jou, W. (2007). Understanding democracy: Data from unlikely places. Journal ofDemocracy, 18(4), 142–156.
Diamond, L. J. (1999). Developing democracy: Toward consolidation. Baltimore: Johns Hopkins UniversityPress.
Diamond, L. J., & Plattner, M. F. (Eds.). (2008). How people view democracy. Baltimore: Johns HopkinsUniversity Press.
Halperin, M. H., Siegle, J. T., & Weinstein, M. M. (2010). The democracy advantage, revised edition: Howdemocracies promote prosperity and peace. New York: Routledge.
Heath, A., Fisher, S., & Smith, S. (2005). The globalization of public opinion research. Annual Review ofPolitical Science, 8, 297–333.
Hox, J. J. (2010). Multilevel analysis: Techniques and applications (2nd ed.). New York: Routledge.Inglehart, R. (2003). How solid is mass support for democracy: And how can we measure it? Political
Science and Politics, 36(1), 51–57.Inglehart, R., & Welzel, C. (2005). Modernization, cultural change, and democracy. Cambridge: Cambridge
University Press.Jamal, A. A., & Tessler, M. A. (2008). Attitudes in the Arab world. Journal of Democracy, 19(1), 97–110.Kaufmann, D., Kraay, A., & Mastruzzi, M. (2010). The worldwide governance indicators: Methodology and
analytical issues. Washington, DC: World Bank. Accessed on August 28, 2013. Available online athttp://www.brookings.edu/reports/2010/09_wgi_kaufmann.aspx.
634 G. Ariely
123
Kittilson, M. C. (2007). Research resources in comparative political behavior. In J. R. Dalton & H.Klingemann (Eds.), Oxford handbook of political behavior (pp. 865–895). Oxford: Oxford UniversityPress.
Lagos, M. (2003). Support for and satisfaction with democracy. International Journal of Public OpinionResearch, 15(4), 471–487.
Linde, J., & Ekman, J. (2003). Satisfaction with democracy: A note on a frequently used indicator incomparative politics. European Journal of Political Research, 42(3), 391–408.
Lipset, S. M. (1959). Some social requisites of democracy: Economic development and political legitimacy.American Political Science Review, 53(1), 69–105.
Mishler, W., & Rose, R. (2001). Political support for incomplete democracies: Realist versus idealisttheories and measures. International Political Science Review, 22(4), 303–320.
Munck, G. L. (2009). Measuring democracy: A bridge between scholarship and politics. Baltimore: JohnsHopkins University Press.
Norris, P. (2009). The globalization of comparative public opinion research. In N. Robinson & T. Landman(Eds.), Handbook of comparative politics (pp. 522–540). London: Sage.
Norris, P. (2011). Democratic deficit. New York: Cambridge University Press.O’Donnell, G. (2007). The perpetual crises of democracy. Journal of Democracy, 18(1), 5–11.Qi, L., & Shin, D. C. (2011). How mass political attitudes affect democratization: Exploring the facilitating
role critical democrats play in the process. International Political Science Review, 32(3), 245–262.Schedler, A., & Sarsfield, R. (2007). Democrats with adjectives: Linking direct and indirect measures of
democratic support. European Journal of Political Research, 46(5), 637–659.Shin, D. C. (2007). Democratization: Perspectives from global citizenries. In J. R. Dalton & H. Klingemann
(Eds.), The Oxford handbook of political behavior (pp. 259–282). Oxford: Oxford University Press.Wagner, A. F., Schneider, F., & Halla, M. (2009). The quality of institutions and satisfaction with
democracy in Western Europe: A panel analysis. European Journal of Political Economy, 25(1),30–41.
Welzel, C. (2011). The Asian values thesis revisited: Evidence from the World Values Surveys. JapaneseJournal of Political Science, 12(1), 1–31.
Democracy-Assessment in Cross-National Surveys 635
123