deflection basin of flexible pavements - MSpace
347
THE EFFECT OF CRACKING ON THE DEFLECTION BASIN OF FLEXIBLE PAVEMENTS BY HADI MOHAMED OMAR Submitted to the Faculty of Graduate Studia in partial FuIfdment of the Requirements for the Degree DOCTOR OF PHILOSOPHY Department of Civil Engineering Univenitg of Manitoba Winnipeg, Manitoba December, 1996
-
Upload
khangminh22 -
Category
Documents
-
view
0 -
download
0
Transcript of deflection basin of flexible pavements - MSpace

THE EFFECT OF CRACKING ON THE DEFLECTION BASIN OF FLEXIBLE
PAVEMENTS
BY
HADI MOHAMED OMAR
Submitted to the Faculty of Graduate Studia in partial FuIfdment of the Requirements
for the Degree
DOCTOR OF PHILOSOPHY
Department of Civil Engineering Univenitg of Manitoba Winnipeg, Manitoba
December, 1996

National Library 1+1 ofCanada Bibliothèque nationale du Canada
Acquisitions and Acquisitions et Bibliographie Senkes services bibliographiques 395 Wellington Street 395. rue Wellington OltawaON K1AON4 -ON K I A W Canada Canada
The author has granted a non- exclusive licence allowing the National Library of Canada to reproduce, loan, distribute or sell copies of this thesis in microfom, paper or electronic formats.
The author retains ownership of the copyright in this thesis. Neither the thesis nor substantial extracts fiom it may be printed or otherwise reproduced without the author's permission.
vour nb vom rd--
Our & Noire r d i ë m œ
L'auteur a accordé une licence non exclusive permettant à la Bibliothèque nationale du Canada de reproduire, prêter, distribuer ou vendre des copies de cette thèse sous la fome de microfiche/film, de reproduction sur papier ou sur format électronique.
L'auteur conserve la propriété du droit d'auteur qui protège cette thèse. Ni la thèse ni des extraits substantiels de celle-ci ne doivent être imprimés ou autrement reproduits sans son autorisation.

THE UNIVERSITY OF MANTOBA
FACULTY OF CRADUATE STUDIES
COPYRIGHT PERMISSION
A Thesis/Practicum submitted to the Faculty of Graduate Studies of the University of Manitoba in partial fulfilment of the rquirements for the degree of
Permission bas been granted to the LIBRARY OF THE UNZYERSITY OF MANITOBA to lend or seIl copies of this tbesis/practicum, to the NATIONAL LTSRARY OF CAN..U)A to microfilm this thesis/practicun~ and to fend or seIl copies of the film, and to UNlVFRSITY MICROFILIMS INC. to publish an abstract of this thtsis/practicum..
This reproduction or copy of this thesis bas been made available by authority of the copyright owner solely for the purpose of private study and research, and may only be reproduced and copieà as permitteci by copyright lam or with express written authorization from the copyright owner.

In the name of God, the Beneficent, the Mercifui

Because of the rspid development of hardware and soAware during the past
decade, it is now possible to use an analyticai-empiricai (or mechanistic) method of
stnicturai pavement evaluation on a routine basis. One reeson for using thû approacb is
the increased need for pavement maintenance and rehabilitation. To make the nght choice
fiom many potentially feasible maintenance and rehabilitation masures, the engineer must
base his decision on a rationai evaluation of the mechanical properties of the materials in
the existing pavement structure.
One of the parameters h terms of pavement response are the deflections; these
are of interest to this particular study. The Faihg Weight Deflectometer m) has been
developed specificaiiy for the purpose of obtainiag defieetion measurements in order to
detennine the in-situ elastic moduli. The profile of the ddection at the surface of the
pavement is known as the defieaion basin, because it resembles a bowl-shapeû depression.
The magnitude of the deflections and the basin shape are fûnctions of the number of layers
making up the pavement cross section, their tbicknesses, and th& moduii values. A
variety of muiti-layered linear elastic pavement models are avaiiable for use at this present
tirne. A general-purpose finite-element prognm called ANSYS developed by Swanson
ii

Analysis System is very powemi) and is capable of solving a layered system such as the
pavement. A finite element mode1 was developed to study the effkct of the crack on the
predicted def idon bowls. A general-purpose finiteelement program was us& in this
study due to its ability to solve this problem and because of the availabiiity of the program
A hypotheticai crack problem was assumeci and modeied in Kerent ways. The crack
depth, crack width, and distance of the crack from the loading point were among the many
parameters that were investigated. Considering the shape of the def idon basin, t is very
important to study the effect of the crack on this bowl when and when the cracks can be
ignored, and when they would not play a significant effkct. This study also addresses the
importance of the field data and how the observed deflection basins compare with the
predicted ones especially in aged pavements. This study has concluded that the location of
a crack from the loading point is very si@cant to the deflection basin.
iii

Dedicated to my Father, my Mother, my Wfe and my Children

1 would ike to express my gratitude, in parti&, to Proféssar AM.
Laasdown who made tbis research possible. 1 am ais0 grata to Professor Anahiro
Sule Alfa of the Department of Iadustriai and Mechaaical Engineering and Professor
Alan Clayton for th& moral support and advice throughout the program 1 wouid WEe
to thank the Committee members; Professor A H. Soliman, Dr. Kris Dick, Professor
L. Domaschuck and Professor A Hawalashka for their valuabte assistance. 1 am also
very grateful to Dr. Gani Ganapathy for bis help and assistance.
1 ais0 ackiowledge the assistance of the Altateh University, Tripoli Libya for
the support 1 received tbrough a scholarship fiom 1989 und 1996, and the assistance
of the University of Manitoba in granting me a teacbing aSSiStantship through my
period of study. A h , 1 would k e to acknowledge my gratitute for the Pouader
Scholanhip. My special thanks go to the Manitoba Department of Highways and
Transportation for the help that they provided to me.
1 am sincerely gratefùi and indebted to my d e , Fatma, and children, Bade,
Ayah, Abdulrahman, and Asma for their moral and spiriaial support, endurance and
encouragement, despite the long sepadon needed to make dis work possible.
I am also very t b d to my mother for her blessïngs and prayers duriag my
long absence âom home. To my Wer, m y Allah reward bim for mry thing that he
bas done for me during my absence firom home al these years.

Finally, I wish to acknowledge the support and encouragement of my fàmiiy,
especiaiiy my brothers and sisters, for the moral support that they extended during
these long yean. Thanks also to my tnends, w d whishers and coiieagues dunng the
course of this reseatch

Pages
ABSTRACT ACKNOWLEDGEMENT TABLE OF CONTENTS LIST OF FIGURES LIST OF TABLES LIST OF NOTATIONS AND SYMBOLS
INTRODUCTION
Hestoretical Prespective 1 - 1 .1 General Background
Scope of the Thesis Objective of the Study Study Hypothesis Methodology of Study Purpose snd Organiation of Thesis
LITERATURE REVIEW: UNCRACKED PAVEMENTS 10
Uncracked Layered Fiexible Pavements (Haif Space Model, 1 885) Burmister Mode1 (1 943- 1 945) Computer Methods Fite-Element Soiutions Evaluatioa of Pavement M0duI.i Pavement Design and Maaagement
vii

LITERATURE REVIEW: CRACKED PAVEMENTS
Cracked Pavements Crack Stages la Fiexible Pavements Aspbait Concrete Distresses 3.3.1 Fatigue Cracking 3 -3.2 Permanent Monnation and Rutting 3.3.3 Thermal Cracking A Summary of Basic Points in the Cracked-Pavement Model
ANALYSIS OF DEFLECTION DATA: BASIS OF THE MODEL
Field Data General Analysis of Deflection Data Features of the ANSY S 4.3.1 General 4.3.2 Basic Theonticai Cocepts in ANSYS 4.3.3 Element Library 4.3 -4 Pavement Stmcture Representation 4.3 -5 Optimization Module Geomee of the Pavement AnaIyzed 4.4.1 Horizontal Direction 4.4.2 Vertical Direction 4.4.3 B o u n w Condition 4.4.4 Loads Parameüic Coding for Problern Definition in ANSYS Defined by the User Layered Pavement System Methodology of Analysis 4.7.1 Use of the Deflection Bowl in Back-Calculating Layer Moduli 4.7.2 The Proposed Model
DEFLECTION CHARACTERISTICS: RESULTS OF ANSYS
General Discussion of Ddection Bowls Characterization of the Deflection Basin Uncracked Pavements Analysis 5.3.1 One Layer Model
viii

5 -3 -2 Two-Layer Model 5 -3 -3 Three-Layer Model
5.3.3.1 Top-Layer of Medium Sti&ess 5 -3 -3 -2 Top-Layer of High Sti5ess
5 -3 -4 Four-Layer Model 5.3.5 Effect of Radius to &ter Bounâary of Cylindnd Model Pavement With ûpen Cracks 5.4.1 ûeneral Assumptions 5.4.2 Relation Between Deflection Bowl aad Crack Location 5.4.3 Relation Between Deflection Bowl and Crack Width 5.4.4 ReIation Between Deflection Bowl and Crack Deph 5 -4.5 EEéct of Double Cracks Pavement with Closed cracks
DISCUSSION OF RESULTS
General Fiding Obtained k g Testing and Verification of Model 6.2.1 Uncracked Pavements 6.2.2 Effect of the Section Analyzed 6.2.3 Cracked Pavements
6.2.3.1 Deflection as a Function of Distance fiom the h a d 6.2.3 -2 Deflection as a Fundon Crack Width 6.2.3 -3 Ddection as a Function of Crack Depth 6.2.3.4 Defiection as a Function of Aggregate Interlock
CORRELATION WITH FIELD DATA
Introduction Results and Analysis Discussion of Resuits
CONCLUSIONS, RECOMMENDATIONS AND SUGGESTIONS FOR FUTURE RESEARCH
General Conciusions Recommendations Suggestion for Future Research

REFRENCES
APPENDIX i
APPENDIX II
APPENDIX III
APPENDIX N
Theoretid Background of ANSYS Pmgram for a tivtdmensional Isoparametrk Soiid Eiement (stiff 42) 244
Mode1 Formulation By ANSYS 26 1
Finite-Element Meshes Generated By ANSYS Progr~m 280
(a) Tables of tbeoreticaiiy PWcted Data Generated by ANSY S 29 1
(b) Some Selected Field Data Gathered from Westren Manitoba 317

LIST . .. . OF FIGURES . . .
Figure 2.1
Figure 2.2
Figure 2.3
Figure 3.1
Figure 3.2
Figure 3.3
Figure 3.4
Figure 3.5
Figure 3.6
Figure 4.1
Figure 4.2
Figure 4.3
Figure 4.4
Figure 4.5
Figure 4.6
Figure 4.7A
Tide Page
Theoretical Cornparison of the Vertical Stress Distributions in a Uniform Material and Two-layer System 18
Resiiient Modulus Tests 25
Primary Structural Responses that Control Pavement Performance 26
Evolution of Cracking
Independent Modes of Crack Development
Non-linear Viscoelastic representation for Asphalt Concrete
The Prediction of Fracture Temperature for a Restrained Strip of Asphalt Concrete
Stress-temperature Relationship in Thermal Stress Restrained S pecimen
Conceptual Response of Flexible Pavement Materials Load
Deflection Bowl Profiles -with and without Anomalies
Overd ANSYS Program and Some of Its Capabilities
Major Tasks in Each of the Subprocesses in ANSYS
Flow Chart Showing Genaralised Procedures in ANSYS
Flow Cart of Generalised Static Analysis in ANSYS
Flow Chart Showing Genaraiised Linear Transient Dynamic Analysis in ANSYS
Partial List of Element Library in GNSYS

Figure 4.7B Partial List of Solid (3-D) in ANSYS Elernent Library
Figure 4.8 DifEerent Types of Plasticity Handled by ANSYS
Figure 4.9 Concept of Optimization in ANSYS
Figun 4.10A 3-Layer Model Uncracked Pavement Laid Out by ANSY S
Figure 4.10B 3-Layer Model Cracked Pavement Laid Out by ANSYS
Figure S. 1
Figure 5.2
Figure 5.3
Figure 5.4
Figure 5.5
Figure 5.6
Figure 5.7
Figure 5.8
Figure 5.9
Figure 5.10
Figure 5.1 I
Figure 5.12
Figure 5.13
Figure 5.14
Figure 5.15
Qualitative Interpretation of Defiection Basin Shape
Diagram of Mdtiiayer Structure
Deflection Basin Geometry
Shape of Deflection Bowl Using Chevron N-Layer
Criteria to Meanire Pavement Response
Illustration of the "mea" Concept
Contributions of Different Layers to the Shape of the Deflection Basin
Deflection Basin: One-Layer Model
Deflection Basin: Two-Layer Model
Defiection Basin: Three-Layer (Top Layer of 1 O00 MPa)
Deflection Basin: Three-Layer Model (Top Layer of 6000 MPa) 1 3 1
Deflection Basin: Four-Layer Model (Second Layer of 10000 MPa) 133
Deflection Basin Cornparison: Narrow Cylinder of 3 m; Medium Cylinder of 7.5 m and Long Section of 15 m (Top Layer of 1 O00 Mpa)
Deflection Basin Comparison: Narrow Cylinder of 3 m; Medium Cylinder of 7.5 m and Long Sectio of 15 m (Top Layer of 6000 Mpa)
Deflection Basin for a Crack of 10 mm at 200 mm
135
136
139
x i i

Figure 5.16
Figure 5.1 7
Figure 5.18
Figure 5.19
Figure 5.20
Figure 5.21
Figure 5.22
Figure 5.23
Figure 5.24
Figure 5.25
Figure 5.26
Figure 5.27
Figure 5.2%
Figure 5.29
Figure 5.30
Figure 5.31
Figure 5.32
Figure 5.33
Figure 5.34
Figure 5.35
Figure 5.36
Figure 5.37
Deflection Basin Around the Crack of 10 mm at 200 mm 139
Deflection Basin for a Crack of 10 mm at 550 mm 141
Deflection Basin Around the Crack of 10 mm at 550 mm 141
Deflection Basin for a Crack of 10 mm at 950 mm 142
Deflection Basin Around the Crack of IO mm at 950 mm 142
Deflection Basin for a Crack of 1 O mm at 1500 mm 143
Deflection Basin Around the Crack of 10 mm at 1500 mm 143
Deflection Basin for a Crack of 15 mm at 200 mm 146
Deflectioa Basin Around the Crack of 15 mm at 200 mm 146
Deflection Basin for a Crack of 25 mm at 200 mm 147
Deflection Basin Around the Crack of 25 mm at 200 mm 147
Deflection Basin for a Crack of 15 mm at 550 mm 148
Deflection Basin Around the Crack of 15 mm at 550 mm 148
Deflection Basin for a Crack of 25 mm at 550 mm 149
Deflection Basin Around the Crack of 25 mm at 550 mm 149
Deflection Basin for a Crack of 15 mm at 950 mm 150
Deflection Basin Around the Crack of 15 mm at 950 mm 150
Deflection Basin for a Crack of 25 mm at 950 mm 151
Deflection Basin for a Crack of 15 mm at 1500 mm 152
Deflection Basin for a Crack of 25 mm at 1500 mm 153
Deflection Basin for a Crack of 10 mm at d/2 at 200 mm 155
Deflection Basin Around the Crack of 10 mm at d/2 at 200 mm 155
xiii

Figure 5.38
Figure 5.39
Figure 5.40
Figure 5.41
Figure 5.42
Figure 5.43
Figure 5.44
Figure 5.45
Figure 5.46
Figure 5.47
Figure 5.48
Figure 5.49
Figure 5.50
Figure 5.51
Figure 5.52
Figure 5.53
Figure 5.54
Figure 5.55
Figure 5.56
Figure 5.57
Figure 6.1
Deflection Basin Double Cracks of 10 mm at 200 mm and 550 mm 157
Deflection Basin Around Crack I of 10 mm at 200 mm 158
Deflection Basin Around the Crack II of 10 mm at 550 fiom Crack 1 159
Concept of Load Tramfer 161
Aggregate Interlock (spring element) for closed crack at 200 mm 162
Deflection Basin of a Closed Crack of 1 mm at 200 mm
Deflection Basin of a Closed Crack of 2 mm at 200 mm
Deflection Basin of a Closed Crack of 5 mm at 200 mm
Deflection Basin of a Closed Crack of 10 mm at 200 mm
Deflection Basin of a Closed Crack of 15 mm at 200 a m
Deflection Basin of a Closed Crack of 25 mm at 200 mm
Deflection Basin of a Closed Crack of 50 mm at 200 mm
Deflection Basin of a Closed Crack of 1 mm at 200 mm
Deflection Basin of a Closed Crack of 2 mm at 200 mm
Deflection Basin of a Closed Crack of 5 mm at 200 mm
Deflection Basin of a Closed Crack of 10 mm at 200 mm
Deflection Basin of a Closed Crack of 15 mm at 200 mm
Deflection Basin of a Closed Crack of 25 mm at 200 mm
Deflection Basin of a Closed Crack of 50 mm at 200 mm
Relatiocship between Crack width and Load Transfer Efficiency (spring element)
Deflection Basin Cornparison on One Layer and Two Layers (no crack)
1 64
165
166
167
168
169
170
171
172
173
174
175
176
177
178
182
xiv

Figure 6.2
Figure 6.3
Figure 6.4
Figure 6.5
Figure 6.6
Figure 6.7
Figure 6.8
Figure 6.9
Figure 6.10
Figure 6.1 1
Figure 7.1
Figure 7.2
Figure 7.3
Figure 7.4
Figure 7.5
Figure 7.6
Deflection Basin Comparison between Two Layers and Tbree Layers (no crack) 184
Deflection Basin Comparison between Three-Layer Systern with 1 O00 and 6000 Mpa Stifniess Top-Layer 185
Deflection Basin Cornparison between Three Layers (Top Layer Stifhess 1000 MPa) and Four (second Layer Stitniess 10000 Mpa) 186
Deflection Basin Cornparison between Thee Layers and Four Layers Stiffiiess 6000 MPa.and 10000 Mpa Respectively 188
Deflection Basins Cornparison of al1 Cases 189
Deflection Basins Comparison of al1 Three-Layer Short Section 19 1
Deflection Basins Comparison of al1 Three-Layer Medium Section 19 1
Deflection Basins Comparison of 10, 15 and 25 mm Cracks at 200 mm 195
Deflection Basins Comparison of 10, 15 and 25 mm Cracks at 550 mm 196
Relationship between Crack width and Load Transfer Efficiency
(spring element) 200
Deflection Profile for Portage La Prairie 204
Deflection Basin for Two stations 0.0 and 477 206
Effect of Crack Location of Deflection Bowl 207
Deflection Basin for Location 1 and 2 for PTH #1 208
Cornparison of Deflection Basins for Location 3 and 4 210
Cornparisons between Deflection Bowls for Locations 5,6, 7 and 8 21 1
Figure 7.7 A Crack Correction Curve 213

Tide Page
Table 5.1 Matnial properties and Dimensions of the Pavement Structure 125
Table 5.2 The Effect of Crack Width on the Deflection Bowl 145
Table 7.1 Data Used in Dweloping the Crack Comection Curve 215

A AASHO AASHTO
a B BB BCI Basin Bowl b C CBR D Di da/dn E e Eav E, Ei Er
F F w Fei
Fm Fth
FWD G Hl hi hl4
JO
K LTE
Constant of integration American Association of State Highway Officials American Association of State Highway and Transportation Officials Radius of the loaded area Constant of integration Benkelman Beam Base curvature index Deflection shape Deflection shape Regression parameter Constant of integration California Bearing Ratio Constant of integration Deflection at sensor 1 Incremental increase in crack length per loading cycle Young's modulus Exponential function Average modulus Equivalent modulus Modulus of ith layer The modulus of subgrade Stress fiinction Applied mode1 force vector Applied element elastic vector Applied element body force vector Applied element thermal vector Falling Weight Defiectometer S hear moduIus Thickness of asphalt concrete layer Thickness of ith layer Thickness of sublayer of asphalt-bound layer with thickness hi, Bessel fiinction of order O Stress intencity factor Load transfer efficieny

Constant of Integration Resilient modulus Number of load application to failure 1 The number of repaitions to failure The number of ailowable t r a c applications to failure at main level 1 The number of actual t r a c load applications at strain level 1 Load intensity Load per unit area Radial distance fiom the load Spreadability Surface curvature index Mix e e s s Temperature Loaded deflection Unloaded deflection Volume of air Volume of asphalt Total dissipated energy to fatigue failure Measured deflection under the load axis Deflection at the edge of the loaded area Depth from the the surface of the pavement Coefficient of thermal contraction Temperature interval
Permanent deformation in the aspldi-bound layer
Elastic destortion energy Dissipated distortion energy intensity
Surface deflection Stress amplitude
Normal stress component in the radial direction
Normal stress cornponent in the circomferential direction
Shear stress in r-z plane
Average vertical stress in layer h i i
T h e d stress Strain amplitude
Recoverable deformation 1 original deformation
Tensile strain
Poisson's ratio Phase lag between stress and strain Curvature under load axis

= The Laplace operator

INTRODUCTION
1.1 HISTORICAL PRESPECTIVE
1.1.1 Gend Background
In the late 1800's the &st paved highways were built to accommodate the new
automobile em Since that time the construction of roads has been increasing and construction
methods improving. With rapid growth in the automobile t d i c and the dweiopmmt of
modem civilkation, the need for stronger, longer-lasting and ali-weather pavements has
become a priority. But despite advancements in pavement eagiocaiag, there stiii exists a gap in
understanding which needs to be examinecl through the measurements of the mechanid
material properties of pavements.
Since the eady 19Ws many empirid pavement design methods have ken deveioped.
M o d e h g of highway and a i p r t pavements has been a di8icult ta& since the begianuig of road

building. These diiliculties appear due to the complexity of the pavement system. A pavement
has many variables such as thickness, type of materiais, environment, and tranic.
Most attention has ôeen given to mat* technology and construction techniques and
much less was given to materid properties and th& behaviour. When soi1 rnechanics became a
discipline in Civil Eagineaing, its impact on pavements emaged very rapidiy. Tazagbi was
the first one to introduce the concept of subgrade moduhis and haw to measure it. He
introduced the plate load test for the 6rst time to pavement studies. Given the load ( t d i c ) and
measurement of the defieztion under these loack, the carrying capacity of a pavement could be
detexmined.
Many soi1 tests were developed, such as the California Bearing Ratio (CBR), the
triaxial test, and the uncohed compression test. The triaxial test was not succPssful in
pavements due to the major Merences between the pavements and the foundations
woder( 1 97511.
Several theoretical developrnemts foiiowed in different parts of the world. In Europe,
for flexible pavements, Shell adopted BUfmiSteis theortical work to mode1 and analyze the
pavement as an elastic layered system invoIving stress and strain In North Awnca (USA), a
comprehensive set of W-scale road tests were launched. The herican Association of State
Highway Ofncials ( W H O ) introduced its first guide in 1972 which was revised in 1986 and
again in 1993.
A geaerai conchsion cm be extracted fiom these two agencies: the trend in pavement
engineering was eitùer a mechanistic or an -cal method. Thanks to new technology that

was developed in the computational and storage areas, powcrtiil dyt icaî techniques, such as
finite-element methods, were devdoped.
The mechaaistic approach involves the detemiiaation of material parameters for the
analysis, at condaions as close as possiie to what tûey are in the road structure. It is genaally
accepted that pavements are best modded as a layned system, consisting of layen of various
materia(s (concrete, asphalt, graaular base, subbase ..eic.) restiqg on the naturai subgrade. The
behaviour of such a system can be analyzed u s i . the chsicai theory of elasticity purmister
(194311. This elastic tbeory was developed for continuous media, but pavement engineers
recognized vny clearly tbat the materials used in construction of pavements do not form a
continuum, but rather a series of partidate layered materials
Modelhg the uncfacked pavement as a layered system, the following assumptioas are
usuaily made:
1. Each layer is linearly elsstic, isoaopic, and homogenous;
2. Each layer (ex- the subgrade) is fiaite in thiclwss and *te in the horizontal
plane;
3. The subgrade is a semi-infinite haifspace;
4. The loads are apptied on top of the uppa layer,
5. There are no shear forces acting directiy on the loaded surfàce;
6. There is paf& contact betweai the layers at their iatafjices.
Because of assUmpton (1), the constitutive relatiomhip for such materials inwlves
only two, three or four variables such as E, v, G, or K. (elastic constants: the modulus of
elasticity (E) and the poisson's ratio (v), or buik modulus (K) and the &car moduhis (G). While

some authon mrnaschuck and Wade, (1969); Naylor, (1978); Pappin and Brown, (1980);
Bowles, (198811 fiel that K and G are prefkrabte to E and v to charaterize eoith mat*, it is
customary to use E and v in ali geotechnical and pavement engiueerbg computations. Because
of the transiait or repethive nature of loading in pavement engineering, the elastic moduhis
can be replaced by the resilient moduhis @&). The rrglient modulus U d&ed as the
recoverable stmb divided by stress. Due to the nature of 10- (cydic); the variation in
tenipaahins; and the age efkct; cracks start to appear which make the asmmption of a
continous pavemmt no longer valid. Cracks in flexible pavements are a general problem facing
pavement engineers and transportation agencies in al1 parts of the world. Nowadays, data are
wllected using nondestructive testing (MIT). One instrument of interest is the Falling Weight
Mectometer (FWD) which is used srtensively around the world and by the Strategic
Highway Research Program (SHRP). However, a great deal of infiormation is missing, and
needs to be collected, to make compaisons between the r d t s of theoreticai models and the
measured data. In this thesis a study of cracks is made, in terms of crack location fkom the load
and crack parameters, such as crack width, crack depth, etc. ushg a general-purpose finite-
element program.
1.2 Scope of the thesis
This study investigates the &kt of the existence of a crack on the ddectiotl basin and
how sensitive the ddection bowl is to the presence of cracks. This study is a vital one hie to

the absence of crack studies in disausuig the &ect of the crack on the ddection bowl
generated by FWD data in flexible pavements, and uses a gaieral-purpose finite-elexnent
program and FWD data The data curraitiy g a t h d by MI) do not reveal whether thre are
cracks in the vicinities of the sensors. The data do not indicate how fiu the cracks are iiom
these senson. The data ah do not give any informafion about the size of these cracks (aich as
the depth and width of the crack). Therefbe, in back-calculation worlg it is assumeci fiom the
data gathered that there are no cracks. But the FWD operator does wt pay attention to
cracks, and thdore the operator may put the sensors over or very near a crack If the auaiyst
were to know about the cracks and th& locations, the d t s would be Mirent and more
useful to the pavement engin-.
Many relevant cornputer aigoritlmis are presently available. However, many of these
programs include some feanires which meet the requirernents of the parti& problem being
investigated, but m o t easüy be genaallled or changed to indude other requkements.
Therefore, a general-purpose fiaitedement program is best suited for the analysis of a
pavement system.
1.3 Objective of the Study
The objective of this thesis is to use (develop) and Mcify a fhitdemeat modelling
algorithm ushg dastic, isotropie, hombpus media fbr crackal flexible pavements.
T ' d o r e , the practical importanct of this modd is d. B a d on many past stucJies, a
static load m d is considered to be sufncient for analysis of a flexible pavement.
5

1.4 Study Hypothesis
The hypothesis of this study is related to the defiection bowl (deflection basin) and the
&kct of the crack on back-caicuiation. It is assumeci that cracks wïli have an &kt on the
shape of the defiection basin and on the methods of evahmtion of the material properties
involvecl. The Mthod thaî is used to test this hypothesis is a gead-pupose finite-element
program (ANSYS). Basic engineering mechauics are anployed by thû program
This study bas been carried out in the foilowing order:
1. An elastic hyered system of flexible pavement was asmed;
2. Open cracks (6-1 5 mm in width) were assumed in the anaiysis, and it was assumeci
tbat there was no load traasfer in these types of cracks;
3. A 600 KPa (18-kips equivalent single-axle load or ESAL) load was applied on a
plate of 300 mm diameter,
4. The position of the cracks were varied fiom very close to the load to a sigdicant
distance fiom the load;
5. A very srnall crack (1-2 mm in width) representing a tight crack with aggregate
interlock was aiso d y z e d to see the e f k t of the aggregate interlock in cartyug the
load across the crack. This type of crack was modeiled by the use of a spring element.

1.5 Methodology of the Study
The theoreticai model used in this ttiesis is based on the layered elastic system.
However, an attempt was made to consider cfacked flariie pavements. The existence of a
crack in the asphaitic layer extending to the the bottom of the base course has ban invesiigated
in this study. [Ganapathy (199411 conducteâ a study of non-cracked flexible pavements of
some airfields in western Canada. The hdiogs of his shidy suggest that there are some
defieaion bowls that bave an abrupt deviation of the observed basin Ikom the computed one.
These observations were made on aged pavement sections. Therefore, this study investigates
the efféct of cracks on defidon bowls ushg the FWD.
It is emphasiied that the model in this study is a general-pqose finite-element
program that c m solve the layered elastic system structure under the most genedzed
assumptions. The study is an analytical one and it is carrieci out in the following order:
Fint, using the ANSYS program, and material properties close to the ones in the field, the
predicùon of both displacements in the horizontal and vertical direction is determined. Second,
field data gathered by the Strategic Wghway Research Programme ( S m ) and Canadian
Strategic Highway Research Programme (C-SHRP) is analysed and pertinent graphs were
plotteci. Fiy, a amparison between the field &ts and predicted r d t s is presented in the
fom of graphs and tables that can be interpreted eady and quickly.

1.6 Purpose and Organization of Thesis
The purpose of this study is to formulate a finiteelement model to a d p e cracked
flexible pavements as an eiastic, isotropie, layered system, and to verify the model by
cornparhg the analytical soiution to actual mea~ufed ddection responses in test sections of
Manitoba roads as well as to the féw pubiished r d t s avaiiaMe in the literature.
In tams of organïzation, in Chapter Two, a literature review of un-cracked pavaaents
is presented in more detail. In this review, the assumptions, the dgorithms, applications of the
model .etc. are aiso presented.
In Chapter Three, a literature review of aacked pavements is presented in mon detail.
In this review7 the assumptions, the al go rit ha^^, applications of the model, .etc. are also
presented
In Cbapter Four, analysis of defldon data (the bask of the model) for cracked flexible
pavements as wetl as a program bassd on the finite-element technique is presented. A general-
pirpose finiteelement program cailed ANSYS [Swanson Adysis System Inc. (1993)lwas
used. The advaotages of tbis program and how it was u,d are discussed in some detail.
In Chapter Five, deflection characteristics and r d t s of ANSYS are presented in terms
of Figures and Tables7 showing that the crack bas an &ect on the ddection bowl.
In Cbapter Six, a dûaission of results, the relationship between ddection bowls and
crack location, aud the relationship between crack depth and the section analyzed are dicussed
in some detail.

In Chaper Seven, a camlation with field data is presented. A nimmary of results and
discussion of results aiso are presented.
F i y in Chapter Eight, conchidiog remarks are put fornard as are some
recommendations and suggestions for tiiture work

LITERATURE REVIE W:
UNCRACKED PAVEMENTS
2.1 Uncracked Layered Flexible Pavements
In design and d y s i s procedures, the pavement is regarded as a mdt i - layd eiastic
system. The assumptions used in this theoretical modd were described in Cbapter One.
Because of the geometry of the problem, the system can be anaiyzed as an axisymmetrical case
and the equation of equihbriwn can be written as:

where:
cr , 0 9 , r,, are the normal stress components and shear stress respectively and r, 0 and z
are the coordinates. The loads are generally expressed in the fom of Fourier series or Fouier
integrals or Hankel T r d o r m s [Gerrard (196711. The dEerence between the two loads are:
In the series case, loads are applied to periodic loading at reguiar intervals - railway loads
being an ewmple. On the other hand, the integral case appiies to finite loading such as on a
highway. The Hankel transfonn is more suitable for axi-symmetrical problems from the
computational point of Mew.
The loading is ualaiiy expressed as sine (odd) and cosine (even) fùnctions. For an axi-
symmetrical case the odd hctions result in zero loading (no shear loads) and the even
fhctions result in a net force (vertical messes).
The soiution to equations 2.1 and 2.2 is given by a stress fhction in the fonn of a
Bessel series as below [Burmister (1 943); G e m , (1 967)].

where:
O = the stress nuiaion to sat ie v @ = O;
V = the LaPiace operator,
JO = Bessel hction of order 0;
r = fadial distance fiom the load and (m, (m, 4, C, and D are constants of integration
to be determineci f?om the boundary conditions);
and Z = depth from the surfice of the pavanent.
Since there are four constants for each layer, for an n-layer system one has to evaluate
4n constants, that is two equations relate the loaâs at the d a c e ; two equations are
associated with the lower boundary at infinity; and 4(n-1) equations are formed at the n-1
boundaries. Bumister gave the sohmon for the two-layer system of isotropie material 50 years
ago pumister (194311. The solution of the anisotropic case is beyound the scope of this
study. ïhe hindamentds of the t h q of elasticity bas been presented by rnany researchers
(e-g. Ganapathy (1994)l and need not be repeated in detail in this thesis. The application of
this theory to the design of pavements has undergone three phases of evolution since the
begining of this century. ïhe following analytical models iden@ these three phases:
(1) Halfspace model (Boussinesq model);
(2) Layered elastic system (BurmiSter model );
(3) Cornputer-based system models (&te-element models).
Cieneraliy, pavements can be naalyzed either by ushg:
1. the theoreticai work which was done by Bunnister in the early 1940's; or

2. in-situ methods such as the plate load test and ddeaion testhgs such as F a h g
Weight Deflectometer (FWD) and other devices to study and generate the defiection
basin.
Evaluation of existing pavement systems is needed to assess their ment structural
capam to estimate th& remabkg ofe; and to suggest rehab'itation strategies to meet current
and fiiture , t rGc needs. The fdure of a pavement before the end of its designed life generally
r e d s f?om the loss of strength in one or more layers in the pavement structure. Identûyiag the
weakest layer involves an waluation of the pavement material properties that &eady acist.
in the next section, the application of these models to the analysis of pavements will be
briefiy discussed.
2.2 (Half-Space Model, 1885)
In analyzing stresses, strains, and deflections in ideal mas, solutions have been
prirnady derived fiom Boussinesq's equations, originaily developed for a homogenous, isotropie,
and elastic medium under to a point load at the surface. According to Boussinesq's formula, the
vertical stress at any depth below the earth's swface due to a point load at the d a c e , 0, is as
follows:

where:
r = distance radially ffom point load Q, and
z =depth
A homogenous, isotropie, linear elastic ha-space, loaded on its upper boundary either
by a single load or by a d o m load over a finite area, is assurnecl. This method is used to
d y z e pavements in the absence of a method to caldate stresses and displacements in a
layered system. The equations that cm be used to caldate the vertical stress and vertical
deformation at any depth z are given here.
where :
q = load intensity;
r = radiai distance fiom load;

a = radius of circular loading ara;
z = depth fiom the surface;
E= Young'smoduhis;
v = Poisson's ratio; and
A and H = influence fàctors.
Extensive tabular values bave been pubiisbed by Ahlvin md Uery [1962]. There are
two ways to appIy this theory:
(a) Some pavement engineers have ignored the contniution of the upper layers and treated the
road bed and the subgrade as an elastic wspace. The US Army Corps of Engineers between
1945 and 1 960 tested tiill-sale instrumented test pavements and found that the clasical theory
of h&space predicted the stress reasonably close to the measured values [Foster and Fergus
(1 949)]. From 1961-1965, Tumbull etal., Vesic etal., Sowers and Vesic, and Vesic and
Domaschuk came to the same conclusions.
@) Some other pavement engineers have considered the upper layer but have incorporated it
into computations as an equivalent layer having the same modulus as the supporthg foundation
subgrade. As a result of this, the pavement is converteci into a homogenous haif-space
satisfjmg Boussinesq's equation. Many researchers have used this approach
[Steinbremer, 1947; Palmer and Barker, 1940; Odemark, 1 949; Vesic, 1 963; Ueshita and
MeyerhofT 1 967; Bnaud, 1 979; UUidtt and Peattie, 19801.
poder aml W~tezack (197511 found equivalent single loads which were based on the
@valent layer concept. Some cornputer programs have been buih on this method. As an

example the (ELMOD) program (a back-calculabon program used for FWD deflection data)
was developed using the same concept as that used by v d t z and Stubstad (1985)J.
Generaiiy, the equivalent m&s is @en by the foiiowing equation:
where :
&= the equivaient modulus;
hi = thickness of ith layer,
E, = modulus of ith layer; and
n = an exponent ( 5: 3).
Using the Boussinesq equation, it is possible to detennine the stresses, strains, and
deflections at any point within the mas. W e the Boussinesq equations are not directly
applicable to roadway design conditions, these equations are important because they illustrate
basic concepts and the significance of the theory as a meam of stress analysis and deflections
beneath the pavement.

It is generally accepted that Bunnister was the fint to deveiop theories which were
reasonably close to the actual conditions in a flexiile road pavement. That is, he was the
pioneer in developing the solution to the layered system. Howewr, his work applied only to
two layers. He maintains the same assumptions mentioned previously. Stress and defieaion
vahes obtaiwd by Burmister's theories depend upon the elastic moduli of the different layers.
Since typical flexible pavements are n o d y composed of layers whose moduli decrease with
depth, the net effèct is that Buminer's equations predict maximum stresses and ddection less
than those obtained from the Boussinesq equation. Figure 2.1 shows the ciifference between
the layered and d o m system. The solution of Boussinesq [1885] was valid only for a single
layer, although Boussinesq provided the complete equations of messes.
Burmister's model was extended by Acum and Fox Cl95 11 for the anaiysis of three
layers. Acum and Fox also incorporated non-homogeneity in their modei. The loading was
distributeci unifody on a circular plate (300 mm in diameter). Numencal computations were
based on four parameters: the plate radius; the thickness of the two finite layers; the ratio of the
ikst layer modulus to the second layer moduhis; and the ratio between the second and the tbird
layer moduli. When the numbas of the layers ex&ed three, the evduation of the fictors
became umvieldy, and required a high-speed cornputer. Many researchen extended Burmister's
work. The most notable and probably the most useftl of these studies apart from that of Aaun
and Fox [l% 11, were those of Jones [1962]; Peanie [1962]; and Ueshita and Meyerhof
119681. Around the same t h e the Shen company developed the SheU Design Method.


Simultaneously, many cornputer programs were developed, based on finite-elernent techniques,
which wilI be discussed later. In the finite-element method, anaiysts consider the layers stress-
dependent and non-homogeneous in their eomputations and also the -ber of layers is not
restricted or iimited to a certain number, as in the back-calculation programs that are in use by
many researchers around the world.
Jones and Peattie [1962] extended the earlier work by Acum and Fox to include a
much wider range of the same parameters considered by eariier researchers. Howwer, the
Poisson's ratio was kept the sarne as before (0.5). The works of Jones and Peattie concemeci
only the stresses in the layers; no data were given for deformation or strains.
In 1968 an attempt was made by Ueshita and Meyerhof to derive deflection factors for
the three-layer sysem and they presented them in the fom of graphs and charts. Again the
Poisson's ratio was assumed to be 0.5. In the literature, no extension was made in numericd
evaluation or fùrther to Bumister's work. The Shel Design Method was in place by this
time, and many computer-based algorthms were being developed with which one could
d y z e an n-layer system.
2.4 Computer Methods
AU the models mentioned above assume isotropie, homogeneous and Iùiear-eldc
layer properties. Some can consider non-hearity because tbey are based on fir~ite-dement
techniques.

These models can be categorized hto two groups:
(1) Anaiysis models; and
(2) Distress models.
The first cornputer d y s i s mode1 was d e d BISTRO, which formed the basis of the
Shen design procedure. This program was later improved and called BISAR [Claessen etal.
(197711. BISAR could consider any number of layers. ï h e horizontal loads, variable intefice
fiction, viscodastic behaviour of asphalt, stress-strain relationship (based on M e r laboratory
data), and fatigue criteria for subgraâe and aspbalt materiai, which were modified to take imo
account field and laboratory test data, were included in BISAR. The program could
accomodate multiple wheel loads, and also consider the non-homogeneity by dividing the
layers into sublayers.
CHEVRON wchmond (1980)] and CHEVRON-N programs considered an analysis
mode1 to handle three layers, and then were modified to handle any number of layers.
ELSYMS is a multiiayered finiteslement-based analysis program developed at the University
of California, Berkeley and forms the basis of design management systems for several agencies.
Gomez-Achecar and Thornpson [1984,1986] developed ILLI-PAVE at the University
of IUinois. This is a cornplex finite-element-based program. In this program, the pavement is
considered as an axi-symmetrid solid of revohition. Non-linear material promes and the
Mohr-Coulomb failure criterion are inchideci in this program.
Dynatest Inc. (Ojai, California, USA) developed ELMOD (Evaluation of Layer Moduli
and Overlay Design, ICR(, (197711. This program is strictiy not a layered elastic algorithni.
Odemark's theory of equivaient stifkess was utiiized in this program. Then using the
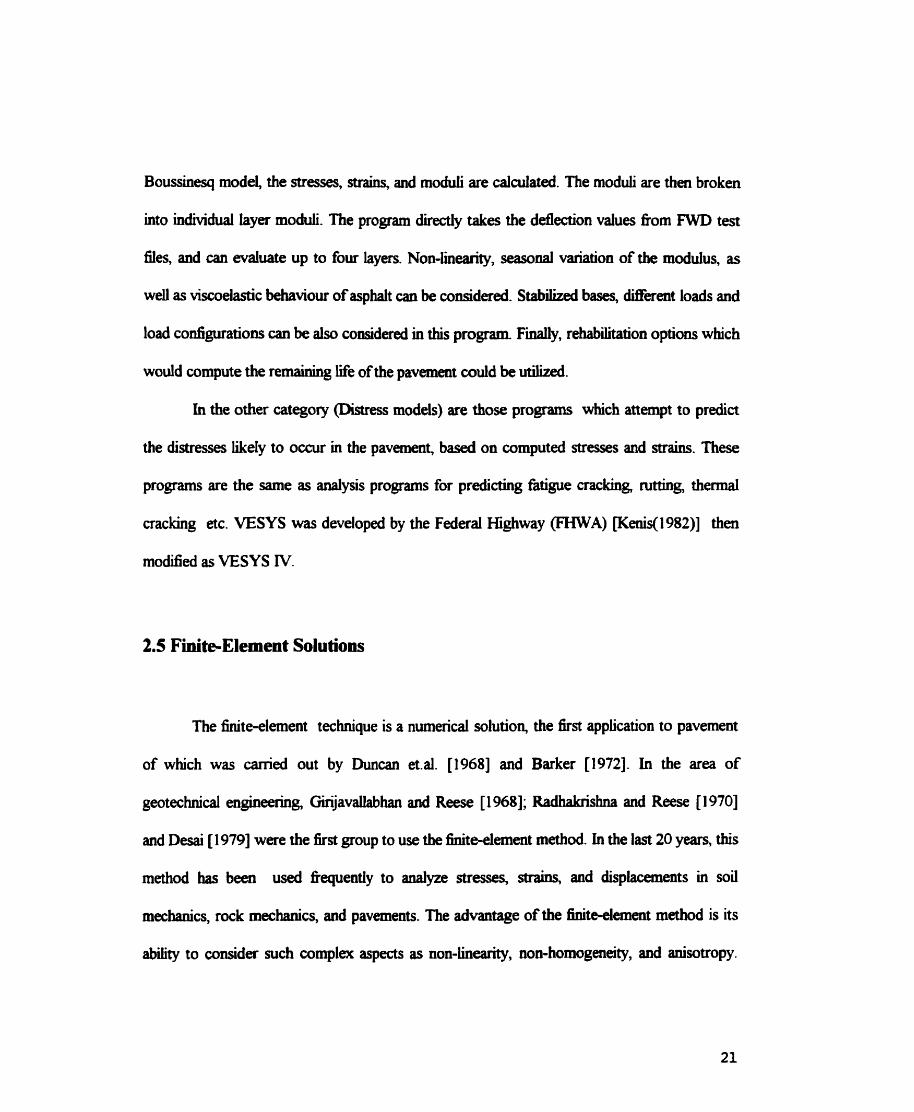
Boussinesq model the stresses, strains, and moduli are calculateci. The m o u are then broken
into individual layer moduli. The program directly takes the defieaion values fiom FWD test
files, and can evaluate up to four layers. Non-hearity, seasonai variation of the moduhis, as
weil as viscoelastic behaviour of asphalt can be considered. Stabilized bases, different loads and
load conSigurations can be also considered in this program. F i i y , rehabilitation options which
would compute the rrmaioiag He of the pavement could be utilized.
In the other categoq @istress models) are those programs which atternpt to predia
the distresses iikely to occur in the pavement, based on computed stresses and straim. These
programs are the same as analysis programs for predicting fatigue cracking, rutting, themial
cracking etc. VESY S was developed by the Federal Hïghway (FHWA) [Kenis( 1 982)] then
modifieci as VESYS IV.
2.5 FiniteElement Solutions
The finite-element technique is a numerical solution, the first application to pavement
of which was carried out by Duncan et.al. 119681 and Barker [1972]. In the ara of
geotechnical engineering, Girijavaüabhan and Reese [1968]; Radhakrishna and Reese [1970]
and Desai 119791 were the first group to use the finite-element method. in the last 20 years, this
method bas been used fiequently to analyze stresses, strains, and displacements in soi1
mechanics rock mechanics, aad pavements. The advantage of the finite-element method is its
abiity to consider such cornplex aspects as non-linearity, non-homogeneity, and anisotropy.

From the Merature, cornparhg aud reviewing these dlnerent aigorithms, it appeared that these
models are sensitive to fhctures of the pavement geometry such as thickness of the layers.
They are also sensitive to materid cbaracteristics, such as the mohili; the type of stress-main
relationship they have; and the state of stress h g testiag. 'Iae major weakness of these
programs lies in the present hadequate characterization of the mataials. This characterization
of pavement materials has been discussed by several researchers (e-g. Ganapathy [1994]) in
great detail.
In aunmaiy, the properties of pavement materials can be determineci in two different
ways:
(a) laboratoy detemination and
(b) in-situ. methods .
Laboratory investigations are useful in that the influence of many variables that are
goveming the response of the materials can be studied in isolation aML under controîied
conditions, an aspect that is veiy important to understanding the îùndamental behaviour of the
materials. On the other hand, it is vety nearly impossible to reproduce the field conditions
faiffiily in a laboratory. in pavement engineering, this later point is quite important because
the response of the structure is afF&ed by relatively short-tem changes in the field conditions.
Therefore, in-situ tests are v q usefiil tools to use.

2.6 Evaluatbn of Pavement Moduli
Highway and transportation @es have a responsiii regardhg the maintenance,
management, and rehabiitation of transportation ïthstmcture, inchidhg pavements.
Economical and reliaMe methods are required to determine the structural capacity of acïsting
pavements. Evaiuation of exhbg pavement systems is needed to assess their curent
s r n i d capacities; to estimate their remainhg iives; and to niggest rehabilitation strate& to
meet m e n t and fiiture aafnc neeâs. Non-destructive Tests (NDT) of pavements are the most
cornmon wst-effective methods for evaluating the structural adequacy of pavements. Non-
destructive testing offers the advantage of determining the pavement layer moduli through
back-calculation techniques.
The failure of a pavement before the end of its designed Me generaiiy resuhs fkom the
loss of strength in one or more layers in the pavement structure. It is neceswy to idene this
weakened layer as well as to determine the material properties of the darnaged and remahhg
layers.
Because of the repetitive nature of the bading in pavement structures, the modulus of
elasticity (E) is replaced by the resiiient modulus @&) wamlouk and Sarofim [1988]. The
resilient modulus is a fùndamental material property that is similar in concept to the modulus of
elasticity. Tbat is, resiiient moduhis is a stress-main relationship. However, it Mers from the
moddus of elasticity in that it is determineci from a repeated-load, tn;a0alampression test

(unconfineci compression is used by some hvestigaton) and is based on only the resilient (or
recoverable) portion of the straio. The resiiient modules, MR, is d h e d as:
where:
a = applied load / cross-seaion1 area of the specimen
ER = recoverable defonnation I original specimen height
The general stress-main behaviour of a soii or granular material is ihstrated in Figure
2.2. As the load is applied, the stress increases as does the strain. When the stress is reduced,
the main also diminishes but al1 of the strain is not recovered after stress is removed. The total
strain, therefore, is composed of both a permanent (or plastic) component, ( g p m ) and a
recoverable (or resilient) component, ( E R ). The plastic main is not coasidered in the resilient
moduhis. Small surface deflections are not themselves detrimental to the pavement. However,
deflection is an indicator of the factors that are detrimental. There an two major types of load-
induced flexible-pavement failure (i) fatigue cracking and (ii) nmiag. Figure 2.3 ilhistratecl the
two prime structurai parameters contributing to faihue: tende strain that develops in the
bottom of the asphalt concrete layer; and the stress or strain at the top of the subgrade Fiiiott
and Thorntom (1 98811. The resilient moduhis is a sigdicant and rational property tbat needs to
be included in the pavememt design process. Although, the resilient momilus does not represent

rriuri
( a) Typicai Umnfined S- Comprrssion Sûesstrain Cunne for
(c) Typid Load Response in the Resilient Moduius Test (aa mail. [~CMD
Figure 2.2 Resilient Moduius Tests

Surface
Base u Subgrade

al1 properties of a subgrade or grandar layer that can affect the performance of a pavement,
many pavement structural properties ge~S.!y inay k characterised in ternis of the
resilient moduhis (MR). The resiiient moduhis has becorne vny important in the
mechanistic analysis of pavemats and the associateci evaluation procedures in the past
few years ~ i i io t t and Thomtom (1988) 1.
Mechaiiiaic pavement design procedures based on elastic-layer theories require the
detennination or estimation of elastic moduli for each layer in the pavement system. The elastic
modulus for the asphaltic concrete layer is fiequentiy estimated on the basis of split teasile test
data, whiie the moduli of granular base course and the soi1 subgrade are detemùned fiom
repeated-load triaxid tests m m m et-ai. (1990)J. Under repeated load tests, it is observed that
as the nurnber of loading cycles hcreases, the energy dissipated during a given loading cycle
decreases. This is evidenced by a decrease in stress-main hysteresis, and is accompanied by an
increase in the secant modulus. Mer a nurnber of loading cycles, the modulus becomes nearly
constant, and the response can be assumed to be approximately elastic. This steady value of
modulus is dehed as the resilient modules for pavement purposes, and is asnimed to have
been attained with 200 cycles or more of loading [Dnunm et. al. 19901.
The technology for characterisiing asphaltic materials has been developed largely on an
ernpirical basis, which has resuited in index-type values. Empirical methods of characterisation
are usefid for cornparison of material under specific conditions. Howwer, empuicai
correlations are valid only for conditions Smilar to those under which the values were originaily
developed. Further, empirid methods of characterization do not provide the information that
is needed for fundamentai, or theory-based, structural analysis of pavements. Given the

continuhg inmease in truck weights, tire pressures' and t d i c voiumes and the rapid
deterioration of national highway systems, a more rational philosophy of asphait concrete
characterisation is needed for optimal pavement design ~ a m l o u k and Sa roh (1 98811.
Several test procedures and theories for determiring the moduli of asphalt mixtures are
available in the üterature. Among these moduli are Young's moduius, resilient moddus,
complex moddus, dyoamic moduhis, and modulus obtained fiom Shen nomographs.
According to Brown and Barksdale [1987] the term "modulus" has been lwseiy used in the
literature on pavement, and the term "elastic sti£bess" has been recomrnended. In addition,
ciifferences in test conditions, such as load fiequency' magnitude, and duration and equipment
type, may result in Merent values for the sarne modulus and for the same material.
Pavement engineers continudy face the problem of characterizhg material properties
of existing in-senice-pavemmts. Material characterization is needed to:
(a) determine whether a pavement structure is adequate to accommodate an anticipated change
in mission (trac), (b) provide input for overlay design when the pavement is reaching its finai
se~ceability, and (c) develop rehabilitative recommendations and optional maintenance
strategies based on routine structural evaluation. There is general agreement among pavement
engineers and researchers that the measured Surface defiection basin provides valuable
Iliformation for the structurai evaluation of pavements. To interpret airface deflection
measwements, the a d pavement structure and its subgrade must be replaced by a
mechaaistic pavement model. The structural waluation of a pavement is, to an extent, an
inverted design process. If the cross-section and properties of the paving materials and support
systern are known, it is possible to compute the pavement respome (stresses, mains, and
displacement) for given loading conditions. In the evaiuation process, the response of the
pavement is measured, and the material properties are back-calculated. The same concem
arercised in laboratory procedures to simulate the repetitbe nature and magnitude of trdic
loediogs during sample testing applies to fidi-de testing of pavements. [Hofûnan and
Thompson (1 982) 1.
Evahntion may take place by either destructive or non-destnictive t e h g methods.
Performance destructive testhg involves field and laboratory tests which lead to damage to
the pavement, and to the delaying of trafEc. It is very dficuit to simulate the exact state
of stresses in the field. On the other han4 non-destructive testing involves loading a pavement
structure to a specified kwwn level which does not exceed the pavement bearing-capacity,
and the meaniring of the d a c e response (surface deflection), either by the Benkelman Beam
(BB) or by the Falling Weight Deflectometer (FWD). The deflection data obtained non-
destructively are used in analysis, and the material moduli are then backdculated. The
Benkelman Beam measures a rebound deflection in a quasi-static manner, whereas the FWD
measures dynaaiically a deflection basin by using an array of defiection sensors. The FWD also
provides information on the shape of the forcing pulse, which tends to sirnulate moving loads,
and is also able to s i d a t e varying loads. The advantage of using the FWD in pavement testing
is its ability to obtah defldons compatible with those mea~uced under trafiic loads at n o d
speeds.
A quick and reliable tool that parnits the evahiation of pavements in order to determine
exisiiag structurai conditions is needed in orcier to produce meanjllgfbi resihs with minimum
trafbc interfaence. In response to this a@ severai NDT equipment and back-caidation

procedures have been developed and are currently in use throughout the world. Back-
caldation procedures are simply the inverteci process of design procedures. They c m be
p d o d by using the surfafe ddection basin that is generated by FWD as an input, and then
determiniag the moduhis of each kyer in the system.
Nondestructive testing has been in use for many years. In the past twenty y-,
various types of equipment, testing procedures, and cornputer algorithms for applyhg test
resuhs to pavement structural evahiation and back-caldation of layer moduli, have been
developed [Ganapathy (1 994) 1. Providing a quantitative basis for evaluating the pavement-
structure condition at any stage of its Me, is one of the main objectives of NDf of flexible
pavements.
2.7 Pavement Design and Management
Pavement engineering rnay be defineci as the process of designing, constructbg, and
maintainhg pavement, in order to provide a desired level of senice for trafnc. In the design
stage of pavement development, engineers make a number of assumptions about construction
methods and the level of maintenance tbat the pavweat wi l receive.
FiexMe pavements were, and still are, classified as a pavement structure having a
relatively thin asphalt wearing course, with layers of granular base and sub-base behg used to
protect the subgrade fiom behg overstressed. This type of pavement design is primarily based
upoa empiricisn or eXpenence, with theory piaying only a subordhate role in the procedure.

However, the ment design and construction changes brought about primarily by heavier
wheel-loads, higher infl ic levels, and the recognition of various independent distress modes
contributing to pavement fdure (such as rutting, shoving, and cracking) have led to the
introduction and increased use of stabiiised base and subbase material. The purpose of stabiliser
materiai such as aspbalt is to increase the structurai strength of the pavement by increasing
rigidity .
Roadway rehabiiitation ushg asphalt without the need for excavation of old, cracked,
and oxidised asphait pavements with water-weakened, or n o n - d o m support bases and
aibbases has often been attempted, usuaiiy with variable success. It was conduded [Johnson,
Roger (1992)l that keeping water out of the road base and sub-base is a major solution to
prevent premature road failures.
For any pavement design procedure to be completely rational in nature, total
consideration InUQ be given to three elements. These elements are: (i) the theory used to
predict the failure or distress parameter; (i) the evaluation of the pertinent material properties
necessary for the theory selected; and (iii) the determination of the relationship between the
magnitude of the parameter in question to the fdure or perfomce level desired.
nie purpose of a pavement is to carry tratnc safèly, conveniently, and economically
over its design Me, by protecting the subgrade nom the &e*s of t r a c and c h t e and
ensuring that materials used in the pavement do not d e r fkom deterioration. The pavement
surface must provide a smooth ride and adequate skid resistance. The stnictural part of the
pavement hvolves materid sections that are suitable for the above purpose. The design process
consists of two diffient phases: the detemiination of the pavement thickness layers that have

certain mechanical properties; and the determination of the composition of the materials that
wiii provide these properties. The main structural layer in the pavement is the road-base, whose
purpose is to W b u t e M c loads so that stresses and strains developed by them in the
subgrade and subbase are within the capacity of the materials in these layers.
Asphalt pavements have beai designed and consfnicted to provide an initial savice life
of beh~een 1 5 and 20 years [Gwvais et .al (1 99211. However, thïs design objective is rarely met,
largely because of more M c , heavier axle loads, materiai problems, higher tire pressures and
extreme environmental conditions. These factors usually result in two major modes of distress:
d a c e ruhg and cracking which, 8 allowed to progress too far, wiil require major
rebabilitation or complete reconstruction Research work over the past severai decades had led
to rnany recommended solutions. New asphalt mixes, use of larger crushed aggregates, textile
sheets, thicker asphait layers, polymer modifications, and reinforcement of various types have
been tried in the field to minimise rutting or pavement cracking.
In asphalt pavements, the term "reinforcement" g e n d y means the inclusion of certain
materials with some desired properties within other materials which lack these properties.
Within the entire pavement structure, the asphait concrete layer rezeives mon of the load and
nodoad induced tensile stresses. However, it is weil known that asphait concrete lacks the
abiîity to resist such tensile stresses which makes it an ideal medium for which reinforcement
can be considered. If reinforcement is to be considered, two basic features need to be
established [ Haas (1 984, 1989) 1:

(1) Intendeci fiiaction of the reinforcement - one or more of: (a) reducing rutting; or @)
reducing cracking (fàtigue or reflechon); or (c) reducing layer thickness (asphait, base,
subbase); or (d) extending pavement Me and / or reducing maintenance.
(2) Reinforcement aitematives: (a) types and possible locaîions in the pavement structure and
(b) major variables (pavement layer and remforcement properties, tratnc loads and volume,
etc.). The strength mobilised by the interlock operathg mechanism can still be provided wen
after the peak stress are reached (Le., even &er cracks dewelop).
The design methods avdable for highway pavement work are:
(1) Empirical and semi-empirical procedures based on past experience which may include
laboratory or field tests of the subgrade pavement materiais (eg. the California Bearing Ratio
method); or
(2) Analytml or theoreticai methods.
A stnictural pavement design procedure based on elastic theory rnay be divided h o
the foilowing five main seps w d t z (1 977) ] :
( 1 ) definition of failure condition;
(2) determination of load'ig and climatic conditions;
(3) determination of elastic parameters;
(4) determination of allowable stresses and saaias; and
(5) caldation of critical stresses and straios.
The composition and pavement tbickness are selected so that the stress, strain, and
deformations produad by design M c loadmg do not ovedoad the capabilities of any of the
materials in the pavement. In modeliing the pavement as a layered systern, it is assumed that

each layer is linearly elastic, isotropie, and homogenous. Thus the constitutive relatiomhip for
such materials wodd involve oniy two elastic constants; the modulus of elasticity (E) and the
Poisson's ratio ( V ) or b ~ l k moduius (k).
Pavements are considered to be the mon complicated structures of ail Civil
Engineering structures v d t z , (198711. In order to predia the fbtwe pdonnance of
pavements, some simplification mua be made. At present, the "mechanistic-empirid" method
is used. This method comprises of two steps. First, the pavement responses (in temm of critical
stresses, strains, and deformations) in each of the pavement layers are caldated. Second, the
pavement performance (measured in terms of structural and f'unctional conditions in the fùture)
is predicted, in order to determine the pavement response. The most cornmon method used
employs the theory of elasticity. A limitation of the elastic-theory approach is that, in reality,
the two key parameters (E, modulus of elasticity and V , Poisson's ratio) are not constants, but
in practice Vary as fùnctions of a variety of factors such as temperature, moisture content, and
stress conditions. In other words, pavement materials do not exhibit pure elastic behaviour or
long-term wnstancy. However, the theory of elasticity provides a very good approximation for
transient wheel loads on pavements.
In this regard, many approaches and assumptions have been developed to solve the
loading problem, such as Boussinesq's equations, Bunnister's layered system, and Odemark's
methods [Odema& (1 949) 1.
Most of these methods use overall deflection to evahiate the structurai condition of the
pavement because it is easy to measure. Pavement surfkce defiection is a reflection of the

performance of pavements but does not provide direct information about the resîdual st~~cairal
strength of the pavement Fekpe (199211. Gichaga [l982 ] observed that deflections alone are
inadequate to determine the structurai htegrity of a pavement and that a comprehensive
picaire of the structural status of a pavement can oniy be obtained when defiection
measurements are accompanied by other measmes of distress fe9aies. For example,
premature fiihire of asphaltic wncrete overlays is an indication of the inadequacies of design
andlor construction assumptions relatiog to trafiic? mataials and envirocunent conditions. And
eariy occurrences of pavement distress in asphaltic wncrete overlays, with a properly designed
mix, tend to suggest the incompati'b'ity of the design as~umptions and/or procedure and their
inadequacy for local conditions [Fekpe (199211. The defiection in tuni shouid be translated
into stresses or strains before the start of the evaluation. The simplest way of doing this is by
measuring the total deflection basin with a diicient accuracy to be able to back-caidate the
layer moduli.
In-situ or Nondestructive Testing O T ) methods use the deflection-basin data
generated 6om NDT devices to quant@ the response of the pavement structure due to a
known load. The response is then used in back-calculation procedures, determining the
pavement layer moduli. NDT have some advantages over destructive testiag methods in that
no physical darnage is done to the pavement structure, and no lab tests on physical specimetls
are needed. Hence NDT methods are vexy cost-effective.
At present? there is no direct methoà that provides or gives the pavement &situ layer
moduli 60m ddeztion measurements. Curent methods evaiuate the pavement layer moduli

fiom ddection measurements using eitber empirical approaches or layered-elastic amputer
programs with iterative soiutiom.
Nondestructive testing methods such as D y d e c t or the Falling Weight Deflectometer
provide dynamic or impulse defiection data which represait a defieaion basin in the flexible
pavement under the test load.
In order to back-caldate laya rnoduli, two conditions must be satis6ied. Fim, the
stresses in the structure under test must not be far f?om the stresses generated by the design
load. Second, ddection must be measured with a very high degree of accuracy. Both
conditions are satisfied by the m.
To faciltate good engineering decisiow conceniing maimenance strategy,
rehabilitation techniques or reconstruction, good pavement evaluation techniques are required.
Maintenance refers to both corrective measures and preventive measures which do not involve
major alterations to the exîsting pavement structure. Rehabilitation encompasses
reconstruction, recycling and overlays. To assist the engineer in deciding what to do and when,
pavement peifomiance must be measured on a systematic and continuhg basis. Performance
measures must include both fùnctional and structural aspects. Functional performance describes
how well the pavement serves the user, while structural paformance is related to its abüity to
serve the user. For bctional behaviwr, information is required on the history of the riding
quality and associated t r a c during that the . The most important phase of pavement
evaluation is the evaluation of structural performance. The major reason for measuriag
structurai performance is to anticipate when and where rehabüitation &OUM undertaken
[Clayton, Sparks (1 980) 1.

Road builders and design and site pavement engineers are often faced with d a c e
cracking in asphait layers. Existing muitilayer theones have not been able to dehe the cause of
this problem, which occurs in aü categories of roads. Therefore, a bdamental study of the
cause of cracking in asphalt pavements needs to be given pnority in pavement research.
As mentioned earlier and reported in the literature, some aged, badly cracked
pavements were investigated. In such cases there was an abrupt deviation of obsened
behaviour from that computed. For cracked pavements, the classical models can not properly
anaiyse the pavement. But a usefùl, practical mode1 should be capable of incorporating a gap
or a crack, across which oniy partial or no ioad transfer wiii exist.

LITERATURE REVIEW: CRACKED
PAVEMENTS
3.1 Cracked Pavements
Cracking is one of the major fàcts tbat causes preaiature fâïiure of asphalt cbncrete
pavements. Little research nlatiiig the ddection measunmmts to c d c s in the fidd work bas
beea done in the area of cracked flexiile pavement, thus thk study is important in bridgiag
S o m of the gaps that still cxist. This chaptcr reviews some of the studies that have kai Cameci
out in the last few decades. Most of these Jhidies bave concea$ated on ovaliy anci dective
cracking, tatha then stuâying the cracks in g d . One mây was carried out by Yeou-Sbang

crack resistaoce of asphait coocrete ovdays using a fiamue mecbanics approach, and
conchide. that :
1. When temperature is the only consideration, the temperature crack resistance wiii be
higher ifa thicker asphalt conaete overiay is applied.
2. Crack resistance to tempaahire Merentiai at lower service temperatures was found
to be Mer tban tbat at higher &ce temperatures. However, this increase is not
enough to prevent the fiequently-observed low-temperature cracking in asphait
conmete, due to lower temperature Merentials encountered at lower senice
temperattues.
3. If the tende strength of the asphaitic concrete mix is mobilized, temperature crack
resistance of asphah concrete ovedays uui be increased.
4. The mode1 provides a f&ble approach to quant@ the crack resistance in asphalt
Conmete pavement systems.
There are many studies about the process of cracking and seating. The process of
cracking and seating breaks the existjng concrete pavement slabs into d e r pieces and then
seats these pieces by rolling to achieve d o m contact between the individual slab pieces and
the base layer before replacement of the asphalt overlay. This process reduces the effdve slab
leogth, and therefore, reduces the dab's horizontal movement auised by tempemtue cbange or
moisture or both. The vertical movements of slabs are also limited because the smaii pieces of
slabs are in unifoxm and tight contact with the subbase and there exists some degree of
aggregate interlock between the slab pieces. One study carried by Jiang and Mc Daniel [1993]
used fiber to control r&ve cracking. They conchide that the usage of fibers delayed most

of the transverse cracks for about 5 years. The type of hsunmers used for cracking experimental
wncrrte slabs had a strong efFiect on pavement strength. For one example, a wbip hammer
d c t u r e d by Wolverine Technology was used. A inumba of harnmer head shapes and
blow patterns were trie4 and it was fouad that six to eight blows in a large semi-anilar pattern
produced the required transverse cracks. But it was recommended thu the whiphammer not
be used because it tends to d d o p more transverse cracks in the section than required.
Another reason not to use the w h i p - b e r was that it was time coosumiog, since it required
approximately six blows across the width of a 12-fwt (3.66-m) lane. F ' i y it did not always
produce the desireci basic crack pattern. The authors wncluded that fibers did not improve the
cracking resistance of the controlied section. The use of fibers did improve the mtting
resistance on both the control and the cracked and seated sections. Finally the increase of
overlay thickness improved pavement strength as expected. By increasing the thickness the
cost would be increased sigdcantly but the transverse cracks would not be reduced.
Amther study was done by Zaghloul and White [1993] at Purdue University using a
three-dimensional, dynamic, finite-element program for the analysis of flexible pavement. The
confinement efféct of the shoulder and the degree of continuity at the pavement/shoulder joint
were found to reduce pavement deflection. They also found that loads tbat generate messes
hi* than yield messes in the asphalt wncrete increase d g sigmficady.
Amther study was carried out by Malan &.al. [1989] to invistigate premaaire suiface
cracking in asphalt, and it conchideci the following:
1. Continousiy-graded designs are les susceptible to Sunace cracking than gap and
semi-gap-graded designs.

2. The temperature at which the asphalt is mand was not found to have a signifiant
influence on wface cracking as observeci during their experiments.
3.The viscosity of the binder used in the asphah was found to have a bighly significant
influence on the cracking response of asphaltic surfàce courses. Naturally, the response
was sensitive to the trafic volumes ushg the road.
4. Surface cracking in asphalt is aggravateci by the application of pneumatic roüing at
hi& asphait temperature (above 100°C).
A study was d e d out by Raja and Snyder [1993] to examine the f ao r s affecting
deterioration of transverse cracks in jointed reinforced concrete pavement (JRCP). They
conciuded that JRCP develops traverse cracks due to drying and thennal shrinkage, if the
concrete is resisted by fiction with the supporthg layers. Most JRCP des@ rely on
aggregate or grain interlock to achieve necessary load traasfer across these cracks. The cracks
must exhibit good long-term load-traasfer characteristics to minimize the development and
severity of various distresses. However, cracked material deteriorate with time and tra£Ec,
leading to loss of the aggregate interlock load-trader capacity. Some of the si@cant factors
that affect aggregate interlock load-trder capacity iaciude width of the crack opening and
texture of the crack face.
Several studies concaniag reflective cracking were carrieci out to iwestigate the
reflective cracking in overlay rigid pavements. Examples of such studies follow: McCullaugh
B. Frank., and Stephen B. Seeds. 119821 undertook a field study. Yuan, Kung [1967] studied
the comlation between deflection and nscking, and conchidecl that a high degree of
correlation is found between dope of the ddection basin and flexible pavement cracking. From

the results on test roads, the slope ddection can be used with a hi& degree of accuracy to
indicate pavement cracking. The only case that did not foilow the slope of deflection basin
criterion was the road coagsting of a cement-treated base. It is suspected that pavements with
a rigid or semi-rigid base course may not be able to stand as steep slopes, as can more flexible
bases.
McEIvaney [1991] studied cracking of bibimioous SUrfaciags in hi@ ambient
ternperatures. He comidered that hi@-temperature surfâce cracking is a compla problem in
bitminous rnix and layer thickwss design, for which no explicit soiution is presently available.
A group of researchers (Gemtsen et-al. [1987]) bave studied premature surface
cracking in asphaltic pavements. In several new road pavements cracking in the top layer(s) has
occurred. It was found that this type of cracking could be obsewed both inside and outside
the wheel-paths. According to mechanistic design procedures using liaear elastic multi-layer
programs, the greatest tende strains are predicted in the bottom of the asphalt layers and not at
the surface. The authors added that hear elastic multi-layer programs cannot actuaily be used
for the computation of the dissipated energy in a certain point due to transient loads. However,
approximations can be made. In an uni-axial test the (elastic) distortion energy intensity under
a static load c m be represented by (Genitsen etal. [1987]):
where:

A = (elastic) destonon energy
V = Poisson's ratio; and a, E are the stress aad strain amplitudes respectively,
at the point under investigation.
in uni-mial cyclic ôending test the disipated distortion energy per cycle can be
represented by:
where:
A F~ = Dissipated distortion energy intensity,
A o = stress amplitude;
A
E = strain amplitude; and
$ = phase lag between stress and strain.
The conclusions fiom these studies can be swamarized as follows:
1 . Deflection testing and structural analyses have show that radial inward shear forces
under tires can initiate cracking at the d a c e near the edges of the of the tires,
especiaiiy in the bound layers.
2. Use of the workstrain parameter as a Mure of fàtigue criterion can result in
otherwise unpredicted pavement life reduction.

3. Test sections that show a large extent of cracking outside the wheel-path tend to be
ianienced by strength characteristics such as low temperature. Cracking seaos to be
initiated by aafnc loads, whiie propagation is probably due to temperature variations.
4. There is a distinct relationship between the degree of elasticity of an asphalt mix a d
its relative residuai stress. The more eiastically a mix responds, the srnalia the load-
induced residua stresses are. The midies also conchided that other findings related to
the penetraon of the bitumen, the relaxation of load-induced stresses, and the
hardening of the bitumen.
Another study was Cameci out by Mamione [1989] to caldate the response of aged
flexible airfield pavements at ambient temperatures, using TWD. The study objectives were: to
determine the effècts that seasonal temperature variations had on the response of an aged
asphait concrete pavement, using field and laboratory test measurements; to determine f?om
the laboratory tests which factors influence the resilient and creep properties of bitminous
mixtures; and to dete& how to incorporate these factors into a rational method for
evaluation of flexible airfield pavements. One conclusion was that FWD data over a wide
temperature range was required to better assess the e f fdve moddi of cracked asphalt-bound
layers. Moduhis values had to be adjusted over this wide temperature range until consistent
results were achieved.
Fracture mechanics was used by Lytton and Shsuunugham 119821. Their study is
related to thermal cracking. They developed a hcture-mechanics-based mode1 that predicts
the ocçu~~ence of transverse cracking in asphait concrete pavements. Cracks are assume4 to
begin at the surfàce of the pavement and to propagate downward as temperature cycling

occurs. The rate of crack growth is based on Pais and Erdogan [1963]. An equation was
developed fiom which the oumber of temperature cycles required to crack a pavement cm be
caiulat ed. Theh finding were:
1. Mechanistic models can be improved by gMng consideration to more variables and
conditions.
2. Mechanistics models can be more r d y traasfened fkom one situation to another
situation than can the empiricai models.
Verstraaen etal. (19821 conducteci a study to develop a means of avoiding cracking
and d g . They conciuded that:
(i) Conceming the resistance to cracking by fatigue of the bituminous layers, the estimate of
loading to produce failure is increared by at least a factor of 7, over that from standard tests,
when the infiuence of rest periods between successive Ioadings met in a real trafic loadiing is
taken into consideration. This result, derived fiom laboratory tests, does not change the
principle of the structural design rnethod presented in 1977 by Verstraeten but it renders the
fatigue law more precise and thereby also the quivalent traûic to be considered in practical
applications. (ii) Concerning the resistance to rutting of bitminous mixes, the results obtained
define the pavement deformation law to be used in practical application.
(ii)The resuhs concerning both cracking and rutting were considered in setting up new design
charu, which are simple to use in practice. The goals of employhg these charts are to avoid
cracking by fatigue of the bituminous layers and of the lean conaete, and also to avoid an
excessive permanent deformation of the subgrade.

(in) Experimentaf vaifications canfirmd the vaiidity, for practicai appiications, of the modek
presented. The evoiution of crackhg was observecl in the slow lane of the roadway as a
hction of time, and the research iadicated the point in time for the initiation of cracking in the
bitumenous base. Tbe redt , prr~cned in Figure 3.1, shows that atter the imtiation of cracking
Cmdicated by the mow), the roadway remains siill d for a certain period of the .
Nevertheles, on account of the îack of knowiedge conamhg the mechvrism of crack
propagation, it is at the present time prefhable to consida, in pracfical fatigue design, the point
in time den cracking is initiated at the fatigue point.
A study was conducted by Shahin [197q titled, "Design System for Miaimizing
Asphalt Conaete Thermal Cracking. Asphalt conmete thermal cracking occurs in the fom of
transverse, longmidmaî, and block cracking. Major k o r s causing these cracks inchide:
0) very low temperature, resuiting in tende stress that aceeds mixtwe tende
strength,. and
O daily temperature cychg, resuiting in repeated tende stresses and strains that
cause asphait concrete t h d fatigue. nidore, thamal crac- ocaus not only in
a cold ciimate, but also in a climate where then is a large daily temperanire range and
high solar radiation.
Severai otha s t u b beyond the scope of this wo& conoaniog refiective
craciung and oveday pavements, have bezs cunâucted by many researchers in diffefetlf parts of
the world. But the total information on cracking in pavements, in parîicuiar relating deflection
meammmtstocracksinthefidd,isstiilvayspusc.


3.2 Crack Stages In Flexible Pavements
Cracking of a pavement structure can be divided hto two stages: crack initiation
(fatigue) and crack propagation (hcture). The reâuction of the strength of the material under
repeated loadiags compareci with the fhctue strength under a single loading is known as
fatigue. Merent methoâs are avaüable to determine the relationship between the repeated
stresses/strains and the strength of the material.[Kua~t (1 !Ml)]. Using any one of these models,
eventuaily the end of the aack initiation phase and the start of crack growth in the bituminous
base layer can be predicted.
The models used for the prediction of t e d e stresses and crack growth in surface
layers have to be modified. The trafiic loads applied to the pavement and changes in
temperature are two loads that have an effect on the pavement structure. Consequently the
interaction between these two loads and the pavement needs to be understood and modelied.
Materid properties influence these models as inputs thus they mua be included in the
modelling process.
A very weif known model for crack initiation, âom the Literature, is aven below and is
known as the phenomenological model [Shell Pavement Design Manual (198211:
where:

N = Number of load applications to faihue;
E = Strain; and
b = Regression parameters.
ûn the other han4 the method of crack propagation is a f'undamental feature for the
prediciion of the f a h e condition using crack-propagation models. In these models it is
assumed that even before the first loading, an initiai (vertical) crack exists at the boundary of
the layer. This asaimption is valid ifthe roughness of the applied material is taken into account.
These mode1s are usudiy based on the so-caleci stress-intensity factor 6) [Chang &.al.
(1 976)l. The stress-intensity factor ia iinear elastic materials is an entity that determines the
stress situation around a crack-tip. For non-hear materiai, care should be taken when using the
stress intensity factor. For simple geometries the stress intensity factor can be obtained
dyticaliy. For more complex structures and loading conditions, finiteelement programs are
required for the detennination of this factor. An empirical relationship that can quant@ the
crack propagation due to repeated loading was found paris etal. (1963)], and is discussed
below :
where:
da Idn = incremental inaease in crack leogth per loading cycle;
&n = matenai constants; and
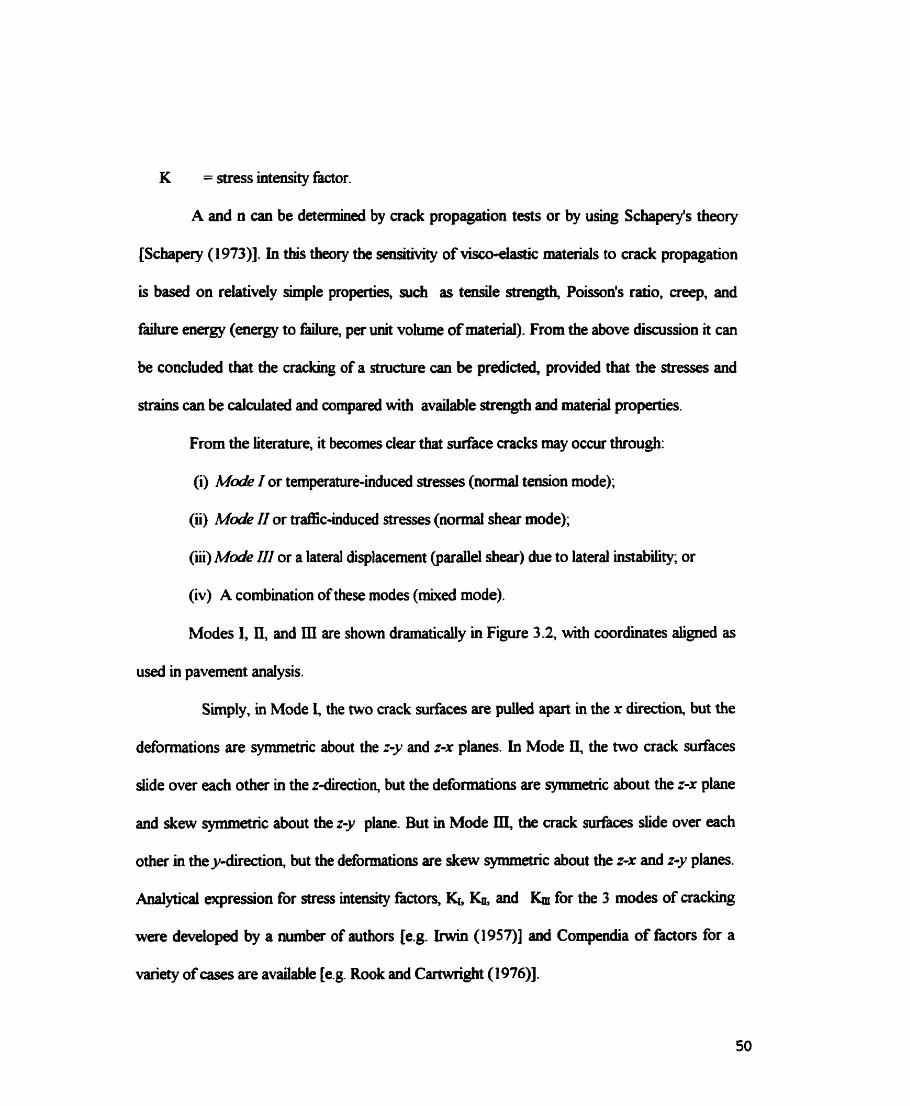
K = stress intensity factor.
A and n cm be determineci by crack propagation tests or by using Schapexy's theory
[Scbpery (1 97311. In this theoiy the msitivity of visco-elastic materials to crack propagation
is based on relatively simple properties, such as tende strength, Poisson's ratio, creep, and
fidure energy (energy to fdure, per unit volume of material). From the above disaission it can
be concluded that the cracking of a structure cm be predicted, provided that the stresses and
strains can be calculateci and compareci with avaiiable strength and material properties.
From the literature, it becomes clear that d a c e cracks may occur through:
(i) Morlp I or temperature-induced stresses (normal temion mode);
(ii) Mode II or trac-induced stresses (nomial shear mode);
(üi) M d e III or a lateral displacement (paralle1 shear) hie to lateral instabity; or
(iv) A combination of these modes (mixed mode).
Modes 1, II, and IIi are show dmmaticaiiy in Figure 3.2, with coordinates aiiped as
used in pavement analysis.
Sirnply, in Mode I, the two crack surfaces are puiied apart in the x direction, but the
defomtions are symmetric about the r-y and z-x planes. In Mode Ii, the two crack surfaces
slide over each other in the z-direction, but the deformations are symmetric about the z-x plane
and skew symmetric about the 2-y plane. But in Mode III, the crack surfaces slide over each
other in the y-direction, but the deformations are skew syrnmetric about the z-x and z-y planes.
Anaiyticai expression for stress intensity factors, Kr, and Km for the 3 modes of crachg
were developed by a number of authors 1e.g. Irwin (195711 and Compendia of faaors for a
variety of cases are available 1e.g Rook and Cartwright (1 97611.

Figure 3 3 IodepenQnt Modes of Crack Developent

3.3 Asphalt Concrete Distresses
Flexible pavements are a relativeiy t h asphalt we-g course over layers of granular
base and subbase to protect the subgde Eom being over-stressed due to t d i c loading.
Recentiy in pavement design, nming and cracking have been recogmsed to be independent
distress modes contributhg to pavement fàiiure. This recognition bas led to the introduction
and to the increased use of stabiiiised base and subbase material (using s tabi is such as
aspbalt), adding to the complacity of the already complex siiation in more convetional
pavements, and adding M e r challenge to the pavement analyst.
Three major modes of dimess wnsidered in the design of asphalt concrete
pavements are fatigue cracking, permanent deformation, and thermal cracking. Distress
criteria as weii as prediction methodologies that can be used in the analysis and design process
are briefiy dixnissed for each of the three distress modes Nonisrnith (1992)J. Before
disnissing the three modes of distress, it is helpful to define the crack classes by example:
Class I is defineci as disconnectecl hairline cracks running pardel to each other; m e r
development of cracking to form a pattern of blocks has been dehed as Class II; and Class III
Cracking has been dehed as Class II cracking that bas progressed to the point that the blocks
have becorne loose and have rocked under t rac [Sebaaly et.d (1989)J.

3.3.1 Fatigue Cracking
When an asphait-bund pavement layer is resting on an untreated aggregate base, the
passage of a wheel load causes the pavement to defiect. The work of H v q (1955)
demonstrated that the 1- this ddection is and the bigher the fiequency of its occunence,
the greater the propensity for fàtiigw cracking. Hveen's work bad a major impact on the
development on asphalt-aggregate mixtures. The r d t i a g research demonstrateci that the
fatigue respowie of asphalt concrete to repetitive loading can be defineci by relationsbips of the
following form wonismith et. al. ( 1 97 1) and Peu (197311;
where:
N = number of repetitions to fâilure;
E t = magaitude of the tende strain repeatedly applied;
= magnitude of tende stress repeatedly applied; and

4 b,c,d = experimentally determineci coefficients.
The work of Deacon (1965), Epps (1 968)] and othen (such as that by Pell and his CO-
workers at Nottingham pell(l973) and Peii and Cooper (1975)J has contributed sigdicantly
to our ability to design pavements that niinimize fktigue cracking.
A design relationship utilised today by a ~lll~llber of orgaaisations is based on strain and
uses an equation of the fonn
where again:
N = number of repetitions to fdure;
E t = magnitude of tende strain repeatedly applied;
Sm, = mix m e s s ; and
a, b, and k are constants.
which can involve a factor that recognises the influence of asphalt content and degree of
compaction and that is proportional to the following expression:

where:
Vq = the volume of asphalt in a test specïmen; and
Vi = the volume of air in the same specimen.
Data developed by Pell etal. [1975] and Epps [1968] have enabled the quantification
of Equation (3.8), for example in the Aspbalt Institute design procedure [Shook et. al. (1 982) 1.
Equation (3.7) is used in the [Shell (1978), (1985), and Asphalt Iastitute (198 111
procedures with the coefficients set accordhg to the amount of cracking considered tolerable,
the type of mixture that might be used, and the thickness of the aspbalt-bound layer.
in the pavement structure the asphalt mix is subjected to a range of strains caused by a
range of both wheel loads and temperatwes. Detemination of the response under these
conditions requires a cumulative damage hypothesis. A reasonable hypothesis to use as
demonstrated by Deacon [1965], is the iinear sumrnation of cycle ratios (sometimes referred to
as Minets hypothesis), which is stated as
where n; is the nmber of a d trdc load applications at main level i, and Ni is the number
of allowable t r a c load applications to faihne at strain level i. This equation indicates that
fatigue life prediction for the range of loads and temperatures anticipateci becomes a
determination of the total number of applications at which the sum in Equation 3.9 reaches

unity. Thus, prediction of fatigue He requires that tensle strains on the underside of the
asphdt-concrete layer be computed for the range of M c loads, materiais, and environmentai
conditions anticipated. Wkh howledge of the applied trafic for each of the above conditions,
Equation 3.9 cm be used to estimate the propensity of the partidar structure for cracking.
An alternative approach is to utiiize the concept of dissipated energy suggested by
Chomton and Vaiayer [1972] and van Dijk [1975]. Current work in the SHRP AspMt
research program [Tayebali etal. (199211 suggests that the reiatiodp presented by the
aforementioned researchers is specific, potentiaüy "capturing" the effects of mode of loading,
rest periods, temperature, and specimen configuration test type (iiuxes). That relationship is:
where:
WD = total dissipated energy to fatigue failure,
N = number of load repetitions to failure, and
A, Z = experimentaily detennined coefficients.
Moreover, it is possible to cornpute the dissipated energy in a pavement structure by
using a program such as SAPSI [Sousa &.al. (1988) and Chen (198711. This it is possible to
check the adequacy of a specinc pavement section (and asphalt mixture) if an estimate can be
made of the total dissipated energy expended for a prescribed amount of trai5c.

Fatigue cracking is, perhaps, a good indicator of the structurai condition of a pavement
section for use in pavement management system. Most pavement engineers agree that load-
associateci cracks are initiated near the bottom of the asphalt layer, where tende straïns are
highest [Sebbaly et-al. (1989)l. Repeated t r a c Ioads then propagate the cracks to the surface,
eventuaiiy forming the block or alligator patterns characteristic of fatigue cracking. The rate of
crack propagation through the aspbalt depends on combinations of various hctors: (i) the
thickness of the asphalt layer; (i) the maximum size of aggregate in the asphalt mix; (iii)
environmental conditions; and (iv) the magnitude and fiequency of loading. Therefore, no
general rate of crack propagation can be identifid for any pavement system. When a crack is
initiated, the structural capacity of the pavement section is reduced. The crack decreases the
section of the asphalt layer available to resist tension and shear, resuiting in higher pavement
deflections. In layer theoiy analyses, it is assumed that the reduction in structural capacity fiom
fatigue cracking results fiom a decrease in the effective modulus of the asphalt concrete layer.
3.3.2 Permanent Deformation and Rutting
Rutting in paving materials develops graduaiiy with increasing numbers of load
applications, usuaiiy appearing as longitudiaal depressions in the wheel paths accompanied by
upheavals to the sides, and may occur in any pavement. It is caused by a combination of
densification (decrease in volume and hence increase in deasity) and shear deformation, and
may occur in any or all pavement with shear deformation rather than densification being the
primary rutting mechanism [Sousa et. al. (1 99 1 )].

From a pavement design standpoint two approaches have wolved considering mtting.
In the fùst, the vertical compressive strain at the subgrade d a c e is limited to a value
associated with a specific number of load repetitions, this strain behg computed by means of a
layered-elastic d y s i s . The logic of this approach, fh t suggested by the Shen researchers
[Shell (1978)], is based on the observation that, for materials used in the pavement stnicture,
permanent strains are p r ~ p ~ d ~ n a l to elastic strains. Liting the elastic strain to some
prescribed value will also limit the plastic main Integration of the parnanent mains over the
depth of the pavement d o n provides an indication of the nit depth. By controlling the
magnitude of the elastic main at the d a c e , the magnitude of the nit is controiled.
The second procedure attempts to predia the surface rutting resulting ftom
contributions of pemÿuient deformations in each of the pavement components. Although this
procedure is appealuig 60m an engineering standpoint, it is more complex than the first. Only
this latter approach is discussed here and the dixwsion is Iunited to nitting estimations in the
asphalt-bound layer Nonisrnith (1992)l. A number of researchers such as Barksdale [1972],
Mclean [1974], and Freeme [1973] have presented procedures that use elastic analyses to
compute stresses within the asphalt-bound layer and constitutive relationships that relate the
stresses so detennined to the permanent strain for specific numbers of stress repetitions (tenned
the "layered strain procedure"). Integration or surnrnation of these strahs over the layer depth
provides a measure of the rutting that could develop. One version of this approach was
developed by the Shell researchers and has been used in modified fom to evaluate specific
pavement sections [Shel (1978, 198211. In this methodology, aeep test resuhs are
incorporateci into the foiiowing expression to estimate mtting:
Ah = pemiaaent deformation in the asphalt-bound layer,
hi-i = thickness of sublayer of aspbalt-bomd layer witb thickness h, ;
) 1-i = average vertical stress in layer hii;
Lx 1-i = mix dfhess for layer hl4 for specific temperature and time of
loading (obtaineâ by summiag the individual times of loading of the moving vehicles
passing over that layer at the specific temperature); and
cm = a measurable factor for use in estimation of pavement perfomiance of
pavements containing comparable mixes.
Although this procedure is not dciently precise to predia the acaial ruttuig profile
due to repeated trafic loading, it provides an indication of the relative perfiorrnance of different
mixes containing conventional asphalt cements. If it is planned to use mixes containhg
modi6ed binden, creep test data within the fiamework of Equation (3.1 1) wi l not provide
correct estimates of niàc perfonaance since mixtures containing these binders behave dSerently
under lo&g representative of aatnc when compared witb their response in creep. Data
niggest that the use of creep test data may overpredict rutting for mixes containïng some
modifiesi biiders.

To predict the development of rutting and the lateral rnovement that rnay lead to
upheavals adjacent to the wheel tracks, a more cornplex anaiysis is required [Weissman and
Sousa (1 99 111. One such methodology is being developed witbin the SHRP research program
wherein the constitutive relationship is dehed by a rheologicaî mode1 Mce that shown in Figure
3 -3 Nonisrnith (1 W2)] that combines non-iinear elastic response with linear-viscous response.
ïhis relationship is then used in fiaite-elenient idealizations of the pavement system to permit
caldation of the accumulation of pexmanent defonnation with repeated trafEc loading. Such
an approach has the potential for irnproved mtting prediction since it incorporates some of the
mix factors that carmot be considered in the layer-strain procedure.
3.3.3. Thermal Cracking
Thermal cracking is a mode of distress generdy manifestecl as transverse cracks at the
pavement d a c e . In qualitative ?mm, cracking is developed as foliows: as the temperature at
the pavement surface drops, a temperature gradient develops through the depth of the layer,
since time is required for the cold to be conducted into the system. The surface of the
pavement attempts to contract, but this contraction is restrained by the lower portions of the
pavement. Teasile stresses develop because of this restraint. Initially the stresses are small since
the &es of the mix is relatively low. However, as the temperature decreases, the tendency
to deform increases, but the lower portions of the pavement stiU prevent the deformation fiom
ocwring. Mix stifbess is also increased at lower temperatlues; this increased stifkess,
coupled with the propensity for inaeased contraction, evennialy lads to tende stresses at the

surfàce that exceeâ the fracture (tende) strength of the asphalt concrete and resuit, in tum, in
d a c e cracking Nooismith et al. (1965)l.
Assessment of the low-temperature response of asphalt pavements thus requkes a
knowledge of mïx sti5ess characteristics at longer times of loading, and the hcture (tensile)
strengh characteristics, both of which must be defineci at the low temperatures arpected in
pavement structures. Like mix stifbess, fiachire strength is dependent on both tirne of loadhg
and temperature. Both Epps [1968] and Salam [1971] have presented data on the tende
strength of asphah-aggregate mixtures that support the sigmficant work of Heukelom [ 19661,
which pemiits the tende strength of mixes to be defined with minimal testing.
Although there are a number of approaches that address the prediction of the potential
for low-temperature (themial) cracking, that suggested by Christison et.al. [1972] is
considered most suitable at this tirne since it accounts for the sigruficant factors contributhg to
this mode of distress in a fhmework that is readïiy analysed. In this procedure the asphalt
concrete is considered as a pseudwlastic beam and the stresses resulting nom the restraint of
temperature-induced strains are determineci fiom:
where:

~r (T) = coefficient of thermai contraction,
T = temperature, O C , and
A t = temperature inteivd.
W~th input of aaual temperature data, t h d stresses can be detennined near the
surfâce of the asphalt-bound layer accordhg to Equation 3.12. By cornparhg these stresses
with the teasile strength of the asphait concrete, the propensity for ftacture can be determineci.
Tbis is shown schematically in Figure 3.4. Within the SHRP research program, a direct
determination of the fiacture temperature has been developed. The Themial Stress Restrained
Test (ïSRST) attempts to simulate conditions d o g o u s to those represented by Equation
3.12. In the TSRST the thennal stress is developed at a specific rate of cooling as show
schematically in Figure 3 -5. As temperature drops when the thamal stress reaches the fkcture
strength of the mix (for the panicular conditions), the specimen i?amres. This should
compond to the development of thermal cracks in the pavement.
3.4 A Summary of Basic Points in the Cracked-Pavement Mode1
For any rational pavement design produre, carefd consideration must be given to
three elements. These elements are: (i) the theory used to predict the Mure; (ü) the evaluation
of materiai properties necessq for the theory sdected; and (Üi) the rehtionship between the
mgnitude of the parameters in question to the faihue.
Flexible pavement is comidered as a multi-layered elastic system To detemine the
state of stress or strain analyiically several assumptions are usually made. They are:

Figure 3.4 'Ihe Mct ion of Fra- Temperature for a Restrahed Stip of Asphalt Concrete (6niv-CUI. [IWOD
Figure 3.5 S ~ t c n i p c r a t u h Rciationship in 'lhamal S m ksbahd S p e c h T M (6wnmctd.[l~i~

(1) the materid properties of each layer are homogeieous;
(2) each layer has a finite thickness except for the lower le* and ail are infinite
in the lateral directions;
(3) each layer is isotropie, inchidhg the asphaitic layer;
(4) full fiction is dweloped between layers at each interface;
(5) surface shearing forces are not present aî the surface;
(6) the stress solutions are characterised by two material properties for each layer:
Poisson's ratio ( 0 ) and elastic modulus (E);
(7) the load is applied through a rigid circular plate and is assumed to be
distributecl d o d y over the loaded ma.;
(8) there are no loads outside the loaded ara; and
(9) the problem can be thought of as an axi-symmetrical problem.
The proposed cracked-pavement mode1 maintains the above assumptions except that
load trader across the crack can be destroyed, depending on the nature of the crack. The
material properties behaviour response is distinguished by the relationship between stress and
strain (lineur or non-linem); the time dependency of strain under a constant stress level
(viscous or )n>n-visco~s); and the degree to which the material can rebound or recover after
stress rernoval @Imtic or efdc).
The verticai pressure of any horizontal phne in or beneath a pavement, due to the
wheel load applied at the d a c e , is distributecl over an area that is considerably larger than the
area of contact between the tire and the caniageway. Whde the total vertical pressure on the
horizontal plane is equal to the applied load at the d a c e , the greatest vertical stress occurs
directly beneath the centre of the tire I caniageway contact area; it duninishes as horizontal
distance inmeases fiom the centre. If the material through which the appiied stresses are being
transmitted is amiderd to be an idealized, elastic, homogenous, and isotropie mass which
extends infinite distances both k t e d y and vettidy downwards, it is possible to determine the
stresses, strains, and deflections at any point within the mass by meam of the theoreticai
equations developed by Boussinesq, which are well lmown to pavement enpineers. While the
Bousinesq equations are not d i r d y appiicable to roadway design conditions, these equations
are important becaux they illustrate basic concepts and the use of the elastic theory as a means
of determinhg stresses and defleaions beneath the pavement.
It is generaily acceptai that B u d e r [1943] was the h to develop the theories
which were reasonably close to the actuai conditions in a flexible road pavement. Stress and
deformation vaiues obtained by Bumiiaer's theories are dependent upon the moduli of the
different layers. Since the typicai flexible pavement is n o d y composed of layers whose
moduli decrease with depth, the net e f f i that the Burmister's equations predkt stresses and
deflectioa less than those obtained from the Boussnisseq approach.
The moa cornmon types of failure mechanism in flexible pavements are the permanent
defomtion of the whole structure and cracking of the bihuninous layer. When a wheel load
passes over a point in a flexible pavement, each of its constituent layers responds in a general
way as show in Figure 3.6. The applied stress puise is caused by the wheel mass, and the
rdt iag strain pulse consists of a resilient and a permanent component. The resilient strain
component is of importance for the elastic-layer adysis of pavement response to individual
wheel loads, as it allows the aitical straias to be caldated for design purposes. The permanent

3.6 Conceptual Response of Flexible Pavement MataialsLaad(snionay.crr11~

shah component, although relativey srnail for a single-load application, is cumulative and
hence can become substantial over the large nimber of load applications n o d y considered
for design. It is the excessive accumulation of these pemanent strains fiom aii layers that leads
to Mure via d i rutthg The potemial for cracking resuhs from the phenomenon of fatigue
in bituminous materials. Fatigue has been defined as the phenomenon of hcture under
repeated or fluctuating stress which bas a maximum vaiue les than the tensile strength of the
matenal. Under t r a c loading, bituminous pavement materiais are subjected to repeated
stressing, and the possibildy of darnage by fatigue cracking continually exists. Binder content
and type are known to be the primary factors affiecting fatigue performance under an applied
strain. Fatigue cracking is assurned to originate at the bottom of bound pavement layers, and its
onset to be controlled by the horizontal strains repeated at tbis level by traaic loading. The
cracks are then assumed to propagate upwards through the bound layers to the pavement
sudiace. As this occurs, there is a progressive weakening of these layers and subgrade under
these layers, which in turn can raise the level of stress transrnitted to the lower layers and
subgrade to a level that brings about excessive deformation. As the transmitted stresses
increase, the development of pavement deformation is accelerated.
Cracking is one of the major modes that cause prematwe failure of asphalt concrete
pavements. Formation of cracks in asphalt conaete pavements can be due to the applied trafnc
loads; temperatureinduced thermal stresses; fieeze-thaw damage due to water infiltration; or
the aging effèct. Because of the complexity involved in the development of cracks in asphalt
concrete, there is no unique approach accepted by rrsearchers to characterize the crack

resistance of an asphalt wncrete system. The mechanisms of cracking are related to the type of
displacement indu&.
To the driving public, cracked pavements are mereiy uncornfortable; at the worst they
may becorne an irritation On the other hand however, to the engineer the presence of cracking
bdicates that severe problems are present that wiil be aggravated by the presence of the cracks.
Mer cracking is noticed, load-trader abiity, weakallng of subgrade stabiity, debondhg and
accelerated rutting are redts commonly seen.
Considerable effort has been devoted to the development of fatigue-cracking models
and material characterization over the past two decades. Severai models have been developed
to study the different types of cracks in rigid pavement. However, little work has been done
regarding flexible pavements. Several studies have been carried out to examine the reflective
cracking in flexible pavement and rigid pavements.
It was found in the iiterature that the theoretical predictions were sigdicantly difrent
fiom the observeci deflections, when the load was applied in the proximity of a crack. If a
significant crack exias within the reach of the deflection basin then assumptions of elastic layer
theory are violateci. Load transfer across the crack at the d a c e layer can be destroyed,
depending on the nature of the crack. Obviousiy the nearer the load is to the crack the more
will be the divergence between the obwed and caldated basins. It is also of note that the
major divergence between obsemed and computed deflection ocavs only at the sensors cioser
to the load and is not as signifiant at the f d e r saisors. B m s e the effkct of redistribution of
stresses wili be maximum near the cracked surface and insi@cant or absent in the deeper
layers, one shodd expe!ct to observe the major divergence only at the near sensors. GeneraUy

the collsequences of cracks in flexible pavanent are: over-stressing of the bottom layes;
punchhg Mure through the surface; stress concentration under the crack and in the vicinity of
the crack; and the eniarging of the vohune of the ddection basin near the crack as compareci
to the volume of the deflection basin without cracks.

ANALYSIS OF DEFLECTION
DATA: BASIS OF THE MODEL
4.1 Field Data
During the period 1989-1991, the writer participateci in a series of field pavement
evduations, undeRaken by the Province of Manitoba, Department of Highway and
Transportation These field tests were a part of ongoiag, coordinated intemational and nationai
pavement evaluation programs: S H R P (Strategic Highway Research P r o g r m e ) ; and C-
SHRP (a Canadian programme adjunct ta the SHRP). Experimental sites were scattered
across southan Manitobq dong sdected principal tnink highways (and one low-volume
conl~ecting highway), in ords to capture data fiom varying pavement types and underlying soi1
conditions, as well as from a wide range of t d i c patterns. Non-destructive testing was

undertaken quasi-statically, using the Benkelman Beam procedure; and dynamically, using the
Falling Weight Mectometer (FWD), the latter of which yields complete deflection-bowl
profiles.
Examination of the temperature-corrected data for flexible pavement sections showed
that some of the profiles, particularly fiom older pavement sections, occasionally revealed a
discontinuity, or dope change, in the profile. Sometimes an inexplicable straight-line segment
of profile appeared. These anomalies are indicated schematicaliy in Figure 4.1 Similar
deflection-bowl profle discontinuities were observed by Ganapathy [1994], again partidarly
in older pavements - this tirne on flexible airport sections. It was suspected that these
anomalies in othenvise smooth and continuous data rnight be attributable to cracking in the
pavement structure, close enough to the FWD impulse to affect results. Such crack influence
would be particularly sigdcant in SHRP and C-SHRP activities and in other evaluation
programs, since pavement cracks (size, location, and orientation) are normally ignored in
FWD testing protocols.
Consequemly, it was decided to hvestigate the cause of these changes in dope,
through an analysis of hypothetical pavement sections, with and without cracks Nnning
through the deflection bowl. It was assumeci that a single wheel load was appiied to a layered
flexible pavement stnicture, and the response wdd be obtained through elastic theory. The
calculated or predicted ddection measwements were detemllned using a powerful general-
purpose finite-elexnent programme (ANSYS), available in the Engineering Fad ty of the
University of Manitoba.

(b) Bowi Rome wich Slop Discoiiripniby . . . at
Figure 4.1 DefiectionBowi Rafles-widi andwitho~ Anomalies

4.2 Cenerai Anaîysis of Deflection Data
Pavement modeling has ahivays been a complex and difncuit problern for the highway
engineer. Cmentiy, there are complex and precise computer prognuns that provide the
engineer with the meam of computing theoretical behavior. For many yean the Benkelman
Beam was the standard, and later developments tended to be compared with the method for
acceptame. Howwer, it has becorne apparent that better methods are required for adequate
representation of pavement behavior under moving wheel loads. The most suitable testing
device that Srnulates the pavement structure is the Fahg Weight Deflectometer (FWD) and it
appears that it is well-suited to a wide range of pavements and provides uniforrnly accurate
r e h that are consistent with amal pavement loading and behavior. A pavement has many
variables, such as thickness and type of matenals, environment and trafic. To amunt for many
of these variables simultaneously, full-de testing, such as deflection measurernents, has
proved to be necessary.
The basic assumption in the behavior of pavements is that a pavement can withstand a
number of repetitions of a given load before it fds. Failure can meaa many f o m of distress
under some fonn of loading. If this loading is representative of t d i c , then the main or
deformation could be related to performance by a Mure mode1 [Tholen &.a. (1 98511.
An important task in this study was the analysis of the deflection data wllected with
FWD or simdated with FWD. It was mentioned that many computer algoritbms are available
at present. One de6ciency with ail the available computer algoridmis is tbat they cannot inciude
the effect of a crack or cracks in the pavement. Mary of these algorithms have b a n written to

meet the need of that particular researcher but canwt be easily generalized and are w t versatile
enough to meet other requirements. Therefore, it was concluded that a general-purpose finite-
element method would be best suited for the d y s i s of pavement systems. Two
ment finite-elment programs avaüabIe on the University of Manitoba cnabhme cornputer
were not suited for this study, since they would have required extensive m&cations and
would require writing source codes to consider non-homogeneous, non-iinear or anisotropic
behavior. Instead, for this study the finiteelement method chosen was the ANSYS system
developed by Swaoson Analysis System Inc. (SASI) of Philadelphia in the USA [Swanson
(1 993)]. ANSYS is a commercial genetal-purpose finite- element program which can be used
for a variety of problems in applied mechanics including layered elastic models for pavements.
One cm use it for modeling simple homogeneous, isotropie elastic solids or add in other
feahies such as inhomogeneity, anisotropy, non-linearity, plasticity and yield criteria and even
temperature-dependent rnatenal properties. Even though ANSYS is a commercial program,
and hence its source code is not available to its users, it provides enough flexibiity that user-
denned parameters can be input into the system. There are other Mar cornmerciaily available
finite element programs such as SIMEX developed by Dr. Ayari at the University of Manitoba.
The di£Eculty with SIMEX is that it is a new program and lacks adequate documentation.
(Howwer SI= was tried on a problem in p d e l with ANSYS and gave similar results).
ANSYS was chosen for tbis study because it was r&y available within the Department of
Mechanical Engineering as wel as elsewhere, and also d d handle hcture mechanics
problems such as cracks in the fleble pavements or conmete pavements. The folowing
section reviews some features of ANSYS program in some detail.
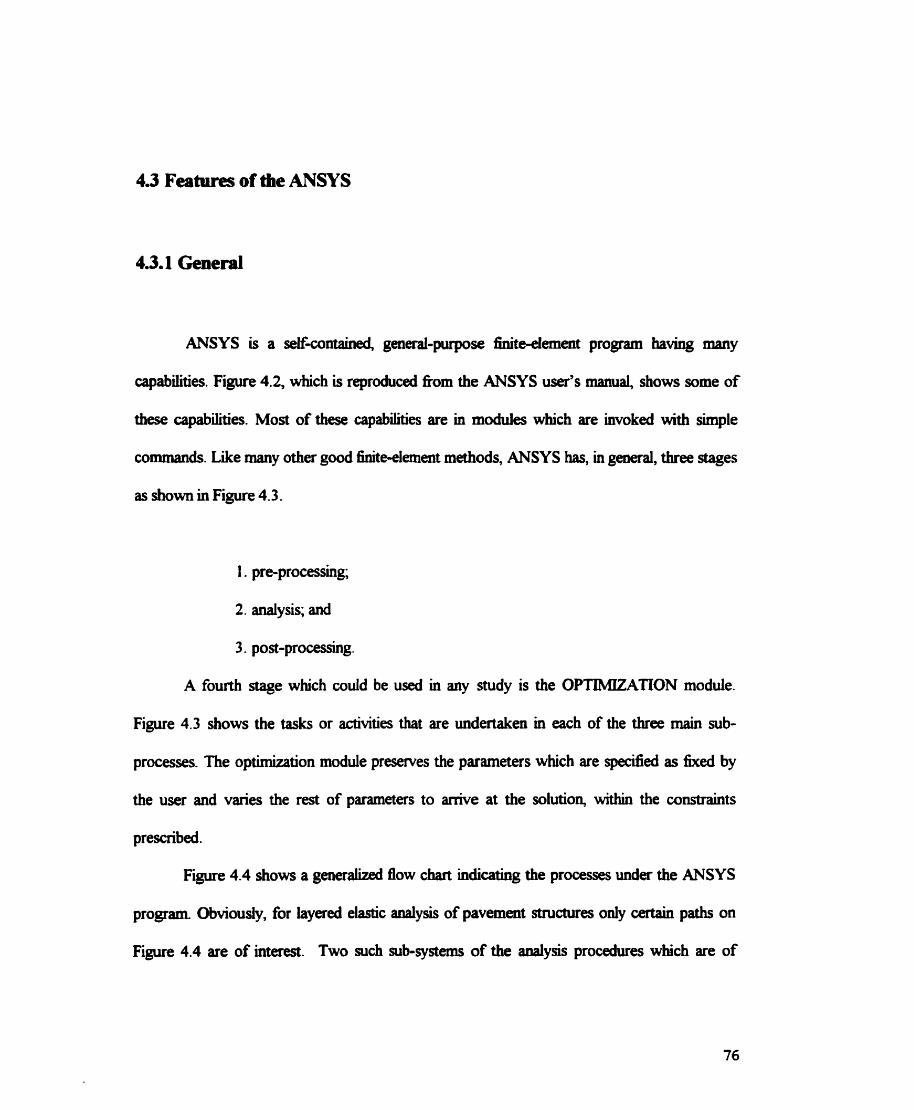
4-3 Features of the ANSYS
ANSYS is a seIfkontaineû, generai-purpose finite!-efemem program havhg many
capabilities. Figure 4.2, which is reproduced fkom the ANSYS user's manual, shows some of
these capabilities. Most of these capabilities are in modules which are invoked witb simple
commaads. Like many other good finiteelement methods, ANSYS has, in general, three stages
as shown in Figure 4.3.
1. pre-processing;
2. analysis; and
3. post-processing.
A fowth stage which wuid be used in aay study is the OPTIMIZATION module.
Figure 4.3 shows the tasks or activities that are undertaken in each of the three main sub-
processes. The optimization module presenes the parameters which are specified as fked by
the user and varies the rest of parameters to arrive at the solution, within the wnstraints
prescribed.
Figure 4.4 shows a generalized flow chart iodicating the processes under the ANSYS
prognun Obviously, for layerd elastic analysis of pavement structures only certain paths on
Figure 4.4 are of interest. Two such sub-systems of the aaalysis procedures wbich are of


PREPROCESS tNO PHASE 1 SOLUTION PHASE 1 POSTPROCESS Iffi PUSE 4.
I l MESH GENERATION 1 ELEUMT UATRIX 1 POST SMUTI
FORUATION OPERATIONS GEOETRY OEF INITIONS 1 OVERALL UITRIX 1 POST DATA P MATERIAL DEFINITIONS TRIANOULARIZATION (FOR REPORTS)
I (WAVE FRONT) CONSTRA I N 1 DEF INITIONS 1 POST DATA
OISPLACEMENT
I SCANNINO LOAD OEFINITIONS 1 SniESS, ETC.
CALCULATIONS POST DATA DISPLAYS WDEL DI SPLAY S I I
I I -
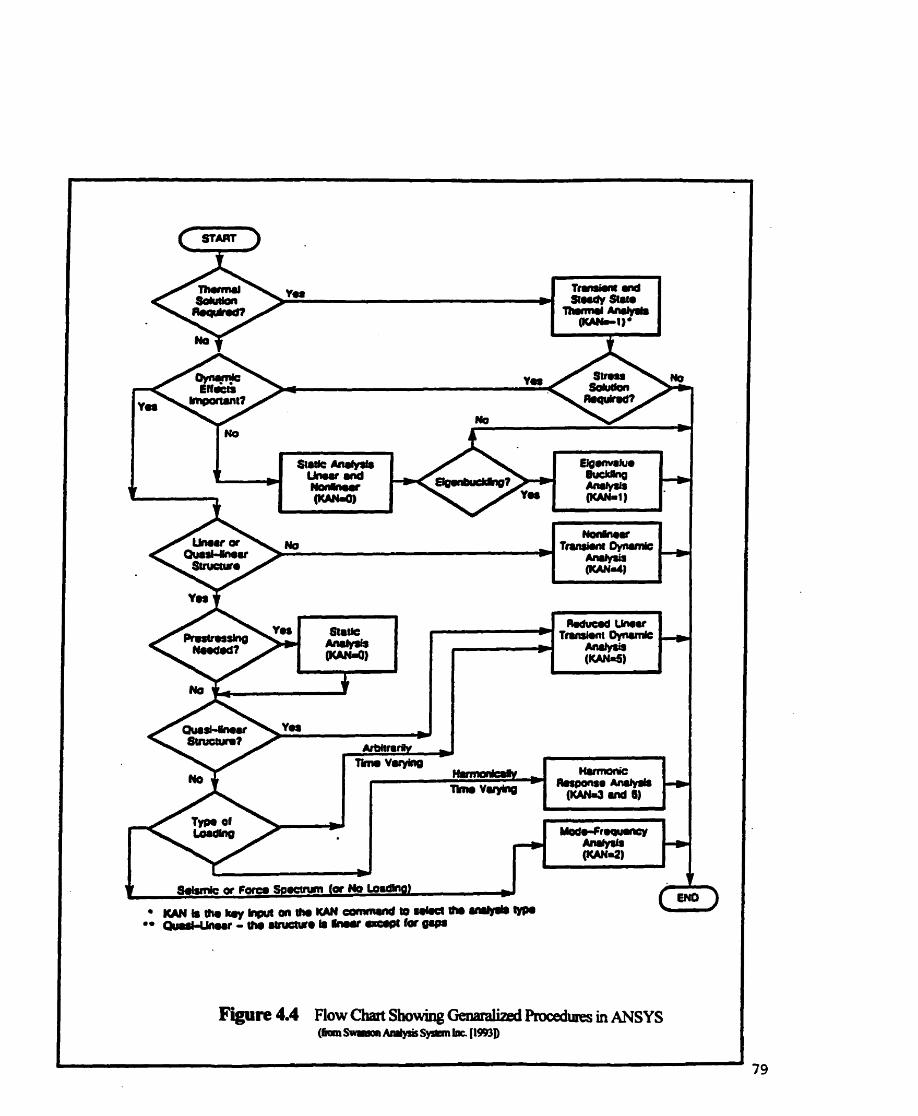

interest are shown in Figure 4.5 and Figure 4.6. Figure 4.6 shows the data flow in the solution
of a simple linear or non-linear dynauuc anaEy9s. But because the d y s i s of pavements in this
thesis was a quasi-static one, the sub-system shown in Figure 4.5 was the one actuaüy used in
this study.
4.3.2 Basic Theoretical Concepts in ANSYS
As mentioned pre~iously~ the finitcelement method is essentiaiiy an approximation of
the onguial real problem. The structure under investigation is divided into a number of smaller
elements which are interconnectecl at a finite number of points. If the forceldisplacement
relationships for each of the elements can be fomnilated then the force/displacement relations
for the entire structure c m be expressed in the form of a rnatrk This matrix relates the stress
and main at any point in the structure using the material properties. These material properties
are indicated by the modulus of elasticity and Poisson's ratio. Having dehed the element
geometry and material properties, the next step is to define the boundary conditions and the
applied loads and /or displacement conditions. For cracked pavements, the crack location,
crack width, crack depth, and fiequency and disliibution of cracks must be included in the
above problem definition.
In matrix fondation the basic equation relating force and displacement for the static
anaiysis in ANSYS is:

-1 ymm$ Back
Substitution + I-l=Tl 1 Stress. Force 1 / . - \
Figure 4.5 Flow Chart of GaiaraliPd Staîic Anaiysis in ANSYS (fiwn S w r r ~ a i ~ S y a a n lnc. (l993D

F'igure 4.6 Flow Cheri Showing Gmaralind L i Transient Dynamic Analysis in ANSYS (h~ Smisai Aiiilysis Syslan Iir (1993D

where:
[ K ] = sum of elernent stifhess matrix (total stiffiness matrix);
{ u ) = displacernent ma*
{Fqp } = applied nodal force vector (concentratecl point loads);
{ FP ) = applied element pressure vector (dormiy distributed loads;
( Fh ) = applied element thermal vector,
{Fm ) = applied elwent body force vector; and
F } = applied element elastic load vector (secondary forces due to non-linearity).
In this study, thermal properties, body forces and non-liaearities were not considered.
ïherefore the ternis { Fh 1, (Fm ) and (Fe, ) fd out of Eq. (4.1). Also the wheel load was
assumeci to be unifody distributeci. Thus Eq. (4.1) is reduced to:
A finite-element program usudy starts with the fondation of the matrices for al1 the
elements. Then using matrix algebra the matrices are manipuiated so that as many matrix
elements as possible can be reduced to zero. This helps to reduce the computation tirne. This
process is shown in Figure 4.5 as "wavefiont solution" and " triangularized e e s s maaac".
Equations of the type (4.2) give rise to sets of simultaneous equations - as many equations as

there are elements. When these equations are solved for the hown loading and boundary
conditions in such a way that at al nodes, the equilibnim and compatibility conditions are
satisfied, a solution for the problem at hand has been found. By substituthg the solution in the
individual element matrices, displacements, stmses and strains at evny point in the structure
can be obtained (show as "back-substitution'' see Figure 4.5).
4.3.3 Element Library
It was mentioned earlier tbat the finite-elernent mode1 is an approximation of the r d
structure. î he approximation is achiwed by breakhg down the structure into an assemblage of
smaller elements co~ected at a number of nodal points. Therefore, in order that the behavior
of the assemblage wodd t d y approximate that of the real structure7 it is important that the
individual elements be properly characterized. The formulation of the stifhess matrix depends
upon the type of elernent. For instance, a two-dimensional plate m o t be tnily represented by
elements canyhg axial loads only; nor will a prismatic flexural element be appropriate to
represent a pin-jointed truss. Thus all finite-element programs cany an element library. The
element library contains dinerent types of stmctural elements and infionnation about how to
define their geometry, their sti8tiiess and pertinent material properties. Such idonnation
inchides the shape hction, df3hess matrices, degrees of fieedom, stress or straia parameters7
etc., in source code. This information is not transparent to the user, but the program accesses
that information once a certain element type is specifiied. Figures 4.7A and 4.7B show a partial

oam.r.lr.4 M...
rnri tnan wirwm w: Ux. W. U t hatuor: ?.m.$
n u 4 4 amdo@ S O r w r rn m. W. Ut. mm. aow. llOTZ
Pwy.e*t M. Ollm ny.1.
mttm t a 8 -cor* OOC: m. W. uz. mm. nom. rio12
CeUwrn RS. Wam
Figure 4.7 A Partial List of EIerneat Li@ in ANSYS ( h s - tnc [19!l3D

A d r y n i m m t r k Mumaw stria. S A
nnr a fW.8 3-0 moice OOC:VX.W.Vt I e 8 n n 8 : nuam.
ntli t nDd88 t 0 maa. OOt: VI. W . Ur. mtz
hrovu: S
r ina I mdar S-O mw8 m: VI. W. Ut.
noa. -W. nott ~ u u i r : C A S
n m a m i r 3-ô eorco DOC: VI. W. U t . riont. riom. mtt
C..(Vim: &S. I# mors
rntar @am&@ a10 88- nli: VI. W. Ut Pe.iia8: C A S ;
n r r c O 3-0 8mw OOr: M. W. Ut.
riom. mm. # T t Pmowma: RS.
-8-
I
ai mm8
I
a- wuam OOCt =. W"u2 h.crrrc?. f
M m . mm. -a-
.a. na.
innniMllriq
Figure 4.7 B Partial List of Soiid (3-D) in ANSYS Element Library (hnm Summm A d y & Sysbn Inc (1993D

list of the library of elements carried by ANSYS. It is not necessary that the structure should
contain oniy one type of element. It can be an assemblage of many diff&rent types of elements.
The oniy caution is that they are ail properiy defined.
In the ANSYS program, ciiffirent types of elements are d e d by a nomenclature
"STIFn" where n reprmts the iibrary identification number. For example, referring to Figure
4.74 STIFI represents a spar elemmt in a plane. The deformed geometry of such an elernent
is completely defhed by two component displacements U, and U, wbich are the two degrees
of fieedom @OF) for such an element. Figure 4.7A explaias the characteristics of the Merent
STïF elements and what féaaues of nich elements can be handled by ANSYS at the present
stage of dweloprnent. Figures 4.7A and 4.78 .show some elements (STJF2, STIF 45, STIF 64
and STIF 46 ) which c m be used if one has to mode1 the pavement as three dimensional solid.
4.3.4. Pavement Stnicture Represenbrtion
Pavement structure is generally represented as a semi-&te elastic continuum, layered
or homogeneous. In most cases the problem can be analyzed as a planestrain problem.
however, the loading on a pavement is over a finite area given by the tire foot priat. Thus,
whiie the geometry of the pavement is a two-dimensional plane, the loading would strictly
make it a three-dimensional solid. However, wheel loads are g e n d y assumed to be circular,
having an axis of symmetry in the vertical direction Thus the pavement system can be
represented by an axi-symmetrïcd solid as a plane strain problem.

The most appropriate element in the ANSYS element Library to represent such a
structure would be S m 4 2 (see Figure 4.7A). This is a two-dimensional, Wparametric elastic
solid baving two degrees of fieedom U, U, (plaaar structure). Figure 4.7A shows the kinds of
featwes that cm be handled by ANSYS ushg these elements For instance plasticity can be
handled. Thus if the coqlete stress-strain curve for the component materiais ûui be defined
(see Figure 4.8 (a) and @) for scamples), thea the deformation of such elements can be
computed. In Figure 4.8, C,, refêrs to a constant representing the materiai behavior, T. refers
to temperature dependent input, and E O is a tangent moduius and has the same units as
elastic modulus. For pavement materials, particuiarly the unbound materials, one can prescribe
a yield criterion and then, in the design, can ensure that excessive deformations do not o c w .
Theories of elasticity generally assume d displacements so that the p ~ c i p l e of
superposition can be valid in many analyses. However, in pavement materials o c w i o d y one
may be interested in dyz ing the behaviour of the structure under large deformation. W1th
SïlF42, ANSYS can handle such an analysis. Some earth materials are stress-Stinening.
According to Figure 4.7A STIF42 will permit the incorporation of such material properties into
the mode!. In this midy the pavement structure was represented as an assemblage of STIF42
elements, and an axi-syrnmetical formulation was used. Because of the importance of STIf42
to thïs thesis, and in the opinion of the writer, to the general d y s i s of pavements by ANSYS,
the complete theoretical development of STIF42 as described in the ANSYS Theoretical
manual [Swaason (199311 is included as Appendàr 1.

(a) Anisotmpic Option
(b) Multi-b 1-c Hademog

Optimization as employed by ANSYS is a projpmmed mathematicai technique which
integrates the d y s i s procedures into an iterative search procedure to find the optimal vaiue
for a speciîled parameter, subject to certain userdefineci constraints. For example, if one used
ANSYS to design a beam for minimum weight, subject to certain boundary aad loading
conditions and subject to certain limitiag stresses and ptiysicai dimensions, ANSYS wouid first
go through the andysis pari and deterxnine the stresses in temis of the physical geometry of the
beam. In the second part it would start an iteration process by which the dimensions were
chosen within the constraining conditions of size and Ness und finally a lest weight design is
obtained.
In the abow example, the objective is the least weight design. For a simple beam, the
weight can be expiicidy written in ternis of its physical dimensions and mass density. Such a
fiuiction f o m the objectivefimction. Similady, the stresses can be computed in ternis of the
physical dimensions. The restrictions one places on these stresses and the physical dimensions
are called the conrbainr equatrbns. For the beam example both the objective M o n and the
constraint equations can be expiicitly written as fimctions of the physicai dimensions of the
beam. The physical dimensions form the Ciiosign m'ables. The motivation to change and try
different comôiitiom of dimensions withui the prescribed range is the state of stress at various
points in the beaa The stresses are called the M e vanùbfes.
The example above illustrata that in Rianiag an opthkation module one should define
four essential components:

1 : the objective@zction;
2: the colzstraints within whkh the system should seek an optimal solution;
3 : the &sip wiables, whkh are the independent variables that must be modified
in each iteration cycle; and
4: the m e vuriables, which are the outwme of the analysis in each iterative
cycle.
In the acample of the beam, al1 of these can be explicitly written in temis of the design
variables. Thus, the optimization wiil converge to a unique vahie. Howewr, in many problerns
for which one would seek a finite-elernent approximation, such explicit relationships do not
ex&. in such a case the optimal solution will lie within a space bounded by the surfaces of the
objective fùnction plane, and the suifaces bounded by the design variables and state variables.
By repeated optimization one can then arrive at a point in the surface where the gradient of the
objective h a i o n is minimum. This concept is illustrated in Figure 4.9.
In the above discussion, it has been tacitfy assurned that one is always seeking the
minimum value for the objective fùnction The ANSYS optimization module will ahvays seek
the minimum value. Therefore, when using this module, one should write the objective bct ion
in such a way that the minimum solution is the appropriate one for the problem at hand. h i e to
the nature of the study undertaken in this thesis, back-caldation of layer sWhess parameten
was not necessary. Consequently the optimization module, employed extensively in the work
of Ganapathy [1994], for example, was not used in this work. However, the points made above
were provided for completeness.

Figure 4.9 Concept of Optimization with an Approximate Objective Function (hmi Swrisai h ü y s i s S m Irie. (1993D

4.4. Geometry of the Pavement Aaalyzed
The finite element mesh generateû for the pavements in this study is shown in Figures
4.1 OA and 4.1 OB. Ail mesh elements were specified as rectanguiar and tBangular. The mesh is
finer near the load and the crack position (where applicable), aud becornes coarser as one gets
fbtûer away fkom the load (and the crack) in both the vertical and horizontal directions.
4.4.1 Horizontal Direction
Generdy, in heavy pavement structures such as airfield pavements, the deflection
bowls are u w d y large. Therefore, the vertical boundary of the model must be sutnciently far
away fkom the load point so that the model cm predict the r d load distributing capacity of
these heavy pavements. Considering the results that were reported by Ganapathy 119941, it
was decided to place the vertical boundary of the analytical model at twice the distance of the
last sensor fkom the load point. At tbis boundary, ody verticai movements were considered,
but no horizontal movements were pemUtted (see Figure 4.10).
4.4.2 Vertical Direction
In the vertical direction, the nimber of elements and the node points varied. Geueraliy
the aspbalt layers were represented by a smaM element of 40 or 50 mm thickness. Tbese were

Figure 4.10~4 3-Layer Mode1 Uncracked Pavement Laid out by ANSYS
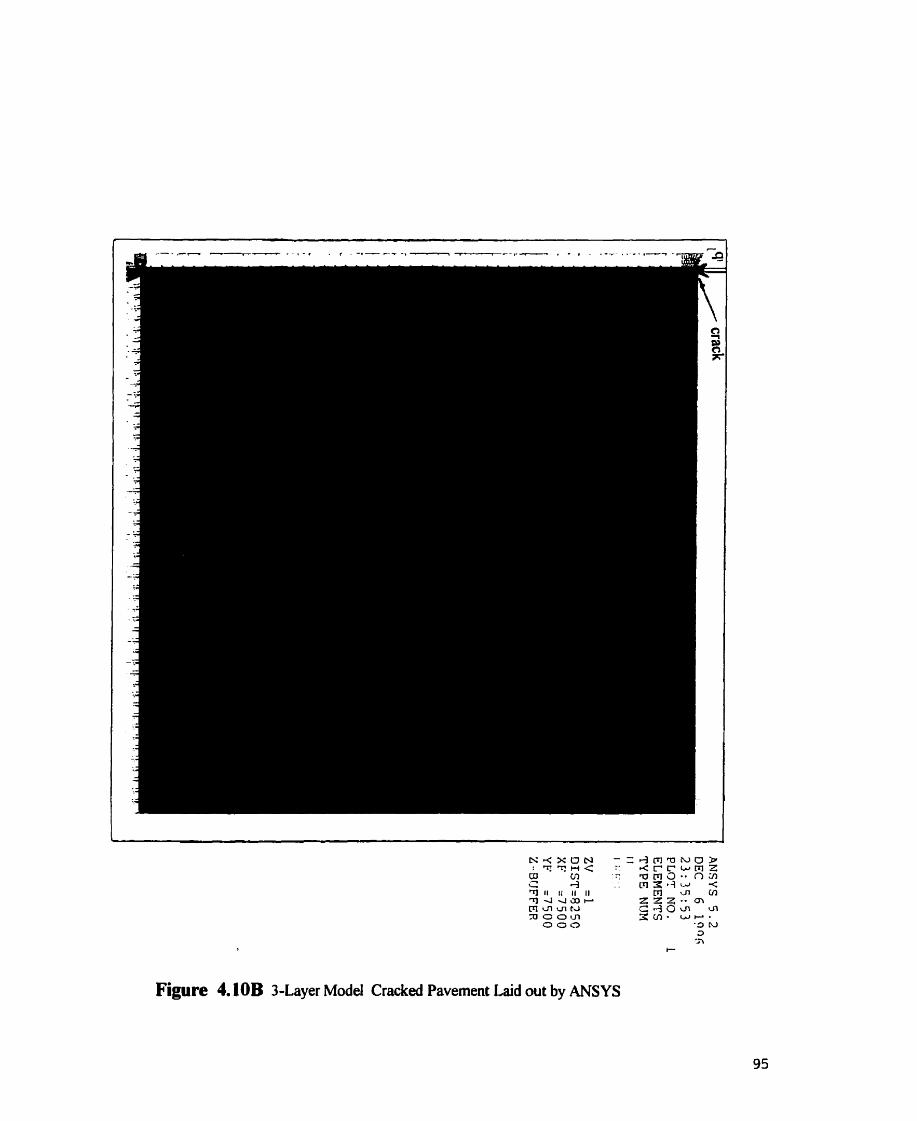
Figure 4.10B 3-Layer Mode1 Cracked Pavement Laid out by ANSYS

chosen to reflect g e n d construction practice where the lift thiclmesses of the asphalt surface
would be between 40 and 50 mm Simiiarly, for the granular materiai the specifications
g e n d y cd for compacted thicknesses of 150 to 200 mm. Therefore the mesh generation
cded for an element height in this range. The subgrade was in each case analyzeâ and divided
into large thicker layers. It was assumed that the &-infinite elastic layer could be
represented by 1 5 m of elastic materid resting on a ngid base.
4.4.3 Boundary Conditions
Along the axis of symmeûy and at the veriical outer edge of the mode1 only vertical
movements were considered. At the bottom of the subgrade a ngid base was assumed. Thus no
movements at ail at this boundary were pennitted. The top horizontal boundary was
considered as a Eee surface.
4.4.4 Loads
The final aep in building the f i t e element mode1 was to spe* the loads. Ody
vertical SUTfàce loads, applied over a cirdar area centered on the a i s of symmetry, were
coasidered. The load was speded as a uaifonnly-distributed pressure equal to the applied
TWD load, divided by the area of the loading plate. It was assumeci that no shear forces existed
between the loading plate and the surfice of the dastic continuum. In this study, the loads were

assumed as 600 kPa., approximating one wheel of a trafic axle of 18-kip axle load. This
pressure is almost the same as for the truck that is used in Benkelrnan Beam test. The pressures
ofien used by RKD are 400,600,800, and lûûû kPa The pressures are assumed to be applied
on a 300 mm diameter plate, and correspond to loads of 28.3, 42.4, 56.5 and 70.7 kN.
respectively .
4.5 Parametric Codhg For ProbIem Definition In ANSYS
Defbed By The User
An ANSYS program m d y has three t'unctions:
(1) To create the mode1 geometq as directed by the user,
(2) To run the analysis, including the formulation of matrices, mangularization of the
matrices, and solving the rnatrix equations;
(3) To perfonn post anaiysis manipulation, which inchides collecting the reailts
such as stress, strain, deformations at any user-specified points, and displayiag them as
graphs, charts, tables etc..
AU these fùnctions are containeci in individual modules held in the ANSYS program
library. The input directing the program to perform its bctions nmst be created by the user by
issuing the individual commands, ifthe user is solving the problem interactively, or by a set of
macros if the program is nm under a batch mode. A ''mac~o" is a user-defined SeQuence of
data input commands writtea to an externa1 f3e that may be used at any other input location. In

addition to CO-d and numerid data, the "macro" may contain pararneters whicb may be
assigned numerical values by the user when executed. A "ma~ro'~ is defined withui a run by
"enclosing" a sequaice of data input commands between a CRUTE and a EM) command.
Appendix II shows the codiog used in runaing ANSYS. It is not the intention here to disaiss
individuai ANSYS commands, but merely to demonstrate how the ciiffirent modules are b d t
up and joined into a macro so that these ûui be submitted as batch fiies to a computer for
processing as shown in Appendix II. Appendix II shows also the model formulation and how it
was run on a Sun Station (Unix) using ANSYS version 5.0. The Sun Station was located in the
Department Computer Science and Computer SeMces of the University of Manitoba.
4.6 Layered Pavement System
The model shown in Appendix II is for a specific site, and shows the w h g for a
three- layered pavement (asphalt concrete, base and subgrade) with a s i i e loading condition.
However, this was not the general case for the field data that were used for cornparison
purposes. In general, the pavement modeiied was represented as it was built. In the literature.
one often finds statements that there is no special advantage in idealizing the pavement as
an-g more tban a three- or four- layer system- Whiie this may be tme for homogeneous
pavements, it becornes necesaq to have the capabiïty of analyzing a truîy n-layer srjtem
when considering many classes of real pavements, such as the pavements anaiyted in this
thesis.

It should be mentioned here that the use of a gaierd-purpose fhite-element program,
such as ANSYS, proved to be advantageous in the analysis of composite pavements. For
example, when it was anempted to analyze composite pavements (in which a rigid layer was
overlain by a more flexible layer) ushg the ISSEM4 program, the prograrn would ofien fàil
because of the proximity of a "ngid 'dttom" to the d a c e . In a general-purpose finitedement
program this does no? appear to be a problem. In f a such a prograrn helped visualize the
effkctiveness of a rigid layer in distributhg the load at diEerent loadings applied by the impact
mechanism. The ANSYS prograrn also has the capability of dyz ing a cracked pavement,
since so many other prograrns cannot hade a non-continuous pavement. Because of this
ability, general-purpose finite-element programs are recornmended for pavement research
work.
4.7 Methodology of Analysis
4.7.1 Use of the Deflection Bowl in Back-Calcuiating Layer Moduli
In the previous sections, the reasons for the choice and use of the ANSYS finite-
element program for the anaiysis of pavements by the layered elastic theory were disaibed. ln
Cbapter Two it was mentioned that the layered elastic system bas no unique solution, because
the problem is basicaiiy indetenninate. The more the number of layes, the more indeterminate
is the problem and hence the less unique are the posde solutions developed. Many
combinations of the layer momili can be found to yield the same shape of deflection bowl. 1 is
then a matter of judgement to ascertain which c o m b i o n of individual layer III& is the
most plausible. Therefore, the expeience of the engineer anaiyzing the problem becornes very
important. It is also essentiai that the behavior of the materiais io the pavement layen is well
understood. However, when one is dealing with materiais sucb as asphaltic coacrete or earth
rnaterials, this understanding is usuaiîy not weil developed as one might wish. Furthmore, the
problem becornes even more ditncuit when the asphaltic layer is cracked to the degree that no
load can be trderred across the crack surfaces. F i , the accuracy of the solution depends
on the criteria used to judge the goodness of fit between the observed and theoreticai deflection
basins.
As f a as the writer was able to determine, most of the back-calculation procedures
aimed at rnatching the maximum deflection at the center of applied load as the criterion for
selecting the layer moduli. Some other methods (ISSEM-4) aùn at matchhg deflections at
discrete points (usually the sensor points, because these are the ody points of certainty) as the
criterion for a good fit. However, the writer submits that the volume of the deflection basin
would fom a better criterion to calculate the layer moduli.
The concept of the shape of the deflection basin as a unique characteristic of the
pavement is not an entirely new concept. Vaswani's and Majidzadeh's concept of rigidity fmor
(Vaswani [ 197 11, Majidzadeh [ 19821) had already established tliis. More recently, Thompson
et.al. [1984] presented some evidence to tbis &kt. However, a back-calculation method uskg
this concept was only recently presented by Ganapathy [1994].

Obvioudy, the defiection basin is the response of the pavement to an applied load at a
given time where the pavement is represented by a certain combination of materiai properties.
la hct the deflection basin may be related to the energy absorbed by the deformed pavement in
response to the loadmg of the pavement by the FWD or by other 1oading devices. In the static
or quasi-static case, the concept of virtual work is implied. This capacity to store elastic energy
is a fùnction of the material properties, most notably the dynamic moduli of the materiais. If the
resilient modulus, as is generaiiy understood by pavement agineers, can be acce~ted as a
mogate to this dynamic moduius, then the volume of the deflection basin cao be used to
calculate the resilient moâuli. Normally, plane-strain conditioas or awi-symmetry are assurned.
Therefore defiections are measured only in a singie vertical plane, tacitly assuming that the
deflections in any other plane radiating fiom the load point wouid be identical. Although in this
thesis, it was assumed that the mode1 was isotropie and homogeaeous, non-hornogeneity car^
also be handled by ANSYS. It is the objective of the work at the University of Manitoba (this
thesis and that of Ganapathy 119941) to demonstrate that a simple defiedon-bowi-volume
critenon would lead to better results when ushg ANSYS and for seeding moduli values, than
could be obtained with other algorithms and programs.
Using the general-pupose finiteelement program disaissed, this saidy investigates the
effkct of the existence of cracks on the deflection basin, and how semitive the deflection basin

is to such cracks. This study is sigdicant due to the paucity of research work into cracking in
flexible pavements. In the evaiuation procedure, the back-calculation technique used the
vohme of the defiedon basin as a critoion to compare the prdcted and measured
ddlections. Actuaiiy, for simphcity of calculation, the mea of a d o n through the deflection
bowl was used to represent the volume in a rotationdy-symmetrid bowl (following
Ganapathy [1994] pp. 294). The r d t s wae cle* dependent on whether a sigolficant crack
was present or not. This study contributes to an understanding of pavement behaviour, by
shedding some light on how much the deflection-bowl area depends on the presence of
cracking, and aiso on what the mioimum distance should be that the FWD operator can place
the sensor fiom a sigmficant crack, if the crack is to have negligible &kt on the a m of the
deflection-bowl section. As previously mentioned, a commercial general-purpose program
(ANSYS) was used in this study. In Chapter 5, the actual results of analyses and physical tests
on pavements, and the resulting bowl shapes, are presented, and are diçaissed in more detail.

DEFLECTION CHARACTERISTICS:
RESULTS OF ANSYS
5.1 General Discussion of Deflection Bowls
The concept tbat the shape of the deflection basin as a unique characteristic of the
pavement is not entirely new. The deflection basin is the respome of the pavement to an
applied load at a given tirne, taking into account the combination of m a t d properties. In faa
the basin can be related to the energy stored in deformation by the pavement and is related to
the total energy delivered ta the pavanent by FWD or other Wpment. The capacity to store
energy is a îùnction of the material stiffiness properties (as seen in the dynamic modules), the

volume of pavement material affécted by the loading, and the stress and straia regimes
throughout the affecteci material voiume.
The correlation beniveen the ddection basin and the measured central deflection can at
times be fairty good, but it bas been recognized for some time that the use of maximum
ddection alme is not d c i e n t to determine the layer moduli. Comparing the vohunes of the
ddection bash provides the more significant match between the observeci and dcuiated
situations. Thdore, as discussed above, the use of the bagbvohune concept is more
promising in producing better resuits through the back-calculation procedure. Consequently,
one is drawn to the conclusion that a general-purpose finite-element process is weii-suited for
the analysis of pavement system.
Deflection-basin parameten are used d y for three applications:
(1) to check the structurai integrity of &service pavements;
(2) to relate pavement responses to critical (i-e. faim) threshold responses; and
(3) to calculate the in-situ layer moduli of pavement..
For some t h e now, a continuous effort has been made in many places worlchvide to
solve the problem of the interpretation of deflection-bas& in flexible pavements (both cracked
and un-cracked). In view of the complexity of pavement materials and the uncertainties of
many design parameters, it is n o d y assuneci bat: (i) a simple solution would serve as weU
as a cornplex one; (ii) a workable solution could be based on the assumption of linear elasticity
of materials; and (ii) a static method of deflection caldation would dcientiy represent the
propagation of a deflection wave nom a FaUing Weight Deflectometer (FWD) impulse load.

The measured deflections genefated by the FWD test load represent a deflection bowl
or basin such as may ocair with a pashg wheel load of comspondiog magnitude and speed
and of similar distribution area of tire contact pressure. For many years, deflection under a
standard dual-tire whed load, measured by the Benkelman Beam (BB) and adjusteci for
temperature, bas hss regarded as an indicator of the structurai strength of flexible pavements.
The IWD on the other hand, measuces not ody the deilection under the test load, but provides
infomtion on the whole deflection basin under and around this load. (Jung 119891).
Deflection bowls of the same depth can bave a wide or narrow fom. A wide form tends to
indicate a weak subgrade, whereas a namw fonn points to weak upper layers in the pavement
structure (see Figure. 5.1 (a) and (b)). The latter could be caused by high temperatures in the
asphah mncrete layers which soften these upper layers and cause higher deflections at and near
the center without affecting the more distant deflections. A similar efféa can be observed if the
asphaitic layers are of low quality or cracked. Figure 5.1 (c) illustrates the general fom of a
deflection bowl when both subgrade and top layers are weak. The bowi exhibits the wide form
associateci with a weak subgrade, but with the sharpness or high central curvature of the weak-
toplayer case. Thus, a qualitative interpretation can be made by evafuating the basin shape (in
conjunction with the maximm deflection or basin depth). Wide means soft lower layers a d o r
a weak subgrade whiie shaq central mature means sofl upper layers. In quantitative tenns,
shape is interpreted with regard to the relative elastic stifiiiess of the Mereut layers.
In the interpretation of deflection bains, for a giwn load and contact area, and a aven
set of measured FWD deflectiom and layer thicbiesses, the task is fint to find the elastic
stifniess vahies of all iayers, and thea o k critical values such as saains, etc. With refemce to


Figure. 5.2 [Jung (198911, the most potent of these parameters are: (i) the total vertid
defieaion under the load; (ü) the elastic stiflhess or modulus of the subgrade, E, (i) the
horizontal tensiie strain a the bottom of the asphaltic layer uader the load; (iv) the vertical
defiedon on top of subgrade, at the load axk; and (v) the vaiical compr&e stress and main
on top of the subgrade, at the load axis.
The sbape of the deflection bowl under a static wheel load is symmetricai around the
loaded a r e . whereas, in the case of a moving wheei, the defiection bowl takes on a non-arri-
symmetrical shape. The eIastic portion of the ddection occurs almost instantaneously, but the
rebound after the load has passed is time-dependent.(Clayton, Sparks and Associates [1980]).
The matu re and horizontai strain in the asphalt conmete layer under the load axis can
be caldated d i r d y fiom the measured deflections. The bituminous layer depth (Hl) is
regardeci as an elastic plate with circular symmetry of loads on top and bottom. Figure. 5.3
(Jung [1989], page 7) shows this plate and the geometry of the deflection bowl. The horizontal
aspbalt concrete main under the load is caiculated by using measued ddections and near the
center of the load. The foilowiag equations describe ma tu re and main [Jung (1 988)]:


S train
Substmiting for K i. e. add 5.1 and 5.2
w here:
K = curvature under load axis;
& = strah at the bottom (+) or top (-) of the asphaltic layer;
a = radius of loaded area, in mm;
Hi = thickness of asphalt concrete layer, in mm;
YI = measured deflection under the load axis, in mm;
Y. = deflection at the edge of the loaded area.
The deflection Y, at the edge of the loaded ~ e a is not one of the measurd values; it
must be dculated approximately by non-linear interpolation, using a bellarve hction, as
iiiustrated in Figure. 5.3. Equation 5.1 represents the mature in the irnrnediate vicinïty of the
load axis, within a radius quai to or less than the asphalt conmete thickness as ilhisirated in
Figure. 5.4. Using the Chevron N-layer program, the deflection is calcuiated at three points of
the pavement surfaw, one at the center of the loaded area (&), one at a distance of 600 mm of

Figure 5.4 Shape of Dehtion Bowi Using Ch- N-Layer (fmm Van da LUO (19821)

the cenfer (&) and one at a distance of ZOO0 mm (dm). The shape of the ddection bowl is
characterized by the surface matu re index (SCI), calculateci by subtracting & f?om d. as in
Figure.5.5. In relation to the maximum deflection d, the SC1 values gives an indication of the
pavement properties wbile dm can be relateci to bearuig capacity of the subgrade. As
descxibed in v d t z , (1977)], the modulus of the subgrade can be caicuiated fkom the
defiection 6 measured at a distance r fiom the center of the loaded area, which has a contact
stress, g, aud a radius of a.
where:
E, = the modules of subgrade;
a = radius of the loaded ara;
4 = vertical deflection measured at distance r;
r = distance ffom the center;
V = is the Poisson's ratio; and
6 = contact stress.
In this study the FWD ddection basias of severai hypothetical asphalt concrete
pavements in various conditions of cracking were wmputed by using a general-purpose finite-
element analysis program. The theoreticaüy computed deflection basins were then evaluated to


detemine how they could be used to ascenain the type and extent of distress in asphah
conmete pavements. The results f?om this theoretical study provided an assessment of the
importance of cracking in the interpretation of FWD work. One of the major concems of
many practicing engineers has been how valid the deflection-based back-caldation prograrns
are in measuring accurate, dependable layer moduli of flexible pavements not ody with varying
tbiclmesses, material types, and properties, but also with diffèrent levels of damage in the
pavements due to trafic and environmental conditions. For acample, it has been observeci
(Jung and StoUe [1992]) in pavements that are cracked or broken, that the value of the
effeaive moduhis profile decreases. When the pavement is very severely cracked and
completely broken, this value must W y approach a vaiue that represents the subgrade
modulus, i.e., the modulus near the top of the subgrade at and around the test load.
5.2. Characterization of the Deflection Basin
It has been recognized for some t h e that it is not d c i e n t to match the maximum
deflection alone in aniving at the layer moduli (Vaswani [ 1 97 11; Majidzadeh 1 1 9821; Hoftinan
and Thompson [1982]). These authors have quantifieci the shape of the deflection basin with
various parameters.
Vaswani introduced the concept of "spreadabiiity" based on his work with the
Dynaflect. The spreadability is defineci as below:

where D, DI, &, a, and D4 are the defiections at the center and at the four other
seasors with the Dynaflect. He then developed an enpirical method relating the
spreadabiity and rmcimum deflection for Viginia abgrades. Tbis approach is
considered limiteci for the foilowing reasans:
1) The sprdabiiity was based on the caldation of the area of the basin based on
Boussinesq's equation. Thus he arrived at a unique vaiue for the minimum spreadability. The
rationale for this is not quite obvious.
2) In m e r developing his nomographic charts, he suggests an expression for the average
modulus for the pavement structure as below:
This expression does not agree with the ones mggesteci by others (e.g. Odemark
[1949], Ueshita md Meyerhof [1976], Briaud et.al. (19871). AU these latter authors use some
form of power fùnctions to amive at the equivalent modulus. It is suggested that a simple
weighted average as suggested by Vaswani is unrealistic.
3) In some of his -les he has shown that pavements witb lower spreadability deflect less
than thox with higher speadability. Thus the pavement acts as a rigid pavement because the

thin sandwich layer is cornpletely confinecf and acts as part of the much more ngid confkg
layers. Similatly the pavement with its thick sandwich layer acts essentiaiiy as a two-layer
system. The third iayer acts as a rigid bottom. The point here is tbat it is not enough to consider
the area alone or some measure of spreadabdity or rigidity of the pavement. Instead îhe
ma tu re of the basin as weli as the contribution of the individual layers must be taken into
account.
Huang [197 11 introâuced the concept of using the curvature of the structure for the
evaluation of pavements. He carrieci out theoretical studies relating ddection, amahire of the
d a c e , the temile main at the bottom of the aspbait layer and the compressive strain at the top
of the subgrade. He derived dimensionless parameters f?om these quantities and expressecl
them as hctions of vertical and radial stresses and modular ratios. These fùnctions could be
evaluated with published data by Jones il9621 or Peattie [1962]. Huang [197 11 published
tabulated values relating deflections, surface wature, asphalt tende main, and subgrade
compressive strains to the ratios of layer thicknesses and the modular ratio. While his resuhs
are usefiil for pararnetric stuclies, they are of much less use in direct application to the
evaluation of deflection bains obtained tiom the modem deflection testing machines.
Majidzadeh [1982] relates the concepts of curvature directly to the deflection basins
obtained by Dynaûect. He introduces the various cuntatwe indices such as the Surface
Curvature Index (SCI), the Base Curvatwe Index @CI), as well as Spreadability. He also
points out the significance of the deflection recordeci by the fZth sensor under the Dynaflect.
The various indices are given by:
SC1 = W1 - Wz = Defiection differential between the first and the second sensors.

BCI = W4 - Ws = Mection Merentiai between the fourth and the f3Ih sensors.
Spreadability is dl defined according to Vaswani, Eqn (5.5). Based on studies on pavements
in Ohio State, Majidzadeh [1982] makes the foiiowing observations:
1) The SC1 is a strong inâicator of fatigue cracking in the aspbalt layer. The SC1 is dependent
on the thickness of the surface layer as weli as the ratio El&. For thick pavements, SC1
deaaises wiîh an inaeasing El/& depending on the thickness of the wface layer. This is not
quite in accordance with Huang's theoretical r d t s as shown in Figure. 5.5. Açcording to
Huang, for thick pavements @/a >1.0) in Figure. 5.5 the modular ratio El/E2. has little
influence. For thinner pavements the tbickness wiii have a strong iduence because of excessive
radial strains; however the modular ratio has little influence;
2) SC1 is also a stroog indicator of vertical strains in the subgrade;
3) BCI is a good indicator of stresses and strains in the base course. Some state authorities
specifL tolerance limits to BCI to ensure adequate performance of the pavements;
4) The fifth sensor reading Ws is a unique parameter which depends on the subgrade modulus
and is practically independent of the stiffness of the pavement smicture;
5) Spreadability, by itseif is not a very usefiil concept in deteminhg the adequacy of the
pavement structure (compare the discussion of Vaswani's results above).
H o h and Thompson 119821 fowarded the idea of the "meo" of the deflection
basin. The "area" is literaîly - area of a cross-section of the defieaion basin, computed by the
trapezoidai d e as shown in Figure. 5.6. For a curvilinear profile, such as the deflection basin,
Simpson's nile would have suited betta. The ciifference between the two methods of
computation would amount between 5% and 12%. The area bas the units of length and for the

FWO lrrputsr L#ld

Boussinesq we will be 1 1 DO [ in2 or cm2 or m2] and for a perfectly ngid body wiii be 72 Do
[in2 or cm2 or m2] when using the FWD with seven semors. In the case of Road Rater where
there are four sensors, the area works out to be 11 DO and 36 DO for the two cases rnentioned
above. The authors tested a number of road sections in Illuiois usiog the IUI-PAVE
algofithm. Their principal conclusion was that, while there cwld be a number of combinations
of d c e and subgrade moduli which would yield a satisfatory match of the maximum
deflection or the area individually, the unique solution is the one which matches both
simultaneously. But, by implication, their clah limited their solutions to two-layer pavements.
Anani [1979] and Wang and Anani [1981] reporteci a method of dyz ing defleaion
bains obtained fiom Road Rater tests in Pennsylvaaia. Starting fiom the stress bction
soiution (Eqn. 2.3) for the differentiai equations for the stresses in a layer (Eqns. 2.1 and 2.2)
they found an expression for the d a c e deflection at any radial distance, r, fiom the load point
as:
where:
q = the load per unit ara;
a = radius of the loaded area;
E 1 = moduius of elasticity ( = resilient modulus);
JO = Bessel hction of order zero;
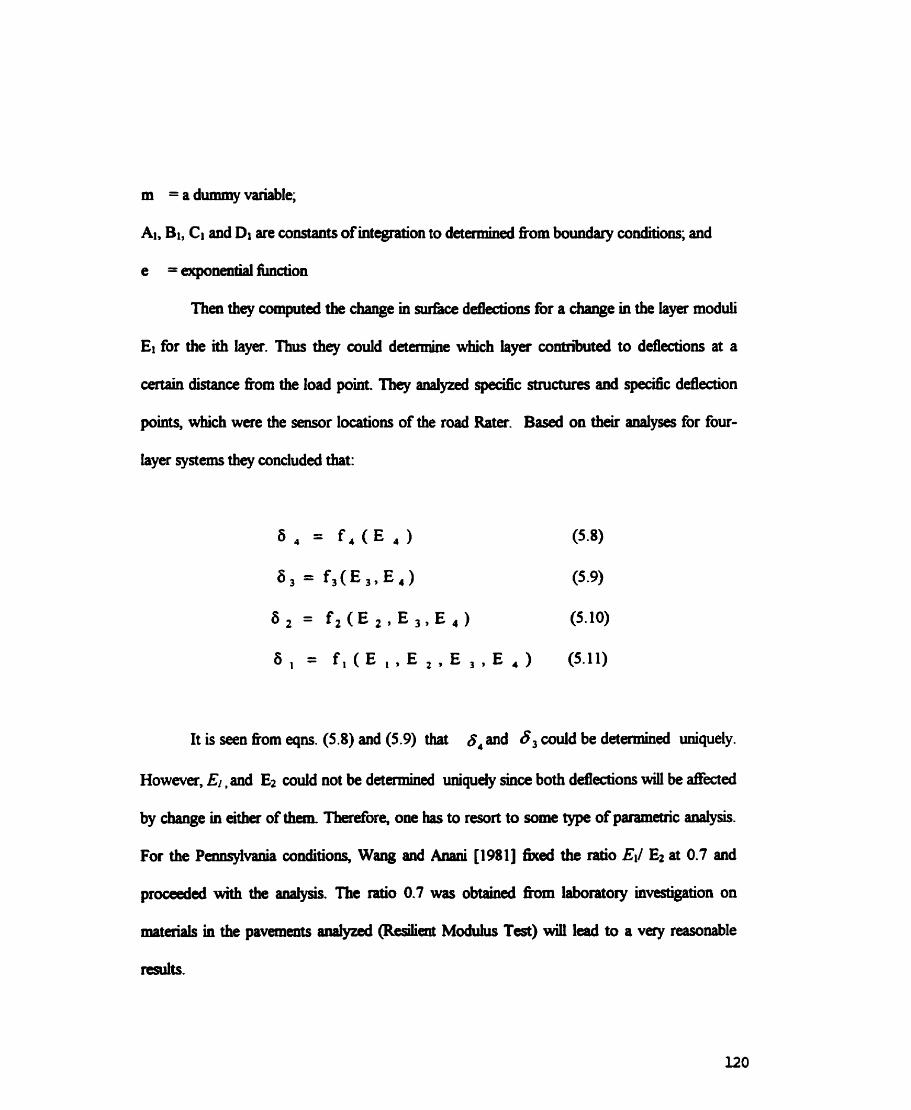
m = a dummy variable;
Al, BI, Ci and Dl are constants of integration to detennined fkom boundary conditions; and
e = arponential function
nien they computed the change in nuface ddedions for a cbange in the layer moduli
El for the ith laya. Thus they muld determine which layer contributcd to deflections at a
certain distance h m the load point They anai@ specinc structures and s p d c deflection
points, which w m the sensor locations of the road Rater. B a d on their analyses for four-
Iayer systerns they concluded that:
It is seen fiom eqns. (5.8) and (5.9) that 6, and 8, cauld be detenaineci uniquely.
However, El. and E2 could not be detamwd uniqudy since both defiedons wiü be affécted
by change in either of than Therefore7 one has to resort to some type of pararnetric anaiysis.
For the PenriSylvania conditions, Wang and ad [1981] fixed the ratio El/ E2 at 0.7 and
p r d e d with the adysis. The ratio 0.7 was obtaineû h m laboratory investigation on
materials in the pavements adyzed (Rwilient Moduhis Test) Win lead to a very reasonable
results.

Ali the works cited so fbr have deah with defiection basins generated by Dydm or
Road Rater. With these machines the number of sensors is four for the Road Rater and five for
the DynaBect. Thus, it is relatively easy to ident@ the contributing layer to the deflections
se& by a particular seasor ( see for example Wang and Anani cited above). Such discussions
are not found in the literature for the TWD ddections though the analysis pro- such as
ISSEM-4 (which uses the ELSYM-5 as an analysis subrouthe) can uidicate the radial influence
of the layers. In general it was reported by Ganpathy [ 19941 that the saisors 5,6 and 7 wiil be
iaauenced primariy by the subgrade, seasors 3 and 4 are infiuenced by al1 layers below the
d a c e while al1 the layen influence deflections 1 and 2. Brown et-al. [1986] pubiished
somewhat shilar results as show in Figure. 5.7. In this Figure, Di is the merence in
deflections between the i-th and j-th sensors. Thus fiom Figure. 5.7, one concludes that
deflections 1 and 2 are most sensitive to the m e s s of surfâce (there is some contribution
fiom the other layers too) while deflections 2 and 4 are govemed by base layers and the rest
primarily by subgrade. It was suggested that a detailed study of FWD deflection bowls would
be usefùl to establish criteria similar to those found for the Dynaflect or Road Rater. A
parametric study to investigate the sensitivity to theoretid deflection bains to the rate of
change of moduli for a rigid pavement was p e r f o d by Uddin et. al. [ 19821. An interesting
conclusion fiom this study was that a deflection basin is least sensitive to a change in the
moduli of intemediate layers and highly sensitive to even smali changes in the subgrade
moddus. Rie o h important parameter that infiuenced theoretical deflection response is
thickness. It was concluded that, if design thicknesses were assumed for detlection-basin
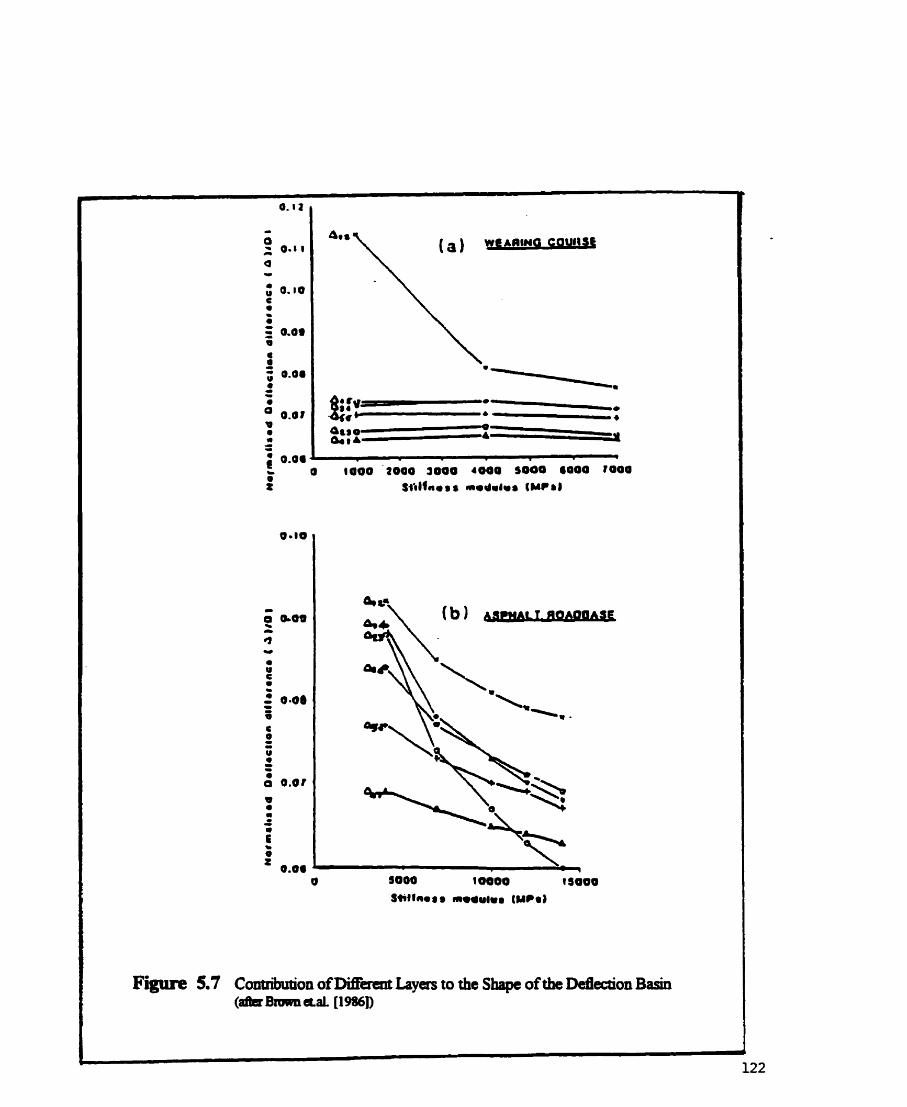
Figure 5.7 Contribution of Di&mn Layers to the S h a p of the Defiedon Basin ( a i k Bxuwn a a L (1 986))

anaiysis, slight variations in actual thichesses of intermediate layers were not as critical as
those of the d a c p asphait cmcrete layer.
The above discussion bas focused attention on the danculty one encounters in
interpreting the defiection basin obtained fiom any of the defiection measuring devices.
Clearly, in order to get an acceptable solution it is necessary to know the contribution of
individual layers to the overali deflection at each sensor point. Only then can one isolate the
contribution of each layer to the entire deflection basin. The area of the deflection basin for
which any layer is responsible would be inversely proponional to the m e s s of that layer.
Ilnis, in a numerical d y s i s of the basin, for each iteration, the modulus value for each Iayer
must be adjusted in accordance with its contribution to the overd deflection-basin, or in
inverse proportion to the area of the deflection basin calculated in that iteration. This is the
conceptual h e w o r k that wiU be employed in the numerical evaiuation, following Ganapathy
[1994].
5.3 Uncracked Pavements Analysis
As mentioned eariier, the ANSYS program is a general-purpose fiteslement
program, which can handle any number of Iayers with Merent material properties. In this
study, series of cases were modeled and the results were compared with each other as weii as
with other published r d t s . Before cornidering the aacked pavements, some sets of
uncracked pavements were wnsidered. One, two, three and four layers were modeled to test

the flexiiihty of this program in modeliag such uises with diaerent conditions. The dimensions
of the pavement section were kept the same for the four uws. ûne of these cases is a
compound pavement which is needed in practicai asphaltic pavements such as in overlay
design. Material properties were varied to dernonstrate the eEéct of changes in the material
properties. Table 5.1 txmamks the material properties as wefl as the dimensions that were
used in this analysis. In d cases that were investigated, the section radius (i.e width of 2-
dunemionai model) was 15 meters and the dephs were vaiied accordhg to each situation The
total depth of the model in each case was 15.0 m. The selenion of m a t d properties was
based on some actual data that available in the literature and to represent different design
practicies.

Table 5.1 Material Properties and Dimensions of the Pavement Structure
Two
Four
-- - --
Poisson's ratios 1 Dimensions in m

5.3.1 One Layer Mode1
For the one layer model the resuits are presented in Table 5.2 (Appendix IV) and
Figure 5.8. The r d t s were compared with the closed solution ushg Boussinesq's equation
(2.7) to see the diffetence between the two solutions. The maximum deflection under the load
using ANSYS was 0.41 mm and the maximum deflection using Boussinesq's method was 0.47
mm. The clifference between the two methods was about 13%. In Figure 5.8, the deflection
bowl is plotteci for the soft &es (low modulus) case of Table 5.1. The load is represented
by the wheel load of 600 KPa applied on a cirdar disc 300 mm in diameter. An examination
of Figure 5.8 indicates that the deflection basin bas a pronounced ddection under the load.
The curve also shows that at a distance of 2.5 m fiom the load the deflection approaches zero,
and the change in the dope of deflection shape after 0.5 m is ves, small. On the other hand, at
less than 0.50 meter, the change in the siope of the deflection bowl is sigmficantly pronounced.
Typical finiteslement meshes for ail the investigated models are given in Appendiv III. This
cornparison with Boussinesq's solution assists in ve-g the validity of the fite-element
program in anaiyzing this type of problem.
5.3.2 Two -Layer Mode1
In the two layer system with low-stifhess in top and very low m e s s supporti~g
layers, the maximum defiectjon tends to increase by about 120% compared with the one layer

No Crack; One Layer:E1=300 MPa for a section of 15 m X 15 m
O 500 f O00 1500 2000 2500 Horizontal Distance in mm
+ One Soft Layer in a Section 15mX 15 m
Figure 5.8 Deflection Basin: One-Layer Mode1
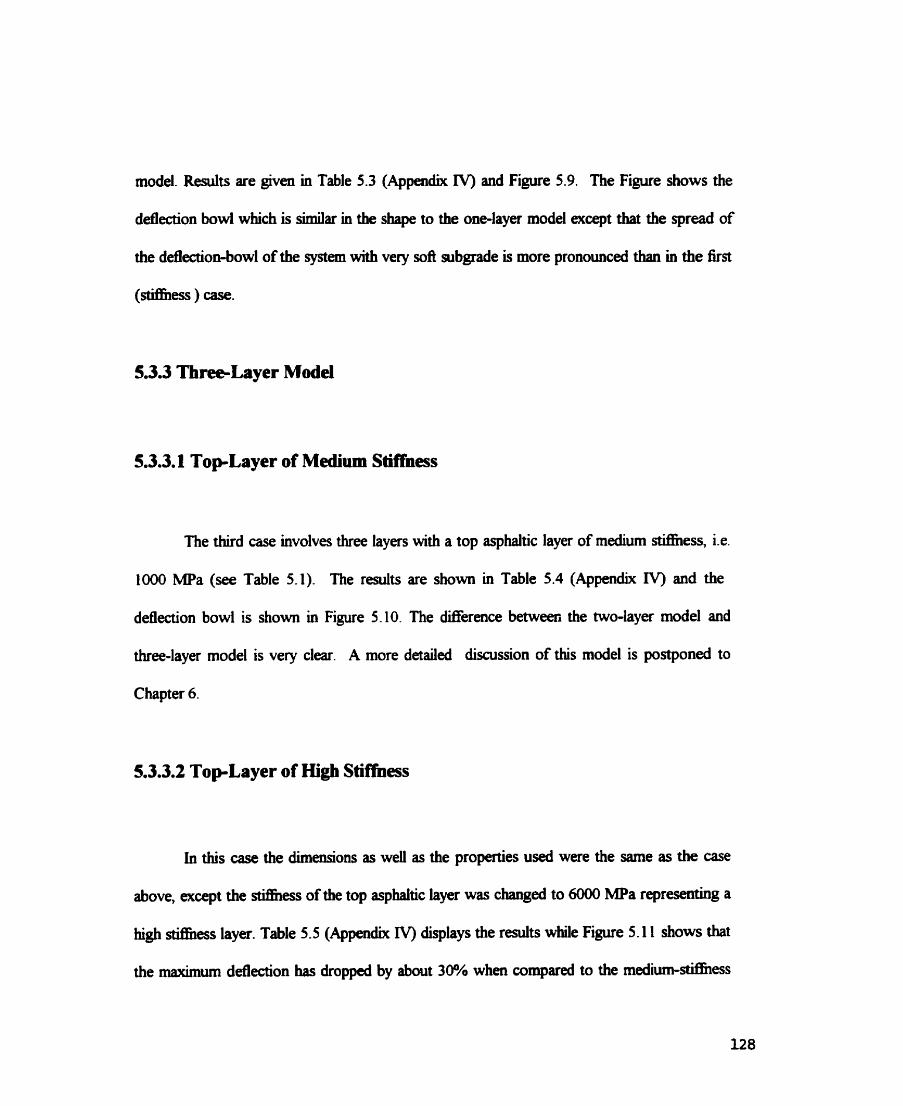
modd. Results are given in Table 5.3 (Appendix IV) and Figure 5.9. The Figure shows the
deflection bowl which is similar in the shape to the one-layer model except that the spread of
the deflection-bowl of the system with vecy sofl subgrade is more pronounced than in the fint
(StifEless) case.
5.3.3.1 TopLayer of Medium Stiffiess
The third case involves three layers with a top asphaltic layer of medium m e s s , i.e.
1000 MPa (see Table 5.1). The results are shown in Table 5.4 (Appendix IV) and the
deflection bowl is show in Figure 5.10. The ditference between the two-layer model and
three-layer model is very clear. A more detaiied discussion of this model is postponed to
Chapter 6.
5.3.3.2 TopLayer of High S t i h s
in this case the dimensions as well as the properties used were the same as the case
above, except the stifhess of the top asphaltic layer was changed to 6000 MPa representing a
high stiflîiess layer. Table 5.5 (Appendix IV) displays the results while Figure 5.1 1 shows that
the maximum defiection has dropped by about 3% when cornpared to the m e d i u m ~ e s s

No Crack; Two Laycn:E1=350, E2=70 MPa forascctionof 15 m X 15 m
O 1 O00 2000 3000 4000 Horizontal Distance in mm
Figure 5.9 DeBeaion Basin: Two-Layer Mode1

No Crack; Th-LayecE1s(l O 3 S O J O ) f 0 r a ~ o n o f 1 5 m X 15 m
1000 1500 2000 Horizontal Distancc in mm
1 + Three-LayerMed. SàfFness Top layer 1
Fi y re 5.10 Defieaion Basin: Three-Layer Model (Top Layer of 1 000 Mpa)

No Crack; Tbr~Layer:E's(6000,350,70) for a section of 15 rn X 15 m
1000 1500 2000 Horizontal Distance in mm
+ Three Layers: Very Stiff Top Layer
Figure 5.1 1 Deflection Basin: Three-Layer Mode1 (Top layer of 6000 Mpa)

top layer case above. Merences ôetween the two three-layers cases above wiil be discussed in
some detail in Chapter 6.
5.3.4 Four-Layer Model
The last case to be dûcussed here is a four layers system, in which layer stifbess were
chosen to represent the rather common overlay case. The second layer fiom the d a c e was
assumed to have a very high stiffness representing a rigid pavement, which has been overlain
with asphaitic concrae. A 1ûûûO MPa d f i h e s s was assumed in the second layer while the
other layers were kept the same as in case of three layen with a medium &ess top layer. The
resuits of the andysis was represented in Figure 5.12 and Table 5.6 (Appendix IV). Figure 5.12
shows the deflection bowl, clearly indicating how an extra strong layer bas a large efféct on the
spread and the depth of the deflection basin. More detailed discussion of this case also wili
foilow in Chapter 6.
5.3.5 Effect of Radius to Outer Boundary of Cylindrical Model
The effect of v-g the radius, or distance to the outer boundary, of the rotationally
symmetricai (cylindncai) mode1 was exploreci to see what minirmun radius was needed to
provide reaiïstic edge conditions-partiMy vanishingiy smd ddections at the outer edge of
the defiection bowl. These cases were considend: rd = 3.5 m; rd = 7.5 m and r~ 4 5 m.
Depths of the cylinder to rigid layer were in al1 cases 15 m, following Ganapathy [1994]. Two

Four-Layer: Very Stiff 2nd Layer for a section of 15 m X 15 m; No crack
O 500 1000 1500 2000 2500 3000 Horizontal Distance in mm
1 + Very Stiff Second Layer(Four Layers) 1
Figure 5.12 Defledon Basin: Four-Layer Mode1 (Second Layer of 10000 MPa)

m e s s e s of asphait top layer, El were ernployed: 1000 MPa, and 6000 MPa while Ez and E3
were held at 350 MPa and 70 MPa respeaively in al1 cases. Resuits are given in Tables 5.7
and 5.8 (Appendoc IV), Figures 5-13 and 5.14 show the deflectioa bowls obtained. From
Figures 5.13 and 5.14, it is seen that for the cases of y = 3 .O m and 7.5 m, three are residual
deflections at the outer edge, indicating that the edge is influencing the results. Physically, this
meam that the 3.0 m radius or 7.5 m radius cylinder of the mode1 is behaving some wbat Wre a
cylinder of soi1 confineci by a ngid, fiectionless cyiindrical boundary. It is ody as the radius
reaches 15 m that the residual ddection at the edge of the mode1 becornes vaoishingiy small,
and the boundary can be considered as not affectiag the resuiting defleaion bowl.
5.4 Pavement With Open Cracks
The analysis ia this thesis concentrated on the effect of cracks on the deflection bowl
obtained by the Falling Weight Deflectometer FWD on flexible pavements. The moa serious
type of pavement cracks (defined as "open cracks") were those that were of sufncient width
that no aggregate interlock was available for load t rder across the cracks.
In tbis study the cracks were assumed to start nom the top asphaltic laya petrathg
down to the bottom of the subgrade of the pavement. A physicai crack was assumed to be in
the range of 5-25 mm in width. The section that was d y z e d was geometridy similar to the


- Md. Rdius: PL 1000350.70
F(gure 5.14 Defîection Basin Cornparison: Namw Cylinder of 3 m; Medium Siinder of 7.5
rn and h n g section of 15 m (Top Layer of 6OOO MPa)

ones that were uncfacked, described previously. The pavemat was assumed to be composed
of three layas: an asphalt layer of 100 mm thickness: a base course of 300 mm; and a subgrade
over 14 meters in depth, see Table 5.1. The material properties also were in the range of
practicai pavements in use. The elastic moduli are normally assumed to decrease as depth
increases. Howwer, the ANSYS program has the capabiity of dyzing a pavement of any
combination of matenais. The Poisson's ratio for each layer was kept less thm 0.5, to represent
real solid materials and to avoid programming problems at &y 0.5. The ANSYS finite
element rneshing that was used in this program was element type 42 (two dimensionai element
of two degrees of fieedom, Ux and Uy) as described in Appendix 1.
It was assumeci that the whole structure wiil deflect or deform oniy in the vertical
direction: Le. the structure was modeled as an axi-syrnmetrical system. The elements at the
bottom of the structure were considered to be rigidly supporteci, and it was assumed that no
movement could occur in the horizontal and vertical direction (üx = O and Uy = O), at the
bottom node points. At the radial boundary of the model, no horizontal movement was
considered for node points (Ux =O); only Uy was non-zero for these boundary nodes.
Elsewhere both Ux and Uy were considered to be non-zero. Crack locations were assumed at
Mereut places dong the top horizontal surface, close to the load and at various distances
nom the appiied load. Different combinations are discussed in the foilowing paragraphs.
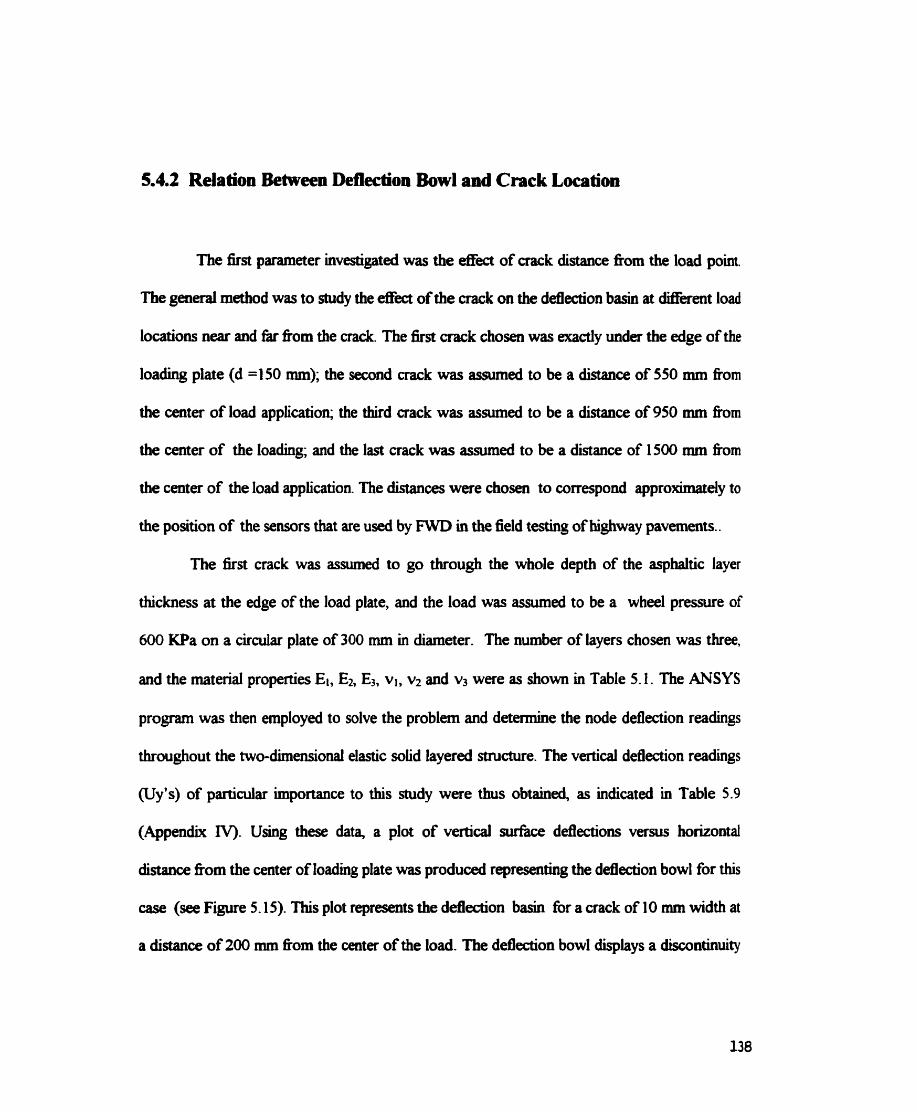
5.4.2 Relation Between Deflection Bowl and Crack Location
The first parameter investigated was the &ect of crack distance fiom the load poim.
The general method was to study the &kt of the crack on the defiection basin at different load
locations near and Far nom the crack. The first crack chosen was exady under the edge of the
loading plate (d 4 5 0 mm); the second crack was assw~ed to be a distance of 550 mm fiom
the center of load application; the third crack was assumed to be a distance of 950 mm from
the center of the loading; and the last crack was assumed to be a distance of 1500 mm from
the center of the load application. The distances were chosen to correspond approximately to
the position of the sensors that are used by FWD in the field testhg of highway pavements..
The first crack was assumed to go through the whole depth of the asphaltic layer
thickness at the edge of the load plate, and the load was assumed to be a wheel pressure of
600 KPa on a circular plate of 300 mm in diameter. The number of layers chosen was t h e ,
and the material properties El, E2, E3, vi, vz and v3 were as show in Table 5.1. The ANSYS
program was then employed to solve the problem and detennifle the node deflection readings
throughout the two-dimensional elastic solid layered structure. The vertical deflection readuigs
(Uy's) of partidar importance to this study were thus obtained, as indicated in Table 5.9
(Appendix TV). Using these data, a plot of vertical surfâce defiedons versus horizontal
distance fiom the center of loadmg plate was produced represeating the defiection bowl for this
case (see Figure 5.15). This plot represents the ddection basin for a crack of 10 mm width at
a distance of 200 mm 6om the center of the load. The defleztion bowl displays a discontinuity

Crack of 10 mm at 200 mm from the Center of the Load
O 1 O00 2000 3000 4000 5000 Horizontal Distance in mm
Figure 5.15 Deflection Basin for a Crack of 10 mm at 200 mm
The Vicinity of the 10 mm-Crack at 200 mm
400 600 800 1000 1 200 Horizontal Disiancc in mm
-
+ Single Crack of IO mm
Figure 5.16 Deflection Basin Around the Crack of 10 mm at 200 mm

ai the crack as show in Figure 5.15. Figure S. 16 shows that portion of the ddection bowl in
the vianity of the crack at a larger d e .
In the second case the crack distance was increased to 550 mm fiom the center of the
load, keeping the and other parameters constant and foliowing the sarne procedures. The
output is the ddeaion in Y direction (the defieaion bowl) at the node locations (Table 5.10,
Appendix fV). A plot of the deflection versus the horizontal distance was produceci in a
mamer siniilar to the fint case. However, it is apparent that the discontinuity in the ddection
bowl at the crack is signiacantly d e r than that in the previous case where the crack was at
the edge of the load application plate as seen in Figure 5.17. Figure 5.18 shows the
discontinuity at 550 mm in more detail.
In the third case the distance to the 10-mm crack was incr& to close to 950 mm
(lm) fiom the center of the load application, again with a IO-mm crack width. It appears
clearly that the discontinuty in the deflection bowl at the crack is getting smafier as the crack
moves farther corn the load. As seen in Table 5.1 1 (Appendix IV), Figure 5.19, and to a larger
scale around the crack, in Figure 5.20. The bowl has the same general shape as the cases of
cracks at 200 mm and 550 mm, but the step or discontinuity is smaller.
F i y , a crack of 10 mm at a distance of 1500 mm (1.5 m) fiom the center was
assumed, keeping the same parameters as More. In this case the shape of the bowl is nearly as
smooth as and is close to the ones without a crack (Table 5.12 Appendix IV). The step in the
defleaion basin at the crack location has completely disappeared, and thus it a n be considered
that the crack has no d e c t on the ddection bowl at this distance. The pavement can be
considered un-cracked as in Figure 5.21 and 5.22. In other words, a crack at a far distance

Crack of 10 mm at 550 mm from the Center of Load
+ Single Crack: E's(1000,350.70)
Figure 5.17 Deflection Basin for a Crack of 10 mm at 550 mm
The Viciait?. of the 10 mm-Crmck at 550 mm
540 560 5 80 Horizontal Distance in mm
+ Single Crack of 1 0 mm at 5 5 0 mm
Figure 5.18 Deflection Basin Around the Crack of 10 mm at 550 mm

Crack of 10 mm at 950 mm from the Center of Load
O 1 O00 2000 3000 4000 5000 Horizontal Distance in mm
+ Single Crack: E's(1 OOO,350,70)
Figure S. 19 Deflection Basin for a Crack of 1 0 mm at 950 mm
Tbe Vicinity of the 10 mm-Crack at 900 mm
900 1000 1100 1200 1300 1400 1500 1600 Horizontal Distance in mm
-O- Crack of 10 mm at 900 mm
Figure 5.20 Deflection Basin Around the Crack of 10 mm at 950 mm
Crack of 10 mm at 1500 mm from the Load Center
2000 3000 Horizontal Distance in mm
+ Single Crack: E's(1000,350,70)
Figure 5.2 I Deflection Basin for a Crack of 10 mm at 1500 mm
Vicinity of the 10 mm-Crack at 1500 nun
1400 1600 1800 2000 2200 2400 Horizontal Distance in mm
+ Crack of 10 mm at 1500 mm
Figure 5.22 Ddection Basin Around the Crack of 10 mm at 1500 mm

fiom the load has no effm on the defîection bowi, a resuit that can be considered very usefù!
in field testing. ûne essential point that can be drawn âom tbis is that the step in the deflection
bowl eventualiy approacha zero as the crack is moved farther and farther from the center of
îhe load.
5.4.3 Relation Betweea Defiedion Bowl and Crack Width
The second series of tests explored the eEèct of the widtb of the crack. Crack widths of
10 mm, 15 mm and 25 mm were considered, on three layereâ systems where El = 1 O00 MPa,
E2= 350 MPa and Ei= 70 MPa. hl =IO0 mm, h2=300 mm, VI was 0.35, V 2 was 0.40 and
v3 was 0.45. Once again, the important displacements in this study were the iidlections in the
vertical direction (Uy) at the surface. The location of the set of deflection bowls for this series
is shown schematically in Table 5.2 and Figures 5.24, 5.26, 5.28, 5.30 and 5.32. The
correspondhg tabular results are show in Appendix N as Tables (5.9 to 5.20).
Examination of the deflection bowls tested in Table 5.2 indicates that, as expected, the
width of an open crack has littie or no effkct on the shape of the deflection basin. Thus it may
be concluded that in the analysis of a cracked layered system, if a crack cannot develop
aggregate interlock, regardless of its width, it may be simply considered "open". Thus the 10-
mm crack width analyses of this thesis apply to al1 practica! widths of open cracks. The
implication of this is disnissed M e r in Chapter 6.

Table 5.2 The &ect of crack width on the deflection bowl
Crack Location in mm Crack of 10 mm
(distance fiom center of load) (width)
Crack of 15 mm
(width)
Fig. 5.34
Crack of 25 mm
(width)

Crack of 15 mm at 200 mm from the Center of Load
O 1000 2000 3000 4000 5000 Horizontal Dispnce in mm
+ Singie Crack: E's (1 OOO,350,70)
Figure 5.23 Deflection Basin for a Crack of 1 5 mm at 200 mm
The Vicinity of the 15mm-Crack at 200 mm
400 600 Horizontal Distance in mm
r
+ Single Crack of 15 mm at 200 mm L
Figure 5.24 Defldon Basin Around the Crack of 15 mm at 200 mm

Crack of 25 mm at 200 mm from the Center of Load
1 O00 2000 3000 Horizontal Distance in mm
Figure 5.25 Deflection Basin for a Crack of 25 mm at 200 mm
The vkinity of ttie 25mm-Crack at 200 mm
200 400 600 800 Horizontal Distance in mm
n
+ Single Crack of 25 mm at 200 mm 4
Figure 5.26 Deflection Basin Around the Crack of 25 mm at 2 0 mm

Cr& of 15 mm at 550 from tbe Center of Load
- Single Crack: E s (1000,3~,70)1
Figure 5.27 Deflection Basin for a Crack of 15 mm at 550 mm
The Vicinity of the 15 mm-Crack at 550 mm
800 1000 1200 Horizontal Distance in mm
+ Crack of 15 mm at 550 mm *
Figure 5.28 Deneaion Basin Around the Crack of 15 mm at 550 mm

Crack of 25 mm at 550 mm fmm the Center of Load
2000 3000 Horizontal Dishacc in mm
+ Single Crack: E's (1000,350.70) h
Figure 5.29 Deflection Basin for a Crack of 25 mm at 550 mm
The Vicinity of the 25 mm-Crack at 550 mm
+ Crack of 25 mm at 550 mm
Figure 5.30 Deflection Basin Around the Crack of 25 mm at 550 mm

Crack of 15 mm at 950 mm from the Center of Load
+ Singe Crack: E's (1 OOO,3SO,7O)
Figure 5.31 Deflection Basin for a Crack of 15 mm at 950 mm
The Vicinity of the 15 mm Crack at 950 mm
1100 1200 1300 1400 Horizontal Distance in mm
Figure 5.32 Deflection Basin Around the Crack of 15 mm at 950 mm

Crack of 25 mm at 950 mm ftom the Center of Load
O 1000 2000 3000 4000 5000 Horizontal Distance in mm
( + Single Crack: E s (1000.350,70)1
Figure 5.33 Deflection Basin for a Crack of 25 mm at 950 mm

Crack of 15 mm at 1 5 0 mm from the Center of Laad
2000 3000 Horizontal Distance in mm
+ S u e Crack: E's (1000,350,70)
Figure 5.34 Deflection Basin for a Crack of 15 mm at 1500 mm

Crack of 25 mm at 1500 mm from the Center of Load
2000 3000 Horizontal Distance in mm
+ Single Crack: E's (1000,350,70)
Figure 5.35 Deflection Basin for a Crack of 25 mm at 1500 mm

5.4.4 Relation Betweea Deflection Bowl and Crack Depth
This section examines the enéa of crack propagation or crack petration tbrough the
asphaltic layes or through the pavement structure. Examining cracks of depth O mm (closed
crack); 50 mm (balf asphaltic iayer) and 100 nmi (M aspbaltic layer) on tbree layered systems
where El = 1000 MPq E2 =350 MPa and E3 = 70 MPa while Vi = 0.35; V2 =0.4û and
v3 = 0.45 was done. A IO-mm crack width was considered in all the three cases and the
results are shown in Figures 5.1 O, 5.36,5.3 7 and 5.15. In the first case, a continuous pavement
was assumed (no crack). Figure 5.10 shows that the spread of the deflection bowl of the
system is more pronounced than in the cracked pavement. In the second case the crack was
increased to 50 mm 6om the top of the asphaltic layer, keeping the other parameters constant
and foilowing the same procedures. A plot of the defleaion versus the horizontal distance was
produced in a marner sirnilu to the first case. It is apparent that there is now a discontinuity in
the deflection bowl. The deflection bowl displays a discontinuity at the crack as shown in
Figure 5.36. in the third case the depth was increased to a 100 mm fiom the top of the
asphaltic layer, again with a IO-mm crack width, and it appears clearly that the discontinuity in
the deflection bowl is larger than in the previous case as show in Figure 5.15. From Figures
5.15 and 5.36 it is clear that the maximum ddection in a 100-mm depth is larger than the 50
mm depth. Also the &op near the crack is more pronounced in the 100-mm depth than in the
50-mm depth This cleafiy m e . tbat the depth of the crack plays a role on the shape of the
deflection bowl. See Tables 5.4,s -9 and 5 -2 1 (Appendk IV).

Crack o f 10 mm at d/2 at 200 mm £tom Center of Load
O 1 O00 2000 3000 4000 5000 Horizontal Distancc in mm
Figure 5.36 Deflection Basin for a Crack of 10 mm at d/2 at 200 mm
Vicinity of the 10 mm-Crack at d/2 at 200 mm
140 160 180 200 220 240 260 Horizontal Distance in mm
Figure 5.37 Deflection Basin Around the Crack of 10 mm at dC! at 200 mm

5.4.5 Effect of Double Cracks
Althwgh the presence of one crack does not lead to a big Werence in the maximum
defledon as compared to the unmked case, the question remaineci as to the &èct of multiple
cracks on the defiection bowis. To this en4 double cracks were assumed baving a 10-mm
width and located at 200 mm and 800 mm eom the center of load (600 mm apart). The
dimensions and material propaties of case 3 were used. (that is: hl = 100 mm; irz = 300
= 14600mm;El =1000Mpa;E2=350MPq E3=70MPa; V , =0.35; v2 =0.40and v3 =
0.45.) to assist in cornparison. Figure 5.38 shows the resulthg deflection bowl, while Figures
5.39 and 5.40 show the deflection bowl in the vicinity of the individual cracks respectively. The
tabular results are given in Table 5.22 (Appendk IV). It can be seen that an anomaly ocaires
similar to that obtained in the shgie-crack case, when Figure 5.38 is compared to Figure 5.15.
The second crack, as seen in Figure 5.40, clearly has litde additional effect on the deflection
bowl. The maximum deflection in Figure 5.38 is within 98 % of that of the single crack case in
Figure 5.15.

Double Cracks of 10 mm at 200 mm and 550 mm from the Center of Load
1 O00 2000 3000 Horizontal Distance in mm
+ Double cracks: E's (1000,350,70)
Figure 5.38 Deflection Basin Double Cracks of 10 mm at 200 mm and 600 mm

Viiinic of Cmck 1 of 10 mm at 200 mm fkom the Center of Load
150 200 250 300 350 400 450 500 Horizontal Distance in mm
Figure 5.39 Deflection Basin Around Crack 1 of 10 mm at 200 mm

Vicinity of Crack il at 550 mm from Crack 1
+ Crack il at 550 mm fiom Crack I
Figure 5.40 Deflection Basin Around Crack II of 10 mm at 600 mm fiom Crack 1

5.5 Pavement with closed Cracks
In this part, pavement seaions with closed cracks, tbat is when aggregate interlock
plays a role, is examineci. Materiai propertiw and other pavement features were kept the same,
as for previous analyses i-e. those of the three-layer case were used (see Table 5.1, page 127).
The only parameters that were varied were the dimemsions of the crack and the degree of load
transferability aaoss the crack (fiom one side to the other). A Iimiting case is that of assuming
a fiill contact: the pavement is continuous and cm be treated as if it is uncracked. The
uncracked model was then used as a basis of cornparison for the predicted deflection basins,
assuming Mme son of load trader. The crack location chosen were the same as for the case
of open cracks. The crack widths that were chosen were 1 mm, 2 mm, 5 mm, 10 mm, 15 mm,
25 mm and 50 mm. The load in the top layer was treated as if a part of it were tramferreci
across the faces of the crack, whiie the spring element model that was used in the analysis of
closed cracks is shown in Figure 5.41. The concept of load transfer across an interlocked
crack is that often used in rigid pavements, and is show schematidy in Figure 5.42.
Load Tramfer Efficiency (LTE) has been defined in ternis of unloaded and loaded
deflection as foilows:
where:
LTE = load transfêr eflJciency (in %)

Loaded Area Unloaded Area
Figure 5.41 Concept of Load T d e r

Base course
Figure 5.42 Aggregate Interlock (spring element) for closed crack at 200 mm

Uw = ddection of surface, on loaded side of crack;
UMd = defiection of surface, on ualoaded side of crack.
It was assumed tbat when crack widths are ynall, or aggregate is large, the aggregates
remain in contact with each other or provides interlock. In the mode1 the aggregate interlock
was represented by a spring with the aggregate interlock load being tramfimeci through the
spring which has a spring coetlicient (k. ). Seven cases wae irmesiigated: the fùst case the
crack is I mm, 2 mm, 5 mm, 10 mm, 15 mm, 25 mm, and 50 mm in width at 200 mm(c1ose to
the load) with Ks of 6896.6 MPa.
It is seen that the load transfer efficiency &TE) varies to a certain extent with the
crack width. The maximum LTE possible is 100% when the width is zero@erfixt aggregate
interlock). It is also noticed that as the crack gets wider the LTE decrpases. The maximum
deflection does not change significantly as compared with open crack cases.
By studying the aggregate interlock models, ùi the fkst case taking an example of Ks of
6896.6 MPa and the crack width of 5 mm at a distance of 200 mm, the LTE was detennined as
mentioned above. As an example how this works, for the first case the Unloaded deflection
(Uyud) = -0.452 mm, the Loaded deflection (Uyld) = -0.498 mm; then the load transfèr given
by using the equation (5.1 2), LTE = 9 1%. In the second case of a crack of 10 mm at 200 mm
&om the load point, the LTE = 88%. Tables 5.23 to 5.36 (Appendk N) and Figures 5.43-5.56
show these r d t s and how the aggregate interlock mechanism works.
The load t r d e r iacreases as the crack gets narrower and oarrower resulting in the
load etnciency increasing as expected, and as shown in Figure 5.57. Since the aggregate
interlock was tried at different widths at a Eixed distance of 200 mm and the results did not

Closed Crack Using Spring Elemcnt at 200 mm Iiom the Center of Loaâ
1000 1500 2000 2500 3000 3 500 Distance in mm
1 + 1 mm-Crack width: E's (1 O O O , ~ S O , ~ O ) 1
F i p n 5.43 Deflection Basin Of a Closed Crack of 1 mm at 200 mm
(Aggregate Interlock)

Closed Crack Using Spring Elernent at 200 mm fiorn the Center of Load
500 1000 1500 2000 2500 3000 3 500 Distance in mm
+ 2 mm-Crack width: E's (1 OOO,35O,îO)
Figure 5.44 Deflection Basin Ma Closed Crack of 2 mm at 200 mm
(Aggregate Interlock)

Closed Crack Using Spring Element at 200 mm fiom the Center of Load
O 500 1 O00 1500 2000 2500 3000 3 500 Horizontal Distance in mm
1 + 5 mm-Crack width; E's (1000,350,70) (
Figure 5.45 Deflection Basin Ofa Closed Crack of 5 mm at 200 mm
(Aggregate hterlock)

Closcd Crack Using Spring Element at 200 mm fiom the Center of Load
O 500 1000 1500 ZOO0 2500 3000 3500 Horizontal Distance in mm
Figure 5.46 Deflection Basin Ofa Closed Crack of 10 mm at 200 mm
(Aggregate Interlock)

Cioscd Crack Using Spring Elemeat at 200 mm fiom the Center of Load
-c 15 mm-Crack width: E's (1 OOO,3SO,7O)
Figure 5.47 Defiection Basin Ma Closed Crack of 15 mm at 200 mm
(Aggregate Interlock)

Closed Crack Using Spring Element at 200 mm fiom the Center of Load
-- -- --
Figure 5.48 Deflection Basin Ma Closed Crack of 25 mm at 200 mm
(Aggregate Interlock)

Closed Crack Using Spring EIement at 200 mm h m the Center of Load
500 1 O00 1500 2000 2500 3000 3500 Horizontal: Distancc in mm
-
+ 50 mrn-Crack width: E's (1 000.350.70)
Figure 5.49 Deflection Basin Of a Closed Crack of 50 mm at 200 mm
(Aggregate Interlock)
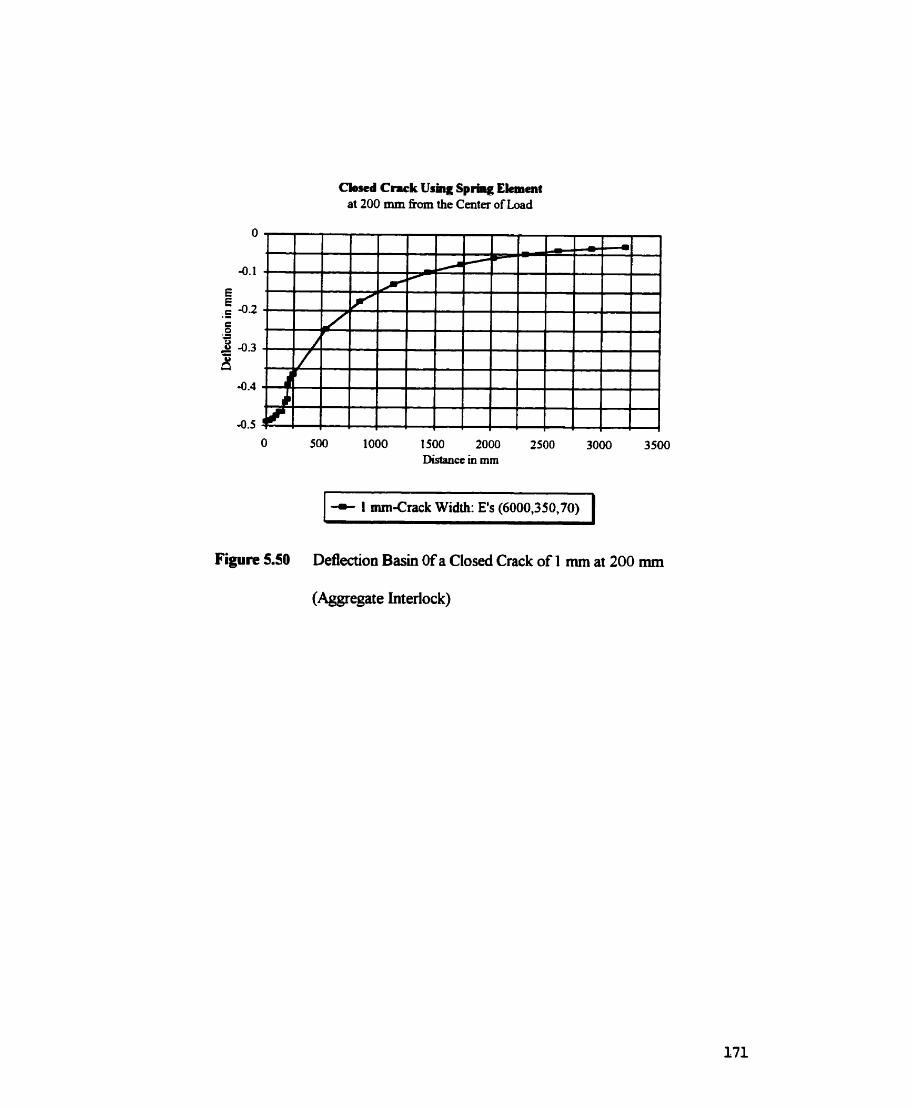
Closcd Crick Ushg Spring Ekment at 200 mm fiom the Center of Load
O 500 1 O00 1500 2000 2500 3000 3500 Distance in mm
1 + 1 -Crack Width: E's (6000,350,70) 1
Figure 5.50 Deflection Basin Ma Closed Crack of 1 mm at 200 mm
(Aggregate Interlock)

+ 2 mm-lrack Width: E's (6000,350,70)
Figure 5.51 Deflection Basin Ofa Closed Crack of 2 mm at 200 mm
(Aggregate Interlock)

Closed Crcack Using Spnng Element at 200 mm &om the Center of Load
1500 2000 2500 3000 Distance in mm
Figure 5.52 Deflection Basin M a Closed Crack of 5 mm at 200 mm
(Aggregate Interlock)
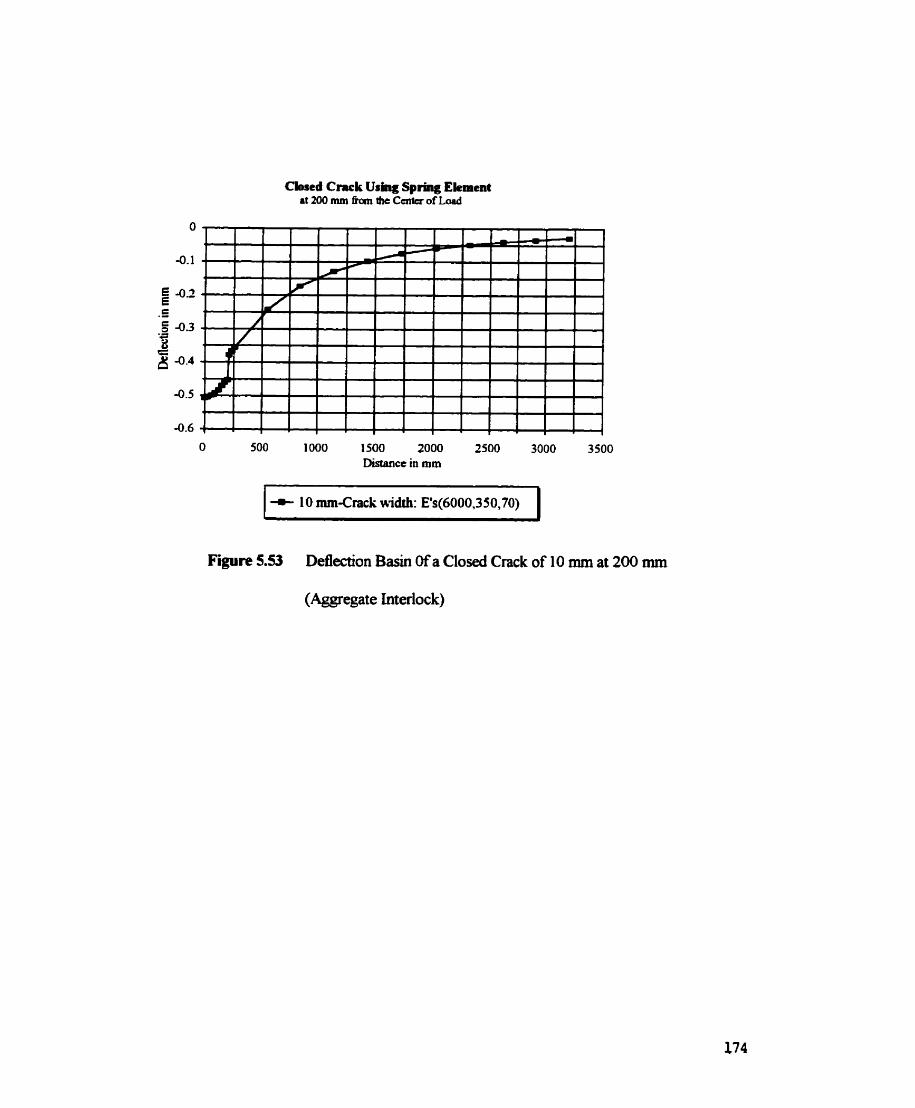
Closed Crrck Usiag Spring Ekment rt 200 mm fiam Oie Ccntcr of Lord
O 500 1 O00 1500 2000 2500 3000 3500 Distance in mm
Figure 5.53 Deflection Basin ûf a Closed Crack of 10 mm at 200 mm
(Aggregate Interlock)

Closed Crack Usiag Spring Ekment at 200 mm fiom the Center kom Load
1 4- 15 mm-Crack Width: E s (6000.350,70) 1
Figure 5.54 Deflection Basin M a Closed Crack of 15 mm at 200 mm
(Aggregate Interlock)

Closed Crack Using Spring Eiement at 200 mm fiom the Center of Load
1 O00 1500 2000 2500 3000 3500 Distance in mm
- - - - ---- -- - 1 + 25 mm-Crack Width: E s (6000.350,70) 1
Figure 5.55 Deflection Basin ûf a Closed Crack of 25 mm at 200 mm
(Aggregate Interlock)

Clased Crack Us@ Spring Ekment at 200 mm f5om the Center of Load
- 50 rnm-Crack Width: E's (6000,350.70)
Figure 5.56 Deflection Basin Ma Closed Crack of 50 mm at 200 mm
(Aggregate Interlock)

Load transfer Eff. Considering agg. interlock for difFerent crack-widths
O 1 O 20 30 40 50 Crack Width in mm
t Aggregate interlock Using Spring 1
Figure 5.57 Relatiomhip Betwgn Crack width and Load Transfer Efficiency
(Spring Element)

show any significant e8éa on the shape of the d e f i d o n bowl it is concludeci tbat the
aggregate imnlodr bas only d e ik t on the defiedon bowl. One final ranark has to be
added here, is that it is possible that the spring will act the same in both tension and
compression. If one is studying the stresses or strains at the acurate points within the surface
then a tension spriag will give a dinérrnt result of compression spring. But the back-caldation
method depends on defiechon of layer as a whole, thadore, for the pirpose of this study it is
expected that a compression spring will give identical results as a tension spring of the same
!aifEless.

DISCUSSION OF RESULTS
In this Cbapter the resuhs of the finiteelement anaiysis are âiscussed in some detail to
give the ceacier a broader understanding of the findings and contribution of this thesis. The
analysis disaisses the effect of the cracks on the defledon basin, taking into consideration
some crack characteristics such as width, crack depth, how far the crack was from the lo&g
point, and the &kt of tight or interiocked, cracks. A finitcelement gd-purpose program
was used to build modeis of cracked pavement and un-cracked pavement. The mdeis were
checked and the r d t s were represeated by tables and graphs to show the sigdcant hdings
of this study. 'Iair discussion focusses on the hdings obtained during testhg and verification
of the anaiyticai models used.

6.2 Findings Obtaimd Duriag Testing and Verification of Mode1
6.2.1 Uncracked Pavements
Un-cracked flexible pavement rnodels were investigated prior to the cracked sections,
to test the applicability of the model as weii as the applicabiIity of the program. As mentiond
in Chapter 5, four cases were imrestigated in detaii: one layer, two layers (of two different
stifniesses), t h e layen and four layers. The purpose of comparing the one and two layers, two
and three layers and three and four layen is that the sbape of detlection bowls is changing and
important where as the cornparison of maximum deflection has no meaning. Figure 6.1 shows
a cornparison of the deflection b a s b in a one-layer model and hvo-layer model. Cornparison
of the two plots reveals that the area under the graph (representing the volume of revolution of
the deflection bowl in 3 dimensions) for one layer is about one-third of the a r a for two layers.
The one-layer model shows that the maximum deflection was smder than the maximum
deflection of two layers, and the distribution of the deflectioa readings was smoother and more
regularly arranged in the WO-layer case. From this graph it can be concluded, as expected, that
the number of layers as weii as the material &ess play a major role in shaping the deflection
basin. From Figure 6.1 it can aiso be observed tbat the dope for one layer firom 0-500 mm
changes rapidly, indicating less abiüty to disüibute wheel loads, than for the two-layer system.
One final point to be added here is tbat in comparing the one-layer solution by fhite-element
Cornparison between One Layer and Two Layers: no crack
1000 1500 2000 Horizontal Distance in mm
+ Two Layers:E 1 =300 and E2=70 MPa. + One Layer: E I= 300 m a .
Figure 6.1 Deflection Basin Cornparison of One Layer and Two Layers (no crack)

mode1 with the ciassical closed solution *en by Boussinesq, the maximum deflection of the
two methods are wittiio 13% of one another.
In cornparhg the two- and thnx- layer methods, the ddection bwIs are shown in
Figure 6.2. From this Figure it can be seen that the mmchmm ddection of the two-layer
system is about 20% more tban tbat for three layers. However, the area under the m e is
aimost the same, but in the two-layer case, the dope is more steep in the nrSt 500 mm, before
levehg off. In the three-layer system, the defiection basin dope changes smoothiy and
graduaUy. This leads to the conchision that by addïng one more laya of bigha stiflhess, the
loads and stresses are distributed more evenly. From Figure 6.2 it can be also concluded that in
both cases the material properties have an &ect on the distribution of deflection close to the
load, whiie beyond 500 mm the materiai properties have little e f f i on the deflection bowl.
This point is clearly demonstrated in Figure 6.3 which compares three layers with dEerent top-
layer &&esses (asphaltic stifïness of lûûû and 6000 m a ) . It Û obvious that the m e s s of
asphaltic layer plays a very si@cant role in the ddection basin near the load. In Figure 6.3,
the effect of material &es of the asphalt layer has becorne insignifiant at a distance of
around 1000 mm fiom the center of the loading. Beyond lûûû mm the m e s coimide h o s t
completely. &cause the top -layer StifFnesses were so Mirent in the case stuclied, it may be
possible to assume that beymd one meter fiom the applied load, the role of the material
properties of the upper layas do not have a major influence on the defleztion bowl.
Figure 6.4 compares three- and four-layer systems, for the case of a vay s t 8 second
layer (the asphaitic concrete over a rigid pavement or "overlay" case). The defiection bowl
appean n o d for the three-layer case but for the four-layer (over lay) case, the defiection

Coparison between Two Layen and Three Layers: no crack
O 500 1000 1500 2000 2500 3000 Horizontal Distance in mm
+ Two Layers: E s (300,70) + Three Layers: E's (1 000,350.70) 1 Figure 6.2 Deflection Basin Cornparison between Two layers and Three layers (no crack)

Cornparhm bctwmi Thme Layen 1000 and 6000 MPa. top layer
O 500 1 O00 1500 2000 2500 3000 Horizontal Distancc in mm
Figure 63 Deflection Basin Cornparison Between Three-Layer System
with ZOO0 and 6000 MPa. sti5ess top-layer

Cornparison between Three and Four Layers
Horizontai distance in mm
+ Three Layers: Top Layer 1000 MPa
* Four Layers:Second Layer 10000 MP,
Figure 6.4 Deflection Basin Cornparison of Three (top layer stitniess 1 O00 Mpa.)
and Four Layers (second layer m e s s 10000 Mpa.)

basin has a quite distinctive shape it seexus to be aîmost a straight Iw near the load. This
indicates that the d e n c e of a high stifbess in th second laya has a signifiant cffect on the
defiection basip demeashg the ana by about 25%. Thus a strong iayer has a very Sgnüicant
&ect on the defiection bowl, clmgmg the shape of the a w e at a distances les than one
meter. Mer one meter the ddected sbape seems to be insedive to the second-layer material
stiifhess. These obsemations lead one to conclude that in practice, in the range af one meter,
materiai properties and hyer configuration of the upper iayer are particuiariy significaut.
Figure 6.5 is sirnüar to Figure 6.4 but with a auch M e r toplayer, as in the 3-layer
case. Again the maximum ddection is much higher in the three-layer system, and again in the
four-layer system the shape of the ddection bowl near the load is almost a d g h t lhe. In the
three-layer system the shape is one familiar in horizontai layered systems. Again the material
properties have an e f f i on the deflection basin ody at a distance about one meta fiom the
applied load, b o n d which the shape of the defiection basin appean to be iasenZtive to the
stiffness of the upper layers. The area under the curve is clearly higher in the three-layer case
than in the four-layer case. Figure 6.6 compares al1 the four cases and it is clear tbat at beyond
approximately of 1; meters, the role of &&es of the upper layers does not have a si@cant
-or on the deflection basin.

Comparison between Three and Four Layers
1000 1500 2000 Horizontal Distance in mm
-- -- - - - -- 1 + Four Layers: Second IO000 MPa + Wee ~ayei: ~ o i ~ a y e r 6000 MPa 1 -
Figure 6.5 Deflection Bash Comparison between Three layers
and Four layers 6000 and 10000 MPa. Respectively

Comparisons between Four Cases wîth different Stifhesses
1 O00 2000 3000 Horizontal Distance in mm
+ Two Layen: E's 300,70) + Three Layers: E's (1 000,350,70)
+ Three Layers: E's (6000.350,70) Four Layers: E's (1 OOO,lOOOO,3SO)
Figure 6.6 Deflection Basins Cornparison of al Cases

6.2.2 Effect of the Seetion A ~ i y z e d
Figure 6.7 displays two sections only of a 3-meter radius (or width of model) with a
1 5-meter depth, for cases 1OOO MPa and 6000 MPa top layer stiflhesses. This Figure iliustrates
clearly the influence of the stiffhess of the asphaltic layer, the two cases agreeing in the general
shape of the ddection basin while the maimnim deflection being Iowa in the case of 6000
MPa by about of 15%. Cornparhg these two cases with the section of 15 meters by 15 meten,
they tend to be similar in maximum deflection. It is obvious that the two cases of 1000 and
6000 MPa toplayer sti8iiess are difrent or@ in the maximum defiection One finai point
worth mention4 here is that the spreading over the distance on the horizontal axis seems to be
more widely spread and smooth in the case of 6000 MPa over 1000 MPa. Figure 6.8
represents two curves of 1000 MPa and 6ûûû MPa for a secbon of 7.5 meter wide and 15
meters deep. One could conclude that there is a S'imilarity between the two cases in temis of the
deflection basin dupe but the maximum deflection for 1000 MPa is higher than the 6000 MPa
by about I S%, and the spreading of the 6000 MPa is smoother than the case of Io00 MPa.
Again, the essentid thing is that the awature is les with a M e r upper layer than with a d e r
upper layer. This in t u . means less strain in the material and hence ôetter performance against
cracking, settiement and nitting. The 3-meter and 7.5-meter wide models are provided to show
that even while the outer boundary may have same &kt on the model, the general trends of
the more accurate 15-meter wide cases are observed.
Cracks of ciiffirent wiwidths and depths, located at Werent locations fiom the loadhg
application, were analyzed. Che of the objective of this research was to show the importance of

Comparison between maximum and medium Stiffaess for 3m radius and 1 5 m depth
4- Short Section: E's (1000,350,70) + Short Section: Es (6000,350,70)
Figure 6.7 Deflection Basin Comparison of Three-Layer Short Section
Comparison between Marimum and Medium Sm. for 7.5 m radius and 15 m depth
4000 Distance in mm
+ Medium Section: E's (1 OOO,3SO,7O)+ medium Section: E's (6OOOJ 5O,7O) - - -. -- -
Figure 6.8 Deflection Basin Comparison of Three Layers of Medium Section

avoiding cracks during testing when the crack is withh a certain distance, and to show ways of
deaiing with these cracks when they cannot be avoided. This guidance gives the pavement
engineer or testhg agency a dear idea wbm to start testing and where to put the FWD
sensors.
Deflections in the horizontai and verticai directions (üx and Uy) were caicuiated. For
cornparison, the defieztion rneasufements for unaadred pavements were aîso determined
usiag the same fioitcdement generai-purpose program The shape of the deflection bowl was
plotted for both cracked and un-cracked pavement. The defiection bowls were compared to
one another and the Merences in the deflection basnS noted. Three-layered pavements were
employed with properties shown in Table 5.2, page M.
6.2.3 Cracked Pavements
6.2.3.1 Deflection as a Function of Distance from the Load
In discussing open cracks in pavements, Figure 5.1 5 or 5.1 6 @age 139) &strates the
deflection sbape of a IO-mm crack at a distance of 200 mm. That Figure shows a step in the
deflected shape under the crack, which is v q signifiant near the load and around the crack
itseE This step causes the shape of the deflection bowl to Mer fiom that of the un-cracked
pavements and shows that the cracks defiaitely bave an &kt on the defiection basin (and
co~~~equently on the back-caiculation procedures). More than just infhiencing the shape of the
defiection basin, it shows a loss of rigidity of the pavement ('i particular on the upper layer).

The form of the defieaion bowl is seasitive to nearoess of the crack to the edge of the loadhg
plate, as seen in the case of the crack at 200 mm. In a<amiomg the 1 Obmi crack at a distance
of 550 mm, Figure 5.17 or 5.18 @age 141) shows a step under the crack and in the vicinity of
the crack but in this case this step is seen to be d e r than in the previous case. This finding
suggests that the &ect of the crack dies out as distance between crack and load increases. in
generai the two cases appear to k vay smiilar in shape and in th& maximum defiection vahie.
When considerhg the case of two cracks at 200 mm and 600 mm, distances, the influence of
the second crack was almost trifie. The material &ess in the layers seem to have more effkt
on the maximum ddeztion than does crack location. When the second crack was 1000 mm
fiom the load, the step under the far crack almost vanishes, and the far crack bas almost no
&kt on the sbape of the basin near the load (Figure 5.19 or 5.20 page 142).
Finally, when the distance to the crack was 10 times the radius of the loading plate or
l5ûû mm fiom center of the load application, Figure 5.21 or 5.22 (page 143) shows that the
step under the load vanishes and it is as if no crack exists in the pavement structure. Figure
5.21 shows also that the effkct on the deflection bowl is only signifiant if the crack is close to
the load, not at far distances fiom the load. These resuits show that beyond about 1.5 meter the
FWD operators need not pay attention to the crack location. They should tty to avoid these
type of cracks d e n they are in the vicinity of the load (and a distance up to 1500 mm 6rom the
center of the loading plate). If the operaton m o t avoid cracks in close proxdty to the
load, then the nature of these close-in cracks (width, distauces, orientation, extent) shouid be
c a r d y remrded as part of the testing protocol, so that the comction prOCBdWes discussed in
Chapter 7. can be appiied.

6.2.3.2 Deflection as a Fmction Crack Width
For d-ssing the e&a of the crack width on the ddection bowl, Figures 6.9 and 6.10
were prepared as examples. From these Figures typicai plots were obtained for 10 mm, 15 mm,
or 25 mm, at 200 mm, 550 mm, 950 mm or 1500 mm distances fiom the -ter of the loading
plate. The two cases are demonstrated to show that there is no &kt of crack width on the
ddection bowi, at 200 mm and at 550 mm. It cm be seen that the steps under the crack and
close to it are very similar and can not be distinguished fiom one awther -hace they m o t be
considered as signifiant bar in ddection basin anaiyses. The maximum defiections seem to
be almost identical in ail the cases that were investigated no matter what the crack width As a
general observation, it has been shown that, once a crack has opened, its &kt on the
deflection bowl is the same, regardless of whether the crack is narrow or wide, as long as there
is no load t r d e r across the crack faces. This observation is consistent with basic priaciples of
the mechanics of solids.
6.2.3.3 Deflection as a Function of Crack Depth
Cracks of a depth of dl2 also was investigated and the r d t s shown in Figure 5.36 or
5.37 (page 155). This figure shows that the depth of a crack has no si@cant &kt on the
deflection bowl - the maximum ddection is smÿkr to other investigated cases for fidi depth
cracks. As mentioned in Chapter 5, the thra depths that were investigated in tbis thesis were O,

Comparison of the widttis: 10J5 &25 mm at 200 mm hm the center of load
1000 2000 3000 4000 Horizontal Distance in mm
4 Crack of 10 mm at 150 mm + Crack of 15 mm at 150 mm
+ Crack of 25 mm at 150 mm 1 Figure 6.9 Deflection Basin Comparison of 10,15 and 25 mm Cracks at 200 mm
(Points for di 3 graphs h o s t coincident)
Coarprtan of tbnc widthr at 550 mm h m the centa OC I d
, 1 I I I I 1 1 I I I I
O I o 0 0 2000 3000 4000 5000 Horizontal Distance in mm
+ Crack o f 10 nnn at 550 mm + Crack of 15 mm at 550 mm
+ Crack of 25 mm at 550 mm
Figure 6.10 Deflection Basin Cornparison of 1 O, 1 5 and 25 mm Crack at 550 mm
(Points for aii 3 mhs almost coincident)

dl2 and fiill depth of the asphaitic layer (i.e. O, 50 and 100 mm deep). The step near the crack
for dl2 and that for fU depth were very similar and ciifferences were considerd to be
insigniscant. Based on this hding no W e r investigation of the &kt of the crack depth on
the deflection bowl was considered necessary.
Another case amidered in tbis study is the &kt of more than one crack. As shown
Figure 5.40 (page 159), the &ect of a second crack is i.@cant on the maximum defiection,
at M e r distauces tiom the load. The ody visible e&ct is at a closer distance and around the
crack itseIfl which leads one to conchide that the nurnber of cracks as well as their locations
seems to have little sisnificant influence on the ddection basin, once the first and closest bas
been considered. Comequently it was coacluded tbat there was no need to investigate more
than the two cases mdoned in Chapter 5. The fkst crack was assurnd to be 200 mm fiom
the center of load, and the second crack was placed 600 mm fiom the first crack. Figures 5.39
and 5.40 (page 158 and 159) show the deflection bowl around the first and the second crack.
The deflection bowl appears not to be affected by the second crack leading to the cunclusion
that once the first crack has changed the deflection bowl the second crack bas very liale
M e r effect, and could be considered as non-existent.
Cracks have been characterized in ternis of width, depth, and pavement thickness as
weii as the materid propaties. As mentioned above, analysis has been d e to examine the
&cct of each and every one of these parameters on the dededon bowls. The r d t of this
anaiysis is tbat the operator of the FWD should pay attention to the cracks in the flexible
pavement and shodd be of great interest to pavement engheers who la& awareness of these
faas. Avoidhg the cracks or joints indicates thai data shall be categorized in two types for

data collections: (i) data without cracks and (i) data with cracks. Current back-calculation
prOCeCh3Ces are aot capable of considering the existence of aacks in the pavement near the
load. As was mentioned More the distance of the cracks fkom the applied load has an &kt
on the analysis ushg any general-purpose finite-eIement program. The effective âistance of the
crack on the deflection basin that would be cmsidaed was in the vicinity of 10 tiws the radius
of the loading plate. This meam that FWD tests shouid take into consideration the cracks at a
distance of less or equal to 10 times the radius of the l o a d . plate, but ifthe distance is -ter
than 1500 mm the FWD oprator should not pay attention to these cracks due to the faa that
these cracks do not have any dèct on the defldon basins. As dernonstrateci in Chapter 5,
sections with cracks beyond the 1500 mm behave very similady to un-cracked sections and
should be d y r e d by ANSYS program in the same m e r tbat is used io d y z i n g un-
cracked pavements. These findings are also applicable to field work, in that cracks should not
be ignored in coliecting data as well as in anaiyzing such data.
6.2.3.4 Deflection as a Fuaction of Aggregate Interlock
One final case that was analyzed was that of closed cracks, or cases of aggregate
interlock. ûnce a crack is initiateci in the pavement, its load carryiag capacity in the vicinity of
the cracks is dmiirgshed because the load cannot be transferred My across the crack.
However, in the initial stages before the crack becornes wide, the aggregates are large enough
on both faces of the crack that thq are in & i v e contact. This is t m e d aggregate interlock.
As long as there is aggregate interlock (probably in cracks l e s than 10 mm) some load will

indeed be &erred acrou the crack. Eventuaüy the crack will demionte, tbe aggregate
interlock lost and there d be no more load transfer across the crack. The ANSYS program
Iibrary has a speafic element designateci to this type of problem, d e d the spriag element (ET
14). The widths investigated were 1 mm, 2 mm, 5 mm, 10 mm, 15 mm, 25 mm and 50 mm
were. Figures 5.45-5.49 (pages 166-170) show the &kt of the aggregate interlock which the
d y s t refèrs to it as a closed cracks. The Figures are plotted only for 5 mm, 10 mm, 15 mm,
25 mm, and 50 nim It is clear tbat as the distance gets closer to the load and the width gets
smaller, the sbape of the ddeaion bowl begins to look diament. From the results presented in
Chapta 5 and in Tables 5.23 to 5.36 one is led to the conclusion that the LTE decreases as the
width of the crack increases. F i d y , Figure 6.11 shows the relation h e e n LTE% and the
crack width up to 50 m. Figure 6.1 1 may be used to predict the load transfer efficiency for a
given widtb of crack, when the load is applied in close proximîty to the crack.
The writer wouid like to stress the importance of cracks on the defieaion basin in
both data collection and in office analysis to try to understand the behavior of the deflection
bowls in general cases. By applying this type of anaiysis to prove that due to cracks, pavement
stifniess decreases, one has the basis for m e r investigation, and such a study could add a
major contribution to this area. This analysis cwld also extendeci to investigate how these
cracks are affected by aging factors as suggested by Ganapathy [ 19941 in bis predictions for the
sites that he has studied having extreme weather conditions such as Manitoba, Canada. Once a
crack bas propagated to a ce& depth, the influence on the ddection bowls is very
sismficant. The investigation of the mechankm of crack propagation as weil as the causes of

Load trander Eff. Considering agg. interlock for ditrerent crack-widths
O 10 20 3 0 40 50 Crack Width in mm
1 + Aggregate interlock Using Spring
Fi yre 6. i l Relationship Between Crack width and Load Transfer Efficiency
(Spring Element)

cracks are beyond the îope of this study. Howwer, the crack propagation as weii as the
causes of cracks are important in flexible pavements.
F i , fiom the adys is of both cracked, and unuacked pavements, one could
bvestigate how pavements aui be loaded and what types of cracks occur under various loads.
This woukl be very usefùl to the pavement engineers for modifjring and updaîing the
procedures of collecting data so that Pavement Management System (PMS) can be used in a
more efficient way.
It is very important to emphas'ize the type of models that the analyst shouid use; and
these analyses were done on a stn~chiral type of model which is an approximation to the exact
pavement structure. If one wants to get accurate r d t s , one might extend this study to a three
dimemional representation type of modei, which rqresents the exact situation in real Me. b
should be realued that for M e r investigation beyond the mechanistic type of analysis, one
should be consider the air-space model rather than the structural type of mode!.
CORRELATION WITH FIELD
DATA
7.1 Introduction
The purpose of this Chapter is to highhght points that shouid be considered when
Iinking the fidd data to the theoretical anaiysis aad to raise some questions about data
collection as weii as the difficuities that exist in the field.
The selective field data r d t s that are presented in tbis thesis are prelimuiaiy because
the data are limiteci to only two Stes (i) PTH # 1 east of Whpeg on J d y 4, 1989 and ('i)
west of Portage La Prairie on June 6, 1990. However, these results are sigdicant because

they came fiom tests on m operating highway p a f o d as part of an internationai highway
research program. The r d t s obtained showed a similenty with the predicted ddection b-
discussed eaflier. The results of the analyses of the data from these two sites are presented io
the fom of graphs and tables. C l d y it is a d E d t ta& to transfer theoreticai r d t s to a
p d c a i field srniaiion Themy may not exactiy fit the actuai conditions, but should come
close to it, and one shouid be able to ercplain smaii differeaces wbich occur.
7.2 Resuits and Anaiysis
The longitudinal profile of the ddection measurements for the site at Portage La
Prairie is plotted to illustrate the variation of the deflection readings dong the analyzed section.
The maximum length of this section is about 500 meters. Figure 7.1 shows the profle of the
deflection measuremeats fiom station O to station 500. It can be seen fiom Figure 7.1 tbat the
ddection measurements in this section Vary considerably and some defiections seem to stand
out as important anomalies. For acample, the defiection at station 477 was -0.32 mm as
compared to an average of -0.21. It can be seen that the maximum deflection at the majority of
test locations range fkom -0.19 mm to -0.22 mm. The anomalous deflectioos at stations 125,
175 and 477, seen in Figure 7.1 could be qlained by some type of a crack under or near the
sensor malcing the d a d o n measuernents.
It codd be that, at these three locations, the operator of the FWD was not aware of or
did not notice the presence of cracks in piacing the equipment. The FWD is equipped with a
sopbisticated cornputer program tbat records its r e d b g s directly fiom the sensors. Therefiore,

200 300 Stations
+ SHRP Testing Routine 6/6/90
F i 7.1 Deflection Profile for Portage La Prairie

t would appear unlikely that these anomalies could have been produced by the equipment
M. It must also be noted that these locations are very old and many cracks bave beea
obsecved in most of them nair Portage (station 0.0 and station 477). Deflection bowk at these
two stations are show in Figure 7.2. The maximum defledions at these two stations vary
comideraby, even though tbey are fiom the same section of the road. The fom of the m e is
simikr in both cases. No step in the deflection a w e for station 477 is apparent, ahhough
crackhg is suspecteci. The main contribution to this depth of defiection basin couid be a crack
in the vicinity of the station 477, or possiily the R\rD saisor was posioneâ nght on the crack
itself. It should be noted that, ifa crack daes not cross the FWD seasor array then no step in
the affected defiection bowl wiü be detezted as show11 graphidy in Figure 7.3. On the other
band, it should be noted again that, if a crack does cross the FWD sensor array then a step in
the &ed deflection bowl wiU be detected as shown in Figure 7.3. This result then would
agree with the resuits from the theoretical aaalysis using ANSYS program
mer sites in eastem Manitoba were tested in the Summer of 1989 by FWD and a pair
of locations were chosen for analysis. Figure 7.4 shows the deflection basin for locations I and
2 on PTH # 1 east of Winnipeg near the Brokenhead Riva, from which it can be seen that the
maximum defiection is si@cantly larger than that west of Winaipeg near Portage, through the
depth of the asphaltic layers are about the same. Figure 7.4 ühistrates clearly the pronounced
difference between the two locations. As can be seen fiom location 2 the maximum deflection
is more than double that of location 1. Although the mawmmi deflections of the two sites vary
considerably, in spite of the fàct that the same cross seaion of the roadway has been
employed, the form of the arrve itseifis simiiar. No step in the defidon m e for Location 2

O 200 400 600 800 1ûûû 1 2 0 1 4 0 1600 Distance in mm
1 + station 0.00 t Station 477.00 6/6/90 1
Flyre 7.2 Dektion Basin for Two stations 0.0 and 477.

Uncracked Profile
a) Cracks not aossiag sensor array
b) Cracks crossing sensor amay
Figure 7.3 Effect of Crack Location of Defiection Bowl
O 200 400 600 800 Io00 1200 1400 1600 Horizontai Distance in mm
Figure 7.4 Defiection Basin for Location 1 and 2 for PTH W 1

is apparent, ahhough cracking is bigMy suspecteci. At a distance of about one meta fiom the
Ioading point the defiection bowls deviate and can be Merentiated fiom each other. On the
other band, beyond one meier the shapes of the deflection bowls coincide with one another and
can be seen as one unit. The main contn'butor to this depth of the ddection basin muld be a
crack in the vicinity of Location 2 or it is possible that the FWD seasor was nght on top of the
crack itseK It should be noted that, if a crack does not cross the FWD saisor vray then no
step in the siffected deflection bowl will be detected, as shown graphidy in Figure 7.3. A
car& examkation of Figure 7.4, reveais that the cause of this drop may be a crack, for its
&éct bas disappeared beyood one meter - an observation which agrees with the fiaclmg in the
theoretical anaiysis. Two other sites were chosen fkom PTH # 1, east of Wuiapeg illustrate the
importance of colîecting the data very carefully. Figure 7.5 shows the defleçtion bowl for
Locations 3 and 4. An examination of Figure 7.5 iadicates that most of the tirne, this b d of
result is obtained because the load is not ~eafed properly or the geophone is sticking or
otherwise maifunctioning. But there are times when there are other factors: eariy in the
moming the d a c e may be much colder; or there is a pocket of saturateci base; or a void. If
one cannot see the reason, one simply ignores such results for back-calculation. Several back-
dcuiation examples were given by [Ganapathy (1 994)l.
One final example fiom the east of WlILnipeg is a cornparison of four cases of flexible
pavement. The r d t s are show in Figure 7.6 in which the dupe of these defieaion bowls are
slightly different fiom one another. A car& exmination of Figure 7.6 reveals the foilowing:
(i) the maWmrm values range from -0.49 mm to -0.70 mm; (ii) the rate of changing dope is
ahnost the same; (6) again the shapes of the deflection bowls up to one meter are quite

Cornparison of FWD Field Data Location 3 and 4 ac PTH # 1. Mil89
+ Location 7. -i- Location 8.
Figure 7.5 Cornparison of Dektion Basins for Location 3 and 4

FWD Field Data Cornparison Locations 5,6,7 & 8 PTH # 1 4.7.89
O 200 400 600 a00 1000 1200 1400 1600 Distance in mm
1 + Location 5 Location 6+ Location 7 + Location 8 (
Figure 7.6 Cornparisons between Deflection Bowls for Location 5.6,7 and 8

the field data is that there were no remarks accompanying the collecteci data which wodd have
made one aware of speaal ciraimstances and how the data shouid be analyzed. More deiailed
field data are needed to hther anaiyze and to ver@ this observation The d e r remrnmends
that protocol concaaing crack observation be followed carfllly and regularly so tbat the data
collected do not lead to misleading conclusions.
Finally using theoretical data, it is possible to daive a "crack correction" procedwe to
correct the field data which inchides crack sections, this crack correction is a preIiminary and
needs more theoreticai data to generaiize t . in &.kt, this crack comection procedure wodd
smooth and "normalize" othewise erratic deflection bowl patterns. An example crack
correction m e , derived fiom the theoretical cracked-section data of section 5.4 is shown in
Figure 7.7. A crack conection procedure was derived fiom the theoretical r d t s preseoted in
Figures 5.25 to 5 -3 7. The maximum jump (drop) with deflection bowl at the crack location was
recordexi for cracks of 10 mm, 15 mm, and 25 mm at 150 mm, 550 mm, 900 mm and 1500
mm as in Table 7.1. The data in Table 7.1 were then used to develop a crack correction m e .
The crack correction auve correspondhg to the data in Table 7.1 is shown in Figure 7.7.
ûnce the crack correction m e has been developed, this curve can be used to adjust the field
deflection bowl data. Two cases arise ifthe nearest observed crack is doser than 1 meter (d,
0 Io00 mm): (i) ifthe field data(ddecti0n) from individual test points are available dong with
fieid observation of cracking near the test points or (i) if a string of field data(deflection) with
anomalies is avaiiable.

Correcrion Curve for the Drop Under the Crack
200 400 600 800 I o 0 0 1200 1400 1600 Distance in mm
+ Crack Correction Curve i
Figm 7.7 A Crack Correction Curve

distinct, while beyond one meter it seems that the shape of the defiedon bowls is very typical
and similar to one another. Figure 7.6 also shows that men though the data were collectecl
nom the same sites, and assumhg that a d o m seaion was employed, the maximum
deflections di&r significantly &om one another.
7.3 Discussion of Results
As has been sen i in Figures 7.1 to 7.6, unexpla id large deflection in nominaily
d o m test sections appear. These could be explained by sigdcant variations in material
properties, which is uniikely; or they d d be explained by the existence cracks in the vicinity
of these large deflections, in which case the testhg procedure shouid identifl these cracks (the
sewrity of these cracks; their positions; ..etc.).
Another point to be mentioned in looking at the field data, is that some fglse resuhs
were noticed. These fiilse results contribute to the intapretation of the data and might have a
Sgnificant in&ience on the back-caiculation resilts. Proper data coiiection procedure or
protocol mua be foliowed very careftlty, othewise the redts could be mislaihg and could
lead to erroneous hdings. The theoreticai analysis bas shown that a logical reason for a jump
in the deflection of the bowl a n be the result of a crack close to the load. Some of the
deflection bowls using field data showed a large deviatiom which again ties to the bdings of
the theoreticai adysis-
It is possible that the operator of the FWD apparatus was not aware of, or did not
notice, the presence of cracks in placing the equipment. A si@catlt point to be made about

Table 7.1 Data used in devdoping the cxack comction m e
Crackdistancein mm
or crack location 150 . 550 900 1500
Drop or Jump
25 mm -0.09 -0.02
O O
10 mm -0.07 -0.01 -0.002
O
15 mm -0.08 -0.01 -0.002
O

The pavement aigineer now bas the tool to analyze the field data and to correct it for
the presence of cracking. To &strate this concept, the followiog examples are provided.
Considering the field data with anomalies, gathereâ fkom Portage at station 477: Def,= -0.32
mm, and if the crack were right at the edge of loading ive. at a distance of 150 mm, the elastic
correction nom Figure 7.7 wouhl be: D = 0.08 mm, thadore, elasticity correcteci Def 477
= -0.32 M.08 = -0.24 mm.
Ifa crack is near the edge of loadmg plate and within the asphaltic layer, the asphaltic
layer may still act as an elastic material. But below the cracked bound layer, the granuiar base
and subbase may not be elastic. Therefore, the field deflection d u e s would be expected to be
higher than the purely elastic deflections. A g a . usiag station 477 at Portage as an example
and assuming the pronounced deviation fiom the regular pattern of maximum deflectîon at the
500-meter test section (Figure 7.1) is due to the Muence of a crack, then an approximation
and corrected Def «I =1/2 (Def 450 +Def 5~ ) or -0.21 mm This implies a cornedon due to
cracking in the real layereâ system of (-0.2 1 -(-0.32)) or = O. 1 1 mm rather than the purely
elastic co~ection of + 0.08 mm.
In summaty, the crack correction curve is very useful in correcthg the field data either
dyticaüy or experimentally, to allow for the e f f i of cracking on the deflection bowl data.
The analytic mrrection a w e itseIf may vary somewbat accordhg to the &ess assumptions
made in the theoretical analysis, and thedore, shodd be considerd tentative at this tirne.
This thesis indicates how the &éct of cracks in layered system may be calculateci and
how cracked eiastic layered system data can be used, either directiy, or indirdy to
compensate for cracking in pavement. The results of this work underiines the importance of

ngorous adherence to crack obsenation protocol in highway pavement test programs aich as
SHRP and C-SHRP.

CONCLUSIONS,
RECOMMENDATIONS,
AND FUTURE RESEARCH
8.1 General
This chapter gives the reader a sumrnary of the highlights of this work and addresses
the gap that shll exists in the field, and suggests some M e r research points. This thesis began
with the idea of correiatmg the deflection measurements ushg Benkelman Beam (BB) and
Faiiing Weight Ddectorneter (FWD) to try to develop a general technique that can be used to
update the data that are gathered by many agencies using BB. Such a correlation would have

enabled highway agencies to use the FWD device to collect pavement defiection data in the
fùture. Based on the data avaiiable at that time (1990), the research took a Merent direction.
It became apparent that it was important to tackle the crack probkms first due to its
importance in this field, generally, and due to the difncuities encountered in interpreting
deflection data on cracked pavements.
Using non-destructive testhg devices such as FWD or BB to collect deflection data, a
technique was needed to analyze the data so that good results could be obtained. The back-
caidation method has been suggested by many researchm [Ganapathy (1994)l for
detennining the elastic moduli of pavement layers. Numerous existiag layered elastic models
and general finite-element algorithms have been evaiuated by several researchers. It is evident
fiom this evaluation that existing algorithms could not handle cases which dEer significantly
from n o d cases, such as cracked pavements or compound pavements. Therefore, cracked
pavement is a unique problern which needed to be studied in more depth
Mer examinhg available tools, a commerciaily available general-purpose finite-
element program developed by Swanson Analysis System called ANSYS was chosen to be
used in this sîudy.
The field work d y s i s that was presented in Chapter 7 was limited ody to two sites in
Manitoba. However, these field data resuits were also used for cornparison with the predicted
defledion bowls fiom cracked pavements. Part of this study examined FWD data gathered
fkom two sites in Manitoba. Unexplaineci large deflections in the same test section (supposedly
homogeneous seaion) were noticed during the analysis of the field data. These could be due to
variation in matenal propenies which are eonsidered unlikely. ïhqr may also be due to cracks

in the vianity of these large defiection, in whicb case the testing procedure should i d e n e these
cracks, the severity of these cracks as well as their location. The analysis was done using a
general-pupose finite-element program. This program was used to predict defl ection bowls of
uncracked pavement as shown in Chapter S. The aaalysis was repeated for cracks with
Mirent widths, depths and distances fkom the load. The deBeaion basin for the two cases
(cracked and uacfacked pavement) were then cornparrd with each other.
8.2 Conclusions
This thesis has made signifiant contributions: In -sis, one should be looking for
the best analytical tool that would give satisfactory redts, as has been demonstrateci in this
thesis.
The results have been presented and âiscussed in the previous chapters. Based on those
results severai conclusions have been drawn:
(1) A general-purpose finite-element method nich as ANSYS presents a powerfùl algorithm to
mode1 cracked and un-cracked pavements under many difrent assumptions of material
properties and layer geometry as seen earlier.
(2) The ANSYS algorithm is capable of modeiing gap elements and can consider cracked
pavement conditions during defiection testing.

(3) An important finding was to avoid loading aear cracks and at what distance these cracks
have an inthence on the defiection bowl. The operator of FWD should pay attention to cracks
in the vicinity of the loads. (It was deteminecl that for at least 1000 mm fiom the center of the
load the crack bas a significant &ect on the ddectïon bowl, beyond one-meter the crack has
no effkt on the deflection bowl and can be ignored).
(4) The crack depth as well as crack width have M e &êct on the umxbmm ddeaion as
was show in the previous Chapters.
(5) A single crack as well as double cracks have an effect on the shape of the deflection bowl
only around the crack itself, but they do not have any effect on the maximum deflection.
(6) Aggregate interlocking was used to model the load trader across the crack or the joint. It
is dear that a significant part of load can stiü be tranderred througb aggregate interlock.
(7) The geometry of the analysis model (i.e. the dimensions of the axi-symrnetrid cyiindrical
model) has some influence on the shape of the deflection basin. The shorter section, such as 3m
bylSm, would not make a nomial deflection basin. For the shorter section the pavement is
represented as a cylinder but for the medium section such as 7.5 m by 15 m the &êct on the
deflection bowl seems to be a litde ciiffirent fiom the shorter section. On the other hand, a
longer section such as 15 rn by 15 m the shape of the ddection bowl appears to normal as
expected.

(8) Dinerent cases of un-cracked pavement were analyzed ushg the ANSYS program to test
the flexibility of the program These cases showed that the program is capable of analyzing
tbese types of problems.
8.3 Recommendations and Suggestion for Future Rcserrch
B a d on the conclusions presented in the previous section, it is clear that evaluation of
pavements is far firom an exact science despite advanced theories, highly sophisticated and
precise measuring equipment, and the availability of fast cornpuhg aids. Some of the foiiowing
ideas are really important and need to be addressed.
(1) The data gathered by FWD should include crack information such as: the size of the
crack, how fm the crack is 60m the edge of the Ioad the condition around and near the cracks,
and what type of cracks are present and their severity.
(2) Providing data on cracks in the perpendicular direction, so that a complete picaire of the
deflection basin would be avdable.
(3) A mechanistic approach is needed to mode1 the pavement problems, since the mechanistic
approach is the friture for pavement analysis. What is needed is to M e r refine the d y s i s
procedures to account for material properties based on sampling and testing, aging, tr&c,
fatigue properties, cracks and environmental condition.

(4) These findings were based on a stmctural type of model which is an approximation to the
red problem. The nad step to refine the analysis is to use a threedimensiod model in order to
obtain an even better match betwee~l theoretical and observeci r d t s .
(5) Studies of multiple cracks are recommended to investigate the &kt of these cracks on the
deflection bowl.

AASHTO Guide for Design of Pavement Structures, Arnerican Association of State Highway and Transportation Officiais, Washington, D.C., 1986.
Abd Elhalim, AO. "Infiuencce of Relative Rigidity on the Problern of Refiection Cracking ".
Transportation Research Board No. 1007, 1982, pp. 53.
AbddsM, AA, Majidzadeh, Kamran. "J. Integral and Cyclic Plasticity Approach to Fatigue and Fracture of Asphait Müctures" . Transportation Research Board No. 1 034, 1 985, pp. 1 12.
Acum, W.E.A and FOK L. "Computation of Load Stresses in Three Layer Elastic Systern. Geotechnique, V. 2, 195 1, pp. 2%.
Addendum to Sheil Pavement Design Manual. Sheil International Petroleum Company, Limited, London, 1985.
Aglw H., Shehata, I., Figueraa, L., and Othman, A. "Structure-Fractwe Toughness Relationships of Asphalt Concrete Mixtures". Transportation Research Board No. 13 53, 1992, pp.24.
Ahlvin, RG. and Uiery, H.H. "Tabulateci Values for Detemination of Complete Pattern of Stresses, Strains and Deflections Beneath a Unifonn Cirdar Load on a Homogeneous Half Space HRB Bulletin 342, 1962, pp. 1.
Al-Baibissi, Adli., and Little, Dailas. N. "Effect of Fracture Healing on Laboratory-to-Field Shift Factor" Transportation Research Board No. 1286, 1990, pp. 173
Ah, N.A, and Khoda, N. Paul. "Detemination of Layer Moduli Using a Falling Weight Deflectometer" . Transportation Research Board No. 1 1 17, 1 987, pp. 1.
A~-Maaseer, AA, and PWps, D.V. "Numerical Study of Some Post-aacking Materiai Parameters AffeCting Non-linear Solutions in RC Deep Beams". Canadian Journai of Civil Engineering, Vol. 14., pp. 655, 1987
Anani, Bassarn A "An Evahntion Of In-Situ Elastic Moduli fiom Surface-ddection Basins of Multilayer Fiexible Pavements". A Ph-D. Dissertation, the Pennsylvaaia State University, 1979, pp. 4- 36
Men, W., Berg, R, and Big, S. "Prediction of Damage to Fiexible Pavements in Seasonal Frost Areas". Transportation Research Board No. 1286,1990, pp. 234
Ayari, Mohamed Laoucet. "Static and Dynarnic Fracture Mechanics of Concrete Gravity Dams". A Ph.D. Dissertation, University of Colorado, 1988, pp. 5-6

Badu-Twmeboah, Kwasi, ByronE., and Miley, W.G. "Dynafiect Evaluation of Layer Moduli in Florida's Flexible Pavement". Transportation Research Board No. 1 196, 1988, pp. 96
Baladi, Gilbert. "Fatigue Life and Pavement Deformation Characteristics of Asphah Conmete Mixes". Transportation Research Board No. 1227, 1989, pp. 75
Bandyopadhyay, Sudipta S. "Structural Pdonnance Evahmtion of Recycled Pavements By Usiog Dynamïc Deflection Measurements". Transportation Research Board No. 888, 1982, pp. 38.
Barksdale, RD., 'laboratory Evahiation of Rutting in Base Course Materials". Proc. Third International Conference on Structural Design of Asphait Paveaents. London, 1972, Vol. 1. pp. 161- 1 74
Basma, Adnan A, Ai-Suleiman, and Turki 1. "Climattic Considerations in New AASHTO Flexible Pavement Design". ASCE Journal Of' Transportation Engineering, Vol. 1 17, No. 2, MarcWApril 199 1, pp. 2 10.
Barker, W.R Won-linear F i t e Element Aaaysis of Heavüy Loaded Airfield Pavements. Proc. Symp. on the Application of tbe Finite Element Method in Geotech. hg., U.S. Army WES, Vi~kburg, Miss, Vol. II, 1972, pp. 657, (editor: C.S. Desai).
Blackburn, W.S., and Hellen, T.K. "Caldation of Stress Intensity Factors in Three Dimensions by Finite Element Methods". International Journal for Numerical Methods in Engineering, Vol. 1 1, pp. 21 1-229, 1977.
Boussinesq, J. "Application des Potentiels a le'tude de L'equiliore et du Movement des solides elastique, 1 885.
Bowles, J.E. "Foundation Analysis and Design. "Fourth Ed., McGraw-Hill, New York, 1988.
Briaud, J.L. "The Pressuremeter: Application to Pavement Design. Ph.D. Thesis, University of ûttawa, Ottawa, Ont., CanaAa, 1979.
Briaud, J.L., Cosentino, P.J., and Teny, T.A "Pressure Moduli for Auport Pavement Design and Evaluation". Final Report, Texas M M University System. 1987.
Bnggs, Robert C., Nezarian, Soheil. "Effects of Unknown Rigid Subgrade Layers on Bakîalculation of Pavement Moduli and Projections of Pavement Performance". Transportation Research Board No. 1227, 1989, pp. 183
Bnggs, Robert C., Scullion, Tom., and Maser, Kenneth R "Asphalt Thickness Variation on Texas Strategic Hghway Research Program Sections and Effat on Back-caldateci Moduli". Transportation Research Board No. 1 377, 1992, pp. 1 1 5 .

Brosseaud, Yves., Delorme, Jean-Luc., Hi- Rene'. "Use of W C Wheel-Tracking Rutting Tester to Select Asphalt Pavements Resistant to Ruttiag". Transportation Research Board No. 1384, 1993, pp. 59.
Brown, S.F., Pappin, J.W. "Anaiysis of Pavements with Granular Bases". Tramportation Research Board No. 8 10, 198 1, pp. 17.
Brown, Steven. F., Tarn, W.S. and Brunton, Janet. M ."Structural EvaIuation of Overlay Design: Analysis and Implementation". Proc. Sixth international Conference on Structurai Design of Asphait Pavements, Vol. 1. pp. 10 1 3. July 13- 1 7, 1987, University of Michigan, Ann Arbor, Michigan, USA
Brown, S.F., Tam, W., and Brunton, J. "Development of An Anaîyticd Method for the Stnicturd Evaluation of Pavements". Proc. 2nd I d . Cod. on Bearing Cap* of Roads and Me lds , Plymouth, U K pp. 267, 1986.
Brown, S.F., and Barksdde, R "Pavement Design and Materials, Theme Lecture Presented at Sixth International Conference on the Structural Design of Aspbalt Pavements, University of Michigan, AM Arbor, July, 1987.
Bruntob J.M., and deAlmida, J.R "Modeling Material Nonlinearity in a Pavement Back-caldation Procedure". Transportation Research Board No. 1377, 1992, pp. 99.
Burmister, Donald M. "The Theory of Stresses and Displacements in Layered Systems and the Applications to the Design of Auport Rumvays". fighway Research Board, Proc. of the 23rd Annud Meeting, Nov. 2 7-3 O, 1 943.
Bush III, Albert J., Alexander, Don R " Pavement Evahiation Using Deflection Basin Measurements and Layered Theory " . Transportation Research Board No. 1 022, 1 98 5, pp. 1 6.
Carpenter, Samuel. H., Darter, Michael. 1. "Field Performance of Crack and Seat Projects". Transportation Research Board No. 121 5, 1989, pp. 219.
Carpenter, Samuel H. "Load Equivaiency Factors and Rutting Rates: The AASHO Road Test". Transportation Research Board No. 13 54, 1992, pp. 3 1.
Change, H., Lytton, RL., and Carpenter, S.H. "Prediction of T h d Reflection Cracking in West Texas". Research R ~ O R 18-3. Tews Trausportation Mtu t e . Texas A&M University, 1976.
Chang, Der-Wen, Roesset, Jose M., Stokoe Ii, Kenneth, H. 'Wonlinear Effects in F a h g Weight Deflectometer Tests". Trmportation Research Board No. 13 55, 1992, pp. 1.
Chang, Der-Wen., R o m , Jose M., Stokoe Ii, Kenneth, H. "Effkct of Depth to Bedrock on Ddection Basins Obtaineû With Dydect and Falling Weight Deflectometer Tests". Transportation Research Board No. 1355, 1992, pp. 8.

Chatti Karim. 'Dynamic Analysis of Jointed Concrete Pavements Subjected to Moving Transient Loads" . A PhD. Dissertation, University of California at Berkeley, 1 992, pp. 50-68
Chen, Hsiee, Marshek, Kurt M., and Sarafl Chhote L. "Effécts of Truck Tire Contact Pressure Distribution on the Design of Flexible Pavements: A Threedimensional F i t e Element Approach. Trsosportation Research Board No. 1095, 1986, pp. 72.
Chen, S.S. "The Respoose of Mdti-layered Systern to Dynamic Surface Loads" Doctoral Dissertation, Department of Civil Enpuiezring, University of California, Berkeley, June, 1987.
Chomton, G., and Valayer, P.J. "Applied Rheology of Asphait Mixes, Practical Applications, Proc. Thkd Intemational Conference on the Stniciural Design of Asphalt Pavements, London, 1972, Vol. 1. pp. 214.
Christson, J.T ., Murray, D.W., and Anderson, KO. " Stress Prediction and Low Temperature Fracture Susceptibility". Proc. Association of Asphalt Paving Technologists, Vol. 4 1, 1972, pp. 494-523.
Claessen, AI-M., Edwards, J.M., Sommer, P. and Uge, P. 1977. "Asphah Pavement Design7'. Proc. of the Fourth. intemationai Conference on Structural Design of Asphalt Pavements, AM Arbor, Michigan, Vol. 1, pp. 39.
Clark Graves, R, Men, D.L., Shape, G.W. " Breakhg and Seating of Concrete Pavements: Kentucky's Experience". Transportation Research Board No. 1388, 1993, pp. 1 74
Clayton, Sparks & Associates Itd. "Pavement Deflection Testing Vehicle: A Feasibility Study" . Prepared for Transport Canada, Transportation Development Center, 1980.
Darter, Michael I., and Shahn, Mohamed Y. "Pavement Rehabilitation: I d e n m g the Need ". Transportation Engineering Joumai, TE 1, Jan, 1980.
Darter, Michael I., Smith, Kurt D., Hall, Kathleen T. "Concrete Pavement Back-calculation Results fkom Field Studies". Transportation Research Board No. 1377, 1992, pp.7.
Dauzat4 M., and Rampal, A "Mecbanhm of Surfàce Cracking in Wearing Course". Proc. 6th intematiod Conference on Structurai Design of Asphah Pavements, Vol. 1, 1487, pp. 232. Department of Civil Engineering, College of Engineering, University of Michigan, Ann Arbor, Michigan USA
Davies, Trevor. G., and Mamlouk, Michael S. "Theoretical Response of Multilayer Pavement Systerns to Dynamic Non-Destructive Test@". Transportation Research Board No. 1022, 1985, pp. 1.
Decon, J.A 'Tatigue of Asphah Conmte7'. Ph.D. Dissertation. University of California, Berkeley, 1965.
Desai, C.S. Elementary Finite Element Method. "Prentice Hall, N-Y", 1979.

~iyaljek, Vishnu. A "Pavement Failure Investigation: Case Study " . Transportation Research Board No. 1022, 1985, pp. 135.
Domaschdc, L. and Wade, N.H. 1969. "A Study of Bulk and Shear Moduli for a Sand". Journal of Soi1 Mechanics and Foundation Division Proc. ASCE, Vol. 95, S M , pp. 56 1.
Dorrnan, G.M. "The Extension to Practice of a Fundamental Procedure for the Design of Flexible Pavements. Proc. Internationai Confierence on the Structurai Design of Asphalt Pavements. University of Michigan, pp. 785-793., 1963.
Drumm, E.C., Boateng-Pokq Y ., and Johnson Pierce, T. " Estimation of Subgraâe Resilient Modulus fiom Standard Testsyy. Journal of Geotechnical Engineering Vol. 1 16, No. 5, May 1 990 ASCE..
Duncan, J.M., Monismith, C.L. and Wrlson, E.L. 1968. ' F i t e Element Analysis for Pavements". HRR No. 228, pp. 18.
Ebrahuni, F., and Ali, AJ. "Evaluation of Published Data on Ductile Initiation Fracture Toughness of Low-AUoy Structural Steels". Journal of Testing and Evaluation. Vol. 16, No 2. March, 1988, pp. 113.
El-hussein, Mohamed., Abdelhaûm, AO., and Kennepohi, Gerhard J. "Muence of Constution- Induced Cracks n Asphalt Concrete Resistance to Moisture Damage". Transportation Research Board No. 13 53, 1992, pp. 69.
El-korchi, Tahar., Wittels, Norman. "Visual Appearance of Surface Distress in PCC Pavements: 1. Crack Luminance". Transportation Research Board No. 1260, 1990, pp. 74.
El-korchi, Tahar., Wdels, N o m . "Visuai Appeanuice of Surfàce Distress in PCC Pavements: II. Crack Modehg" . Transportation Research Board No. 1260, 1990, pp. 84.
Ellion, Robert P. "Selection of Subgrade Modulus for AASHTO Flexible Pavement Design". Transportation Research Board No. 1354, 1992, pp. 39.
Eliiott, Robert P., and Thoroton, Sam 1. " Redent Modulus and AASHTO Pavement Design" Transportation Research Board No. 1 196, Washington D.C., 1988, pp. 1 16.
Epps, J.A ''Influence of Mamire Variables on the F l d Fatigue and Teosile Properties of Asphalt Concrete". Ph.D. Dissertation, University of California, Berkeley, 1968.
Fekpe, E S K. "Asphaltic Concrete Overlay on Surface-Treated Pavements with Lateritic Grave1 bases". Construction and Building Materials Vol. 6. no. 4., 1992, pp. 2 1 5 .
Foster, C.R and Fergus, S.M. "Stress Distribution in a Homogenous Soil". Research Report, 12-F, Presented at the 29th h u a 1 Meeting of HRB, 1949.

Freeme, C.R 'LTechnical Report Covering Tour of Duty to the U.K. and U.S.A. Report R3/6/73. Republic of South Afnca, 1973.
Frost, N.E., and Dugdale, D.S. 'The Propagation of Fatigue Cracks in Sheet Specimens". Joumal of the Mechanics and Physics of Solids". Vol. 6. pp. 92-1 1 O, 1958.
Ganapathy, Gani. " In-situ Characterization of Material Properties for the Design and Evaiuation of Flexible Pavements. " A PhD. Dissertation, Uaivasity of Manitoba, W~peg, 1994, pp. 279-340
George, K.P., Rajagopal, AS., and Lim, L.K "Models for Predicting Pavement Determination". Transportation Research Board No. 12 1 5,1989, pp. 1.
Gerrard, C.M. 1967. "Stress and Displacements in Layered Cross-anisotropic Elastic Systems". Proceeding Fiifth Ausirdia-New Zealand Conference on Soil Mecbanics and Foundation Engineering". Melbourne, Australia, pp. 187.
Gerritsen, AH., VanGurp, C.AP.M., der Heide, J.P.J., Molenaar, AAA, and Pro& AC. " Prediction and Prevention of Surface Cracking in Asphaltic Pavements". Proc. 6th Internationai Conference Structwal Design of Asphalt Pavements Vol. 1. 1987, pp. 370. Department of Civil Engineeing, College of Engineering, University of Michigan, Ann Arbor, Michigan USA
Gervais, M., Hozayen, H., Halim, A, Haas, Ralph. " Efféas of Geornetric Properties of Grids on the Operating Mechanisms of Reùiforced Asphalt Pavements". Proc. of 37th Annual Conference of Canadian Technical Asphalt Association Quebec, Canada, 1992, pp. 29.
Gichago, F.J. "Evaluation of Flexible Pavements in Kenya" Proc. Coderence on Criteria for Public Highway Investment in Developing Countries, ICE, London, 1982, pp. 153- 160.
Girijavaliabhm, C.V. and Reese, L.C. 1968. "Finite Element Method for Problerns in Soil Mechanics". Journal of Soil Mechanics Division, Proceeding ASCE, Vol. 94, SM2, pp. 473.
Godias, Dirnitrios G., Castedo, Humberto., and Hudson, W. Rodd. "Pavement Distress Surveys in the Strategic Highway Research Program's Long-Tm Pavement Performance Study". Transpomtion Research Board No. 1260, 1990, pp. 4.
Gomez-Achecar, M. and Thompson, M.R "Mechanistic Design Concept for Fd-Depth Asphalt Concrete Pavementsy' Civil Engineering Studies, Traasportation Engineering Series No. 4 1, University of niuiois, Urbana-Champaign, 1984.
Gomez-Achecar, M. and Thompson, M.R ILLI-PAVE Based Response Algorithrns for Fd-Depth Asphah Concrete Flexible Pavements:. Re-print Vopy, Annual Meeting of the Transportation Research Boarâ, 1986, Washington, D.C.

Govind, Shekhar and Walton, C. Michad. "Fatigue Mode1 to Assess Pavement Damage". Transportation Research Board No. 1227, 1989, pp. 88
Greenstein, Jacob. "Use of NDT and Pocket Complters in Pavement Evaluation". ASCE Joumal of Transportation Engineering, Vol. 11 1, No. 3, May 1985, pp. 258.
Hajek J.J. and Agoiwak AC. "Infhience of Axle Group Spacing on Pavement Damage". Transportation Research Board No. 1286, 1990, pp. 138
Hali, KT., Darter, M. I., and Armaghani J M. " Performance Monitoring of Joiat Load T r d e r Restoration". Transportation Rescarch Board No. 1388,1993. pp. 129
Haas. Rabh.. and Hudson. W. Ronald. Pavement Management Svstems 1st. Edition. 1978.
Haas, R " A New Technology to Increase Pavement Lie and Reduce Maintenance7'. Report Prepared for Project 2 1 140, Ontario Joint Tramp. and Commmic. Research Program, Jan. 3 1, 1984.
Haas, R, and Joseph, P. "Design Onenteci Evaluation of Alternatives for Refldon Cracking 'Iàrough Pavement Overlays". Proc., universite' de ~ i e ' ~ e , Belgium, March 1989.
Harichandran, R o d d S., and Yeh, Ming-Shan. "Flexible Boundary in Fite-Element Adysis of Pavements". Transportation Research Board No. 1207, 1989, pp. 50.
Harichandran, R S., Yeh, Muig-Shan., Baladi, G.Y. "MICH-PAVE: A Nonlinear F i t e Element Program for Anaiysis of Flexible Pavements:. Transportation Research Board No. 1286, 1990, pp. 123
Harichandran, Ronald S., Mahmood, Tariq., Raab, A Robert., and Baladi, Gilbert Y. "Modifd Newton Algorithm for Back-caldation of Pavement Layer Properties". Transportation Research Board No. 1384, 1992, pp. 15.
Heukelom, W. "Observations on the Rheology and Fracture of Bitminous and Asphalt Mixes". Proc. Association of Asphalt Paving Technologsts, 1 966, pp. 3 5 8-399.
Hofihan, Mario. S., Thompson, Marshall. R "Back-calculating Nonlinear Resilient Moduli fiom Deflection Data". Transportation Rcsearch Board No. 852, 1982, pp. 42.
Hossain, M., ScofieId, L.A " Interpretation of Back-calculated Layer Moduli of Crack-and-Seat Pavement fiom Falling Weight Deflectometer Data". Transportation Research Board No. 1377, Washington, D.C., 1992, pp. 167

Hozayen, Hozayen., b a i s , M., Abdel Halim, AO., and Haas, Ralph. "Analytical and Experimental Investigations of Operathg Mechanisms in Reinforad Asphalt Pavements". Traosportation Research Board No. 1388, 1993.
Huang, Y.H. "Deflection and Curvature as Criteria for Flexible Pavements Design and Evahation". Highway Research Board No. 345, pp. 1, 197 1
Hu, Hsuan-Teh-, and Schnobrich, William C. "Nonlinear Analysis of Cracked Reinforcecl Concrete". AC1 Structurai Journal MarcWApril, 1990, pp. 199.
Hveen, F.N. Tavernent Deflection and Fatigue Failure7' Bulletin 114, HRB, National Research Council, Washington D.C., 1955, pp. 43-87.
I n d e a , Anthony R, and Manu, Corneiiu. "Stress-Intensity Factor Computation in Three Duneasions with Quarter-Point Elements". International Joumal for Numerical Methods in Engineering. Vol. 5, 1980, pp. 14274445.
irwin, GR "Analysis of Stresses and Strains Near the End of a Crack Travening a Plate". Transaction ASME, Journal. Applied. Mech. No. 24. 1957.
Irwin, G R "Fracture Mode Transition for a Crack Traversing a Plate". Journal of Basic Engineering, June 1960. pp. 41 7.
Jackson, JeE, and Murphy, Mike. "Implementation of Falling Weight Deflectometer Load-Zoning Procedure in Texas". Transportation Research Board No. 1377, 1992, pp. 143.
Jacob, Thomas R " Design Parameten for Use of Reinforced Stress-Absorbing Membrane Interlayers". Transportation Research Board No. 1272, 1990, pp. 130.
Janoo, Vmcent C., Berg, Richard L. "Thaw Weakining of Pavement Structures in Seasonal Frost Areas". Transportation Research Board No. 1286, 1990, pp. 2 1 7
Janoo, Viicent CC., and Berg, Richard L. "Layer Moduli Detennination Duxing Freeze-Thaw Penods". Transportation Research Board No. 1377, 1992, pp. 26.
Jayawickrama, P.W., Smith, RE., Lytton, RL., Tirado, M.R "Data Acquisition for Mechanistic- Empind Overlays Design Equations for Reflection Cracking in Fiexible Ovedays". Transportation Research Board No. 1 1 96, 1 988, pp. 243
Jeng Yeau-Shang., Liaw Chwen-Jang., and Sang-Chel Kim. " E f f i of Temperature of Ear1y Crack Formation in Portland Cernent Concrete Pavements". Traasportation Research Board No. 1 388, 1993. PP- 35

Jeng Yeau-Shang., Liaw Chwen-Jaag., and Liu Pei. " Analysis of Crack Resistance of Asphalt Co~xete Overiays A Fracture Meehanics Approach". Transportation Research Board No. 1388, 1993, pp. 160
Jiang, Y., McDaniel R "Application of Cracking and Seating and Use of Fibers to Control Reflective Cracking". Traasportation Research Board No. 1388, 1 993, pp. 150
Johnson R " Roadway Rehabilitation without Excavation " Proc. of 37th Annual Conference of Canadian Techaicai Asphalt Assoaaaon, Quebec, Caaada, 1992, pp. 72.
Jones, J.C. "Tables of Stresses in niree Layer Eiastic Systems". Highway Research Builetin 342, HRB, 1962, pp. 176.
Joseph, Ponniah. E., and Haas, Ralph. "EvahiaMg Alternative Solutions to Reflective Cracking Through Asphalt Overlays" . Transportation Research Board No. 1 2 1 5, 1 989, pp. 282.
Joyce, J.A, and Schneider, C.S. "Crack Length Masurement During Rapid Crack Growth Using an Altemating-Current Potentiai DEerence Method". Joumal of Testhg and Evaluation, Vol. 16 No. 3, May 1988. pp. 257.
Julian, Luis. Bendana., and Yang, Wei-Shih. "Rehabilitation Procedures for Faulteû Rigid Pavement". Transportation Research Board No. 1388,1993, pp. 200
Jung, D.H., and Vuwn, T.S. "Interim Report on Laboratory Evaluation of Low Temperature Cracking from Thermal Stress Restrained Specimen Test Strategic Highway Research Program, NRC, Washington, D.C. 1991.
Jung, Friedrich. W. "Direct Calcdation of Maxirnum Curvature and Strain in Asphalt Concrete Layers of Pavements fiom Load Deflection Basin Measurements". Transpoitation Research Board No. 1 196, 1988, pp. 125
Jung, F.W. "Interpretation of Deflection Basin for Real-World Layer Materials of Flexible Pavements". Technical Report, The Research and Development Branch, Ontario Ministry of Transportation, 1989, pp. 1-30
Jung, Friedrich W. "Nondestructive Testing: Interpretation of Deflection Bowl for Failhg Weight Deflectometer Tests on Flexible Pavements". Arnerican Society for Testing and Matenals., Vol. 17, No. 6. Novernber 1989, pp. 333-343.
Jung, Friedrich W., and StoUe, Dieter F.E. "Non-Destructive Testing with Faîling Weight Deflectometer on Whole and Broken Asphalt Concrete Pavements". Transportation Research Board No. 1377, 1992, pp. 183.
JSandbai, Prithvi. S. "Evaluation of Low-Temperature Pavement Cracking on ELK County Research Project". Transportation Research Board No. 777, 1980, pp. 39.

Kandhai, Prithvi S., Cross, Stephen A, and Brown, Ray. E. "Heavy-Duty Asphalt Pavements in Pennsylvania: Evaiuation for Rutting". Transportation Research Board No. 1 384, 1 993, pp. 49.
Kenis, W.J., and Cobb, C.M. "Cornputer Simulation of Load Ecpivalence Factors". Transportation Research Board No. 1286, 1990, pp. 192
Kenis, W. J., Sherwood, J.A and McMohan, T.F. 1982. "Verification and Application of the VESYS Structurai Subsystem". Roc. of Fath lnternaîiod Confaence on Structurai Design of Asphalt Pavements, Delft, Hoiiand, Vol. 1. pp. 333.
Khosla, N-Paul., and Orner, M.S. "Characterization of Asphalt Mixtures for Preâiction of Pavement Performance". Transportation Research Board No. 1034,1985, pp. 47.
Kim, Y.R, Khosla,N.P., Sa* S., and Scullion, T. "Validation of Moduli Back-calculation Procedure Using Muitidepth Defîectowters W e d in Various Flexible Pavement Structures". Transportation Research Board No. 13 77, 1992, pp. 128.
Kunst, P. A J.C. "Surfàce Cracking in Asphalt Layers". A research Report No. 4., Center for Research and Contract Standardization in Civil and Tr&c Engineering, The NetherIands, 1990.
Lam, Andrew Y.K.M. "Resilient Moduli of Flexible Pavement Materials" A M.Eng. Thesis, McMaster University, Hamilton, Ontario, 1982, pp. 1-3 1
Lee, k. M., and Rowe, R K "Determination Caused by Surfàce Loading and Tunneling: the Role of Elastic Anisotropy". Geotechnique 39, No. 1, 1989, pp. 125-140.
Lee, K. Wayne. and Peckhsm, Wendy. L. "Assessrnent of Damage Caused to Pavements by Heavy Trucks in New England". Transportation Research Board No. 1286, 1 990, pp. 164
Lee, S.W., Mohoney, J.P., and Jackson, N.C. "Verification of Back-caldation of Pavement Moduli". Transportation Research Board No. 1 196, 1988. pp. 85
Little, Daiias. N., Mahboub, Kamyar. "Engineering Properries of First G-erabon Plasticized Sulîbr Buiden and Low Temperature Fracture Evaluation of Palsticized Sulfar Paving Mixtures". Transportation Research Board No. 1034, 1985, pp. 1 03.
Liu, H.W. "Crack Propagation in Thin Metal Sheet Under Repeated Loading". Joumai of Basic Engineering, March 1961, pp. 23
Liu, H.W. 'Tatigue Crack Propagation and Applied Stress Range An Energy Approach. Transaction of ASME, March 1963, pp. 1 16.
Loannides, Anastason M. and Lev Khauuiovich. "Laad Equivalency Concepts: A mechanistic Reappraid". Transportation Research Board No. 1388, 1993, pp. 42


Malan, G.W., Straus, P.J., and Hugo, F. "A Field Study Of Prernature Surface Cracking In Whalt". Proc. Association of Asphalt Pavhg Technologists, Techaical session, Nashde, Temessee, Vol. 58, Feb. 20-22, 1989, pp. 142.
Mamlouk, Michael S. "Evahiation of In-Situ Pavement Moduli f?om Defiection Measurements". American Society for Testing and Materials (ASTM) Vol. 13, No. 1, Jammy 1985, pp. 60-68.
Mamlouk, Michael S., and Sarofim, Ra& T. "Modulus of Asphah Mixtwes an Unresolved Dilemmaet. Traasportation R-ch Board No. 1 171, 1988, pp. 193.
Mamlouk. Michael S., Yuan, Yao M., Tseng, N. T., and Lee, George C. "Anaiysis of Nonlinear Behavior of Asphalt Conaete During Marsbai Test". Journal of Testmg and Evahiation Vol. 1 1. No. 5, Sept., 1983, pp. 327-332
Manrione, Charles W. "Evaluation and Response of Aged Flexible Airfield Pavements at Ambient Temperatures Ushg the F&g Weight Deflectometer". Proc. Association of Asphalt Paving Techwlogists Technical Session, Nashdie, Tennessee, Vol -1. 58., Feb. 20-22, 1989, pp. 77.
McCullough, B. Frank., and Seeds, Stephen B. "Field Validation of an Overlay Design Procedure to Prevent Reflection Cracking". Proc. 5th International Coaference on the Structural Design of Asphalt Pavements, Vol. 1, August 23-26, 1982, pp. 780. The Delft University of Technology in the NetherIands
McElvaney, J. "Cracking of Bituminous Surfacings in High Ambient Temperatures". Highway and Transportation J o u d , July, 1 99 1, Vol. 38 No. 7
Mclean, D.B. "Permanent Deformation Characteristics of Asphalt Concrete". Ph.D. Dissertation, University of California, Berkeley, 1974.
Moisrnith, C.L., Secor, GA, and Secor, K.E. 'Temperature Induced Stresses and Deformation of Asphalt Paving Technologists". Vol. 34, 1 965, pp. 248-285.
Monismith, C.L., Kasianchuk, D.A "Fatigue Considerations in the Design and Perfoxmance of Asphalt Pavementstt. Prepard for Presentation at the 1968 Caaadian Technical Asphalt Association Confaence, Ottawa, Canada, November 4-6, 1968.
Monismith, Carl L. "AnaIyticaHy Based Asphalt Pavement Design and Rehabilitation: Theory to Practice, 1962-1992". Transportation Research Board No. 1354, 1992, pp. 5 .
Monismith, C.L., Epps, J.A, Kasianch& D.A, and Mcleaq D.B. "Asphalt Mixture Behavior in Repeated Flexuce". Report TE. 70-5. University of Californiia, Berkeley, 1971. pp. 303.
Nataatmdia, A, Parkm, AK. "Characterintion of Granular Materials for Pavements". Canadian Geotech Journal 26, 1989, pp. 725-730.

Naylor, D. J. "Stress-Strain Laws for Soil.". Chapter 2 in Developments in Soil Mechanics, Applied Sc., Publ., London, U.K, Editor: C.R Scott., 1978
Nazariao, Soheil., and Chai, Y.E. "Cornparison of Theoretid and In-Situ Behaviors of Rexible Pavement Section". Transportation Research Board No. 1377, 1992, pp. 1 72.
Noureldin, A Samy. "New Scenario for Back-caiculation of Layer Moduli of Fiexible Pavments". Transportation Research Board No. 13 84, 1993, pp. 23.
Odemark, N. Wndenoking av Elasticitetegenskaperna bos o h Jordarter Samt Teon for Beralmiag av Belaphgar enligt elasticitetsteorin, Statens V-tut, Meddelande 77, (in Swedish, 1 949
OWahem. C A "Hiahwav Enaineerinn, Third Edition Vol. 2. 1988. DD. 394.
Oliver, J. "A Consistent Characteristic Length for Smeared Cracking Models". Intemationai J o d for Numerical Methods In Engineering, Vol. 28, pp. 46 1-474, 1989.
OUe Tholer, Jay Sharrna., Terrel, Ronald L. "Cornparison of Falling Weight Deflectometer with Other Deflection Testhg Devices" Transportation Research Board No. 1007, 1985, pp. 20-26.
Palmer, L.A and Barker, E.S. 1940. ''Soi1 Displacements Under a Circular Loaded Area". Proceeding HRB, Vol. 20, pp. 279.
Pappin, J.W. and Brown, S.F. 1980. 'Resilient Stress-strain Behavior of a Crushed Rock". Proceeding, International Symp. on Soils Under Cyclic and Transient Loading Swansea, Vol. 1, pp. 1.
Pans, P., and Erdogan, P. "A Cntical Anaiysis of Crack Propagation Laws". Transactions of The ASME, December, 1963, pp. 528.
Peattie, KR "Stress and Strain Factors for Three Layer Elastic Systems". Highway Research Bulletin 342, HRB, 1962, pp. 21 5.
Peattie, K. R and Jones A "Surface Deflections of Road Structures" Proceedings, Symposium on Road Tests for Pavement Design, Vol. 8, Laboratone Nationale de Engenarie Civil, Lisbon, Portugal, 1962, pp. 1-30
Peli, P.S., and Cooper, K.E. "The Effkct of Testiag and Mix Variables on the Fatigue Performance of Bituminous Mateds". Roc., Association of Asphalt Paving Tecbnologists, Vol. 44, pp. 1-37, 1975
Pe t P. S. "Characterization of Fatigue Behavior" In Spbàal Report 140: Stnictural Design of Asphalt Concrete Pavement System to Revent Fatigue Cracking, HRB, National Research Council, Washington D.C., 1973
Raad, Lutfi. "Behavior of Stabilized Layers Under Repeated Loads". Transportation Research Board No. 1022, 1985, pp. 72.

Raad, Lutfi., Saboundjian, Stephau, and Corcoran, John. "Remaining Fatigue Life Anaiysis: Cornparison Between Dense-Graded Conventionai Asphait Concrete and Gap-graded Asphait-Rubber Hot Mix". Transportation Researcch Board No. 13 88, 1993, pp. 97
Rada, G-R, Richter, C.A., and Stephanos, P.J. "Layer Moduli from Deflection Measurements: Soffware SeIection and Development of Strategic Highway Research Prognuns Procemire for Flexible Pavements". Transportation Research Board No. 1377, 1992, pp. 77.
O Rada, Gonzalo,. R, Stephanos, Peter. J., and Tayabjï, Shiraz. D. "Performance of Interlockhg Concrete Pavements in North America". Traasportation Research Board No. 1388, 1993, pp. 1
Radhakrishna, N. and Reese, L.C. 1970. "Areview of Applications of the Finite Element Method of Analysis to Problems in Soi1 and Rock Mecbanics". Soils and Foundations, Vol. 10, No. 3, pp. 95.
Rauhut, J-Brent. "Permanent Monnation Characterization of Bituminous MOdures for Predicting Pavement cutting" . Transportation Research Board No. 777, 1980, pp. 9.
Rauhut, J.Brent., and Kennedy, Thomas. W. "CharacteriP,g Fatigue Life for Asphait Concrete Pavements". Transportation Research Board No. 888, 1982, pp. 47.
Riggs, H.R, and Powell, G.H. "Tangent Constitutive Matrices for Inelastic Fiite Element Analysis". international Journai for Numerical Methods in Engineering, Vol. 29, pp. 1 193- 1203, 1990.
Rilett, L.R, and Hutchinson, B.G. "LEF Estimation fiom Canroad Pavements Load-Deflection Data". Transportation Research Board No. 1 196, 1988, pp. 170
Roessg Jose M., and Shao, Ko-Young. 'Dynamic Interpretation of Dynaflect and F a h g Weight Deflectometer Tests". Transportation Research Board No. 1022, 1985, pp. 7.
Rook, D.P. and Cartwright, D.J. "Compendium of Stress Intensity Factors" London, H.M.S.O., 1976, pp. 330.
Roos, Eberhard., E i l e , Vrnch. "DetefmjIlSttioa of Montreal Characteristic Vahies-plastic Fracture Mechatics By Means of J-Integrai Crack Resistance Curves". Joumai of Testing and Evaluation, Vol. 16 No. 1, 1988, pp. 2 .
Roman, RJ., Shahin, M.Y., and Grovetti, J.A "Subsealing and Load TratlSfer Restoration". Transportation Research Board No. 1 1 17, 1987, pp. 47.
Roque, Reynatdo., Romero, Pedro., Ruth, Byron E. "Evaluation of a Dual-load Non-destnictive Testing System to Better Disaiminate Near-Surfàce Layer Moduli". Transportation Research Board No. 1355, 1992, pp. 52.
Rust, F.C., and Semas, V.P. "Load-Associatecl Crack Movement Mechanisms in Roads". Transportation Research Board No. 1 196, 1988, pp. 1 5 1
Rutherford, Mary. "Evaiuation of Variables Affecting Flexible Pavement Thawing for Timing Spring Load Restrictions". Traosportation Research Board No. 1286, 1990, pp. 248
Salam, Y.M. "Characterization of Dediormation and Fracture of Asphalt Coacrete". PhD. Dissertation, University of California, Berkeley, 197 1.
Santha, B. Lanka, Yang, W., Lytton, Robert L. " Microcornputer Application to Determine the Load Zoning for Low-voiume Roads" . Transportation Research Board No. 1260, 1990, pp. 226.
Schapery, RA "A Theoiy of Crackgrowth in Vismelastic Media". MM 2764-73-1 Mechanics and Materiais Research Center Texas W University 1973.
Schutzbach, Amy. M. "Crack and Seat Methoci of Pavement Rebab'itation". Tramportaton Research Board No. 1215, 1989, pp. 197.
SCU~~~OR T ., Uzan, J., and Paredes, M. "MODULUS: A Microcomputer-Based Back-calculation System". Transportation Research Board No. 1260, 199q pp. 180.
Sebaaly, Peter., Tobatabaee, N., Bonaquist, R, and Anderson, David. "Evaluating Stnictural Damage of Flexible Pavements Using Cracking and Faliing Weight Deflectometer Data". Transportation Research Board No. 1227, 1989, pp. 44
Sebaaly, Peter E., Tabatabase, Nader., and Scullion,. Tom. "Cornparison of Back-calculated Moduti fiom Falling Weight Deflectometer and Track Loading". Transportation Research Board No. 1377. 1992, pp. 88.
Shahiri, Moharned Y. "Design System for MinùniPng Asphalt Concrete T h e d Cracking". Proc. 4th Intemational Conference on Structural Design of AspMt Pavements, Vol. 1 August 22-26, 1977, pp. 920. Department of Civil Engineering, College of Engineering, University of Michigan, Ann Arbor, Michigan USA
Sheli Pavement Design Manual. Shen International Petroleum Company, Limiteci, London, 1978.
Shen Pavement Design Manual-Asphalt Pavement and Overlays for Road t r a c . "Shell International Petroleum Company LTD. London 1982.
Shook, J.F., F i F.N., Witgak, M.W., Monismith, C.L. "Thickness Design of Asphait Pavements: The Asphalt Institute Method: The Asphah Institute Method". Proc. Fifth International Conference of the Structural Design of Asphalt Pavements, University of Michigan and Delft University of Technology, August 1982, pp. 17-44.
Siddarthan, Raj., Sebaaly Peter E., Javaregowda, Mohan. "Innience of Statistical Variation in Falhg Weight Deflectometers on Pavement Analysis" . Transportation Research Board No. 1 3 77, 1 992, pp. 57.

Sivaneswaran, N., Kramer, Steven L., and Mahoney, Joe. P. "Aclvanced Back-calculation Using a Nonlinear Least Squares Optimization Technique" Transportation Research Board No. 1 293, 1 988., pp. 93.
Smith, RB. "Preluninaiy Evaluation of the Dynatest 8000 Falling Weight Deflectometer" Australian Road Research, 15 (4), December, 1985. pp. 229.
Snyder, Mark B., and Lippert David L. "Field Performance of Eicperimental Full-depth Repair Joint Load-Trader System in Ilbois". Traasportation Research Board No. 1272, 1990, pp. 35.
Snyder, Mark B., Darter, Micbael 1. "Design Procedure for Dowel Lod-transfer Systems for Fuli- Depth Repair Joints". Transportation Research Board No. 1272, 1990, pp. 50.
Sousa, J.B., Lysmer, J., Cheq S.S., and Monismith, C.L. "Dynamic Loads: Effêcts on Performance of Asphalt Concrete Pavements". Transportation Research Board No. 1207, National Research Cound, Washington, D.C. 1988, pp. 145-1 68.
Sousa, J.B., Craus, J., and Monismit. C.L. "Summary Report on Pemianent Defomtion in Asphalt Concrete". Report SHRP-AfIR-9 1 - 1 04. Strategic Highway Research Program, NRC, Washington, D.C., 1991.
Sousa, Jorge B., Tayebali, Akhtarhusein., Hamy, John., Hendricks., and Monismith, Car1 L. "Sensitivity of Strategic Highway Research Program A-003A Testing Equipment to Mix Design Parameters for Permanent Deformation and Fatigue". Transportation Research Board No. 1384, 1993, pp. 69.
Sousa, Jorge., Weissman, Sharnuel L., S a c h Jerome L., and Monisrnith, Car1 L. "Nonlinear Elastic ~ ~ s c o u s with Darnage Mode1 to Predict Permanent Defomtion of Asphalt Concrete Mixes". Transportation Research Board No. 1384, 1993, pp. 80.
Sowers, G.F. and Vesic, AS. "Stress Distribution Beneath Pavements of DiEerent Rigidities. Proc. Fifth intemational Conference on Soi1 Mech and Foundation Engineering, Paris, Vol. 2, 1961, pp. 327.
Steinbreoner, W. Tafeln zur Setaiags Berechaungen (Tables or Settlement Calculatioas). Die Strasse, Vol. 1, pp. 12 1 .(Also Included in the Lecture Notes at the Technical University of Aachen.), 1 947
Stoffels, Sheliy M., Kilarseki, Walter P. "Natiomvide Performance Study of In-se~ce Asphalt Concrete ûveriays on Cmked and Seated Portiand Cernent Concrete Pavements". Transportation Research Board No. 1272,1990, pp. 1 5 .
Stock, AF., and Arand, W. "Low Temperature Cracking in Polymer Modiied Binders". Journal of the Association of Asphalt Pa* Technologist, Vol. 62,993, pp. 23.
Stolle, Dieter F.E., and Jung Friedrich W. "SimpWed Rational Approach to F a h g Weight Deflectometer Data Interpretation". Transportation Research Board No. 1355, 1992, pp. 82.
Stubstad, Richard. N., and Conaor, Bi&. "Use of the Faiiing Waght Deflectometer to Predict Damage Potential on Alaskan Highway During Spriag Thaw". Transportation Research Board No. 930, 1983, PP- 46-
Swanson AnalysiS System Inc. (SASI), ANSYS Revision 4.4, Philadelphia, U.S.4 1989.
Swanson Andysk System Inc. (SASI), ANSY S Revision 5 .O, Philadelphia, U.S.4 1993.
Tayebali, A, Rowe, G.M., and Sousa, J.B. 'Tatigue Response of Asphalt-Aggregate Mi~tures'~. Presented at Annual M d g of Association of Asphah PaWig Tedmologists, Feb. 1992.
Tia, Mang., Lybas, John. M., Ruth, Byron. E. "Suitability of Ushg the Falling Weight DeBectometer in Determining Deteriorated Areas in Joimed Rigid Pavements". Transportation Research Board No. 1007, 1982, pp. 58.
the^ de Banos, B. "Defieaion Factor Charts for Two and Three Layer Systems:. Proceeùing 45th Ann. Meeting of HRB, 1966
Thickness Design Mania1 (MS-1) 9th ed. The Asphalt institute, CoUege Park, Md., 198 1.
Tholen, O., Sharma, J., and Terrei, RL. ''Cornparison of Failing Weight Defkctometer with Other Deflection Testing Devices*'. TRR 1007, TRB, 1985, pp. 20.
Thompson, Marshall R, and Naauman, David. "Rutting Rate Analyses of the AASHO Road Test Fiexible Pavements". Transportation Research Board No. 1384, 1993, pp. 36.
Tracy, D.M., and Barsoum, RS. "Discussion of "On the Use of Isoparameuic F i t e Elements in Linear Fracture Mechanics". by RS. Barsoum", Int. J. Nurn. Meth. Engineering, Vol 1 1, pp. 40 1-402, 1977.
Tseng, Kuo-Hung., and Lytton, RL. "Fatigue Darnage Properties of Asphaitic Concrete Pavements". Transportation Research Board No. 1286,1990, pp. 150
Tumbull, W. J., Maxweii, A. and Ahlvin, RG. "Stresses and Deflections in Homogenous Soil Masses. Proc. Fiifth International Conference on Soil Mechanics and Foundation Engineering, Paris, vol. 2, 1961, pp. 337.
Uddk, Waheed., Meyer, AH., Hudson, W-R, and Stokoe II, K.H. "Project-level Structural Evaiuation of Pavemats Based on Dynamic Defiections". Transportation Research Board No. 1007, 1982, pp. 37.

Uesbita, K., and Meyerho, G.G. 1976. 'Wection of Multilayer Soil Systerns". Journal of the Soil Mechanics Div., Proc. ASCE, Vol. 93, SMS, pp. 257.
Ueshita, K and Meyerhof: G.G. "Surface Displacernent of an Elastic Layer Under Umfody Distributed Loads". Highway Research Record 228, HRB, 1968, pp. 1.
Ullidtz Per. Pavement Analvsis. Vol. 19. 1987. pp. 3
üiiidtz, P. "Overlay and Stage by Stage Design". Fourth internationai Coderence on the Structural Design of Asphalt Pavements, Vol. 1, Augun 22-26, 1977, pp. 722-735. Department of Civil Engineering, College of Engineering, University of Michigan, Aan Arbor, Michigan USA
UUidtz, P. and Peattie, K.R "Pavement Analysis by Programmable Caldators''. Journal of the Transportation Engineering Division, Roc. ASCE, Vol. 106, TES, 1980, pp. 58 1.
UUidy P. and Stubstad, RN.. "Structural Evaluation of Highway and Airfield PCC Pavements Using the Falhg Weight Deflectometer". Undated Pre-print at the 1st Nonh American Conférence on Pavement Managemat System., 1985
Ullidtr, P., Stubstad, RN. "Analytical-EmpiricaI Pavement Evaluation Ushg the Falhg Weight Defiedometer". Transportation Research Board No. 1022, 1 985, pp. 36.
Ullidtz, Per. "Mathematical Model of Pavement Perfomüuice Under Moving Wheel Load". Transportation Research Board No. 1 3 84, 1993, pp. 94.
Uzan, J., Briggs, R, and Scullion, T. "Back-calculation of Design Parameters for Rigid Pavements". Transportation Research Board No. 1 377, 1992, pp. 107.
Van Dijk W. "Practical Fatigue Characterization of Bituminous Mixesy'. Proc. Association of Asphalt Paving Technologists, Vol. 44, 1 975, pp. 38-74.
Van der Loo, I.M.M. "Simplifiecf Method for EvaIuation of Asphalt Pavements". Proc. F i f i Intemational Conférence on the Structural Design of Asphalt Pavements, Vol. 1, August 23-26, 1982. pp. 475-485. The Delft University of Technology in the Netherlands.
Vaswani, N.K. ''Method for Separately Evaluating Structural Performance of Subgrades and Overlaying Fiexible Pavements7'. Highway Research Record 362, pp. 48, 1 97 1 .
Versttraeten, J., Romain, J.E., and Veverka, V. "The Belgian Road Research Center's Overail Approach to Asphah Pavement Structural Design7'. Proc. 4th International Conférence on the Structural Design of asphalt Pavements, pp. 298-324, University of Michigan, AM Arbor, August 1977.
Verstraeten, J., Veverka, V., and Fmcken, L. "Rational and Practical Design of Asphalt Pavements to Avoid Cracking and Runllig". Proc. 5th Intemationai Conference on Smictural Design of Asphalt

Pavements, Vol. 1, August 23-26, 1982, pp. 45. The Delft University of TechnoIogy in the Netherlands.
Vesic, Aleksandar Sedmak and Domaschuk, Leoaard. "Theoretical Analysis of Structural Bebavior of Road Test Flexible Pavements". National Cooperative Hïghway Research Program, Report No. 10, Highway Research Board, 1964.
V i n , T.S., Janao, V.C., Haas, RC.G. "Summary Report Low Tempefatwe and Thermal Fatigue Crackingy'. Report. SHRP-A/IR-Se00 1. Strategic Highway Research Program, National Research Coucil, Washington, D.C. 1990.
Wang, Fuming., and Lytton, Robert L. "System Idensification Method for Back-calculation Pavement Layer Properties". Transportation Research Board No. 13 84, 1 993, pp. 1.
Wang, M.C., and Anderson, RP. "Load Equivalency Factors of Triaxle Loading for Flexible Pavements". Transportation Research Board No. 8 10, 198 1, pp. 42.
Wang, M.C., Anani, B.A "Evaluation of In-Situ Elastic Moduli fiom Road-Rater Deflection Basin". Transportation Research Board No. 8 10, 198 1, pp. 54.
Weissman, S., and Sousa, J.B. "In Quarterly Report to SHRP: Performance-related Testing and Measuring of Asphah-Aggregate Interaction and Mwures (QR-UCB-A-003A-9 1-3) July-September 199 1. University of California, Berkeley 199 1.
W~ams, M.L., and Calif, Pasadena "On the Stress Distribution at the Base of a Stationacy Crack". Joumal of Applied Mechanics, March 1957, pp. 109.
Wiseman, Gdalyah., Greenstein, Jacob., and Uzan, Jacob. "Application of SimpLified Layered S y stem to MIT Pavement Evaluation" . Transportation Research Board No. 1 022, 1985, pp. 29.
W~ttels N., El-Korchi T. "Visual Appearance of Surtace Distress in PCC. Pavements: il. Crack Modeliog". Transportation Research Board No. 1260, Washuigton, D.C. 1990, pp. 84
Yandeü, W.O. "Possible Effkct of Relative Plastic Behavior of Pavement Layers on Permanent Life". Transportation Research Board No. 930,1983, pp. 86.
Yaw, Boateng-Poku. "Testhg and Modeling of Subgracîe Resilient Moduli for Tennessee Soil's" A Ph-D. Dissertation, The University of Tennessee, K a o d e , 1988.
Yazdani, J.I., and Sailion, T. "Cornparkg Mea~uced and Theorehical Depth Deflections Under a Falling Weight De&dometer Using a Mdtidepth Ddectometer". Transportation Research Board No. 1260, 1990, pp. 216.
Yoda, E.J., Witcnck M.W. Princides of Pavement Desim, Second Edition 1975. op. 24.
Yuan, Deren., and Naazarian Soheil. "Rapid Determination of Layer Properties of Pavements From Surface Wave Method". Traosportation Research Board No. 1 3 77, 1 992, pp. 1 59.
Yuan Kuag, Kuang. "A New Method in Correlation Smdy of Pavement Deflection and Cracking". Proc. 2nd International Coderence on the Structurai Design of Aspbalt Pavements, August 7-1, 1967, pp. 1037.
ZafEu, Raja I., and Sayda, Mark B. "Factors Meeting Determination of Transverse Cracks in Jointed Reinforcd Conaete Pavements". Transportaîion Research Board No. 1307, 1993, pp. 162.
ZagMoul S., White T. "Use of a Three Dimensionai Dynamc Finite Element Program for -sis Flexible Pavement". Transportaiion Research Board No. 1388, Washington, D.C. 1993, pp. 60
Zaniewski, John P., and Hossain Mustaque. " E f f i of Thickness and Temperature Conections on Prediction of Pavement Structural Capacity Using Falhg Weight Deflectometer Data". Transportation Research Board No. 1377, 1992, pp. 193.
Zhou, Haiping., Hicks, RG., and Bell, C.A. "BOUSDEF: A Back-caldation Program for Deteminhg Moduli of a Pavement Structure". Transportation Research Board No. 1260, 1990, pp. 166.
Zhou, Haiping., Huddleston, Ji., and Lundy, James. "Implementation of Back-caldation in Pavement Evaluation and Overlay Design in Oregon". Transportation Research Board No. 13 77, 1992, pp. 150.
Zienkiewicz O.C., and Cheung, Y.K. The Fite Element Method in Structural and Continuum Mechanics. 1 967.
"Surface Cracking in Asphah Layers" Report No. 4. for Center for Research and Contract Standardization in Civil and T r a c Engineering". 7he Netherlands, March, 1990.

Tbeoreticai Backgmund of ANmS Ragram for a twodimedd Mparametric Saüd Element (Stiff 42) k (swam~~ s p t ~ ~ XUC (SASL), mms ~nhko IA [ml)

STIF42 - TWO-DIMENSIONAL ISOPARAMETRIC SOLID ELEMENT
u,(l+s)(l-t)+ u,(l+ s)(l+ t)+
u,(l- sXl+ t))
(an4 ifmodified extra shapes
are included (KEYOP(2)
* 1) and eiement has 4
unique nodes
motions normal to the edge
dong the centerline are
suppressed for axisymmetric
elements near the centdine)

without modifieci extra
displacement shapes
Stress smess Matrix
Same as stü&ess matrix
without modifieci extra
Themai and Newton-
Raphson Load Vector
Load Vector for Pressure
Same as m e s s rnatrix
Same as stifiiless ma*
without modifieci extra
aisplacernent shapes,
speciaüzed to the edge
Element Temperature Distribution: Bilinear across element, constant thni thickness or
around circumference
Nodal Temperature Distribution: Sarne as element temperature distribution
Pressure Distribution: Uniform dong each side
References: Wilson(3 8), Taylor(49)
Derivation of Element by Virtual Work
A complete derivation of the ekment matrices and load vector are developed for this
elernent. The principle of virtual work is used in derivation beiow:

8u = 6v
where:
6u = Waialstrainenergy
6v = virtuai e x t e d work
"Nal strain energy may be expresses as:
Gu = 1 ( 6 ~ ) ~ {a)d(vol) vol
where:
= strain vector
t = stress vector
These two vectocs, both in the element coordinate system, are related by:
where:
1 O -
GXY
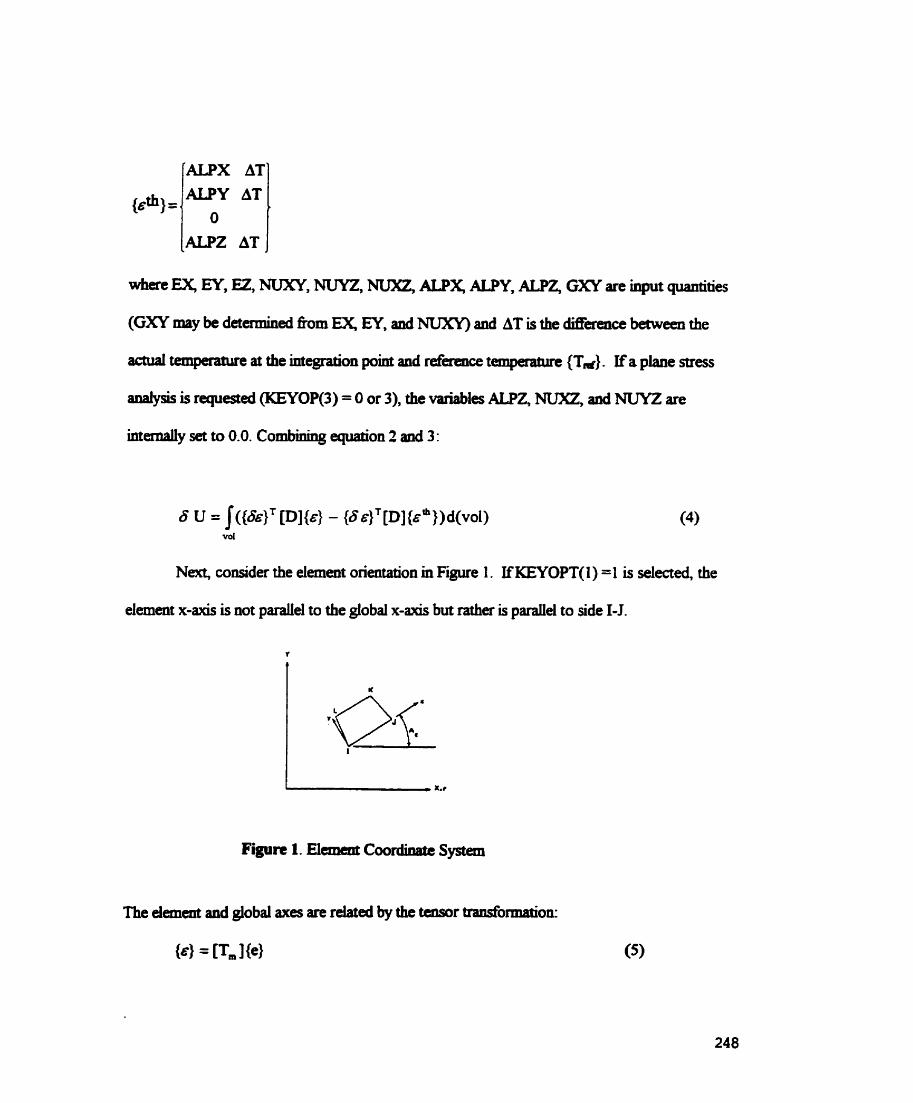
ALPY AT P}=/ * 1 whae UC, EY, EZ, NUXY, MiTYZ, N ü X Z , ALPY ALPY, ALPZ, GXY are input Quantities
(GXY may be determineci fiom EX, EY, and NUXI) and AT is the thekence between the
aaual tmipaanuc at the integration point and reference tempaatrae (Td}. If a plane stress
adysis is requested (KEYOP(3) = O or 3), the variables ALPZ, NUJE, ad NWZ are
i n t e d y set to 0.0. Combining equation 2 lad 3:
vol
Next, consider the element orientation in Figure 1. ïfKEYOPT(I) =1 is selected, the
element x-axis is not p d e l to the global x-axis but rather is paraiiel to side 1-J.

and: C = COS{&)
+ 1 if nodes ordered counter clockwise P= { - 1 if nodes ordered clockwise
This tensor transformation has been derived by Lekbnitskü (24). Combining equation 4
and 5 :
te that if A, = O., [Tm] reduces down to an identity matrix.
Next, the strains must be related to the shape fùnctions. It is known fiom basic
elasticity theory that:

where r is the radial coordinate of the htegration point and where ail variables are in the global
coordinate system. Equation 10 is included oniy ifthe problem axisyrnmetric (KEYOPT(3)
=1). u and v are defined t h the displacement ninctions.
These are repeated here, including the extra displacement fùnctions (KEYOPT(2) = 0):
and
V = h1vI + hjvj + hKvK + hLvL + hlvl + h2v2
where: ui = u-displacement (i x-directional) of node 1, etc.
u, = value of ht extra shape hction in x-direction (nodless variable), etc.
1 h, = -(1 - s)(1- t), etc. 4
Note that the extra shape fùnctions (as shown in Figure 2 permit a paraboiic
deformation dong an element edge. Normaiiy this is helpfùi in modeling a structure, but
occasionaiiy it may cause a problem because of inwmpatibility at the adjoining edges of two
different elements. i-e., a gap develops dong the interefement boundaries. Because of this
problem, ANSYS uses a mndified fom of the extra displacement shapes. For completeness of
250

theoretical dmlopmeat, a detailed devdopment of the dement sti5ess matrix formujation
wRh the standard extra shape îunctions is carrieci out. Later discussion is preseated regarding
the modification of the e&a of the extra shapes (Tayior, et.d (49)).
The shape hctions, whïch define both u ad v, are now combineci with ecpatious 7
tbni 10 in order to relate the strains to the nodal displacements as:
dh, Bh, ah, d h , d h , d h , a h c. a h L - - - - - - d y dx dy dx d x d y dy d x
Bhi ah i where hi - , - , and R are speaalized to the w o n point bemg studied.
ôx a y

Equation 15 can be reduced in matrix form as,
in equation 15 we see that the denvatives of the shape hctions (hI -.---b) are with respect to x
and y, while these shape fùnctions are functiom of s and t (see equations 1 1 and 12. For a two-
dimensionai quacirilateral element, the s - t coordinates are related to the x- y coordinates as:
and
where:
hi . . . . .. .h = shape hctions (equations 1 1 thru 12
XI = coordinate of node I, etc.
e transition of equation 15 fiom one set of variables to the other is handled with the
help of "chah de". The derivatives of with respect to s and t may be expresses as:
ô h , - d h , d x d h , d y ---- +-- B t d x dt dy Bt

in matrix fom equation 2 1 and 22 can be d e n as:
The 2 x 2 matrix in equation 23 relating dupe fùnction derivatives with respect to 104
(S - t) and global (x - y) coordinate system is known as the Jacobian ma& Inverting equation
23:
For later convenience, the inverse of the (2 x 2) Jacobin rnatrbc as used in equation 23
will be defined as,
where:
d x d y d y B x A = - - - - - d s d t 8 s d t
A is defhed as the determinant of Jacobian ma* and is simply referred to as the
Jacobian. The Jacobian is the mapping factor relating the s - t and x - y coordinate systems. For
a parallelogram, the Jacobian is the ratio of the elernent area in x - y space divided by 4.0 (the
elernent area in s - t space). Thus, equation 24 can be written as:
d h d y d h , d y d h , -' = (+- --- -) / A d x d t d s 8 s d t
a h a- d x d h , d x d h , - (+- --- -) 1 A 8~ d t 8 s d s d t
Combining equation 6 and 18
This results in:
and

USng equation 17, the resuits in equation 27 caa be M e r expanded as:
where, k] and are the stifhesses involving nodal and extra degrees of fieedoms,
respectively, and
Similady, the load vector is expanded to be:

= (Pm lTFm I~PI{& ?} d (vol)
vol F I T [Tm If PI {E th
so that
From equations 3 1 and 38 it is clear that when the extra shapes are dropped, the eletnent
stiffness and load vector computation becomes simphfied as,
and
When the extra shape fùnctions are used, a 12 by 12 mfniess matrix is generated. This matrur
must then be condensed by an 8 by 8 ma* because there are oniy 8 degrees of fieedom to
connect to the rest of the stnichire. The condensation is andogous to that associateci 4 t h
superelement generation (equation 1.10.8)). The load vector may also be generated with 12
ternis and is then also condensed to 8 (like equation (1.10.9)).

Modified Extra Displacement Shapes
This section comments on the ramifications and possible modifications of extra
displacement sbapes for both the plane stresdplane strain case aad the aMsymmetric case.
Extra shapes d o w the element to move more flexibly. This flexibility is especialiy needed in
bending environments. However, extra shapes can cause the element to be "incompatible" and
lead to poor r d t s . For the plane stresdplain strain case, the element with extra shapes will not
pass the patch test unless the element geometry is that of a parallelogram (Taylor, etal. (49)).
For the axisymmetric case, the satisfaction of patch test is not in general possible, even when
the elernents are rectangular, and no proposed modification has been found that d o r m l y
improves the results. Howwer, a scheme ( r e f e d to as the modifiai extra shape option) is
presented below, which ensures satisfaction of the patch test for the plane stressfplane strain
case (and the sarne procedure is also offered for the axisymmetric case).
For this element to pass the patch t e r it is required that (14) (displacements involving
the extra shapes) be zero, whenever {u,,) (nodal displacements) corresponds to rigid body
motion or constant stress state. Now define {b} = {v,) as the set of nodal displacements
which corresponds to an arbitrary constant stress date. Then, the element equilibrium
equations become:

Since {uJ = (O}, equation 44 becomes:
LI'' LI {vol = (0) (45)
&]-' is positive defimte anâ, therefore, cm canever of itseifmake the lefi hand side of equation
45 equal to zero, so that it c m be dropped:
LI (vol = ( 0 )
Substituting equation 33 in for LI, and moving {vo} kto the integrai,
From the assumption on {v.} it is observeci that the term ([T.]~~][T,][B,,](v.)) is in
fact the arbitrary constant stress state { a }, so that it cm be separated fiom equation 47 as,
vol
Now, since N e s s vector { rr ) is, in general, not equal to zero, equation 49 reduces to:
From equations 15 and 16 maük [G] for plane stresdplane nrain case can be expressed as,

3 h, Replacing - and - ô ' h m equations 24,25 and 5 1 d x 8~
0 Q:, Q,, [QI = Qz1 Q22 Q ~ I 412 1 O
equation 52 can be written as:
[el [QIDI

Now to enforce the satisfaction of ecpation 50, the procedure suggested by the refkrence
(Taylor, etal. (49)) is to compute [QI in equation 53 at the centroid (origin) of the element:
[Qcl = [QI~,=,=, (56)
and replace ma& [QI in equation 55 by [Q,], creating a modified [G] matrix:
[Gml = mm1 (57)
F i i y to compute the stifbess matrix for modified extra shape niaction option the [G] matrix
in equations 33 thru 35 and equation 40 is replaced by [G.] fkom equation 57.

M d FonnuJaaOn By ANSYS

!This model can be altered to any dcsirPd width and any desireà heigt as well as any desirrd !number of layers in flexible pavements. !This model is for one layer flexible pavement.
/BATCH ICOM,ANSYS REVISON 5.2 /M'TLE70NE LAYEX MODEL xl=l5000 ht=i 5000 Mpa4.6 E1=300 n l4 .35 a=lSO ! the units of the dimensions are in mm and toald is in Mpa. /PREP7 !key points generation $1 k27d70 k3,Abt ls4,Oht save !Length segment generation L I 72 l h 3 1747 1 1,372 save !Area generation 4 1 7273 94 !element type, axisymmetrical problem et¶ 1 ,42,7,1 !Material properties mp,=7 1 ,e 1 ~ P ~ U X Y J P ~ save
le~ize,aiI,,~6O J, 1 eshape,2 !quadrateral shapes amesh7aii

! boundary conditions nsel,s,loc,x,O 4 ~ 7 w 0 , O nsel,s,loc,x,xl dam070 I = l 7 s 7 k ~ , O
4aw0,o, , ,uy Save !Lod application nse17s,loc,y, 1 5000,14999.99 nsel,r,Ioc,x,O, 1 50,l sf,all,pres,mpal !surface load as a pressure on a plate of a radius save !The following select commands were generated by the allsel connnand vse17aU ase1,ai.i lse1,all kse1,d esel,all nse1,all /psfpres,2 !place the pressure on the mode1 h s h holu lswrite, 1 save outres,all,di outpr,basic,dl lsohre, 1 save finish

!This mode1 can be altereà to any desired width and any desired heigt as wel as any desired !number of iayen in flexible pavements. !This modd is for two layeis flexible pavement.
/BATCH /COM,ANSYS REVISON 5.2 l'KI'LE,ONE LAYER MODEL xi=l5OOO hl=300 b2=14700 ht=15000 Mpa=O .O el=300 e2=70 1114.45 n24.45 a=l50 ! the units of the dimensions are in mm and toald is in Mpa. PREP7 !key points genedon isl k2,A>O is3,AW is4,OM 45,w kW& save
!Area generation %4,3,6,5 2 12,3,4

save !element type, axisymmeûical problem
!Meshing procedures
!area selection and assigned to each matenal asel,s,area,, 1 a a l , l , l asel,s,area,,2 =3%2,2,2 eshape,2 !quadrateral shapes a~e1,d.l ameshall ! boundary conditions
!had application nsel,s,loc,y, 1 5000,14999.99,l n~el,r,loc,~,O, 1 5 1,l scall,pres,mpal !surfiace load as a pressure on a plate of a radius save !The following select commands were generated by the dsel command
265

vsel ,al1 ase1,aI.l Ise1,al.i ùsel,all esel,all nse1,ail /psf,pres,2 !place the pressure on the mode1 h s h /solu lswrite, 1 save tune,O.6 outres,aU,aU outpr, basic,all lsolve, 1 save finish

!This model can be dtereà to any desVed width and any desired heigt as well as any d e s i d !number of layers in flexible pavements. !This model is for three layers flexible pavement.
/BATCH /COM,ANSYS REVISON 5.2 ITITLE,ONE LAYER MODEL xl=I 5000 hl=100 h2=300 h3=14600 h4=14900 ht=l5OOO Mpa4.6 el =IO00 !or 6000 for sûff top layer e2=350 e3=70 n l4 .35 1124.40 1134.45 a=150 ! the uaits of the dimensions are in mm and toald is in Mpa. iPREP7

!Meshg procedures lsel,s,he,, l,4,l lesize,aü,,, 100 lsel,sJine,,5,6,1 lesize,ail,,,50 lsel,s7he,,7,8, l lesize,all,,,4 lsel,s,he,,9, 1 O, 1 lesize,a.,,2 !area selection and assigned to each matenal asel,s,area,, 1 =Kl,l,l asel,s,area,,2 aatt2,2,2 asel,s,area,,3 =tt,3,3,3

eshape2 !quadrateral shapes ase1,ai.i amesh,aîi !boundary conditions nsel,s,loc,x,O d~l2ioz0,O nsel,sJocp,xi ~ ~ ~ ~ 0 , O nsel,s,loc,y,O 4 ~ ¶ w o ¶ o , ¶ ¶ ~ ~ save !Load application nsel,s,loc,y,15000,14999.99,1 nsel,r,loc,x,O, 1 5 1,l sf,ail,pres,mpal !surface load as a pressure on a plate of a radius save !The following select commands were generated by the dsel command vse1,ail ase1,aI.l lse1,ail ksel,all ese1,all nse1,all /psf,pres,2 finish /solu Iswrite, 1 save time,O .O outres,ali,ali outprybasic,aI.l lsolve, 1 save finish
!place the pressure on the mode1

!This model can be altered to any desired width and any desired heigt as weH as any desird !number of iayen in flexible pavements. !This model is for four layers flexible pavement.
/BATCH / C O m S Y S REVISON 5.2 /TITLE,ONE LAYER MODEL xi=15000 hl=100 h2=300 h3=l O0 h4=l46OO h5=l49OO h6=l47OO ht=15000 M m . 6 el=1000 !or 6000 for s t S top layer e2=1 O000 !vev s t B second layer (compound pavement) e3=350 e4=70 n l 4 . 3 5 1124.15 n34.40 1141045 a=lSO ! the units of the dimensions are in mm and toald is in Mpa. PREP7 !key points generation isl 4 2 , w k3 , W 4 44,oJi4 is5,OM k6YAb6 is7,OM is8,XlW k9,W k 1 O y x W Save

!Length segment generation 1 9 1 9 2
1,493 1,576 1973 l,9,lO 1 9 1 54 /2,3 1,495 1,396 1,5,7 1,698 1,799 178, 1 O save !Area generation is7,8,10,9 is5,6,8,7 is4,3,6,5 is 12,334 save ! element type, axisymmetrical problem ec 1,42,,, 1 ec2,42,,, 1 ec3,42,,, 1 ec4742,,, 1 ! Material properties

lse17s,he,,6,7, 1 lesize,d,,,50 lse17s,line7,89, 1 lesize,aU,,,2 lsel,s,iine,, 1 O, 1 1,l lesize,aü,,,4 lsel,s,line,, 12,13,1 lesize,all,,,2 !area selection and assigned to each material asel,s,area,, 1 = % W asel,s,area,,2 aa%2,2,2 asel,s,area, f =%3,3,3 asel,s,area,,4 aatt,4,4,4 eshape,2 !quacirateral shapes ase1,all amesh,d !bounciary conditions nsel,s,loc,x,O iiau,wo,o nsel,s,loc,x,xl &~,wO,O nsel,s,loc,y,O &~,w~,O, , ,uy Save !Load application nsel,s,loc,y, 15000,14999.99,l nsel,r,loc,qO, 1 5 1,l sf,d,pres,mpal !sUTface load as a pressure on a plate of a radius Save !The following select commiuids were generated by the allsel cornmand vse1,ail asel,aU lse1,aIJ kse1,all esel,all

nse1,all /pstpres,2 !place the pressure on the mode1 h s h /solu lswrite, 1 save tirne,O .O outres,ali,all outpr, basic,all lsolve, 1 save finish

! This mode1 can be aitered to any desired width and any desired be@t as wel as any !deSind number of laylers m flexible pavemnts. ! Tbis mDdel is for a siogie crack of 10.15 and 25 w of three- layer system at a distaoce ! of 200 mm. This program could be used at any distances, as an example: dl= 200,550, !9SO, 1500 and etc. / Batch 1 Com, ANSYS Revision 5.2 I input, m n i s t , tmp
/pep7 x1=150 x2=xl+50 w= 10 ! 15 ! 25 ! Crack width in mm x3= x2+w x4=x3=+50 xL= 15000 ! The section total width (15 m) h 1 = 100 ! Height of the first layer in mm k 3 0 0 ! Height of the second kyer in mm h3=14600 ! Height of the third iaycr m mm ht= 15000 ! Total height of the systern in mm
El=laoO !inMpa. E2=350 ! in Mpa. E3=70 ! in Mpa. n l d . 3 5 ! Poisson's ratio of first layer n2a.M ! Poisson's ratio of second kyer n3r0.45 ! Poisson's ratio of the third layer
Mpal= 0.60 ! Truck bads in Mpa. Save
! Generating tk mode1 ! Key points

! Length segments

! Elemnt types used in the mode1


! Lod application as a pressure (sf)
sf,all,pres,mpal
k=Ld eseLd
/psf,pres,2 finish Isolu iswrite, 1 save ti.rie,o.60 outres,alî,aU putpr,basic,d Isolve, 1 save finish

Finite Element Meshes Geœrated by ANSYS Pmgram for Ail Mdeîs

No Crack One Layer Mode1

No Crack Two-Layer Model

No Crack Four-Layer Mode1

No Crack Three-Layer Model: 3 m x 15 m

No Crack Th~ee-Layer Model: 7.5 m x 1 5 m

Crack of 10 mm at 550 mm: Three-Layer Mode1

Crack of 10 mm at 950 mm: Three-Layer Mode1

Crack of 1 O mm at 1500 mm: Three-Layer Mode1

Haif Depth Crack: Three Layer Mode1

Double Cracks: Three-Layer Mode1

(a) Tables of Theoreticai Predicted Data Genemted by ANSYS
(b) Some Selective Field Data Gatbereà Fmm Western Manitoba

Table 5.2 Data for No Crack ONE LAYEK MODEL: El = 300 MPa
1 Distance in mm 1 Deflection in mm 1
Table 5.3 Data for No Crack TWO-LAYER MODEL: El = 300 MPa. and E2 = 70 MPa.
1 Distance in mm 1 Deflection in mm 1

Table 5.4 Data for No Crack THREE-LAYER MODEL: E1=1000 MPa., E2 = 350 MPa and E3 = 70 MPa.
1 Distance in mm 1 Deflection in mm 1
Table 5.5 Data for No Crack THREE-LAER MODEL: El = 6000 MPa., E2 = 350 MPa and E3 = 70 MPa.
1 Distance in mm 1 Deflection in mm 1

Table 5.6 Data for No Crack FOUR-LAYER MODEL: E 1 = 1 0 û MPa., E2 = 10000 MPa, E3 = 350 MPa and E4 = 70 MPa.
Distance in mm r
Deflection in &n O -0.336 *

Table 5.7 Cornparison of thne uncracked Sections: 3 m, 7.5 m and 15 m in Length of three-layer system of El = 1000 MPa, ~2 = 350 MPa and E3 = 70 MPa

Table $8 Cornparison of three uncracked sections: 3mm, 7.5 m and 15 m in Length of three- hyer system of El = 6000 MPa, E2 = 350 MPa and E3 = 70 MPa

Table 5.9 Open Crack 10 mm Wide at 200 mm from the Load: E 1 = 1000 MPa, E2 = 350 MPa and E3 = 70 MPa
1 Distance in mm ( Deflection in mm 1
Table 5.10 Open Crack 10 mm Wide at 5M mm from the Load: E 1 = 1000 MPa, E2 = 350 MPa and E3 = 70 MPa
Distance in mm 1
O
Deflection in mm -0.642

Table 5.11 Open Crack 10 mm Wide at 9M mm from the Load: El = 1Oûû MPa. E2 = 350 MPa and E3 = 70 Mpa
1 Distance in mm 1 Deflection in mm 1
985 -0.149 1010 -0.146
,n r i i

Table 5.12 Open Crack 10 mm Wide ai 1500 mm from the Load: El = 1000 MPa, E2 = 350 MPa and E3 = 70 Mpa
Distance in mm O
Deflection in mm 4.668

Table 5.13 Open Crack 15 mm Wide at 200 mm from the Load: El = 1 0 0 MPa, E2 = 350 MPa and E3 = 70 MPa

Table 5.14 Open Crack 25 mm Wide at 200 mm from the Load: El = 1ûûû MPa, E2 = 350 MPa and E3 = 70 MPa
1 Distance in mm 1 Deflection in mm 1

Table 5.15 Open Crack 15 mm Wide at 5%) mm from the Load: E 1 = 1000 MPa, E2 = 350 MPa and E3 = 70 MPa
Distance in mm 1 Defîection in mm 1

Table 5.16 Open Crack 25 mm Wide at 550 mm from the Load: El = 1ûûû MPa, E2 = 350 MPa and E3 = 70 MPa
1 Distance in mm 1 Deflection in mm 1
1 zoo -0.121
-0.07 1 -0.057
2350 -0.047 -0.039

Tabk 5.17 Open Crack 15 mm Wide at 950
1 Distance in mm 1 Deflection in mm 1
mm from and E3 =
the Load: 70 MPa

Table 5.18 Open Crack 25 mm Wide at 950 mm from the Load: El = 1000 MPa, E2 = 350 MPa and E3 = 70 MPa
1 Distance in mm 1 Defiection in mm 1

Table 5.19 Open Crack 15 mm Wide at 1500 mm from the Load: El = 1 0 0 MPa, E2 = 350 MPa and E3 = 70 MPa
1 Distance in mm ( Deflection in mm 1

Table 5.20 Open Crack 25 mm Wide at 1500 mm from the Load: E 1 = 1000 MPa, E2 = 350 MPa and E3 = 70 MPa
1 Distance in mm 1 Deflection in mm 1

Table 5.21 Open Crack 10 mm and of d/2 at 200 mm El = 1ûûû MPa, E2 = 350 MPa and E3 =
from the Load: 70 MPa
1 Distance in mm 1 Deflection in mm 1
Table 5.22 Open Crack 10 mm (Double Cracks) at 200 mm from the Load: EI = 1 0 MPa, E2 = 350 MPa and E3 = 70 MPa
1 Distance in mm 1 Defiection in mm 1

Table 5.23 Closed Crack 1 mm Wide (Spring Element): E l = 1 0 MPa, E2 = 350 MPa and E3 = 70 MPa
1 Distance in mm ( Deflection in mm
Table 5.24 Closed Crack 2 mm Wide (Spring Element): El = 1000 MPa, ES = 350 MPa and E3 = 70 MPa
1 Distance in mm 1 Deflection in mm 1

Table 5.25 Closed Crack 5 mm Wide (Spring Element): El = 1 0 MPa, E2 = 350 MPa and E3 = 70 MPa
1 Distance in mm 1 Ddection in mm 1
Table 5.26 Closed Crack 10 mm Wide (Spring Element): El = 1000 MPa, E2 = 350 MPa and E3 = 70 M p a
1 Distance in mm 1 Deflection in mm (

Table 5.27 Closed Crack 15 mm Wide (Spring Element): El = 1000 MPa, E2 = 350 MPa and E3 = 70 MPa
1 Distance in mm 1 Deflection in mm 1
Table 5.28 Closed Crack 25 mm Wide (Spring Element): El = 1Oûû MPa, E2 = 350 MPa and E3 = 70 MPa
1 Distance in mm ( Deflection in mm 1

Table 5.29 Closed Crack 50 mm Wide (Spring Element): E 1 = 1Oûû MPa, E2 = 350 MPa and E3 = 70 MPa
Distance in mm O
Deflection in mm -0.650

Table 5.30 Closed Crack 1 mm Wide (Spring Element): El = 6000 MPa, E2 = 350 MPa and E3 = 70 MPa
1 Distance in mm 1 Deflection in mm 1
Table 5.31 Closed Crack 2 mm Wide (Spring Element): El = 6000 MPa. E2 = 350 MPa and E3 = 70 MPa
- - - -- -
Distance in mm Deflection in mm 1
O 1 4.493 30 -0.49

Table 532 Closed Crack 5 mm Wide (Spring Element): E 1 = 6000 MPa, E2 = 350 MPa and E3 = 70 MPa
1 Distance in mm ( Deflection in mm 1
Table 5.33 Closed Crack 10 mm Wide (Spring Element): E 1 = 6000 MPa, E2 = 350 MPa and E3 = 70 MPa
1 Distance in mm 1 Deflection in mm

Table 5.34 Closed Crack 15 mm Wide (Spring Element): El = 6ûûû MPa, E2 = 350 MPa and E3 = 70 MPa
1 Distance in mm 1 Denection in mm 1
Table 5.35 Closed Crack 25 mm Wide (Spnng Element): El = dOOO MPa, E2 = 350 MPa and E3 = 70 MPa
1 Distance in mm 1 Deflection in mm 1

Table 5.36 Closed Crack 50 mm Wide (Spring Element): El = 6000 MPa, E2 = 350 MPa and E3 = 70 Mpa
Distance in & r
. O 30
Deflection in mm -o.= 9.52

R B 0 4386 90060763A331A336FlO 700071018002-063 03111 6 150 O 203 305 457 610 914 1524 5.5 O 8 12 18 24 36 60 c : \DATA\ . FWD TC-001 WESTBOUND LANES 46KM WEST OF BRANDON, MANITOBA S500 F3 27 3766 81 5550 F3 4387 0' 100'0' 100'0 .O95 8 15 3.5 5 2 15 2 8 Ld 108 1 94.46 Dl 881 1.001 1.062 D2 882 1.003 1.089 D3 883 .999 1.085 D4 884 .999 1 .O69 D5885 .999 1.129 D6 886 1.002 1.096 D7 887 .997 1.105 DO 888 1 1 .O95 D* *te** 1 1 D* ***** 1 1 VANSAMBEEK, ROBERT 3 . llllO6lO...... .................. 12.60 6.1 O ............... *83A331 HIGHWAY, DIRECTION, CITY AND DI STANCE HIGHWAY, *SECTION .................................................. *....*.......................
O .. ...... 32 O .... .. 1234567890123456789. . . . . .......................-....---------** e * - * a . ~ * * - . . . . * *
C C C 1 1 1 1 2 2 2 2 3 3 3 3 4 4 4 4 1 1 1 1 1 1 1 1 1 1 1 1 1 1 1 1 1 1 1 1 1 1 1 1 1 1 1 1 1 1 1 1 1 1 1 1 1 1 1 1 1 1 1 1 1 4 4 4 4 4 4 4 4 4 4 4 4 4 4 4 ..................*.............................................**.....**...*.. ,,,***.tStt*8**t***~***t**~******C**8*t*********~*~*~************************** ...............................................*..... * * * . . . . . * . . * a . * . . . . . . . . . . . ......=...*...*...*.....-.....................................*................ SHRP TESTING - FLEXf BLE - BASIN TEST (PO ,FI ,F3) *83A331 SO F3 25 D61610 77 384 279 210 167 115 86 56 34 6112 10.97 8.26 6.57 4.54 3.37 2.21 1.3 386 273 210 166 115 86 56 33 6128 10.76 8.26 6.53 4.54 3.37 2.21 1.3 386 273 209 166 115 86 56 34 6128 10.76 8.21 6.53 4.54 3.37 2.21 1.3 387 274 209 167 115 86 56 33 6152 10.80 8.21 6.57 4.54 3.37 2.21 1.3 566 393 299 241 170 127 81 47 9000 15.49 11.78 9.47 6.69 5.02 3.20 1.8 566 395 300 242 172 129 83 50 8992 15.57 11.83 9.52 6.77 5.06 3.29 1.9 568 394 300 242 170 127 81 47 9016 15.53 11.03 9.52 6.69 5.02 3.20 1.8 566 395 300 242 171 127 82 48 9000 15.57 11.83 9.52 6.73 5.02 3.24 1.9 760 522 398 323 232 174 112 65 12072 20.55 15.65 12.72 9.12 6.84 4.41 2.5 761 523 398 323 231 173 1 1 1 64 12096 20.59 15.65 12.72 9.08 6.79 4.37 2.5 759 523 399 324 231 174 112 66 12064 20.59 15.70 12.76 9.08 6.84 4.41 2.6 762 524 400 323 231 174 112 65 12104 20.63 15.74 12.72 9.08 6.84 4.41 2.5 1044 674 517 421 303 229 146 83 16584 26-53 20.34 16.56 11.94 9.01 5.75 3.2 1045 678 519 422 305 231 148 84 16600 26.70 20.43 16.60 12.02 9.10 5.84 3.3 1046 678 519 423 305 231 148 85 16624 26.70 20.43 16.64 12.02 9.10 5.84 3.3 1046 677 519 422 305 231 148 84 16616 26.66 20.43 16.60 12.02 9.10 5.84 3.3 S50 F3 24 161613 76 386 265 192 147 100 71 45 26 6136 10.42 7.57 5.80 3.95 2.80 1.77 1.0 387 264 192 148 100 73 46 28 6144 10.38 7.57 5.85 3.95 2.09 1.82 1.0 387 263 191 147 101 72 45 26 6144 10.34 7.53 5.80 3.99 2.84 1.77 1.0 386 265 193 150 103 73 47 29 6136 10.42 7.61 5.89 4.04 2.89 1.86 1.1 567 373 273 215 150 108 68 39 9016 14.69 10.75 8.45 5.89 4.26 2.66 1.5 566 374 273 215 150 108 68 39 9000 14.73 10.75 8.45 5.89 4.26 2.68 1.5 568 377 275 217 151 1 t t 69 41 9024 14-86 10.84 8.53 5.93 4.35 2.72 1.6 568 375 273 215 150 108 68 39 9024 14.77 10.75 8.45 5.89 4.26 2.68 1.5 761 491 360 287 204 151 96 56 12088 19.34 14.19 11.31 8.03 5.95 3.76 2.2 317 757 489 359 286 203 150 93 54 12024 19.25 14.15 11.27 7-99 5.91 3.68 2.1 760 488 359 285 202 149 93 53 12072 19.21 14.15 11.22 7.95 5.86 3.68 2.0

758 487 359 285 20j 148 53 53 1051 629 464 373 268 199 125 69 1053 629 466 374 268 200 125 71 1056 631 466 373 268 200 125 71 1055 633 466 374 268 200 125 71 Si50 F3 24 161615 386 350 245 178 113 81 54 33 384 350 245 178 1 1 3 81 54 33 383 348 242 177 112 80 53 33 384 345 241 176 112 79 52 31 566 489 347 258 167 120 77 45 569 491 350 260 169 121 77 46 567 489 350 259 169 121 77 46 569 490 348 259 169 121 77 46 770 636 458 346 231 166 104 62 773 638 461 349 233 167 105 64 775 640 461 349 233 167 105 63 771 639 460 348 233 168 105 63 1023 810 589 451 308 226 139 83 1024 613 592 453 310 226 141 84 1024 813 592 453 310 226 141 84 1023 814 593 455 310 226 141 84 5250 F3 24 161618 385 288 211 157 103 72 46 28 385 287 211 156 100 71 45 26 384 286 210 156 101 72 45 28 387 288 211 157 100 72 45 26 568 402 299 227 150 108 68 40 568 402 298 225 150 107 67 39 573 402 299 227 150 108 68 40 569 402 299 227 150 108 69 39 765 523 392 300 204 150 94 55 764 521 391 301 204 150 94 55 763 521 390 299 203 148 93 53 765 520 391 299 204 148 92 53 1051 667 502 390 270 199 125 69 1049 668 502 390 270 199 124 68 1049 668 504 392 270 201 126 69 1049 667 504 392 271 200 126 71 S350 F3 27 161621 384 266 189 142 98 73 49 31 385 266 189 143 99 73 49 32 386 266 189 142 98 73 51 32 385 265 189 142 98 73 48 32 568 373 271 207 146 108 71 44 569 377 274 210 148 1 1 1 74 47 569 375 272 208 146 109 72 45 569 375 272 208 146 109 71 45 764 489 357 277 200 149 99 61 762 488 357 276 199 148 98 59 763 488 358 277 200 150 100 62 764 489 358 277 200 150 99 61 1050 626 461 360 263 196 128 77 1051 627 462 362 264 199 130 78 1054 627 463 363 264 199 128 76 1053 626 463 366 263 201 128 77 S450 P3 26 161624 383 296 215 164 I l l 82 54 33 383 298 216 165 112 85 55 35 385 296 215 164 112 83 55 34 384 294 213 164 110 81 54 34 565 421 311 241 167 124 80 50 567 423 311 242 167 124 80 50 565 424 312 243 168 125 81 51 565 422 310 242 167 123 79 48


/ u U U J I U I ~ U U L - ~ o U I ~ J I U . U O U ~ 1 l I O
150 O 203 305 457 610914 1524 5.9 O 8 12 18 24 36 60 C:\FWD\DATA\ . FWD P.T.H. 11 33MI EAST OF WINNIPEG, MANITOBA. S 475F3 41 33 21536 106 90 Heights ........................... S 475F3 41 33 21536 106 90 Heights ........................... 856 1938273537060 .O9 18 15 3.5 5 2 15 2 8 Ldl04 1.00491.48 Dl 821 .995 1.069 D2 828 .987 1 .O69 D3 823 -99 1 .O67 D4 824 .99 1 .O72 D5 825 .993 1 .O82 06826 -989 1.112 D7827 .987 1.130 DO 822 .998 1 .O74 DO 829 1 1 .O92 DO 830 1 1.088 Kohlnhofer Guy W 11010600 . . . . . . . . . . . . . . . . . . . . . . . . 12.60 6.1 O ............... *a30505
. . . . . . . . . a . - . . . . . - . . . . - . . . . . . . . a
16466 -4562 O ........ 32 O ..-... 1 2 3 4 5 6 7 8 9 0 1 2 3 4 5 6 7 8 9 . . . . . . . . . . . . . . . . . . . . . . . . . . . . . . . . . . . . . . . . . . . . . . . . . . . . . . . . . . . . C C C 1 1 1 1 2 2 2 2 3 3 3 3 4 4 4 4 1 1 1 1 1 1 1 1 1 1 1 1 1 1 1 1 1 1 1 1 1 1 1 1 1 1 1 1 1 1 1 1 1 1 1 1 1 1 1 1 1 1 1 1 1 4 4 4 4 4 4 4 4 4 4 4 4 4 4 4 ..................*........................ .................................... *~~**************e****e******************e**e*e********e*******e*e**e**********
. . . . . . . . . . . . . . . . . . . . . . . . . . . . . . . . . . . . . . . . . m . . m . . . . . . . . . . . . . . . . . . . . . . . . . . . . . . . . . . ......*...*...*****...............*........ .................................... "FLEX" QASIN TEST.............. *830505 S OF 3 43 34 161837 108 93 Heights ........................... 372 395 245 183 139 63 30 16 5912 15.54 9.64 7.19 4.30 2.50 1.17 0.6 378 396 246 183 109 66 30 14 6000 15.58 9.68 7.19 4.3G 2.58 1.17 0.5 376 394 245 182 109 63 29 16 5968 15.49 9.64 7.15 4.30 2.50 1 . 1 0.6 373 391 245 182 109 64 29 16 5928 15.41 9.64 7.15 4.30 2.54 1.13 0.6 556 564 363 270 164 95 42 23 8832 22.19 14.29 10.65 6.48 3.72 1.65 0.9 555 568 371 271 166 97 42 23 8824 22.36 14.62 10.69 6.52 3.81 1.65 0.9 554 566 368 270 164 97 42 23 8800 22.28 14.50 10.65 6.48 3.81 1.65 0.9 555 567 369 271 164 97 42 23 8824 22.32 14.54 10.69 6.48 3.81 1.65 0.9 749 737 485 361 225 135 57 31 11904 29.02 19.11 14.22 8.86 5.33 2.25 1.2 749 738 486 361 225 134 57 32 11896 29.C6 19.15 14.22 8.86 5.29 2.25 1.2 749 740 489 363 225 135 58 32 11896 29.15 19.23 14.31 8.86 5.33 2.29 1.2 746 740 489 363 226 134 57 32 11856 29.15 19.23 14.31 8.90 5.29 2.25 1.2 963 932 621 467 293 177 75 45 15296 36.68 24.47 10.38 11.53 6.98 2.94 1.7 979 937 625 470 294 177 75 43 15500 36.89 24.59 18.51 11.57 6.98 2.94 1.7 974 940 627 472 295 177 75 43 15480 37.02 24.67 18.59 11.62 6.98 2.94 1.7 976 941 628 472 296 178 75 43 15504 37.06 24.72 18.59 11.66 7.02 2.94 1.7
S 2 58 3 44 34 161840 110 93 Heights ....................,..,.... 379 352 235 176 107 63 30 20 6016 13.86 9.26 6.95 4.22 2.50 1.17 0.7 376 346 232 174 106 62 30 19 5984 13.61 9.14 6-86 4.18 2.45 1.17 0.7 378 347 233 177 104 58 30 19 6008 13.65 9.18 6.99 4.09 2.28 1.17 0.7 373 345 231 173 104 64 30 19 5936 13.57 9.10 6.82 4.09 2.54 1.17 0.7 562 508 346 262 160 1 1 1 46 27 8928 20.02 13.62 10.31 6.31 4.36 1.82 1.0 557 507 345 262 162 102 45 28 8856 19.97 13.58 10.31 6.39 4.02 1.78 t.1 560 509 346 263 163 109 45 27 8896 20.06 13.62 10.36 6.43 4.27 1.78 1.0 556 509 344 262 162 103 45 27 8840 20.06 13.54 10.31 6.39 4.06 1.78 1.0 751 665 456 352 223 140 63 36 11928 26.17 17.94 13.85 8.77 5.50 2.47 1.4 752 668 458 354 224 142 63 35 11952 26.30 18.03 13.93 8.82 5.58 2.47 1.3 751 670 459 354 225 142 63 35 11928 26.38 18.07 13.93 8.86 5.58 2.47 1.3
320
751 671 459 355 226 142 63 35 11928 26.42 18.07 13.97 8.90 972 862 593 464 294 190 81 43 15448 33.92 23.35 18.26 11.57 973 867 599 466 299 190 82 46 15456 34.13 23.59 18.34 11.78 972 871 602 467 301 190 82 46 15448 34.30 23.72 18.38 11.87 972 874 604 468 300 190 81 47 15448 34.42 23.76 18.42 11.82
S 50F 3 43 34 161846 109 92 Heights .......... 377 333 230 170 108 66 29 14 5984 13.11 9.06 6.70 4.26 376 332 228 166 107 64 29 16 5976 13.07 6-97 6.53 4.22 377 332 227 167 107 64 29 16 6000 13.07 8.93 6.57 4.22 379 331 227 168 107 64 29 16 6016 13.02 8.93 6.61 4.22 560 483 337 256 162 98 41 23 8896 19.01 13.25 10.06 6.39 555 485 337 256 162 99 41 25 8816 19.10 13.25 10.06 6-39 558 485 338 256 162 98 41 25 8864 19.10 13.29 10.06 6.39 557 486 337 255 162 98 41 25 8856 19.14 13.25 10.02 6.39 754 638 446 342 221 136 57 31 11984 25.13 17-57 13.47 8.69 753 641 448 343 222 136 57 31 11960 25.25 17-65 13.52 8-73 755 642 449 345 222 136 58 32 11992 25.29 17.70 13.60 8-73 751 642 449 346 223 136 57 30 11936 25.29 i7.70 13.64 8.77 998 814 574 447 288 179 76 41 15864 32-01 22.60 17.59 11.32 994 816 577 445 208 179 76 42 15800 32-12 22.72 17.51 11.32 996 820 579 446 289 179 77 42 15824 32.29 22.81 17.55 11.36 998 822 582 450 291 181 77 42 15864 32.37 22.93 17.72 11.45
S 7 SF 3 43 34 161852 108 92 Heights ........... 373 342 230 175 110 68 29 14 5928 13.48 9.06 6.90 4.35 37: 342 228 173 109 67 27 16 5928 13.48 8.97 6.82 4.30 370 340 220 173 109 67 29 16 5880 13.40 8.97 6.82 4.30 375 341 228 174 109 68 29 16 5960 13.44 8.97 6.86 4.30 557 497.338 257 162 100 41 23 8848 19.56 13.29 10.11 6.39 555 499 339 258 163 100 41 23 8824 19.64 13.33 10.15 6.43 557 500 339 258 163 100 41 25 8856 19.68 13.33 10.15 6.43 556 500 339 258 163 101 41 23 8832 19.68 13.33 10.15 6.43 752 657 448 344 221 136 56 32 11944 25.88 17.65 13.56 8.69 749 659 449 345 222 136 56 32 11896 25.96 17.70 13.60 0.73 749 661 449 346 222 138 56 32 11904 26.01 17.70 13.64 8.73 749 661 448 345 222 136 56 32 11896 26.01 17.65 13.60 8.73 986 841 575 445 287 177 74 42 15672 33.12 22.64 17.51 11.28 993 845 579 448 289 178 74 43 15784 33.25 22.81 17.63 11.36 993 848 580 449 289 177 74 43 15776 33.38 22.85 17.67 11.36 966 849 582 450 290 179 74 43 15344 33.42 22.93 17.72 11.41
S 100f 3 43 34 161855 108 92 Heights ... .. . . . . .. 373 318 223 162 103 61 26 17 5936 12.52 8.76 6.36 4.05 373 318 223 162 103 62 26 18 5920 12.52 8.76 6.36 4.05 373 316 219 160 102 60 26 18 5920 12.44 8.64 6.28 4.01 374 315 221 161 102 62 26 17 5952 12.40 8.68 6.32 4.01 556 461 325 246 153 93 40 29 8840 18.13 12.79 9.69 6.02 554 464 328 250 156 97 40 27 8800 18.26 12.92 9.86 6.14 560 466 328 247 155 95 40 29 8896 18.34 12.92 9.73 6.10 560 469 338 249 156 98 38 21 8934 18.47 13.29 9.8: 6.14 754 611 432 325 211 130 55 37 11976 24.04 16.99 12.81 8.31 753 616 437 330 213 132 55 36 11960 24.25 17.20 12.98 8.40 753 617 436 330 213 132 56 37 11960 24.29 17.16 12.98 8.40 753 618 435 330 213 131 56 37 11960 24.33 17.11 12.98 8.40 992 791 568 434 278 174 74 48 15768 31.16 22.35 17.09 10.95 989 799 570 436 281 175 76 47 15720 31.45 22.43 17.18 11.07 992 803 571 435 282 173 76 49 15768 31.62 22.47 17.13 11.11 986 806 575 438 283 176 76 49 15664 31.74 22.64 17.26 11.16
S 125F3 42 34 161858 108 92 Heights ........... 370 328 222 168 105 62 29 16 5880 12.90 8.72 6.61 4.14 374 324 219 167 104 62 27 14 5952 12.77 8.64 6.57 4.09 371 323 219 166 104 62 27 14 5904 12.73 8.64 6.53 4.09 376 324 221 166 104 62 27 14 5968 12.77 8.68 6.53 4.09 555 470 322 245 154 93 41 23 8816 18.51 12.67 9.65 6.06 559 475 324 245 155 93 40 23 8872 18.72 12.75 9.65 6.10 561 479 327 248 157 96 41 25 8920 18.84 12.88 9.77 6.18 559 475 324 245 155 93 Cl 23 8872 18.72 12.75 9.65 6.10
5.37 2.29 5.37 2.25 7.02 2.99 7.06 2.99 7.06 3.03 7.11 3.03
o....... o...
2.66 1.13 2.62 1.08 2.62 1.13 2.66 1.13 3.93 1.60 3.93 1.60 3.93 1.60

749 625 432 329 211 130 56 32 11896 24.62 16.99 12-93 8-31 5-12 2-27 1.2 749 626 433 330 210 131 56 32 11904 24.67 17.03 12.98 8.27 5.16 2.21 1.2 734 631 434 333 211 134 57 32 11976 24.83 17-07 13-10 8-31 5-29 2-25 1.2 982 804 560 430 275 172 75 42 15600 31.66 22.06 16.93 10.82 6.77 2.94 1.6 981 812 564 433 278 169 76 43 15592 31.95 22.22 17-05 10.95 6-64 2-99 1.7 988 817 567 435 278 175 75 43 15696 32.16 22.31 17.13 10.95 6.99 2.94 1.7 987 820 568 433 278 172 75 42 15688 32.29 22.35 17.05 10.95 6.77 2.94 1.6 S 150F3 43 34 161901 109 93 Heiqhts ........................... 369 365 250 182 114 66 27 14 5864 14.36 9.84 7.15 4.47 2.58 1.08 0.5 373 363 248 182 112 64 27 14 5920 14.28 9.76 7.15 4.43 2.54 1.08 0.5 370 362 243 181 112 64 27 14 5872 14.24 9.55 7.11 4.43 2.54 1.08 0.5 372 361 243 181 1 1 1 64 27 14 5912 14.20 9.55 7.11 4.3 2.54 1-08 0.5 564 529 364 267 170 99 41 22 8960 20.81 14.33 10.52 6.69 3.89 1.60 0.8 562 532 365 270 171 98 41 22 8928 20.94 14.37 10.65 6.73 3.85 1.60 0.8 565 534 366 273 171 98 41 23 8984 21.02 14.41 10.73 6.73 3.85 1.60 0.9 555 528 363 268 169 99 41 22 8816 20.77 14.29 10.56 6-64 3-99 1-60 0.8 751 689 477 357 228 135 55 31 11936 27.14 18.78 14.06 8.98 5.33 2.16 1.2 747 690 479 358 229 136 55 32 11872 27.18 18.86 14.10 9.02 5.37 2.16 1.2 746 691 479 358 229 136 56 32 11856 27.22 18.86 14.10 9.02 5.37 2.21 1.2 748 695 480 359 230 136 56 32 11888 27.35 18.90 14.14 9.07 5.37 2.21 1.2 987 882 618 465 298 178 71 42 15680 34.72 24.34 18.30 11.74 7.02 2.81 1.6 987 890 626 469 301 181 73 42 15688 35.05 24.63 18.47 11.87 7.11 2.86 1.6 990 893 627 469 302 179 73 42 15728 35.18 24.67 18.47 11.91 7.06 2.86 1.6 991 898 630 471 305 183 73 42 15736 35.34 24.80 18.55 11.99 7.19 2.86 1.6
S 175F3 42 33 161909 107 91 Heights ........................... 374 419 273 200 119 68 27 17 5944 16.50 10.76 7.86 4.68 2.66 1.08 0.6 373 414 271 199 118 68 26 17 5920 16.29 10.68 7.82 4.64 2.66 1.04 0.6 374 410 269 196 117 67 26 17 5936 16.12 10.59 7.74 4.60 2.62 1.04 0.6 374 413 270 198 118 67 26 17 5944 16.25 10.63 7.78 4.64 2.62 1.04 0.6 554 600 400 298 180 104 41 25 8808 23.62 15.74 11.73 7.10 4.10 1.60 0.9 557 605 403 301 183 105 42 26 8856 23.83 15.87 11.85 7.19 4.15 1.65 1.0 556 606 404 301 183 105 42 26 8824 23.87 15.91 11.85 7.19 4.15 1.65 1.0 559 608 406 302 184 106 42 25 8880 23.95 15.99 11.89 7.23 4.19 6 0.9 754 795 538 406 252 148 58 35 11984 31.28 21.19 15.97 9.90 5.84 2.29 1.3 757 801 542 410 254 149 58 35 12032 31.53 21.35 16-14 9-99 5.88 2-29 1.3 753 802 542 410 255 149 57 35 11976 31.57 21.35 16.14 10.03 5.88 2.25 1.3 757 803 543 411 255 149 58 35 12024 31.62 21.39 16.18 10.03 5.88 2.29 1.3 990 996 684 522 328 194 76 47 15728 39.20 26.92 20.54 12.91 7.66 2.99 1.8 9881001 688 525 330 196 76 47 15704 39.41 27.08 20.67 12.99 7.70 2.99 1.8 9871007 691 528 331 197 76 47 15688 39.66 27.21 20.79 13.04 7.74 2.99 1.8 9891010 692 529 332 198 76 47 15704 39.78 27.25 20.84 13.08 7.78 2.99 1.8
S 200F3 44 34 161912 1 1 1 92 Heights ........................... 387 415 281 206 126 72 29 17 6144 16.33 11.05 8.11 4.97 2.83 1.13 0.6 372 401 270 199 122 70 29 17 5904 15.79 10.63 7.82 4.80 2.75 1.13 0.6 372 401 270 199 122 70 29 17 5904 15.79 10.63 7.82 4.80 2.75 1.13 0.6 373 400 271 199 122 70 29 16 5920 15.75 10.68 7.82 4.80 2.75 1.13 0.6 552 579 384 286 177 104 40 22 8776 22.78 15.12 11.27 6.98 4.10 1.56 0.8 550 584 389 288 179 105 40 22 8800 22.99 15.33 11.35 7.06 4.15 1.56 0.8 562 590 390 292 181 106 41 23 8928 23.24 15.37 11.48 7.14 4.19 1.60 0.9 562 591 393 293 181 106 41 23 8936 23.28 15.45 11.52 7.14 4.19 1.60 0.9 750 761 515 385 242 143 55 31 11912 29.94 20.27 15.14 9.53 5.63 2.16 1.2 740 762 515 386 243 144 55 32 11856 29.98 20.27 15.18 9.57 5.67 2.16 1.2 751 770 519 389 245 145 55 32 11920 30.32 20.44 15.30 9.65 5.71 2.16 1.2 751 772 518 389 245 145 55 32 11936 30.40 20.40 15.30 9.65 5.71 2.16 1.2 970 975 657 495 312 185 68 40 15408 38.40 25.88 19.50 12.28 7.28 2.68 1.5 978 983 665 499 314 185 68 43 15536 38.69 26.17 19.63 12.37 7.28 2.68 1.7 959 991 669 502 317 186 68 43 15240 39.03 26.34 19.75 12.49 7.32 2.68 l . ? 957 996 671 504 318 187 68 43 15216 39.20 26.42 19.04 12.53 7.36 2.68 1.7 S 200F3 44 34 161915 110 93 Heights ........................... 384 371 255 188 112 66 26 14 6104 14.61 10.05 7.40 4.43 2.58 1.04 0.5 387 372 254 187 112 66 27 14 6152 14.66 10.01 7.36 4.43 2.58 1.08 0.5 387 372 254 188 112 64 27 14 6152 14.66 10.01 7.40 4.43 2.54 1.08 0.5 384 370 252 186 Il2 64 26 14 6112 14.57 9.93 7.32 4.43 2.54 1.04 0.5 566 523 369 276 169 99 41 22 9000 20.60 14.54 10.85 6.64 3.89 1.60 0.8 566 529 372 279 170 100 41 23 9000 20.81 14.66 10.98 6.69 3.93 1.60 0.9

! 20.94 14.66 11.06 6.73 3.89 1.60 0.9 I 27.01 19.15 14.51 9.02 5-33 2.16 1.2 I 27.39 19.44 14.76 9.15 5.37 2.21 1.3 i 27.47 19.44 14.81 9.15 5.37 2.16 1.2 , 27.55 19.44 14.81 9.15 5.37 2.21 1.2 1 34.92 24.84 19.05 11-91 7-06 2.81 1.6 I 35.26 25.05 19.21 12.03 7.19 2.81 1.7 : 35.51 25.21 19.38 12.O8 7-20 2.81 1.7 i 35.68 25.30 13.46 12.12 7.28 2.81 1.7 1 92 Heights ............. =.............
i 14.07 9.64 6.95 3.89 2.16 0.82 0.4 14.32 9.84 7.11 4.01 2-20 0.82 0.5
, 14.32 9.89 7.11 4.01 2.20 0.82 0.5 i 14.36 9.84 7.11 4.01 2.20 0.82 0.5 ; 20.14 14.25 10.40 6.02 3.38 1.~6 0.7 1 20.44 14.54 10.65 6.14 3-41 2 6 0.8 20.52 14.58 10.69 6.14 3-47 1.30 0.8 20.60 14.62 10.69 6.18 3-51 1-30 0.8
i 26.34 19.11 14.18 8.36 4.78 1.78 1.1 26.51 19.27 14.31 8.44 4.86 1.82 1.1 26.5519.3214.35 0.48 4.86 1.82 1.1 26.68 19.40 14.39 8.52 4.91 1.82 1.1 32.36 24.34 18.26 10.99 6.43 2.38 1.5 3? 00 24.47 18.38 11.07 6.43 2.38 1.5 33.17 24.59 18.47 11.11 6.43 2.38 1.5 33.17 24.63 18.51 11.1 1 6.43 2.38 1.5
1 1 1 92 Heiqhts ..,-....................... 6264 13.94 9.89 7.40 4.26 2.37 0.95 0.5 6176 13.82 9.84 7.36 4.26 2.37 0.95 0.5 6128 13.53 9.55 7.11 4.14 2.33 0.91 0.5 6120 13.40 9.55 7.15 4.14 2.33 0.91 0.5 8944 19.60 14.08 10.52 6.18 3.51 1.30 0.8
982 826 615 470 284 163 59 39 15608 32.54 24.22 18.51 11-20 6.43 2.34 1.5 988 825 617 472 287 165 59 39 15704 32.50 24.30 18.59 11.28 6.51 2.34 1.5 985 831 618 471 284 163 59 39 15656 32.71 24.34 18.55 11.20 6.43 2.34 1.5
S 300F3 44 34 161932 1 1 1 92 Heights ........................... 376 377 270 192 108 58 23 17 5975 14.82 10.63 7.57 4.26 2.28 0.91 0.6 381 386 274 198 1 1 1 61 24 18 6056 15.20 10.80 7.78 4.39 2.41 0.95 0.7 377 377 268 191 108 59 23 17 5992 14.82 10-55 7.53 4.26 2.33 0.91 0.6 382 384 272 195 110 60 24 18 6064 15.12 10.72 7.69 4.35 2.37 0.95 0.7 555 538 399 290 170 89 36 27 8816 21.19 15.70 11.44 6.69 3.51 1.43 1.0 561 547 406 297 174 91 36 27 8912 21.52 15.99 11.69 6.85 3.60 1.43 1.0 557 545 404 297 174 90 36 27 8848 21.44 15.91 11.69 6.05 3.55 1.43 1:O 562 547 406 299 175 91 36 27 8920 21.52 15.99 11.77 6.09 3.60 1.43 1.0 763 706 541 401 241 132 52 37 12120 27.81 21.31 15.80 9.48 5.20 2.04 1.4 762 707 545 406 243 133 52 38 12112 27.85 21.48 15.97 9.57 5.25 2.04 1.4 764 708 547 406 243 133 52 30 12136 27.89 21.52 15.97 9.57 5.25 2.04 1.4 761 707 547 406 243 133 53 38 12088 27.85 21.52 15.97 9.57 5.25 2.08 1.4 960 881 687 514 315 174 67 50 15256 34.67 27.04 20.25 12.41 6.85 2.64 1.9 963 884 694 523 319 177 68 49 15296 34.80 27.33 20.59 12.58 6.98 2.68 1.9 963 887 700 527 323 178 68 50 15304 34.92 27.54 20.75 12.70 7.02 2.68 1.9 962 890 702 529 325 181 68 50 15296 35.05 27.62 20.84 12.79 7.11 2.68 1.9
S 325F3 43 34 161937 . 109 92 Heights ........................... 383 370 267 202 116 66 26 6 6088 14.57 10.51 7.94 4.55 2.58 1.04 0.6 384 369 267 201 115 64 26 16 6104 14.53 10.51 7.90 4.51 2.54 1.04 0.6 383 366 264 198 114 64 26 16 6088 14.41 10.30 7.78 4.47 2.54 1.04 O.€

568 530 394 297 178 100 41 25 9032 20.85 15.49 11.69 7.02 3.93 1.60 0.9 566 529 394 296 177 100 41 26 9000 20.81 15.49 11.64 6.98 3.93 1.60 1.0
566 %t 395 297 178 101 41 25 8992 20.81 15.54 11.69 7.02 3.98 1.60 0.9 766 522 400 244 142 57 35 12176 27.01 20.56 15.76 9.61 5.58 2.25 1.2 764 684 523 401 245 142 57 35 12136 26.93 20.60 15.80 9.65 5.58 2.25 1.3 766 686 527 404 246 143 57 35 12168 27.01 20.73 15.89 9.69 5.63 2.25 t.3 765 680 524 402 245 142 57 35 12160 26.76 20.65 15.85 9.65 5.58 2-25 1.3 982 849 663 513 319 186 75 47 15600 33.42 26.09 20.21 12.58 7.32 2.94 1.8 981 849 668 518 322 187 75 47 15584 33.42 26.29 20.38 12.66 7.36 2.94 1.8 981 847 672 520 324 190 76 47 15584 33.33 26.46 20.46 12.74 7.49 2.99 1.8 979 849 674 523 324 189 76 47 15560 33.42 26.54 20.59 12.74 7.44 Y 1-8
S 350F3 43 34 161941 109 92 Heights ........................... 382 392 285 198 118 61 21 21 6064 15.45 11.22 7.78 4.64 2.41 0.82 0.8 305 395 285 208 123 71 26 18 6120 15-54 11.22 8.19 4.65 2.79 1.04 0.7 377 385 279 198 118 62 22 21 5984 15.16 10.97 7.78 4.64 2.45 0.87 0.8 382 387 279 200 118 63 23 19 6064 15.24 10.97 7.?S 4.64 2.50 C.91 0.7 560 540 404 294 177 100 35 23 8896 21.27 15.91 11.56 6.98 3.93 1.39 0.9 562 545 408 298 178 101 35 23 8928 21.44 16.08 11.73 7.02 3.98 1.39 0.9 567 549 413 306 179 98 33 26 9016 21.61 16.24 11.81 7.06 3.85 1-30 1.0 565 551 413 301 181 105 37 20 8976 21.69 16.24 11.85 7.14 4 1 . 4 0.7 754 705 529 393 241 136 51 33 11976 27.76 20.81 15.47 9.48 5.37 1.99 1.3 755 708 533 398 243 136 52 33 11992 27.89 20.98 15.08 9.57 5.37 2.04 1.3 757 713 535 399 244 140 52 31 12024 28.06 21.06 15.72 9.61 5.50 2.04 1.2 756 712 535 398 243 136 52 33 12016 28.02 21.06 15.60 9.57 5.37 2.04 1.3 951 896 681 512 317 185 68 42 15104 35.26 26.79 20.17 12.49 7.28 2.68 1.6 967 903 687 515 319 176 67 50 15360 35.55 27.04 20.30 12.58 6.94 2.64 1.9 969 906 692 Si0 321 179 67 50 15392 35-68 27.25 20.38 12.62 7.06 2.64 1.9 970 908 692 SI8 322 186 68 46 15408 35.76 27.25 20.38 12.66 7.32 2.68 1.8
S 37533 42 33 161949 108 91 Heights ........................... 373 374 264 191 108 59 24 16 5920 14.74 10.38 7.53 4.26 2.33 0.95 0.6 375 373 263 189 107 59 23 16 5960 14.70 10.34 7.44 4.22 2.33 0.91 0.6 378 375 264 191 108 60 24 16 6000 14.78 10.38 7.53 4.26 2.37 0.95 0.6 372 372 261 188 107 59 23 16 5912 14.66 10.26 7.40 4.22 2.33 0.91 0.6 556 535 390 297 168 93 36 25 8846 21.06 15.37 11.31 6.60 3.68 1.43 0.9 555 337 391 287 169 93 36 25 8824 21.15 15.41 11.31 6.64 3.68 1.43 0.9 556 537 393 288 170 95 36 25 8840 21.15 15.45 11-35 6.69 3.72 1.43 0.9 556 537 391 288 169 93 36 23 8840 21.15 15.41 11.35 6.64 3.69 1.43 0.9 758 700 519 388 232 132 52 33 12048 27.55 20.44 15.26 9.15 5.20 2.04 1.3 758 702 523 389 233 132 52 33 12040 27.64 20.60 15.30 9.19 5.20 2.04 1 . 3 757 702 522 389 235 133 52 33 12024 27.64 20.56 15.30 9.23 5.25 2.04 1.3 758 703 123 390 235 133 52 33 12040 27.68 20.60 15.35 9.23 5.25 2.04 1.3 939 875 656 494 302 174 68 45 14928 34.46 25.84 19.46 11.91 6.85 2.68 1.7 965 876 658 496 305 175 68 45 15336 34.51 25.92 19.55 11.99 6.89 2.68 1.7 964 876 659 498 305 175 68 45 15312 34.51 25.96 19.59 11.99 6.89 2.68 1.7 964 878 661 498 305 175 68 45 15320 34.55 26.00 19.59 11.99 6.89 2.68 1.7
S 400F3 43 33 161952 108 91 Heights ........................... 374 328 234 172 102 58 26 18 5952 12.90 9.22 6.78 4.01 2.28 1.04 0.7 374 325 232 170 101 56 26 18 5944 12.81 9.14 6.70 3.97 2.20 1.04 0.7 374 325 232 170 101 55 26 18 5936 12.81 9.14 6.70 3.97 2.16 1.04 0.7 375 328 232 170 101 56 26 18 5960 12.90 9.14 6.70 3.97 2.20 1.04 0.7 557 464 344 256 153 90 41 27 8856 18.26 13.54 10.06 6.02 3.55 1.60 1.0 556 463 345 257 153 91 41 27 8832 18.22 13.58 10.11 6.02 3.60 1.60 1.0 559 466 347 259 154 90 41 26 8888 18.34 13.67 10.19 6.06 3.55 1.60 1.0 555 345 257 153 88 41 27 8824 18.22 13.58 10.11 6.02 3.47 1.60 1.0 761 597 454 343 208 124 55 36 12088 23.49 17.86 13.52 8.19 4.86 2.16 1.4 763 598 458 346 210 125 55 36 12128 23.53 18.03 13.64 8.27 4.91 2.16 1.4 762 538 460 348 211 125 55 37 12104 23.53 18.11 13.68 8.31 4.91 2.15 1.4 761 598 459 348 211 125 55 36 12088 23.53 i8.07 13.68 8.31 4.91 2.16 1-4 984 750 587 418 277 165 73 47 15632 29.52 23.10 17.63 10.91 6.51 2.86 1.8 982 751 590 451 278 167 71 47 15608 29.56 23.22 17.76 10.95 6.56 2.81 l.e 981 751 592 452 279 167 73 47 15584 29.56 23.30 17.80 10.99 6.56 2.86 1.8 982 755 594 453 280 165 73 47 15608 29.73 23.39 17.84 11.03 6.51 2-86 1.8
S 425F3 41 33 161958 106 91 Heighrs ........................... 375 313 225 165 98 56 25 17 5960 12.31 e.85 6.49 3.84 2.20 1.00 0.6 375 313 224 165 97 56 26 17 5960 12.31 e.81 6.49 3.80 2.20 1.04 0.6 7 7 c 2 1 9 73-4 i c c a l cç - T G =a=? 7 7 7 - O i c c A Q t o n 7 i n n: t

5944 12.31 8.76 6 .49 3.80 8824 17.59 13.08 9 .77 5.93 8816 17.63 13.13 ? . S I 5.97 8832 17.63 13.17 9 .86 5.97 8816 17.63 13.13 4.81 5.97
12080 22.95 17.49 13.23 8.15 12096 22.91 17.61 13.35 8.19 12096 22.91 17.61 13.35 8.23 12120 22.97 '7 .61 73.35 8.27 15096 28.69 22.35 17.05 10.78 15504 28.60 22.43 17.09 10.82 15536 28.64 22.51 17.13 10.91 15592 28.69 22.56 17.1C 10.86
108 91 Hcights ........... 5960 13.07 10.05 7.32 4.14 5944 13.02 9 .93 7 .19 4.09 5888 13.07 9 .93 7 .19 4.09 5896 13.07 9.89 7 .19 4.09 8792 18.30 14.62 10.85 6.35 8832 18.30 14.75 10.98 6.43 8840 18.30 14.75 10.94 6.39 8792 18.26 14.75 10.94 6.39
12080 23.28 19.48 14.72 8.82 12064 23.24 19.73 14.93 9.02 12072 23.03 19.65 14.85 8 .90 12072 23.07 19 .69 14.85 8 .90 15360 28.69 24.97 19.05 11.66 15352 28.85 25 .17 19.26 11.78 14968 28.94 25.26 19.34 11.82 15344 29.19 25.38 19 .42 11.87
106 90 Heights ........... 5904 13.65 10.14 7.24 4.09 5880 13.69 10.18 7 .19 4.09 5888 13.74 10 .18 7 .19 4.09 5848 13.65 10 .09 7 .11 4.05 8792 18.93 1-4.58 10.77 6.31 8800 18.97 14 .79 10.90 6 .39 8792 18.93 14 .79 10 .e5 6.35 8792 18.97 14 .79 10.90 6.39
12128 24.12 19 .65 14.60 8.77 12120 24.00 19 .77 14.72 8.86 12152 24.04 19 .77 14 .72 8.86 12120 24.08 19.81 14 .72 8.82 15720 29.65 24 .80 18 .71 11.45 15504 29.65 24 .88 18 .76 11.49 15432 29.73 24.92 18 .80 11.49 15520 29.86 24 .97 18.80 11.49