Arthur Hans Butler - MSpace
120
A COST ANALYSIS OF TRÄNSFERRING GRAIN FARMER OI^]I{ED Al\D OPERATED TRUCKS The Faculty of Graduate Studies and UniversitY of Manitoba A .L'NCS]-S Presented Lo BY fn Partial Fulfillment the Requirements for the Degree Master of Science of Research Arthur Hans Butler Oct.oJ¡er L97 0 by Oi:i,,1'\l'JlltJ¡iA ffi
-
Upload
khangminh22 -
Category
Documents
-
view
4 -
download
0
Transcript of Arthur Hans Butler - MSpace
A COST ANALYSIS OF TRÄNSFERRING GRAIN
FARMER OI^]I{ED Al\D OPERATED TRUCKS
The Faculty of Graduate Studies and
UniversitY of Manitoba
A .L'NCS]-S
Presented Lo
BY
fn Partial Fulfillment
the Requirements for the Degree
Master of Science
of
Research
Arthur Hans Butler
Oct.oJ¡er L97 0
by
Oi:i,,1'\l'JlltJ¡iAffi
This author owes much to those who have assisted him
through their words of advice and helpful acLions " He wel-
comes this opportunity to mention those who have been espec-
ially helpful:
Dr" E.W" Tyrchniewicz, his major advisor, has been
generous in provid.ing guidance, inspiration, and suggestions
for improvements in the studY"
Dr.H"BjarnasonrDr.W"J"Craddock,ProfessorOmP'
Tangri, and Dr. A.w. wood, his advisory commiLtee, for their
constructive criticisms of the thesis '
Messrs. R. Martinelli, R. Shepp, and A' Weaver' for
the assistance given by the railway companies "
MeSSrs. D. Campbell, A. Cantino R" Moffat, R" olson,
and H. sandy, members of the grain industry, for their
assistance and contribution to Lhe research"
Mr. G. Moore, a fellow graduate student, v'/hose co_
operation, comments, and discussion \,^/ere invaluable in
completing this studY"
Messrs. R" Gilles and A. sLOesz for their aíd ín the
survey and Mr. B. Ward, âo undergraduate assistant' for his
contribution in comPiling data"
The farmers who gave of their time to give the data
required to do the studY"
The girls , of the center for Transportation studies,
for their co-operation"
ACKNOWLEDGMENTS
Ll_
iii
Mrs.AnneDaviesandMissMaryUnraufortypingthe
manuscript.
His wife, Elsie, and his children, walter and Kerrie,
for their constant encouragement and their patient endurance
of " life without Father" during the compiling of the data and
the writing of the thesis.
Butler, Arthur Hans" M.Sc., University of Manitoba,
October L970" å Cost Analysis of Transferring Grain By
Farmer Owned and Operated T{ucFs "
proposed rail rationalizationl and Lhe rational-ization
that the present elevator system will likely undergo in the
future warrant careful study" Rationalization will- require
some producers to haul their produce further to the sales out-
lets" The additional costsu to the farmer, in grain hauling
must be considered in any rationalization program. The pur-
pose of this study is to analyze trucking costs and to deter-
mine the average transfer costs in transferring grain to the
sales orit'l et in farmer owned and operated trucks"
The data were obtained from a random sample of 200
Western Canadian farmers. The information coll-ected for the
study was for the 1967-68 crop year"
The procedure fol-lowed included an evaluation of the
fixed costs, variable costs, dead-haul cost, and average total
transf er costs " The averagie cost was compared \',/ith the
generally accepted transfer cost, of 0.5 cents per bushel-
mile, usingi a statistical test of differences between means.
ABSTRACT
l_v
1_*RatÍonali z ation
into accord with up tonnarr{-i nn
is the act of bringing an industrYdate methods of orsanization and
V
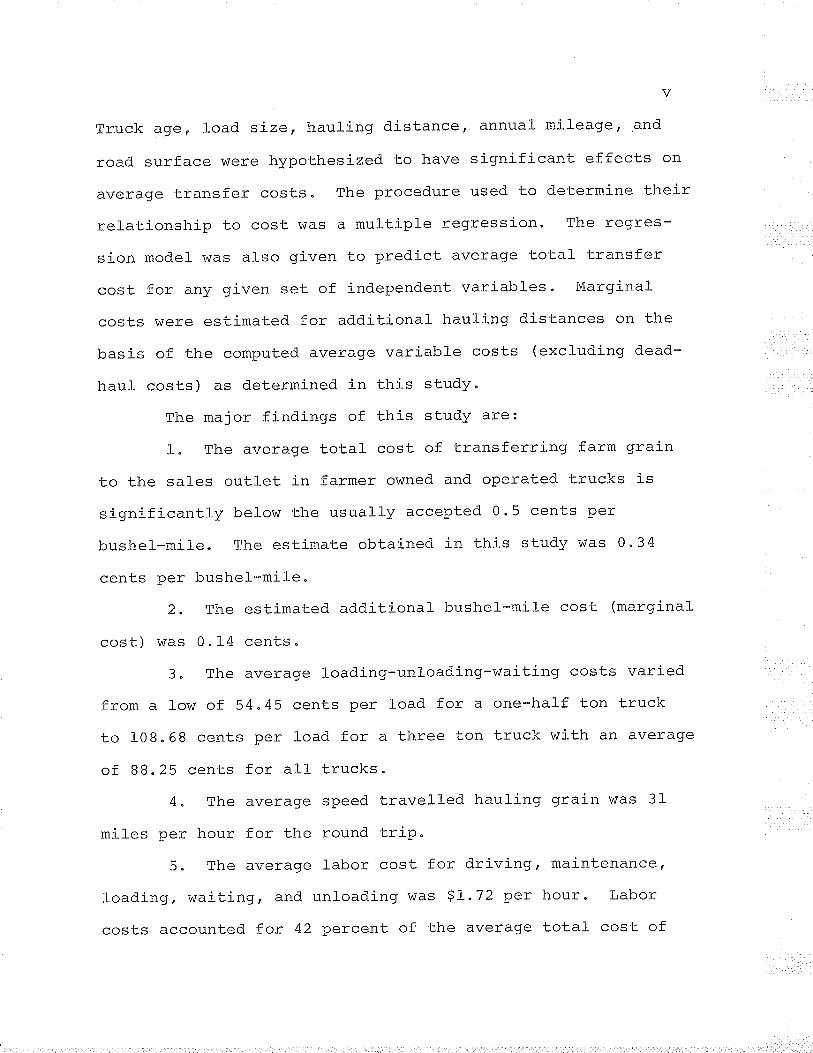
Truck ageo load size, hauling distance, annual mileage, and-
road surface were hypothesízed to have significant effects on
average transfer costs " The procedure used to determine their
relationship to cost was a multiple regression. The regres-
sion model was also given to predict average total transfer
cost for any given set of independent variables. Marginal
costs were estimated for additional hauling distances on the
basis of the computed average variable costs (excluding dead-
haul- costs) as determined in this study"
The major findings of this study are:
1" The average total cost of transferring farm grain
to the sales outlet in farmer owned and operated trucks is
significantly below the usually accepted 0 " 5 cents per
bushel-mile. The estimate obtained in this study was 0 "34
cents per bushel-mile.
2" The estimated additional bushel*mile cost (marginal
cost ) v/as 0 . t4 cents .
3 " The averagie loading-unloading-waiti-ng costs varied
from a low of 54"45 cents per l-oad for a one-half ton truck
to 108"68 cents per load for a three ton truck with an average
of 88"25 cents for all trucks"
4" The average speed travelled haul-ing grain was 3l
mil-es per hour for the round triP.
5" The average l-abor cost for drivitg, maintenance,
loading, waiting, and unloading was $1"72 per hour" Labor
costs accounted for 42 percent of the average total- cost of
hauling grain.
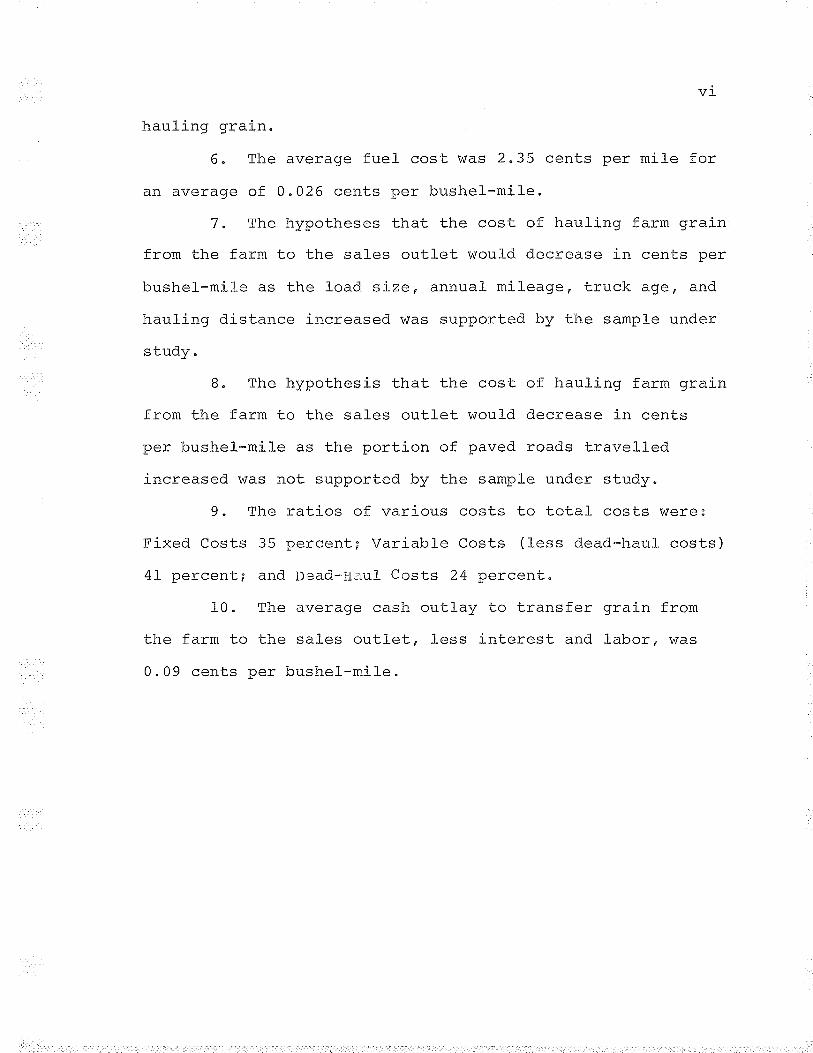
6 " The average fuel- cosL v/as 2 "35 cents per mile f or
an average of 0.026 cents per bushel--mil-e.
7 " The hypotheses that the cost of hauling farm grain
from the farm to the sal-es outlet woul-d decrease in cents per
bushel-mile as the load size, annual mileage, truck agê, and
hauling distance increased was supported by the sample under
study.
B" The hypothesis that the cost of hauling farm grain
from the farm to the sales outl-et woul-d decrease in cents
per bushel-mile as the portion of paved roads Lravelled
increased was not supported by the sample under study.
9" The ratios of various costs to tota] cosLs were:
Fixed Costs 35 percent; Variabl-e Costs (less dead-haul costs)
41 percent; and Dead-Haill Costs 24 percent"
10. The average cash outlay to transfer grain from
the farm to the sales outlet, less interest and labor, v/as
0.09 cents per bushel-mile.
vl-
LTST
LTST
OF
OF
TABLES
FIGURES
CHAPTER
I"
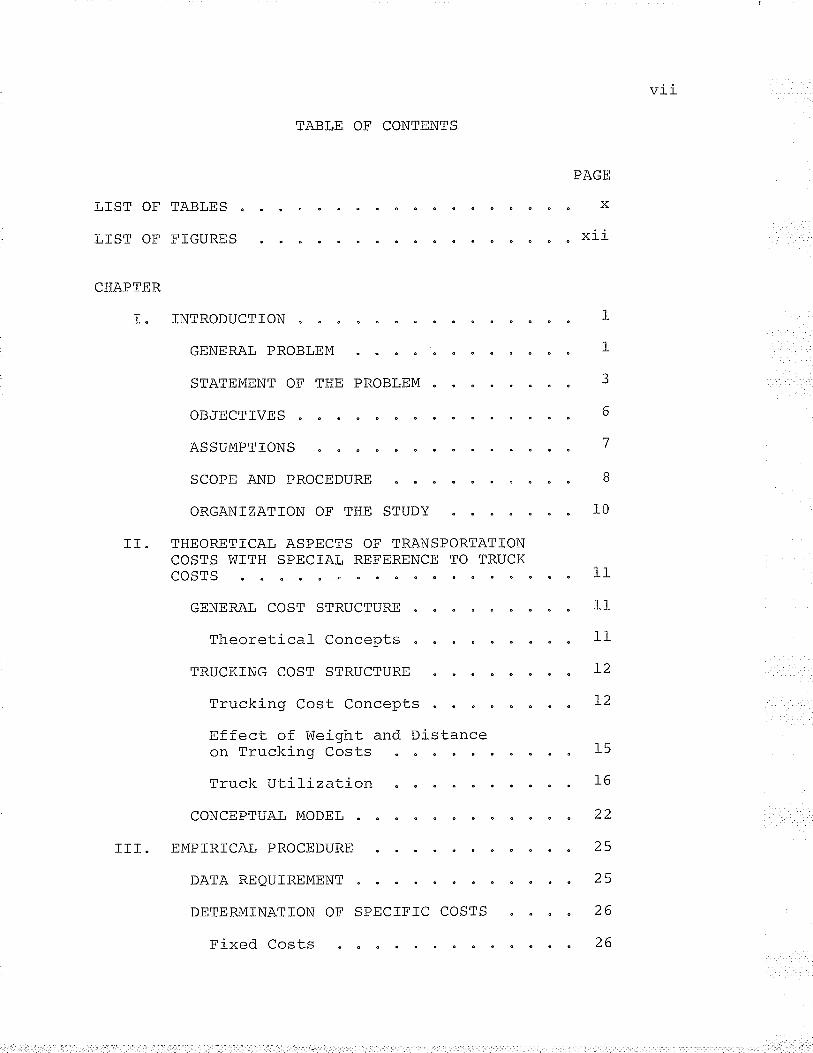
TABLE OF CONTENTS
TNTRODUCTTON
GENERAL PROBLEM
PAGE
"X
xii
STATEMENT OF THE PROBLEM
OBJECTTVES
ORGANTZATfON OF THE STUDY
IT" THEORETTCAL ASPECTS OF TRANSPORTAT]ONCOSTS WTTH SPECTAL REFERENCE TO TRUCKCOSTS
GENERAL COST STRUCTURE
Theoretical- Concepts
TRUCKING COST STRUCTURE
ASSUMPTIONS
SCOPE AND PROCEDURE
vl_1
rTlrrr¡Þi na lìnct lìnn¡anj-<vvÈ u vv¡¡vuy eu
Effect of i{eight and Distanceon Trucking Costs "
Truck Utilization
CONCEPTUA], MODEL
EMPIRTCAL PROCEDURE
DATA REQUIREMENT
I1
J
6
1
B
10
III "
DETERIVIINATION OF SPECIFIC COSTS
Fixed Costs
t1
l1
11
I2
I2
15
I6
¿z
25
25
26
26
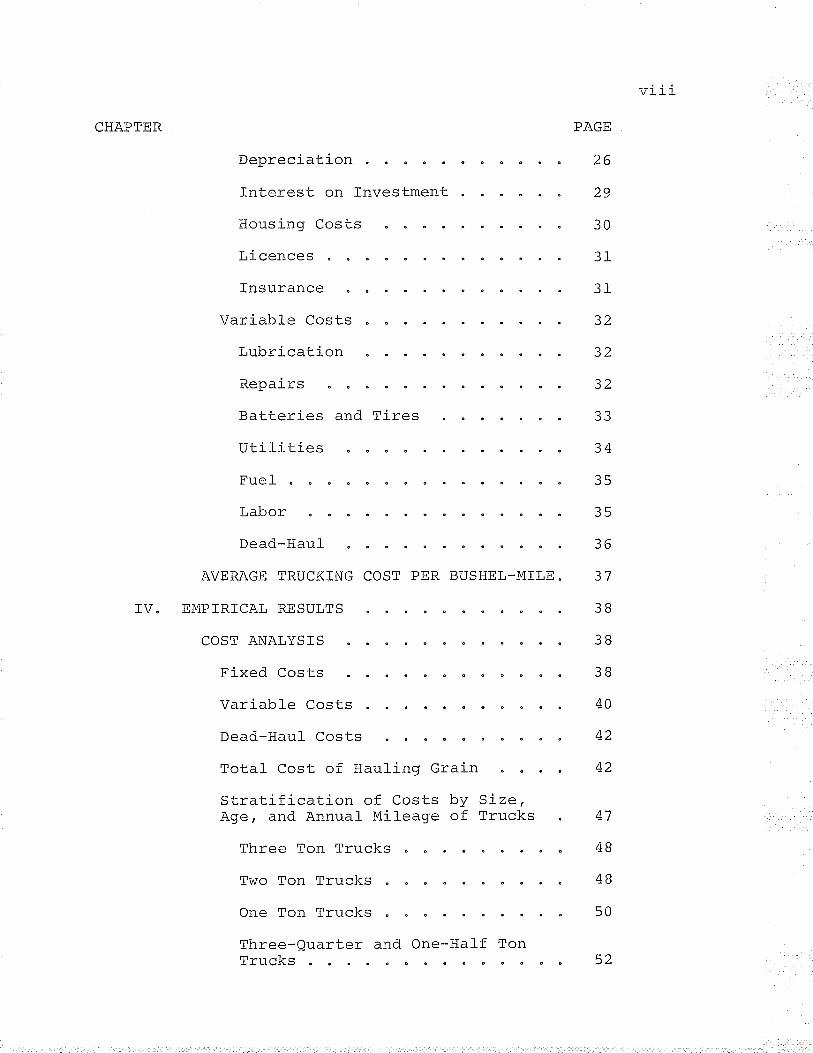
CHAPTER
Depreciation
Interest on Investment
Housing Costs
Lr-cences
Insurance
Variable Costs
Lubrication
Repairs
Batteries
U LI]I UIUJ
PAGE
26
¿Y
30
3t
31
JZ
JZ
32
33
34
35
35
36
37
3B
3B
3B
40
42
42
at
4B
4B
50
52
AVERAGE TRUCKING
IV" EMPIRICAL RESULTS
and Tires
l'uel-
Labor
\7ì f f
Dead*Haul
COST ANALYS]S
Fixed Costs
COST PER BUSHEL_MÏLE"
Dead-Haul- Costs
Total Cost of Hauling Grain
Stratification of Costs by Size,Age, and Annual Mileage of Trucks
Three Ton Trucks
Two Ton Trucks
One Ton Trucks
¡Tlrraa-flrr:rf4¡ and One-Half TOnYss! ermø" al- aA I UUAÐ
CHAPTER
All Trucks
REGRESSION ANALYSIS
V" ECONOMIC IMPLTCATIONS AND CONCLUSIONS
SUMMARY AND GENERAL IMPLICAT]ONS
ÏMPLTCAT]ONS FOR FARMERS
IMPLTCATIONS FOR BRANCH LÏNEABANDONMENT
fMPLTCATÏONS FOR ELEVATOR COMPANTES
SUGGESTTONS FOR FURTHER RESEARCH
BIBLTOGRAPHY
APPENDÏCES
COMPARTSON OF RESULTS I^IÏTH OTHERSTUDÏES
A. LITERATURE REVIEVÍ
PAGE
52
56
64
67
67
7I
l¿
73
IJ
75
B" SAMPLE CHARACTERIST]CS
C. ACTUAL AND PRED]CTED COSTFOR ALL TRUCI(S
D. COPY OF QUEST]ONNATRE
l-x
tó
t{ Lr
92
93
TABLE
IV-l" AVERAGE FIXED COST IN CENTS PERMILE OF TRUCK OPERATION 39
1V_2" AVERAGE VARIABLE COST IN CENTS PERMTLE OF TRUCK OPERATTON 4L
IV_3. THE DEAD-HAUL COST PER LOAD FORVARIOUS SIZES OF TRUCKS 43
IV-4. AVERAGE TOTAL COSTS IN CENTS PERBUSHEL-MILE 45
TV_5. HOUSING COSTS TN CENTS PER BUSHEL_MILE 45
fV-6 " COMPONENTS OF ASSEMBLY COST AS APERCENT OF THE AVERAGE COST OF 0"34CENTS PER BUSHEL-MILE FOR ALL L42TRUCKS OF THE T967^68 SAMPLE 46
IV-7" AVERAGE TRUCKING COSTS FOR 3 TON TRUCKSBASED ON ANNUAL MILEAGE AN AGE 49
TV.B. AVERAGE TRUCKING COSTS FOR 2 TON TRUCKSBASED ON ANNUAL MILEAGE AND AGE 51
IV-9 " AVERAGE TRUCK]NG COSTS FOR 1 TON TRUCKSBASED ON ANNUAL MILEAGE AND AGE 53
rv-10" AVERAGE TRUCKTNG COSTS FOR 3/4 TON
TRUCKS BASED ON ANNUAL MTLEAGE AND AGE" 54
TV-11" AVERAGE TRUCKING COSTS FOR T/2 TON
TRUCKS BASED ON ANNUAL MILEAGE AND AGE" 55
IV_T2" AVERAGE TRUCKING COSTS FOR ALL TRUCKSBASED ON ANNUAL MILEAGE AND AGE 57
IV-13" REGRESSION ESTTMATES OF TRUCKfNG
LIST OF TABLES
PAGE
IV_14" TEST OF DTFFERENCES BETWEEN AVERAGETRANSFER COSTS PER BUSHEL-MILE FORDIFFERENT SIZES OF TRUCKS ANDONE-HALF CENT . or
COST RELATIONSHTPS 6L
TABLES PAGE
IV-15" COMPARISON OF ACTUAL AND PREDTCTEDTRANSFER COSTS FOR DfFFERENT SIZESOF TRUCKS TN THE STUDY 63
A*]-. ESTIMATED COST PER MTLE OF TRAVEL BY
FARM TRUCKS IN HAULING GRAÏNACCORDING TO ROAD SURFACE 81
A.2. YOUNG'S ESTIMATION OF THE AVERAGE, FIXEDAND VARIABLE COSTS PER MILE OF FARMTRUCK OPERATTON IN HAULING GRAIN 81
A-3" YOUNGIS EST]MATION OF AVERAGE ASSEMBLYCOST PER BUSHEL-MILE 82
B_I"AVERAGEGASoLINECoNSUMPTIoNANDGASoLfNECOSTS FOR DTFFERENT SIZES OF TRUCKS 90
8.2. AVERAGE SPEED AND PORTION OF ANNUAL MILEAGESDEVOTED TO HAULING GRATN TO THE SALES
OUTLET 91
C-I. ACTUAL AND PREDICTED COST FOR ALL TRUCKS 92
xl-
FIGURE
II_1 "
IL.¿"
l-l--5 "
Theoretical Short Run Cost Curves
Assumed Truck Short Run Cost Curves
Cost Behavior in Transport WithVarying Combinations of hleightand Distance
l-l--4.
II-5.
t_l_-o "
IIST OF FIGURES
Distance - Weight Cost Curves
Cost Behavior With Respect To Weight
II-7. Theoretical Cost Relationship asVol-ume Increases For DifferentSizes of Trucks .
(Weight Constant)
Cost Behavior With Respect To DisLance(Distance Constant)
B-1. Map of Survey Area
PAGE
-tA
1Ã
xl_t-
I7
1B
L9
L9
2T
B7
Histori-cally,r the responsibility of transporting g:rain
from the farm to the shipping point has rested with the pro-
ducer. From the shipping point the railways delivered the
grain to the port or domestic destination at the producer's
expense. The railways agreed to haul grain in accordance wiLh
a fixed rate structure in return for considerations and finan-
cial aid received in the construction of a rail network much
as it is today" The first trans-continental railway was com-
pleted in 1885. Horrzever, it was approximately ten years l-ater
before world prices rose sufficiently for the wheat industry
to become of economic value in the export market" Although
the railways were expected to be operated as an economically
viable entity, much of the railway network of the West, as in
the East, was built for political reasons: "to settle Canada's
undeveloped agricultural land, exploit her minerals and lumber,
and to direct the flow of Canadian trade throughout the length
of the Dominion".2
CHAPTER I
INTRODUCTION
GENERAL PROBLEM
*For a more detailed history of the development of theCanadian Grain Industry refer to: V"C" Fowke, CanadianAgricultural- Policy The HistoricalUniversi-ty of Toronto Press, L946) "
1
'4.W. Currie, Canadian Transportationrhe University of torõãEõ-T?ãss, Tg6Ð; il__6
Pattern, (Toronto:
Economics,
fIIç
l.ìrnrnn {-n "
2
Toward the end of the níneteenth century, the movement
aF ^rrìn frnm €^-* at^va^¡ faCilitieS tO rail waS S]OW and\Jr 9!qrrr r!ulrr rqrrrr -LU!q9E
difficult. In IBBB, the monopoly granted to the CPR in 1BB0
\^ias revoked, making competition possible among railway com-
paníes to open the Canadian Prairies " This resulted in a rail
network of sufficient density that most farmers would have to
travel no more than ten miles to a delivery point" It was
only natural that elevators, hamlets, villages, and towns would
spring up along these tracks as the prairies were settled.
By the 1930's the highway system and the motor carrier
had developed. to the extent that the railways no longer were
able to enjoy a monopolistic position in freight movement. As
competition from the motor carriers grew, and conti-nues to
grow, branch lines were found to carry a lower and decreasing
relati-ve volume of traffic" Facing this relative l-oss of
traffíc, the railways have first attempted to reduce service
and eventually to withdraw it entirely and to abandon the
uneconomic lines. Reasons for the extensive construction of
branch lines on the prairies may have been a misjud.gment of
the uncertain potential which existed or it may have been a
fear of competition" If one company were not to build a
branch line, it may have been feared that another would and
thus would capture some potentially valuable business " As a
result, the railways have applied to the Canadian Transport
Commission to have lines abandoned"
necessarily be a general change in the farm delivery pattern.
It is estimated3 that the current apptications for abandonment,
if granted, would result in the reduction of 613"5 mil-es by
the CPR and 844"3 miles by the CNR for a total of I,5L7 "B miles
in the three prairie provinces. The loss of the suggested
L,5L7.B miles of track would necessitate the decrease of 233
elevators on the prairies 26 in Manitoba, L62 in Saskatchewan,
and. 45 in Alberta. In terms of elevaLor capacity, a total of
13,553,300 bushels would be lost L,789,300 in Manitoba,
8,982,L00 in Saskatchewan, and 2,781-,900 in Alberta" It is
inevitable that the oistance between elevators will increase
with rail rationalization, elevator rationalization, and the
availability of the motor carrier" This increased distance
between elevator points wil-l mean longer hauling distances
for the farmers which in turn may be reflected in higher truck-
ing costs. To make effective use of the most economic and
satisfactory method of delivering his grain to the consumer,
the farmer must uti-lize the best combination of facilities at
his disposal "
If rail rationalization is forthcomitg, there \^/i11
STATEMENT OF THE PROBLEI4
'D-tr suppli-ed. by the North-Vúest Line Elevator Associa-tion, December lB, L969"
4
The argument put forth in defense of rail- raiionalíza-
tion has its basic roots in the economic position of these
branch lines whi-ch are claimed to be unable to carrv their
share of the costs " It is, Lherefore, necessary to determine
comparable costs for the feasible alternatives for grain trans-Aportation in these areas. Research= has indicated that trucks
are competitj-ve with railways for short distances" However,
"the statutory rail rates for grain and the nature of graín
has prevented serious competition other than for very shortq,
distances"." At the present time there is no real agreement
or adequate knowledge on the cost of grain transportation
either by farm trucks or by commercial trucks. Concern6 is
evident in the variation of cost figures of moving grain with
the expectation that attempts are made by those with vested
interests to use a cost figure which woul-d best support their
Some studies have been done on the cost of transporting
grain from the farm to the sales outlet. A Saskatchewan
A=R.L" Kohlso Marketing of Agricultural Products, (Secondedition, Nev¡ York: rEe-iulacmflfan Cornpany, Ï9AT), pp"-Z:g ff ¡
E.M. Hoover, The Location of Economic Activity, (New York:McGraw-Hill BõõE õompany, rnc" T9ZãI] Þp"--T9:Zr.
--Report of the Eey"l Commission on Transportation,(Queen' s-Þ?ïnEer an¿ controrÏel-õE statîõnffil " r,p" 48"
6_rnrerviews with members of both the railway and elevatorcompanies revealed that there was disagreement over suggestedaverage grain hauling costs " The 0.50 cents per bushel-mile wasnot convincinq when compared to their costs "
'7
study' estimated the average trucking cost t'o be 0"50 centsBper bushel-mi1e" This fi-gure was supported by Young- when
he estimated the average assembly cost to be 0"47 cents per
bushel-mile in Manitoba"
per truck in Young's study was 2 ,924 it would appear that
there was excess capacity which may be utilized by custom
hauling. For this reason, the analysis o11 commercial truck-o
ing currently being done by Moore- may be relevant in deter-
mining wirether or not a farmer should truck his own grain to
the sales outlet or if he should make use of commercial facil-
ities. Moore suggests that the commercial- truckers charge
less than 0 " 50 cents per bushel--mile, the estimated cost for
Since the average annual mileage
farmers t.o haul their graín in their own
Riordanl0 d."ti,r.d variable costs
l.-"' J-n¡ *rtt¡l¿ l-r=rr'l inn 1^^ L-'^L^l^Ðy a one toIL Lr t-ruJr ¡ rraur!rrY rl.J u JJLIÞLLsr¡ t
1'Custom Rates Per Acre in the Province of Saskatchewan
as shown-EV- i/iãiÏ QuesEÏõnñã?e survey-ftrrough w6eãÐ pool--l,ocaf s , (Sästatoon r Department-õE- ¡'arm }{anagement, UñîVers ityof-s-asfatchewan and Dominion Economics Division), p. 2"
R'K.8. Young, Afl Analysis of tlrg Cost of AssemblingGrain by Farm trucks-Tn ttlanitõba, (Winnipeg: Department ofagricuÏEuiãf-ncõñõmlcs añilt' arm l\4anagement, Univers ity ofManitoba, Research Report No. 11, October, 1966), p" 99"
q'G.w. Moore, "Cost Analysis of Assembling Grain by
Commercial Trucks", (M.Sc" Thesis in progress, University ofManitoba, Winnipeg, L970) "
10_--8.8. Riordan, Spatial Competition and D:i-v:Ls:þg ofGrain Receipts Between Country EleveleIq, (Unpublished M.Sc"rãêsTsl- uãlvers@,-wfnnlpeg:, February, L965),p" 46"
trucks.
for hauling grain
according to road
6
surface. The per bushel-mile cost (excluding dead-haul) 1l *r=
0"13 cents on pavement, 0.16 cents on gravel, and 0"24 cents
on earth"
various situations there is a need for a more extensive analvsis
than f he nrerl: ^,-^ \z^,..^- ^-,ldw - An atf'em** ^1^^,.1Ã L^ nade tourrq¡r urrÇ y!svIULlÞ I(JL.Lll9 ÞLLruJ. ã!r quuu¡rrl,u ÞlIUuIu uE t
choose a larger sample from an area representative of all
condj-tions which may be found in the three prairie provinces.
An accurate estimate of grain transportation costs by both
farm trucks and commercial trucks is necessarv.
OBJECTIVES
Idith concern over the different cost fiqures used in
Assuming that the overall objective in grain transporta-
tion is to use the most efficient mode available, it is nec-
essary to analyze the cost of transporting grain by truck to
ascertain to what extent trucking may supplement, or replace
the railviay. The general objective of this study is to analyze
the cost of transporting grain from the farm to the sales out-
l-et*- in farmer owned and operated trucks " The specifíc
objectives of the study are:
ll--"Dead-Haul" is defined. as the labor costs for load.ingthe truck, waiting at the elevator, and unloading the truck-s +1^^ ^1^f,^+^-AL LIIE gIEVALVL.
1at'"Sal-es outlet" is defined as any place where grain is-nrr rnh : c aã ¡^mmêrõ'i a 'l I rz
7
l. To estimate the average cost per bushel-mil"l3 of
delivering grain from the farm storage site to the sal-es out-
let by farmer owned and operated trucks.
2" To determine the averagie cost per bushel-mile to
del-iver grain f or varj-ous sizes of trucks , ages of trucks,
road surfaces travelled on, annual mileages, and hauling
distances "
3 " To derive an equation to predict the average cost
per bushel-mile to d.eliver grain by various sizes of trucks o
â^^ô nf {-rrr¡l¡q rna¡l qrrrf anaq :nn:rr I mi I ^ ^'.¡ L arr'l ì nad9e:5 UI Lt LIUJIL ..vçÐ r q¿¡¡¡uq¿ arrr-LËO-g9Þ t ctllL¿ ILC¡.LrJIlry
distances "
4. To derive i-mplications from truckinq costs for
costs of branch line abandonment as related to farmers "
The main assumptions made in this study to make the
analysis possible include the following:
I" Each trip to the sales outlet was charged entirely
the hauling of grain" It was assumed that the farmer does
other business while in the process of hauling grain"no
ASSUMPTIONS
'l?"bushel-mile" is defj-ned as the transferring of one
bushel one mil-e" For the purpose of this analysis grain wil-lbe measured in terms of wheat equivalent" It is realized thatthe cost wil-1 vary with varying bushel weights for differentqrains
"
2" The fixed and variable costs of the farm trucks
were allocated to the haul-ing of grai-n as determined by the
portion of the total annual miles travelled in the hauling
of grain.
3 " It was assumed that the data obtained from the
farmers in the sample were an accurate account of trucking
costs, and that the sample was representative of the popula-
tion under studv"
This study is an extension of an earlier one' done by
young, which was confined to a small sample of Manitoba farmers
delivering grain to a random sample of different elevators,
in the neighborhood. of WinniPeg, in the 1964-65 crop year"
The extension of this study will- include a sample drawn at
random, following accepted statistícal sampling procedures,
from Manitoba and Saskatchewan" The study will be limited to
the cost of transporting grain by farm trucks in Western
Canada" The results of this study with the information on the
cost of commercial trucking of grain; rail costs; optimum síze,
number and location of elevators; and policies affecting the
grain industry will be used in future analyses of the rationaliza-
tion of the total transportation and handling system of grain"
SCOPE AND PROCEDURE
in the output unit. Transporting one bushefdifferent from transporting 100 bushels onethe bushel-miles are 100 in both cases"
100 miles is*j 1 ^ - 'l rt^ ^,- ^1^rLtIJ_Ë ArLrr(JLr9rl
9
This study differs somewhat from Riordan's in that
the specific interest in this study lies in the unit transfer
cost for a specific commodity" Riordan was concerned with a
cost to move a load a single mil-e \^/ith special efforts to
differentiate the costs based on road surface" Youngrs
objectives v¡ere more in agreement with those of the current
study although some variables which seem significant to the
analysis v¡ere omitted in the former study. In addition to
the variables consid.ered by Young, this analysis will- take
into account the effect of annual mileages, road surface, and
age of truck on trucl<ing costs. In ad.dition, a housi-ng cost
witl be determined"
The procedure in this study will involve the calcula-
tion of the components of total- costs such as fixed costs,
variabl-e costs excfusive of dead-haul, and dead-haul costs in
an attempt to estimate the average costs for all trucks and
for several- stratifications deemed desirable" The stratifica*
tions will include ag€, annual miles travelled, and síze of
truck "
1LThe method.s used in testing the hypotheses* t outlined in
Chapter II of the study include a test of significance between
means in the case of Hypothesis 1, and a multiple regression
analysis in the cases of Hypotheses 2 Lo 6 " The regression
function derived to test the aforementioned hypotheses will-
be used to pred.ict transfer costs per bushel-mil-e given a set
of independent varíables "
1A-=outlined. on Page 23
Chapter II wil-l set out the theoretical, concepLual,
and statj-stical model used in this study" Chapter III wil-l
f ollow with a d.iscussion on the da-ta requirements, and
specific costs. This will be fotlowed by the empirical
results in Chapter IV and the economic implications and con-
clusion in Chapter V.
ORGANIZATION OF THE STUDY
l0
THEORETTCAL ASPECTS OF TRÄNSPORTATION COSTS W]TH
SPECfAL REFERENCE TO TRUCKING COSTS
The relevant economic theory and the conceptual model-
used in the analvsis wi-11- be discussed in this chapter" The
main topics include the theoretical cosi structure, assumed
truck cost structure, and the theoretical model"
CHAPTER IT
GENERAL COST STRUCTURE
Theoretical Concepts
Short run transport.ation costs may be divided ínto two
broad categories, which, when added together, make up total
costs" Fixed costs are those costs which are incurred
regardless of the size of output. Variable costs are the
costs of all factors of production whose quantities may be
ch en clod i n J-h e ShOrt run .
The economic concept of the short run period is that
length of time through which some facLors are fixed and are
not subject to adjustment" In the short run, the firm must
cover all variable costs but need noL cover all fixed costs
to stay in business" In the long run, al-l costs become
variable and must be covered for the firm to remain in opera-
tion" Farm truckers, ât the time of decision making, will-
plan to cover al-l costs. In a trucking cost analysis, as in+1^i^ ^+,,¡=, .-,1Lrr!Þ Ð Lusy ¡ vvrìêfe one crop year iS being analyzed, the short
l1
L2
run must be considered. Thus, the cost structure will incluCe
both fixed costs and variable costs "
Fixed costs may be divided into two categories; first,
the single outlay costs; and secondly, those costs which are
of a recurring nature. The former includes depreciation of
the truck and the interest on the investment in the truck"
The latter includes the annual- licence fee and insurance costs
rìecessarv Lo enable the vehicle to be operated in the year
for which these fees apply. The sum of the costs will- be
distributed over the entire output, and thus the greater the
output, the smaller the average fixed costs. Varialcle costs
witl depend on the magnitude of the output" These costs
include such items as fuel, repairs, lubrication, maintenance,
utilitíes, and wages "
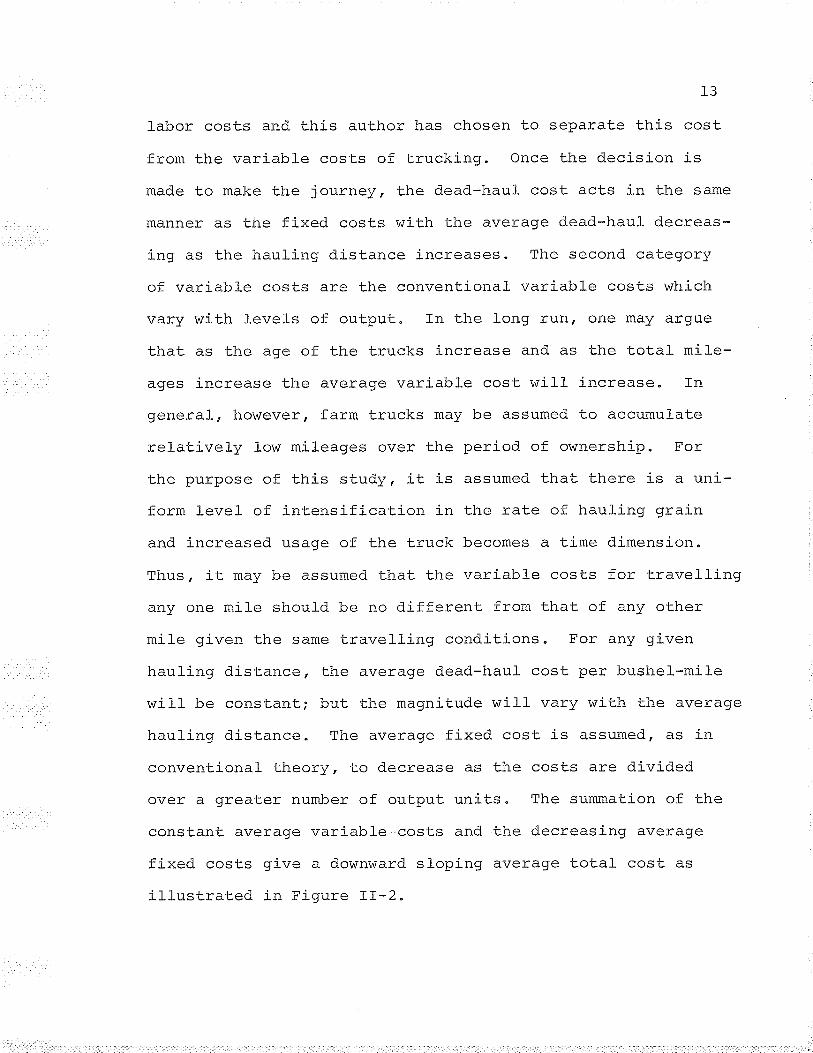
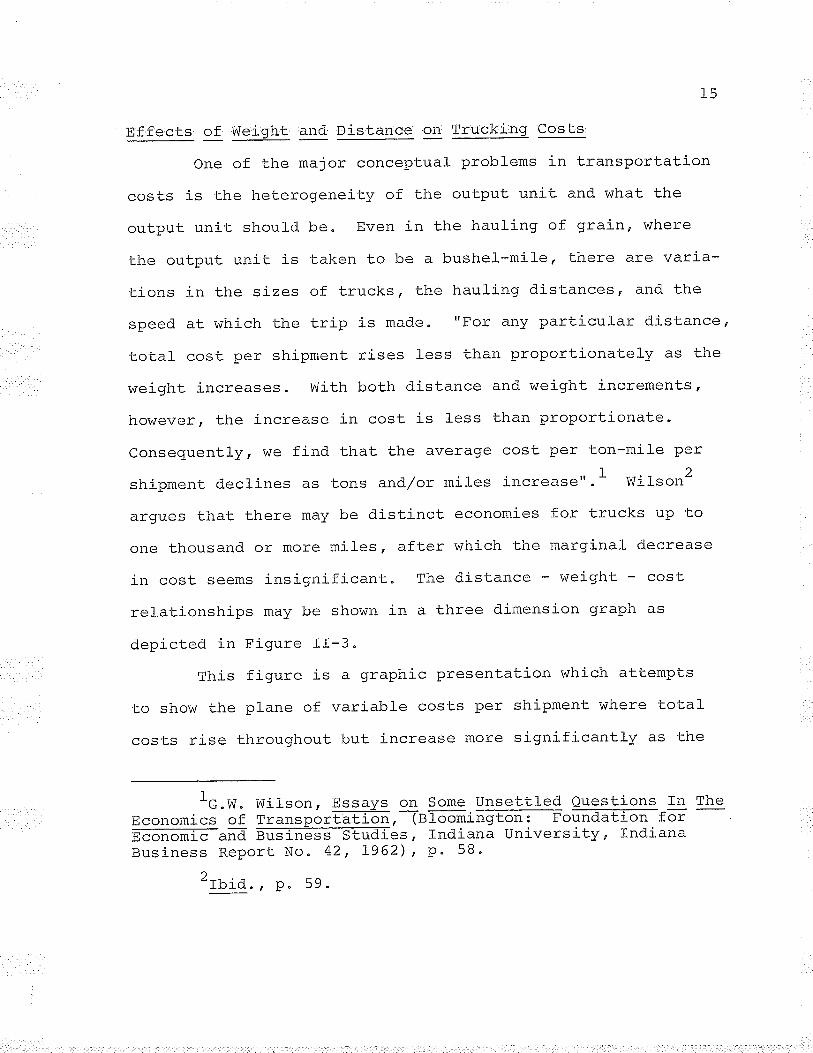
Theoretically, the short rurr average and the short run
marginal cost curves are rrlJrt shaped as shown in Figure II-1"
The shape of the marginal cost curve j-s determined by the
shape of the total variable cost, since fixed costs remain
constant regardless of the output level.
TRUCKING COST STRUCTURE
Trucking Cost ConcepLs
IL is suggested by Young and Moore that the conventional
concept of rrIJtr shaped average and marginal costs do not typify
the short run cost structure of trucks " The variable costs
may be divided into two categories " The dead-haul costs are
13
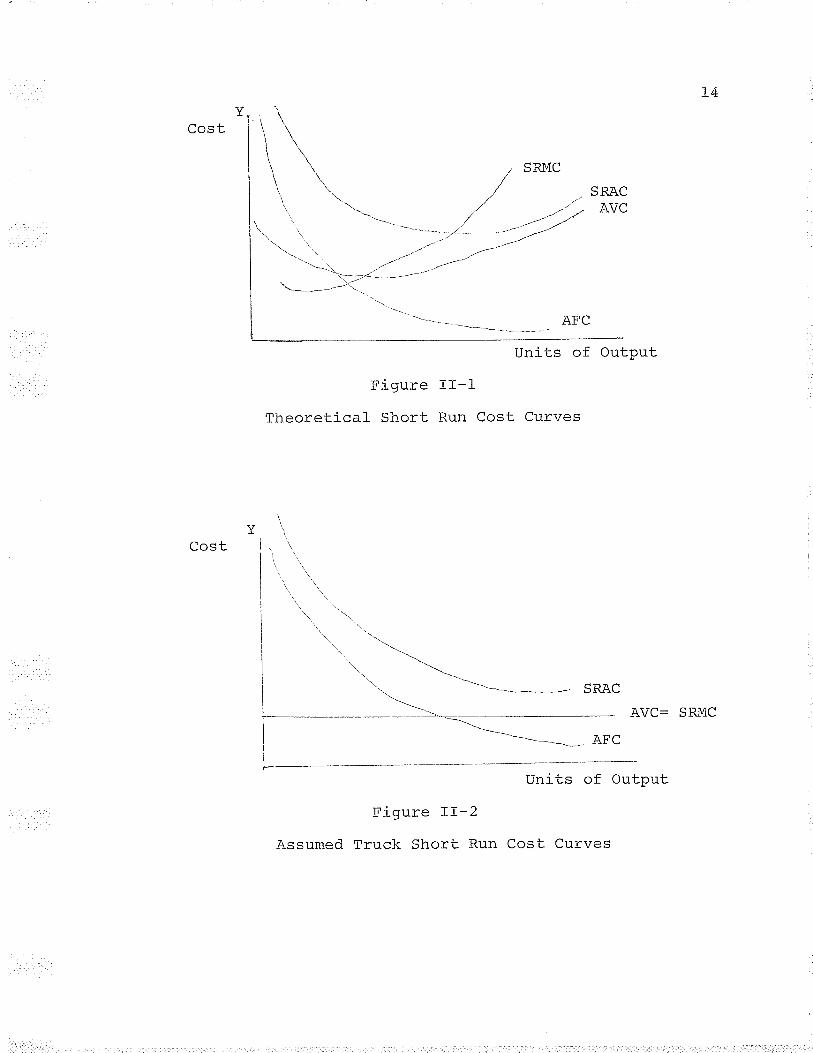
labor costs and. this author has chosen to separate this cost
from the variable costs of trucking" Once the decision is*-,¡^ +^ m-t-^ r-ha i^rrrnorz +.he dead-haUl COSI aCtS in the SamerrrclL¿g L\J trrq.Ãg Llrç J vu! rrçJ t L
manner as the fixed costs wíth the average dead-haul decreas-
ing as the hauling distance increases " The second category
of variable costs are the conventional- variable costs which
vary with levels of output. In the long run, one may argue
that as the age of the trucks increase and as the total mile-
ages increase the average variable cost will increase" In
generalo however, farm trucks may be assumed to accumulate
relatively low mileages over the period of ownership. For
the purpose of this study, it j-s assumed that there is a uni-
form leve1 of intensification in the rate of haulì-ng grai-n
and increased usacre of the truck becomes a time dimension.
Thus, it may be assumed that the variable costs for travelling
any one mile should be no different from that of any other
mile given the same travelling conditions " For any given
hauling distance, the average dead-haul cost per bushel-mile
witt be constant; but the magnitude will vary with the average
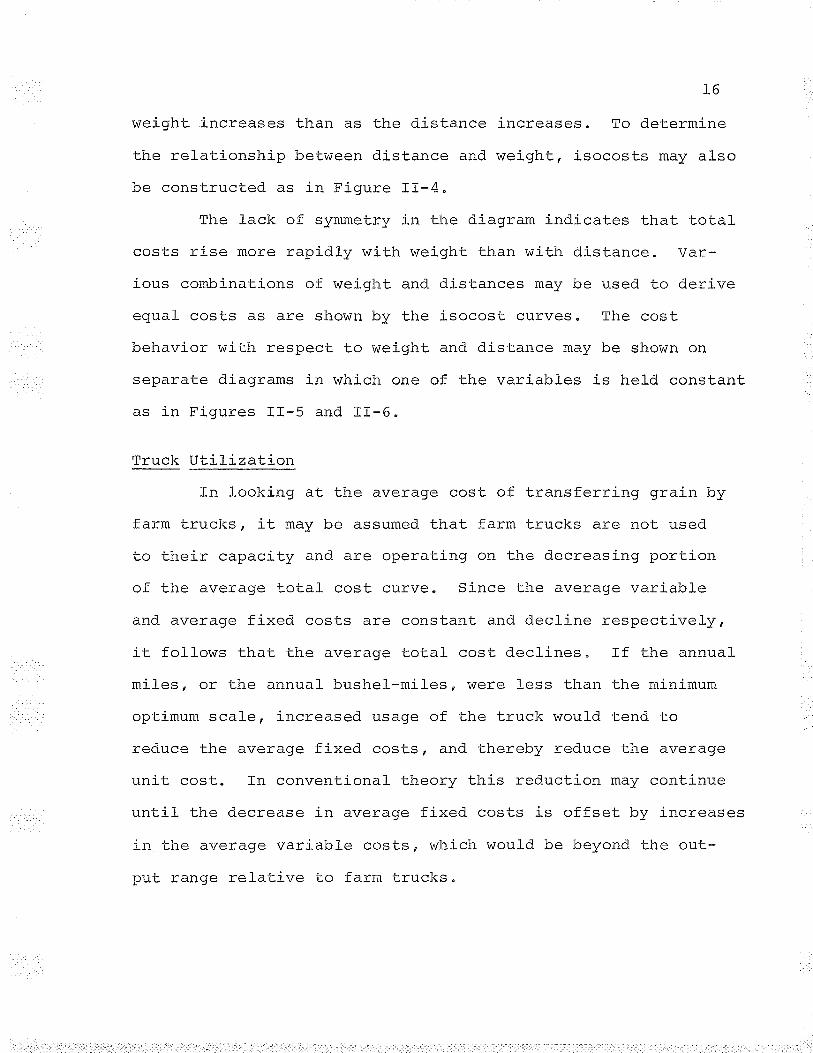
hauling distance. The average fixed cost is assumedr âs in
conventional theory, to d.ecrease as the cosLs are divided
over a greater number of output units. The summation of the
constant average variable costs and the decreasing average
fixed costs give a downward sloping average total cost as
illustrated in Fiqure II-2"
\-(JÞ L
Figure
Theoretical Short
Cost
Units of Output
-L_L-l-
Run Cost Curves
L4
\.' '\\\
tr--
tt'.... --t-----==- sRAc
Figure T.I-2
Assumed Truck Short Run
- AFC
Units of Output
AVC= SRMC
Cost Curves
Ef,fê'its of we',i',ght', ;and' Di:s:tan:ce: :on: ;Tr:uck:ingr costs,
one of the major conceptual problems in transportati-on
costs is the heterogeneity of the output unit. and what the
output unit should be. Even in the hauling of grain, where
the output unit is taken to be a bushel-mile, there are varia-
tions in the sizes of trucks, the hauling distances, and the
speed at which the trip is made, "For any particular distance'
total cost per shipment rises l-ess than proportionately as the
weight increases. WiLh both distance and weight increments,
however, the increase in cost is l-ess than proportionate"
Consequently, wê find. that the average cost per ton-mile per._r 2
shipment declines as tons anð./or miles increase" " * Wilson-
âr.rlrêq fhat l-hora marz l're r1 rstinct economies for trucks up toq! Y qçÐ ur¡q u urrvr v ¡rre_¿
one thousand or more miles, after which the marginal decrease
in cost seems insignificant. The distance - weighL - cost
relationships may be shown in a three dimension graph as
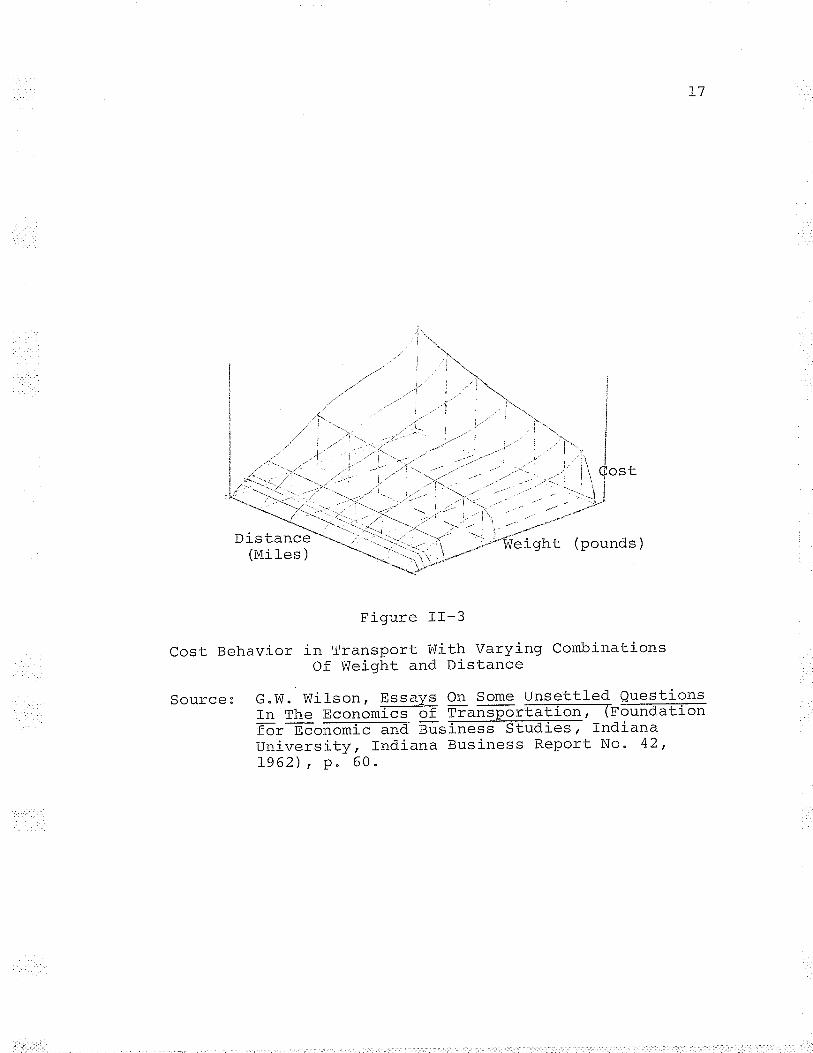
depicted in Figure II-3 "
This figure is a graphic presentation which attempts
to show the ptane of variabl-e costs per shipment where total
costs rise throughout but increase more significantly as the
15
atG.W" Wilson, Ess?ys o+_9ome.Uns-ettte9 Qugstions_In TheEconomics of Transportatîon, (eloomington: Foundation forEcononlIc and ffies, fndiana University, IndianaBusiness Report No" 42, L962), P" 58"
aT7^;Ã ñ (O.|uô r Vê
16
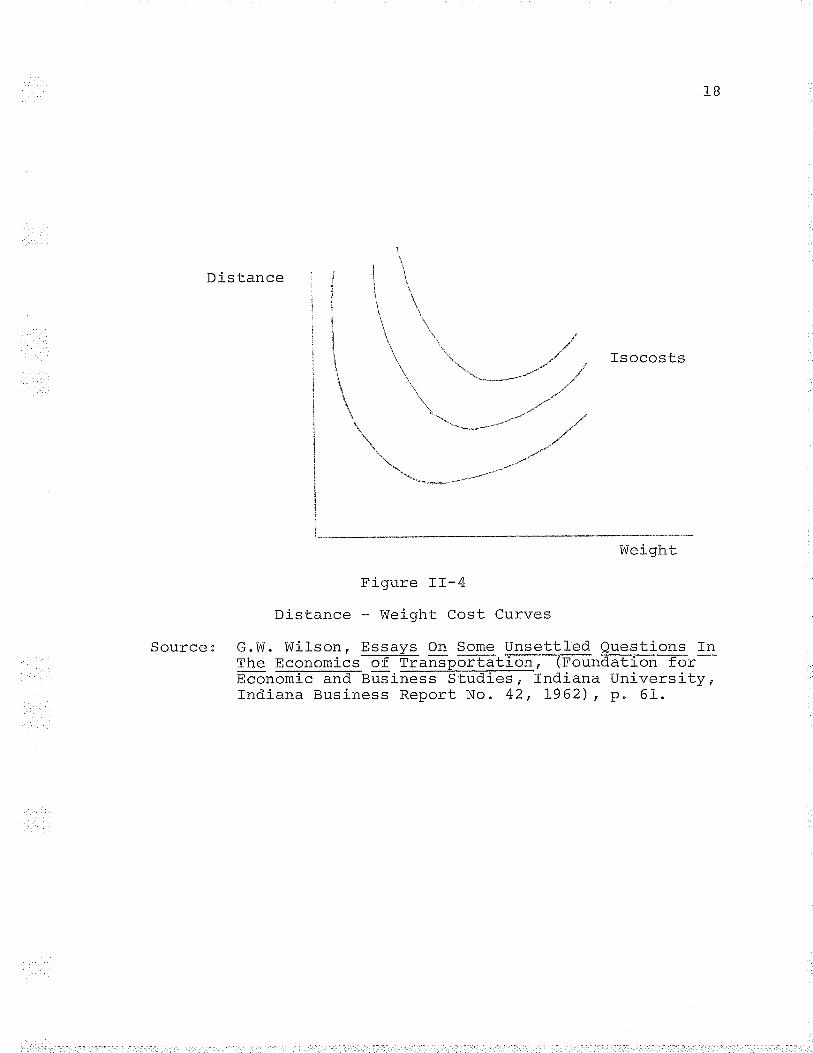
weight i-ncreases than as the d.istance increases " To determine
the relationship between distance and weight, isocosts may also
be constructed as in Figure II-4 "
The lack of symmetry in the di-agram indicates that totalcosts rise more rapid-ly with weight than with dístance" Var-
ious combinations of weight and distances may be used to derive
equal costs as are shown by the isocost curves " The cost
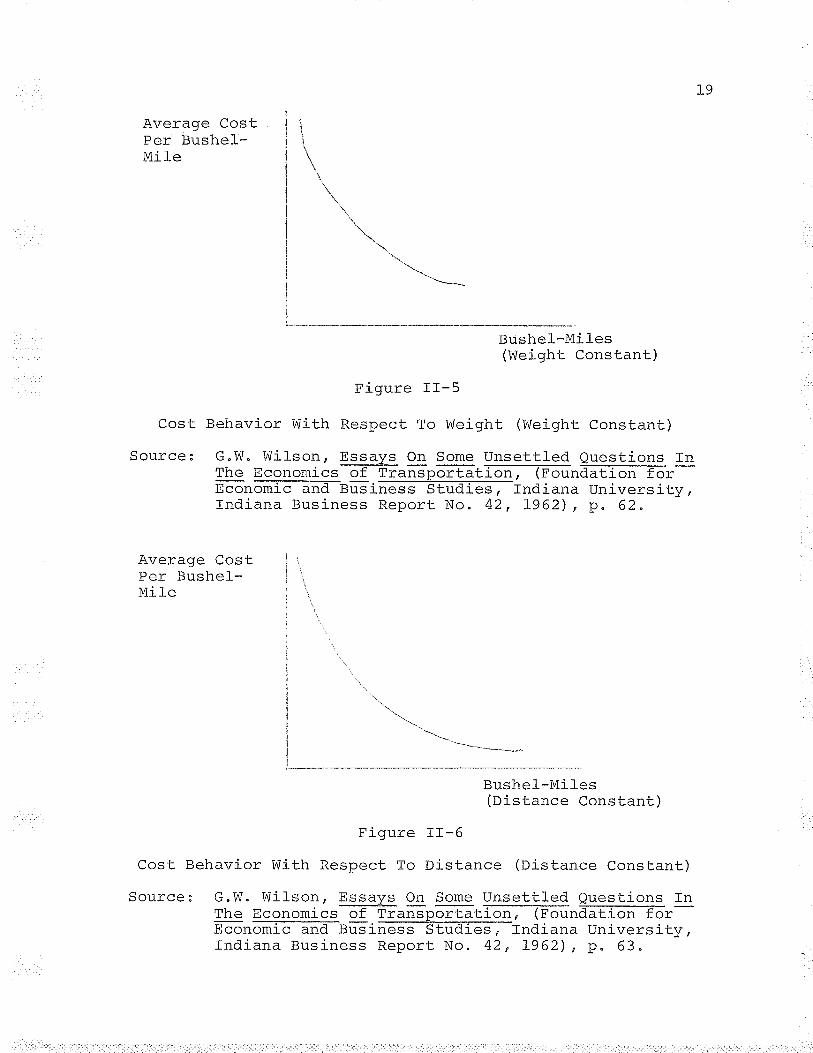
behavior with respect to weight and distance may be shown on
separate diagrams in which one of the variables is held constant
as in Figures II-5 and fI-6 "
Truck Utilizationfn looking at the average cost of transferring grain by
farm trucl<s, it may be assumed that farm trucks are not used
to their capacity and are operating on the decreasing portion
of the average t.otal- cost curve" Since the average variable
and average fixed costs are consLant and decline respectivelyo
it follows that the average total cost declines " If the annual
miles , or the annual bushel-miles, \^/ere less than the minimum
opti-mum scale, increased usage of the truck would tend to
reduce the average fixed costs, and thereby reduce Lhe average
unit cost. In conventional theory this reduction may conLinue
until the decrease in average fixed costs is offset by increases
in the average variable costs, which would be beyond the out-
put range relative to farm trucks.
t7
Cost Behavior in Transport i/üith Varying CombinationsOf Weight and Distance
source: G.W. Wil-son, Essays on some uns9ttle4 QueqtionsIn The Economics of Transportatron, (FoundaLl-onEõr ncoñomÏõ-ãñã susffi fndianaUniversity, Indiana Business Report No" 42,1962), P" 60"
h'a dl1fô I l- I
IB
ïsocosts\'it'' ''t -.-*----/,
\ ,,f'i
\
't-.'-* '-""
/
\ -.-/\\':**----'*'
\\\
Inleight
G.!{" I¡üil-son, Essays On Some Unsettl-ed Questions InThe Economics of transportatîon, -lFoun¿-a-EÏõñ-Tõr-nconõmfõ-ãnã'-eusiffirndiana university,Tndiana Business Report No. 42, 1962), p" 61"
\
\
Distance
Distance - Weíc¡ht Cost Curves
Source:
Average CostPer Bushef-IVIA IE
Cost
Qnrrrna "
1
L_
Behavior With Respect To l,r/eight (Vüeight ConstanL)
G.I,V" Wil-son, Essays On Some Unsettled Questions InThe Economics-of Eansportatlon;lFounããElõn -fõr-nconomîc ana-eusiffirndiana university,fndiana Business Report No" 42, 1962), p" 62"
Average CostPer Bushel-Mile
Figure II-5
l9
Bushel-Mil-es(Weight Constant)
Bushel-Mi]-es(oistance Constant)
Figure If-6
Cost Behavior With Respect To Distance (Oistance Constant)
Source: G"W. VÍilson, Essays On Some UnsetLled Questions InThe Economics of Transportatíonn (Foundation foreconõmïã anã-eus i@ndiana univers ity,Indiana Business Report No. 42, L962), p" 63.
------ --.*-*-
20
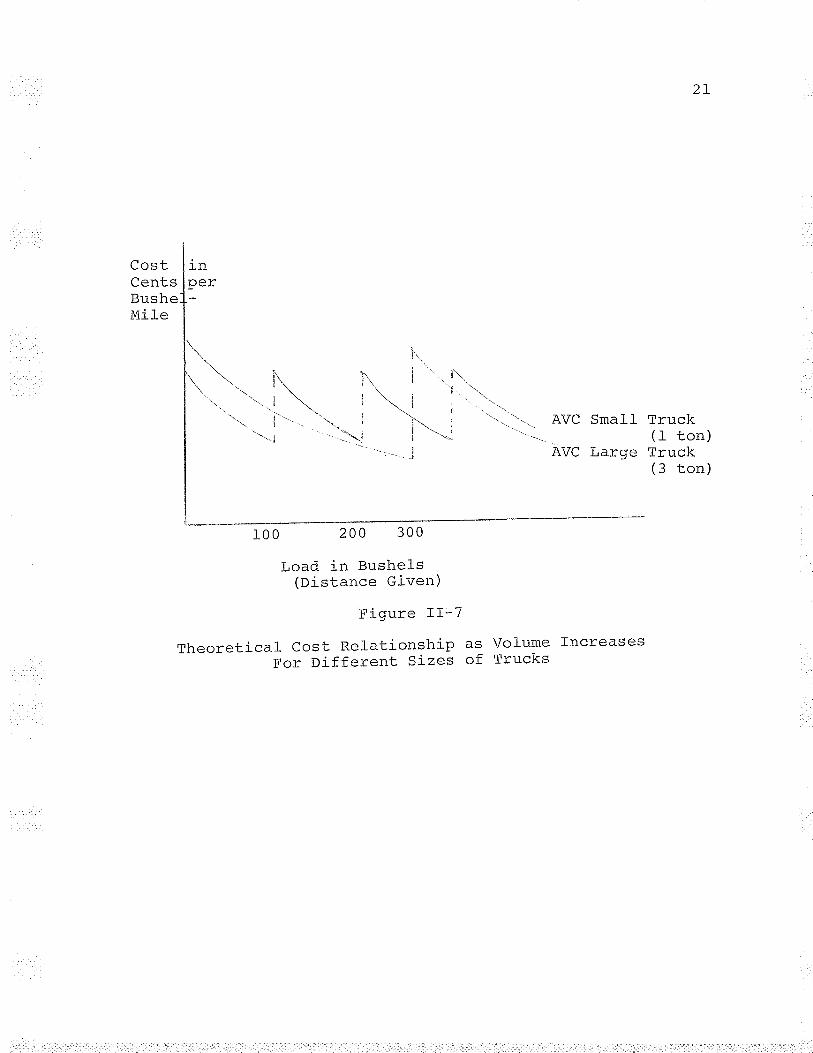
The size of the truck may have considerable influence
on the utilization of the vehicle" The size must be considered
with the hauling distance, with the volume to be hauled, as
well as with the degree of flexibility required in the farm
operation. For any gíven level of output util-izaLion of the
vehicte would. vary inversely wiLh the sj-ze of the truck.
Figure II-7 gives a theoretical geometric description of two
sizes of trucks showing the cost relationship in average var-
iable costs as volume increases with a given hauling distance.
As shown in Figure II-7, the two trucks of different sizes
have unequal load capacities. The one ton truck has a capacity
of 100 bushels while the Lhree ton truck has a capacity of
250 bushels" Atthough the major part of the variable cost may
result because the journey is made, it is reasonabl-e to assume
that the average variable cost per output unit would decrease
as the load size increased, on a per l-oad basis. The cost func-
tion is discontinuous because each truck has a maximum capacity
and any partial load would require an additional trip" A
trip with less than a full load would result in higher Lhan
minimum average costs per bushel-mile" The discontinuity in
the cost function occurs where an additional- trip is required
in addition to a full load. Figure TI-7 indicates, theoret-
ìr:a'l lr¡- where J-he â\/êrâoe variable costs for each of the tworeqr¿f r vY¡¡v!v
trucks is lowest. At less than 100 bushels, the one ton truck
has the lower average variable costs per bushel-mile" How-
êrzêr - for ânv load over 100 bushels, the three ton truck has
CostCentsBusheMile
l_n
l"'
itr,, lt, | '1t..'',"' '1. '''''. : \i i ,-"'-__.i \i
,__ ì_".1 ''-.ì:_
2L
r00 200 300
Figure 1I-7
Theoretical Cost RelationshiP asFor Different Sizes of
Load in Bushels(oistance Given)
AVC
AVC
Small Truck(f ton)
Large Truck(3 ton)
Volume IncreasesTrucks
22
the lower average variable costs " Theoretícally, different
sj-zes of trucks may have advantages over certain ranges of
loads and distances.
The basic conceptual model- used in the study will be
similar to that used by Young. However, the review ofI
literature- left. questions unanswered and queries arose with
respect to some procedures used in previous studies " For
oxamn]c- nrcrrisç¡s studies have concluded that the size of the
load, the length of haul, and the road surface play an
important role in determining the final transfer costs of
hauling grain" Al-so, there appears to be little information
with respect to the impact of the age of the truck as well as
the annual nunrlcer of miles travelled on the cost of haulinq
grain.
It can be argued that as the age of the truck increases,
its val-ue decreases resulting in l-ower depreciation and
interest on investment" Vühen the reduced fixed costs are
averaged over the miles travelled, the average fixed costs
will be lower and should be reflected in the averase fixed
cost of hauling grai-n" Similarly, when the number of miles
nar nari n| ì ncraaqeq â\zêr:^^ 'tri v^/i ^^õJ-q nar rrni l- nf nrr{-nrrfIlgr vg!ruu ¿frvlvqour t qvç!dll g IIÀgu uvÞ Lo l/ç! u¡¡¿ L v! uLlLUuL
CONCEPTUAL MODBL
?'A brief literature review may be seen in Appendix A"
23
will decrease. These two aspects were introduced- into this
study in addition to size of load, length of haul, and road
surface, which have been analyzed in previous studies"
The specific hypotheses made in this study were as
follows:
1" The average cost of transferri-ng praJ-rj-e grain to
the sales outlet by farmer owned and operated trucks was 0 " 50
cents per bushel--mile. The alternate hypothesis was that the
averagie cost was less than 0.50 cents "
2" The average cost per bushel-mile decreased as the
truck miles, p€r year, increased"
3" The averagie cost per bushel-mile decreased with
increased haulincr distances "
/l ml^^ ârzôrâdô ¡ncf. nor hlrqhal -m'i 'l o Ia¡ra¡qofi *.1-ra+ " l-Ilg qv glqYg uvÐ u Pçr vuÐr¡ç¿ ¡r¿!¿e 4Þ LIIE
1^-,¡ ^.: -^ .i * lrllshol s _ i nr:reased"ILrqU Þf ¿ç ¡ III UqÐM!Ð , J¡¡9!
5" The average cost per bushel-mile increased as the
porti-on of non-paved roads travell-ed increased "
6" The average cost per bushel-mile decreased as the
age of the truck increased.
To derive a quantitative rel-ationship between the
dependent and the independent variables the linear model;
Y = B + B-X, + B^X^ + B-X- + B,X, + B-X- + cOII¿¿JJLI 455
vras postulated where:
Y - cost in cents per bushel-mile
B = constanto
B.= regression coefficients (i = l, 2, .o., 5)
X-= miles in 000rs travelled in the L967-68--1
crop year
Y = .rnê-r^râ\z haUling diStance (miles)'-2
X.= Ioad size (bushels)J
Xn= percentage of rron-paved roads
X = â.rê of frirck..5*ì,-
c = random error
It was hypothesízed that 8., (i = l-, 2, 3, 5) were less than 0
and B4 was greater than 0 "
The conceptual model will be fitted to both the actual
data and the logarithmic transformation of the data, and the
form yielding the best fit will be used to test the hypotheses
regarding the regression coefficients" In addition, the same
model- will be used as a predi-ctive equation, such that truck-
ing costs (Y) may be estimated for a given set of independent
variables "
24
This chaÞter will cover three main areas " The first.
part will outline the data required" The second part will be
a discussion on the determination of the specific costs, and
the thírd part will outline the determination of the grain
hauling costs in cents per bushel-miIe.
DATA REQUIREMENT
CHAPTER III
EMPIRICAL PROCEDURE
The data' requi-red in determi-ning the grain hauling costs
include all the components of both the fixed and variable costs.
The fixed costs include depreciation, interest on investment,
I 'i canrra f oos and insurance costs " The variable cosLs include!vvs t
the costs for lubrication, repairs, tires and batteries,
utilities, fuel, and driver labor. Also, the dead-haul cost
vüas required.
The total annual miles travelled bv the t.rucks were
required, as were the average loads carried and the distance
the grain was hauled to the sales outlet," The amount of grain
transported to the safes outlet was also required" From this
data, the number of miles the truck was used to haul- the grain
was calculated"
25
lqoo ar--- --ppendl-x lJ
for the questionnaírefor sample characteristics and Appendix D
used in obtainíns the data"
Fixed Costs
Depreciation" In general, depreciation should. be charged
as a fixed cost; that is Lhat portion of value decrease which
may not be attributed to truck use. One must agree that part
of the reduced value is a result of usage and not entirely
due to ownership and the passage of time" It, however, j-s
virtually impossible to determine that portion which should be
a variable cost; therefore, the entire depreciation has been
considered as a fixed cost"
Capital assets, such as trucks are purchased at one
period in time with the expectations that they will- be utilized
over a number of period.s. Since the val-ue of these vehicles
decreases with âgê, usage, and obsolescence, one expects that
eventually at some time in the future that that vehicle must
be replaced" Since its value or usefulness will be consumed
over a number of periods, the cost of the slowly-using-up of
the assets must be distributed over the periods " As the age
of the truck increases, its reliabi1ity may, or may not, be
'i mn¡ìrad.lêrrêÌ.'ij-^ *L^.lanner in WhiCh it WaS maintained and¿rlryq¿! su uçysrru¿rrY v¡¡ utIE fL
the job it is expected to perform. As a result, it becomes
very difficult to allocate the cost of owning a truck in the
proper proportion over a number of periods.
DETERMINATION OF SPEC]FIC COSTS
26
There are several ways of computing depreciati-on, all
which have advantages and disadvantages. For the purpose
this study three methods, the annual revaluation, the
of
of
27
straight-line, and the diminishing balance methods vrere con-
sidered.
The annual revaluation consists of revaluatinq the asset
for each time period with the difference between two consecuLive
periods being the depreciation. This method attempts to
establish the market value of the asset for each year" Flu.ctua-
tions in economic cond.itions may bring about flu-ctuating prices
over time, and therefore, an irregular pattern in depreciation"
^^^1.i ^J +^ .tr-.ä¡,r/rrsu Lv rq.rnì trucks, annual revaluation is unsatisfactory"
Depreciatj-on arrived at in this manner during the first few
years of use of the trucl< diminishes sharply because there is,
at first, a rapid loss in resale value" However, as stated
earlier, trucks are purchased to be used by the farmer for a
long period of time, and resale is not intended. Therefore,
resale value is of little significance" Also, as the truck's
age increases, any change in resale value, becomes increasingly
dìffir:ujt to nerr:e'i r¡e- Chancrcs in fhe resâle rzaltle of trucksUtr! ! Ivs! u uv t/9! vv¿ w u o
are lilcely to be caused as much by changes in farm business
outlook or in the price level o€ farm t.rucks as by diminishing
usefulness of the truck"
The straight-line method consists of dividing the total
anticipated depreciation by the number of years the asset is
expected to last to find the annual depreciation. The total
depreciation is the purchase price minus the salvage value"
This method works well for analyzing the trucl< business when
the truck is used a rather constant amount throughout the years "
It does noL, hOWever, reflect the market value, especially
the early years of the asset's lífe"
The diminishing balance method appears to conform closely
to the decline in the resale va1ue. Using this methodr a per-
centage of the remaining value is deducted each year for
depreciation. There may be some disagreement over the rate of
discount used in this method making its use somewhat difficul-t
when the life span of the asset is unknown. A constanL per-
centage of the diminishing balance results in a depreciation
each year which is smaller than that of the preceding year.
The resale value may decline substantially the first year of
use but it is unreasonable to charge as much as 20 or 30 per-
cent of the purchase price as depreciation when the truck is
expected to last in excess of 10 years. Ho\"/ever' there is
little relationship between this deprecíation and the per-
formance of the vehicle. Again, the truck was obtained for
- ^r- ç ^- reS ale "LlÐE¡ rlvu !v!
Each of the aforementioned methods has merits and
demerits " Since it was assumed that most farm trucks are not
purchased. new, the new price would be unknown, and since the
useful life of trucks, also, is unknown, and since farm trucl<s
are not purchased for resale' some method of determining
depreciatíon other than any of those discussed- must be used "
The method used was a combination of the straight-Iine and
annual revaluation methods" The method chosen' was to deter-
mine the total depreciat.ion of the truck, while owned by the
¿ó
in
f armor l-reqarl +1-^ ^,,ø^L¡qa nri ¡a f tn {-ha f armarlur¡ rrre purcna__ l.* L uv !sÀ¡!¡v* r , ml-nus
the current resale value, and to assign that depreciation
equally to each and every year over which the farmer owned
the trucl<"
Interest on Investment" Each farmer who owns a capital
asset has had to make arrangements for the payment of the
principal involved" Should the asset be financed or the money
borrowed externally, there is an interest charge which must be
assigned as a cost of owni-ng that asset" This charge will be
incurred whether or not the asset is util-ized" Therefore,
this charge will be assigned as a fíxed cost" Should the
principal be paid from funds wíthin the firm, there arises an
opportunity cost for the use of that money" Had it not been
used to purchase the specific asset, it may have been utilized.
el-sewhere either within or outside the firm and would effect
an additional- return to the firm. Thus a charqe must be
assigned for the use of the capital invested. The rate of
interest charged should closely approxirnate that which the
owner could earn on the same capital had it been invested in
a safe investment for an intermediate period of time. As many
farmers do not have ful-l equity to their trucks, the rate of
seven percent, one percent above the return on a safe investment,
has been used as a return to truck investment.
The beginning and end of year values v/ere averaged to
gi-ve an average capital investment for the period. The interest
29
30
charged was then calculated on the averagie investment at a
rate of seven percent" To acquire the average interest on
investment, the sum of the interest assessed was averaged over
the number of trucks in the group" The per mile interest
charges were calculated by averaging the average interest charge
over the average number of miles travelled by the group of
trucks in the L967-68 crop year"
Housing Costs. Controversy has come to the forefront in
the discussion on housing costs assigned to farm trucks"
Analyses vary from that of Furniss4 who assigned a charge of
0 " 5 percent of truck replacement value for housing costs in
his computations to that of Young who claimed that. the propor-
tion of trucks housed was too small to warrant a housínq cosL
^ñ^*! . ^assessrrrenE. foung" suggests there is a question as to whether
it is economically rational to house farm trucks.
Since many farm trucks are housed, a housing cost was
calculated" This cost was not used in the analysis, but was
computed as a supplementary cost and may be added to the average
trucking costs when deemed desi-rable.
*I.F. Furniss, Cost Accounting for(Il-lustration Station Dfvisîon;-TanãAianfrrro I'ol'rrrr¡rrz lqqR) n
^, ! e!!sqLJ I lJrvt f
R
K.lJ" YOUng, OP" Cl-t.r p" ¿!2"
Àarinrr'ltrrra D¡rJ- 1es4us!st
Department of Ãfficüf-
aa
The value of the building and the portion used to
house the truck v¡ere obtained from the survey, and thus, a
housing value coul-d be established" It was assumed that the
depreciation rate shoutd be five percent of the value of
the housing facilities. The interest on the housing facilities
\^/as determined by fínding the average investment for the period
and charging six percent. It was assumed that the opportunity
cost for fixed capital assets such as buildings, should be six
percent which is one percent less than that used to calculate
the interest charges for trucks.
Licences" Licence feeso at" an annually recurring cost
based on the gross tonnage of the truck and the type of service
provid.ed, and are considered, therefore, as fixed costs. Farm
trucks, although in the same ficence category, wil-l have vary-
ing licence fees depending on the tonnage hauled" Licence
fees vüere accepted as reported in the survey.
Insurance. Insurance charges for farm trucks are costs
which have no relationship to the usage of the unit and are
based upon a specific coverage, and thus are a fixed cost"
The insurance costs \^/ere used as obtained from the survey" The
per mile insurance cost was calculated in the same manner as
that for licence costs "
oThe licence cost, in terms of cents percalculated by weighing the average licence costof trucks by the average annual mJ-leage of that
mile, v/asç ^- -l-1-' a ^r^ì1ñIU! Urrs Y!vqYgroup.
Variable Costs
Lubrication" It is assumed. that. the lubrícatíon cost
v¡as directly related to the miles travelled and therefore, a
variable cost" Although the farmers, in general, used bulk
oil- in their trucl<s they knew the price paid for oil, filters,
and grease, the distance travelled on an oil change and the
oil consumption; consequently, they \^/ere able to give a reliable
lubrication cost even though oil- changes were made on the farm
and no specific records were kept for each oil change" The
lubrication cost per mi-le was calculated in the same manner as
were licence fees "
Repairs " Repair costs like those of lubrication are
rela.ted to usagê, but are also related to managemenL and main-
tenance practices " In general, repaj-rs may be considered a
result of usage and therefore, may be assumed to be a variable
cost and for the purpose of this study will be regarded as such.
Atthough repairs will be regarded as a variable cost, it is
realized that these costs occur sporadically over the life of
the truck and will not fall evenly into each and every time
period even though the yearly mileages may be approximately
the same" A major repair, such as a engine, may be the result
of an accumulated number of miles and there may be some arguments
to d.epreciate that repair over a number of years and thus assume
it to be a fixed cost. It is very similar to depreciation in
which a charge is made to cover obsolescen.ce and a9e, but it,
at the same tíme, cannot be separated from the decreased val-ue
due to usage.
32
33
For the purpose of this study, iL was assumed that wíth
the given sample the sum of the repair cost to each group of
trucks averaged over the number of trucks in the group woul-d
give the best estimate of the average yearly repair costs for
Lhe various groups considered" The average repair costs were
then averaged over the average num.ber of mil-es driven to give
ân â\zêrâñà nor mi lc rana'i r COS|.qYv l/v!
' Batteries and Tires " Batteries and tires are variable
costs because of their nearly direct relationship with miles
travelled. Estimates made by Casavant and Nelson/ indicated
that the medían and modal estimates of tire life on commercial
trucks to be 100,000 miles" This estimate would. indicate that
the average farm truck with its low annual mileage may never
require additional tires in its lifetime" Thiso however, may
not be the case since a farm truck travefs much of its mileage
on gravel and unimproved roads where tire hazards are high"
Further, the effect of aging and weathering may be more
detrimental to farm trucks than the actual miles logged"
Batteries may be considered in the same category as tires,
since age and usage witl determine the length of battery life"
n
'K.L. Casavant and D.C. Nelson, Afl Economic Analysis ofthe Cost of Operating Grain Trucking Firms lJr No-rtþ Dakota,(Fargo: Depártment of Agricultural Economics, North DakotaState University, Agricultural Economic Report No" 54, July'L967) , p. 2I.
34
For the purpose of this stud.y it was assumed that the
tíre and battery costs would be the weighted averages of the
costs reported by the truck owners. The average cost was
weighted. by the number of trucks and the average annual mile-
ages to give a per mile tire and battery cost for each truck
stratification. It was realized that some trucks had no tire
and battery costs charged to the L967-68 crop year even though
there were tire and battery depletion due to usage" fn addi-
tion, some trucks reported high costs which may have been due
to usage in other periods "
Utilities. Considerable argument may aríse over the
placement of utilities into either the fixed or variable cost
category. That portion of the hydro, telephone and heat bill
which must be pai-d regardless of truck usage and can be
assigned to the truck may be regarded. as a fixed cost, whereas
that portion directly related to output should be considered
a variabl-e cost. Vr/hen lookíng at farm trucks, the privilege
of being able to use the utility may be a fixed cost, but,
considering the minute portion that would. be of the minimum
,rr- i tì#rz ¡l-r:rrra if mar¡ be iqnored" The portion of the utilityu u! r! uJ errs! Y e ! e ¡r¡qi
bills then charged to the Lruck for actual usage of that
,"+.i'r.i.r-." m-., 1-ra r.haroed âs a variable cost. Farmers normallyL¿ LIII- Ly lttay us vr¿q! yçu qÐ ç
plug in the truck prior to usage; therefore' that cost may be
charged over the number of starts " Although the cost is not
directly related to mileage, it is directly related to usage.
35
Although there was no charge to telephone reporLed in
the survey, hydro was used" To determine the cost of util-
ities, the sum of the utility costs as reported by the farm-
ers, was averaged over the number of trucks in the group and
then averagied over the average mileage accumulated by the
group in the L967-68 crop year" Some trucks \i\iere not used in
the winter and thus reported no utility cost but they were
averaged with those which did to get an average cost"
Fuel. One of the costs which ís directly proportional
to mileage travelled is that of fuel. The farmers were asked
to estimate the average mileage obtained in the trucking of
grain from the storage site to the safes outlet as well as
the price paid for gasoline" The average gasoline costs per
mile was determj-ned by dividing the average gasoline price by
the average miles per gallon obtained by the trucks "
Labor" In analyzing the cost of trucking, there must
be a charge to labor to cover three areas of work done; repair
and maintenance, driving time, and the time spent loading,
waiting and unloading. Farmers do not consider their time in
farm work, but for the purpose of this study a l-abor cost was
used" It is assumed that white not hauling grain the farmer
will be doing some other task" Since the area under study'ì
^--^ --,fwaÐ ¿arvç qrru covers areas which represent all types of farm-
ing from livestock to grain, it was assumed that no one area
or single stud.y could present a wage rate representative of
36
the whole" To overcome that difficultv each farmer was asked
what it would cost him to hire someone, oD an hourly basis,
to drive his truck or what he could earn doinq similar work
for someone else" The averagie was taken of those values given
and that value was assumed to be the labor cost for the studv.
A charge was made to the Lruck for repairing and main-
tenance in accordance with the calculated labor cost and the
reported time spent in doing Lhe task. The labor time was
converted to a dollar value and then to a cost on a per mile
basis "
To determine a labor cost for driving the trucko Lhe
average speeds driven by the groups of trucks !\iere calcul-ated"
The time required to drive a mile was converted into a cost
per mile by dividing the labor cost per hour by the averagie
speed travelled"
Dead.-haul" A labor cost for loading the truck, waiting
at the sales outlet, and unloading the truck was also cal-
culated" The average time for each process was summed to
give the dead-haul time" This time was converted, at the
hourly labor cost, into a dead-haul cost" To find a loaded
per mile cost of the dead-haul, the cost was distributed
evenly over the average number of miles on a one-way trip"
In additj-on to the cost Íigures required in determíning
an average cost per bushel-mile, the average hauling distance
as well as the averaqe size of the l-oads carried v¡ere nec-
^^^.,n.ina #l-r¡{- l.lrar^ .;- 'li++'l^ ^r=i- }-^.i¡6 fr:n<-cÞÞqIv o åJÐultrr¡ry urrqu ulrsre -Lù vçIl/ II LLIg YIqf 1l Ug.Llry u!qrrÞ
ported to the sales outlet from sites other than that of the
farm yard, one may concl-ude that the cost of hauling grain
one mile includes one mil-e under load and one mil-e empty" To
determine the average trucking cost per bushel-mile, the cost
of travelling two miles was averaged over the number of bushels
in the load and added to the dead-haul cost which was averased
over the number of bushel-s in the load and the haulinq distance.
The average additional cost of hauling grain increased
distances Lo sales outlets, frây be determined by calculating
f hc â\zerâcre r¡ari abl e r:ost ner bushel-mile. The distance of
hauling should have no effect on the dead-haul costs per load
if adequate elevator facilities are available, such that queu-
ing time does not increase; thus, the additional costs for
increased distances mav be assumed to be the increased variable
costs.
AYERAGE TRUCKTNG COST PER BUSHEL-MITE
37
This chapter will be concerned primarily wíth the
empirical results obtained in this study. It will be
divided into three parts: a presentation of the cost analysis,
a summary of the regression analysis, and a comparison with
the results of other studies "
COST ANALYSIS
CHAPTER IV
EMPIRICAL RESULTS
Fixed Costs
The averagie fixed cost for the entire l. 42 trucks, as
indicated in Tabl-e IV-l, was 10.30 cents per míle" The range
vúas from 4"L2 cents for the one-half ton trucks to 14"00
cents for the two ton trucks " The most important element was
depreciation, accounting fox an average of 5"52 cents or slightly
more than 50 percent of the total fixed cost. The range \,vas
from 2.44 cents for the one-half ton trucks to 7.33 cents f.or
the three ton trucks " The second most important element in
the fíxed costs was interest on investment which averaqed
2"90 cenLs per mile and ranged from 0.86 cents for the one-
half ton trucks to 4 " 05 cents for the two ton trucks. Licence
and insurance costs were of lesser siqnificance than the two
aforementioned elements, with the average costs being 1.15
and 0"73 cents per mile respectively. The ranges were from
0"36 and 0"46 for the one-half ton trucks Lo 2"05 and 1.03
3B
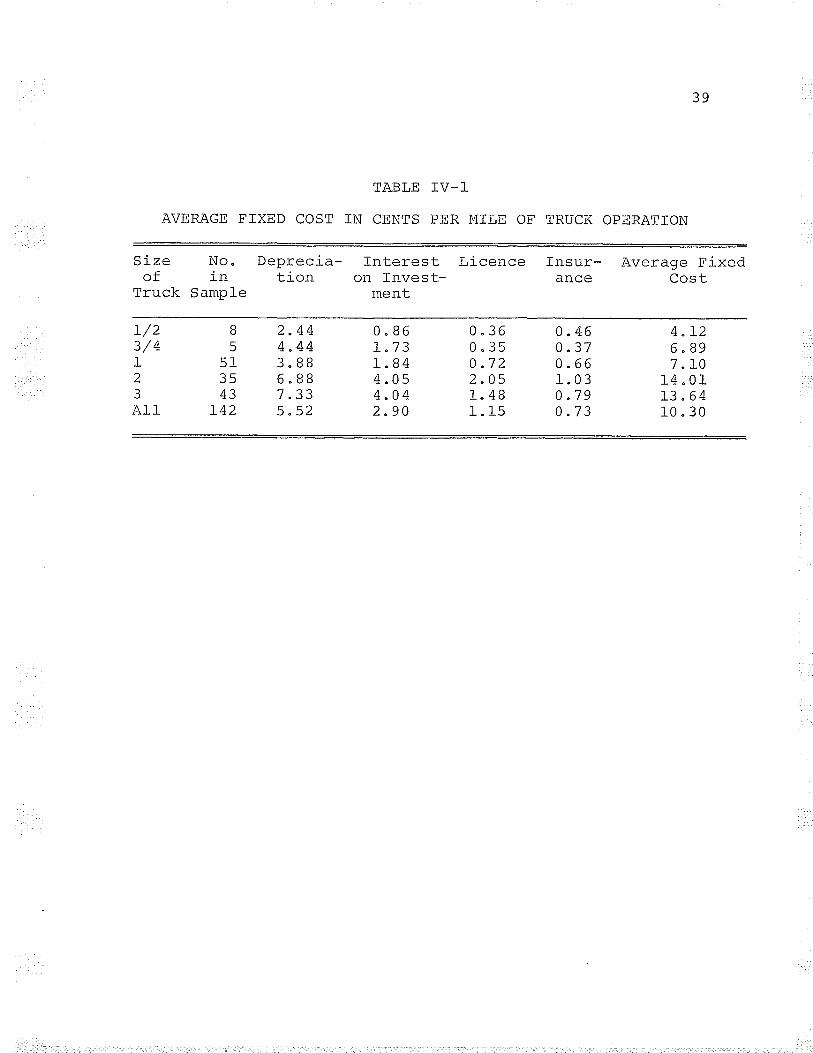
TABLE IV_]-
AVERA,GE FIXED COST IN CENTS PER MILE OF TRUCK OPERATION
Size No" Deprecia-of in tion
rlarrr ¡l¿ Q amn I avq¡rrt,*e
L/23/4I23Al_1
B
55135AA
r42
2.444 "443.BB6. BB7 "335"52
Interest Licenceon fnvest-
ment
0"86L.7 3T "844.054"042 "90
59
0 " 360.350 "722"051 Aa
1" 15
Insur- Average Fixedance Cost
0"460 " 370"661.030.790 "73
à 1)6"897 "L0
14"0113"6410.30
cents for the
higher average
the three ton
ton trucks was
trucks "
Variabl-e Costs
40
two ton trucks" The reason suggested for the
fixed costs for the two ton trucks than for
trucks is that the average mileage for the two
2,2L6 as compared to 3,986 for the three ton
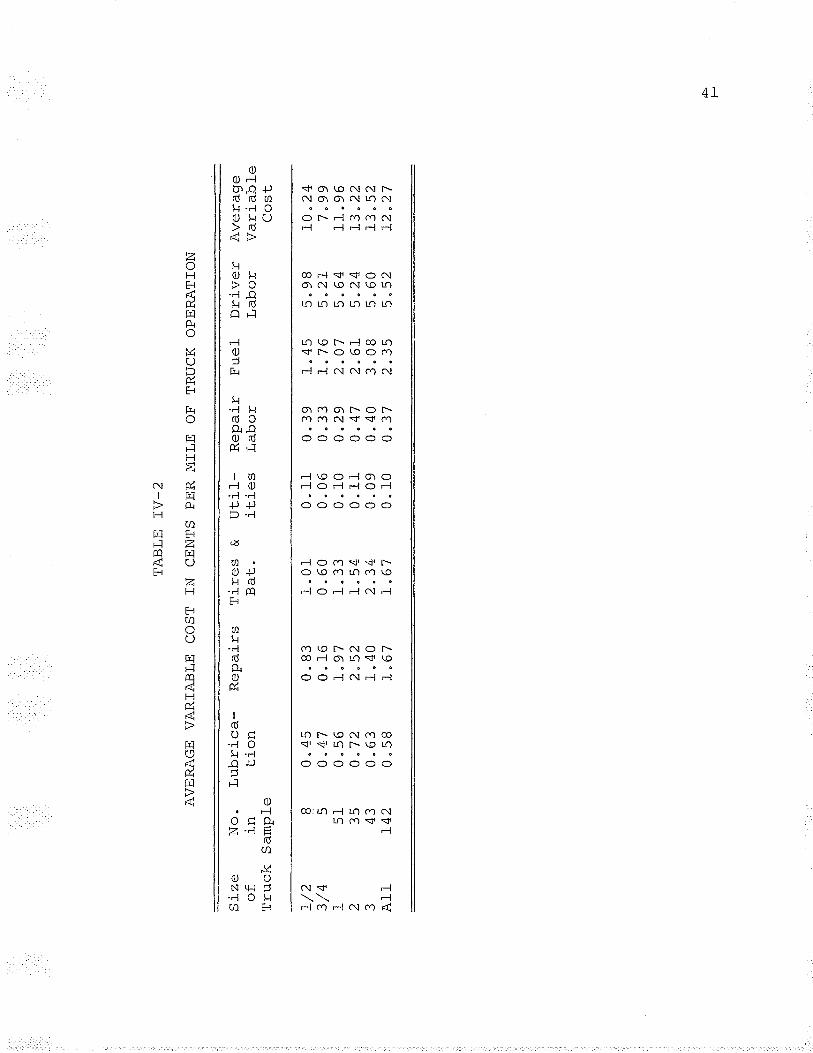
The variable costs, exclusive of dead-haul costs ' var-
ied from 7 "99 cents per mile for the three-qua::ter ton trucks,
to 13"52 cents per mile for the three ton trucks with the
average for all trucks being L2"27 cents per mile as shown
in Table TV-z" The average l-ubrication cost was 0"58 cents
per mile but varied from 0.45 cents per mile for the one-half
ton trucks to 0"72 cents per mile for the two ton trucks.
Repair expenditures v/ere higher for two ton trucks at 2 "52
cents per mile as compared to a low of 0 " 16 cents per mile
for the three-quarter trucks and the average of I"67 cents
ner mi I e - The â\¡êrâ.rê t'i ro an¡l l'ra{- #or¡z COS¡ WaS L"67 CentSl:/g! ¡L(I Is . r ¡rç q v E! qy u u¿! u
per mile with the three ton trucks being the high at 2"34
cents per mile and the three-quarter ton trucks the low at
0"60 cents per mile. Utility costs varied from a high of
0 " l-1 cents per mile for both the one-half and the two ton
trucks while the three-quarter ton trucks were low at 0"06
conts ncr m'i le- The â\zeracrÊ for a'i I t-rucks was 0"10 cenLsvv-
per mile" Labor for repairs varied from a high of 0.47 cents
per mile for the two ton trucks to 0 "29 cents per mile for
the three ton trucks with the overall average being 0 "37 cents
Siz
e N
o"
Lubr
ica-
of
in
tion
Tru
ck S
ampl
e
TA
BLE
TV
_2
AV
ER
AG
E V
AR
TA
BLE
CO
ST
IN C
EN
TS
PE
R M
ILE
OF
TR
UC
K O
PE
RA
TT
ON
L/2
3/4
I 2 { All
B 55l
-35 41
.
L42
0 "
450"
470"
560
"72
0"63
0 " 58
Rep
airs
T
ires
&
Bat
"
0 "
830.
16
L"97
2"52
1.40
L "6
7
1.01
0 "
60l"
331
Ê.4
2 "3
4r
"67
Ut.i
l- R
epai
riti
es
Labo
r
0"11
0 "
060"
100"
110.
090"
10
Fue
l D
river
A
vera
geLa
bor
Var
iabl
eC
ost
0 "
390"
330
"29
0"47
0"40
0 " 37
L"76
2"07
2"6L
3"08
2"35
q qa
5 "2
L5"
645
"24
5.60
5 "5
2
L0 "
247
"99
r1"
96L3
"22
13 "
52
L2"2
7
rÞ l-
42
per mile" Fuel costs ranged from 3,08 cents per mile for the
three ton trucks to L"45 cents per mile for the one-half ton
trucl<s. The average for all- trucks was 2"35 cents per mile.
There was not much variation in the driving costs amongi the
trucks. The average was 5"52 cents per mi1e.
The repairs and repai-r labor costs appeared to be low
for the three-quarter ton trucks and high for the two ton
trucks relative to the other trucks " The reason for this
variation may be that the two ton trucks were overloaded
while the three-quarter ton trucks, which had limited use in
hauling grain, were underloaded"
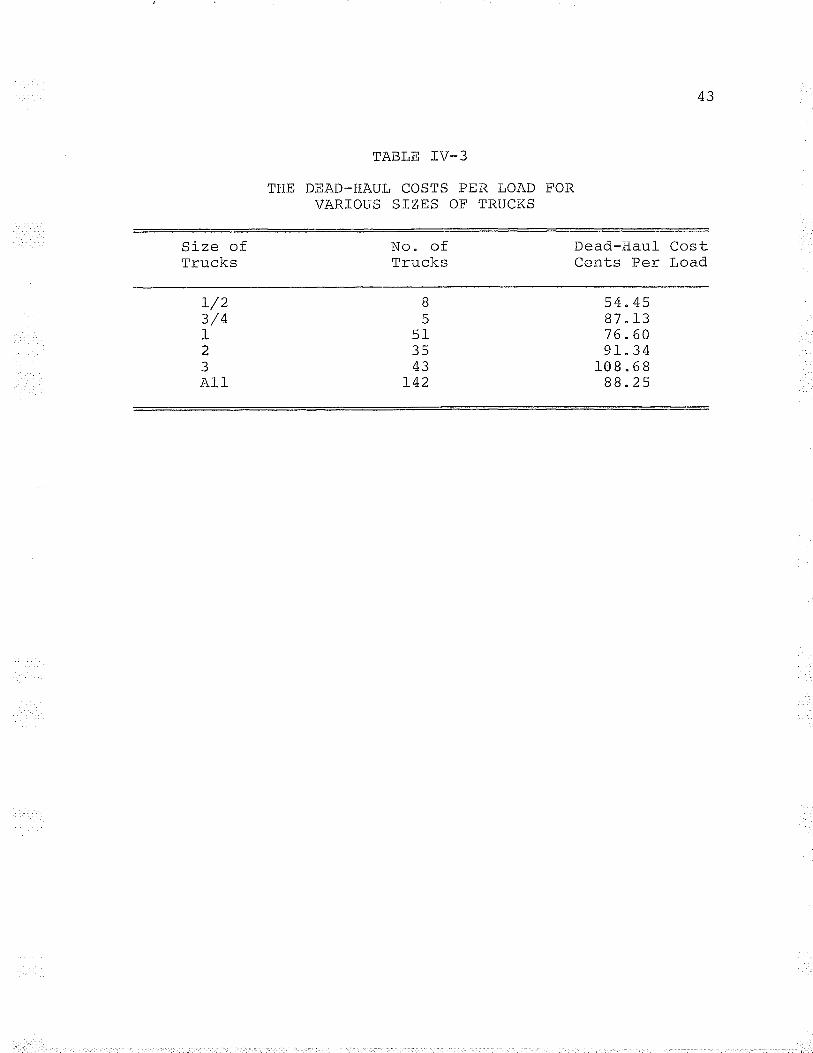
Dead-Hau1 Costs
Table IV-3 outlines the dead-haul- costs, p€r load , for
each size of trucl<" The averase dead-haul cost was 88"25
cents per load while the range was from 54"45 cents for the
one-half ton trucks to 108"68 cents for the three ton trucks"
The dead-haul- costs, pêr load, increased as the size of the
truck increased with one exception" The three-quarter ton
truck cost was greater than the one ton truck cost. It may
not be assumed that the dead.-haul costs per load are the same
for all sízes of trucks "
'_L',Ot.ar
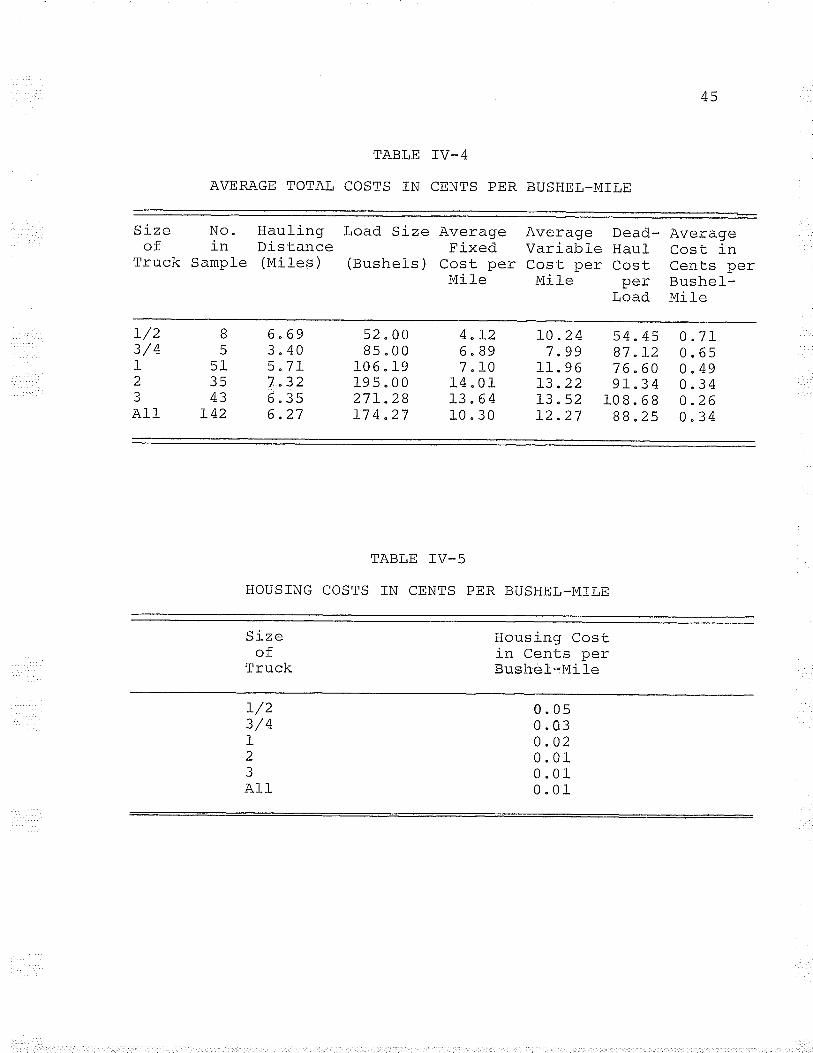
The total costs, shown in Table IV-4, indicate that
the average cost of hauling grain decreases as the síze of
the truck íncreases. The average cost was 0.34 cents per
Cost of Hauling Grain
Size ofTrucks
THE DEAD-HAUL COSTS PER LOAD FORVARIOUS SIZES OF TRUCKS
r/23/4I23All
TABLE IV_3
No" ofTrucks
B
55135A1
L42
43
Dead-Haul- CostCents Per Load
54"4587"1376"609r"34
108"6888"25
44
bushel-mile" The one-half ton trucks had the higher cost of
0 "7L cents per bushel-mile while the three ton trucks had
the lower cost of 0"26 cents per bushel-mile" The load size
ranged from 52 bushels for the one-half ton trucks to 27L
bushels for the three ton trucks. The average load size for
all L42 trucks vüas l-74 bushels" The average hauling distance
\^zas 6.27 miles, and the average annual mileage travelled by
the Lrucks, for the 1967-68 crop year' was 3,41-5"
In addition to the trucking cost analysis, the housing
cost was determined and is given in Tabl-e IV-5. The housing
costs may be added to the trucking costs if deemed desirable"
The cost of 2"37 cents per load was based on the 66 trucks
which were housed. The housing cost ranged from 0"01 cents
per bushel-mile for the three ton trucks to 0.05 cents per
bushel-mile for the one-hal-f ton trucks " The average cost
vras 0"01 cents per bushel-mile"
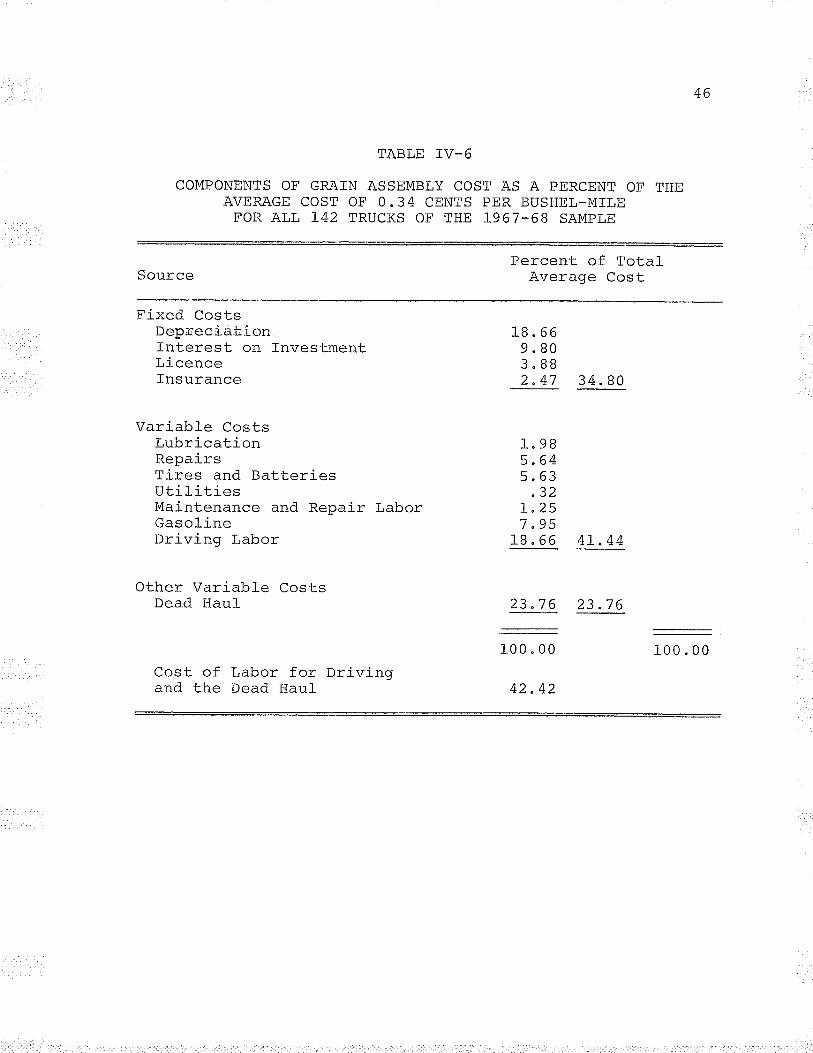
In Table fV-6, the cost components, of grain transfer
costs, are shown as a percentage of the total transfer cost
for the overall average of the L42 trucks analyzed" Fixed
costs represented 34"80 percent, with variable costs, exclu-
sive of dead-haul costs, ãL 4L"44 percent, and the dead-haul
cost at 23.76 percent" The cost to labor for both the dead-
haul and driving time accounted for 42.42 percent of the
Size No" Haulingof in Distance
Truck Sample (Míl-es )
AVERÄ,GE TOTAL COSTS IN CENTS PER BUSHEL-MILE
L/¿
3/4IzJAll
TABLE IV-4
B
55135
L42
Load Size AverageFixed
(Bushels) Cost perMile
^Âa3. 40q 71
7 "326 " 356 "27
)¿"UU8s"00
106"19l_95.0027L"28L7 4 "27
Average Dead-Variable HaulCost per CostMile per
Load
4"126"897 "I0
14 .0113 "6410"30
HOUSING COSTS IN CENTS PER BUSHEL_MILE
L0 "247 .99
11"96l-3"22L3"52L2"27
Sizenf
Truck
1rr^ .F - Æ^âv E! a9E
Cost inl-antq nâr
I--.
Bushel-ivla re
TABLE IV-5
54"45 0"7187 "12 0.6576"60 0"4991"34 0"34
108" 6B 0 "2688"25 0.34
r/21,/LI23All
Housing Costi n l-on'l-q nêr
Fv-
Bushel-Mile
tt tth
0"030"020.010.0t_0"01
COMPONENTS OF GRAÏN ASSEMBLY COST AS A PERCENT OF THEAVERAGE COST OF 0.34 CENTS PER BUSHEL_MILE
FOR ALL L42 TRUCKS OF THE 1967-68 SAMPLE
Source
Fixed CostsDepreci,ationfnterest on InvestmentLicenceInsurance
Variable CostsLubricationRone i r<Tires and Batteríesu tl_ J_ l_ cl- esMaintenance and Repair LaborGasolineI lra \71 h^ l.âhcr
Other Variable CostsDead Haul
TABT,E IV_6
Percent of TotalAverage Cost
46
Cost of Labor for Drivingand the Dead Haul
18.669 " 803. BB2 " 47 34 " B0
1" 9B5"645.63
"32r"257 .95
18. 6 6 4L.44
23 "76 23 "76
r00.00
42"42
I ôn rì11M ê VV
A'7
total cost. The actual cash outlayl amounted to 27.86 per-
cent or 0.09 cents per bushel-mile, assuming no rabor costs.The marginal cost was 4L"44 percent of 0"34 cents n or 0"14
cents per bushel-mile" rt is expected that this would be
relatively constant for smal-1 increases in the haulinq dis-
tances "
Stratification of Costs by Size, Ag€,
-
l',rucKs
Discussion to this point has been largely in terms of
the total sample and the average cost for all of the trucks.
To be of more practical- value, íL is necessary to have more
specifi-c costs than an overall average. To meet this reguire-ment, there appeared to be a need for some stratification ofthe sample on the basis of size of truck, âgê of truck, and
the annual mileages " The trucks were divided into sizes
based on tonnage; into two age groups - 1960 and newer, and
1959 and older; and the mileage was broken down into threelevels less than, or equal to, 2000; 2001 to 5000; and
greater than 5000" For each of the possible combinations,
the average cost in cent per bushel-mile was calculated in
the same manner as v/as done for the overal-l averages for the
entire sample, and is presented in Tables fV-7 to IV-L2"
and Annual MÍleaqe of
*The cash outlay includes the unavoidable costs requiredto operate a truck in which the owner has full equity. Thesecosts include: lubrication, repairs, batteri_es and trres,utilities, maintenance and repair labor, and gasoline.
4B
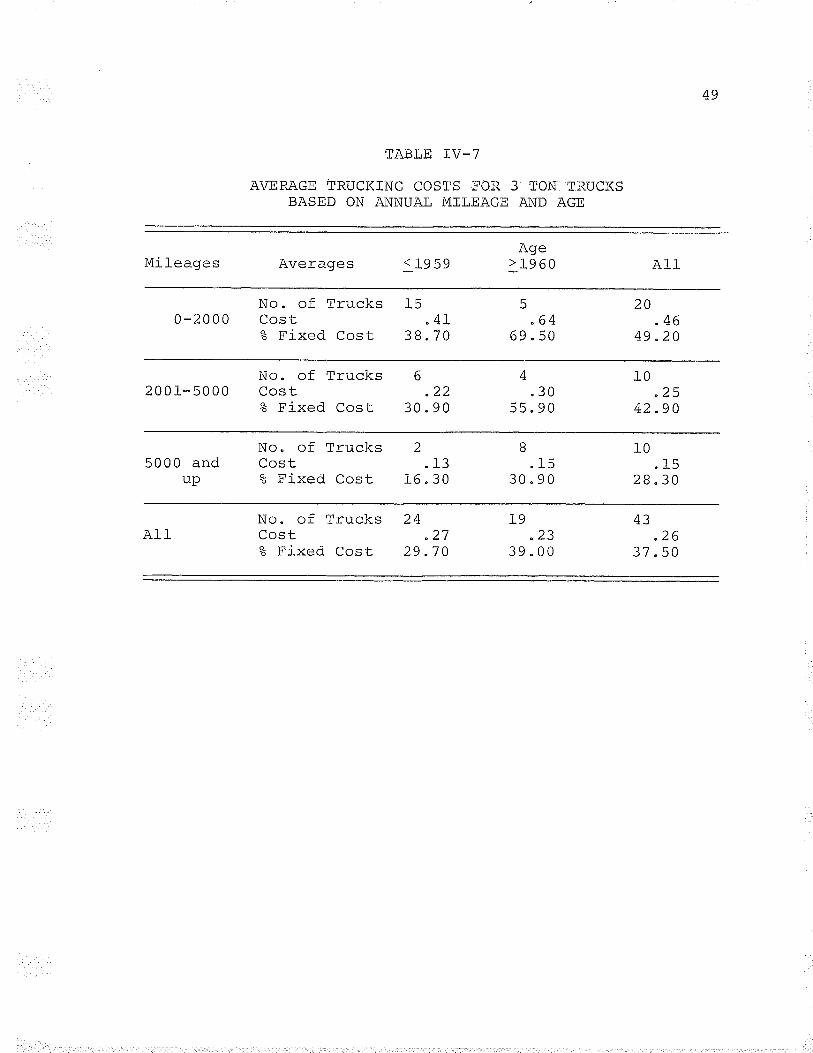
Thr,ee Ton Tr,u:cks." Table IV-7 shows the trucking costs
for three ton trucks lcased on truck age and annual mileage
and the portion of the total costs that are fixed costs. The
cost declined. for all three ton trucks as the annual míleaqe
increased. For each mileaqe group the average cost was less
for the oldest group than for the newest group of trucks.
The cost varied from 0"64 cents per bushel-mj-le for the L960
and newer trucks with an annual mileage of less than 2,00I
miles" The lower cost of 0.13 cents per bushel-mile, was found
to be for the L959 and ol-der trucks travelling more than 5,000
miles annually. The average cost for all three ton trucks
was 0 "26 cents per bushel-mile.
The percentage of the costs which were fixed declined
with both age and increased mileages on the trucks" The 1960
and newer trucks travelling less than 2,001 miles annually
had 69.5 percent of the cosL fixed, while the L959 and ol-der
trucks travelling more than 5,000 miles annually had 16"3 per-
cent of the costs in the fixed cosL category. The average
fixed costs for all three ton trucks was 37 "5 percent of the
total costs "
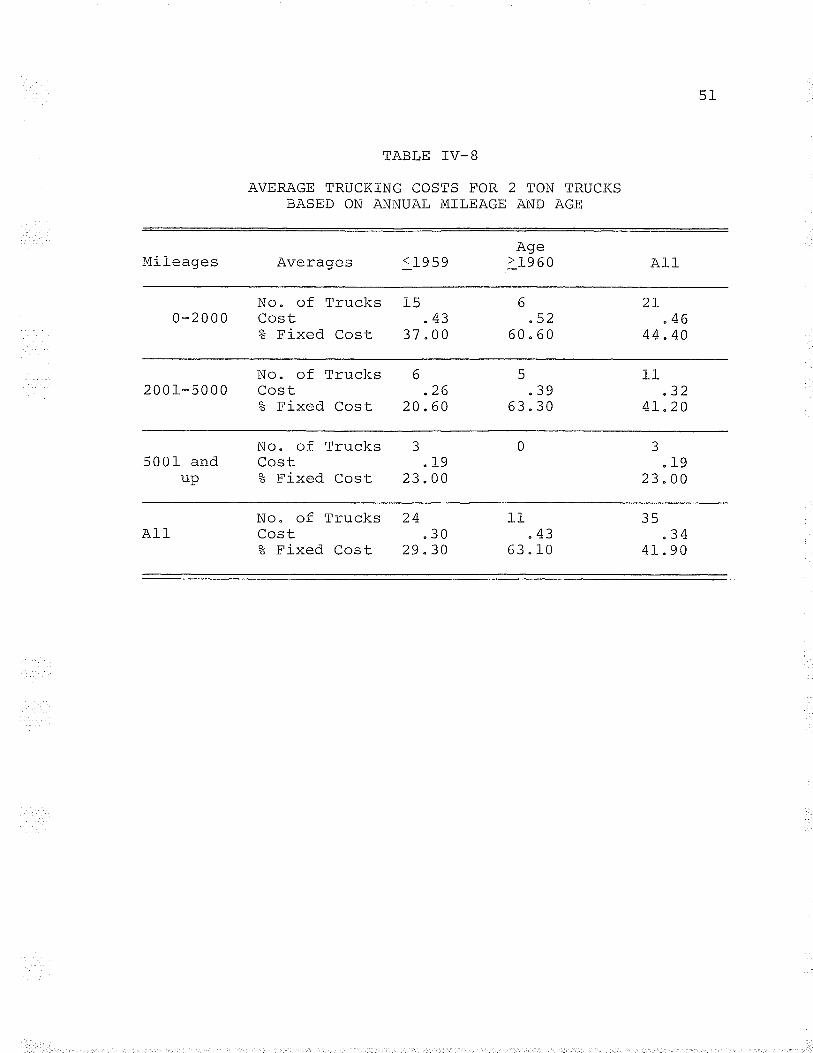
Two. Ton Trucks. Trucking costs for two ton trucks are
shown in Table IV-8" The same pattern of cosL relationships
existed with two ton trucks as with three ton trucks " As the
age or the annual mileage of the trucks increased the grain
hauling costs decreased" The higher cost was 0.52 cents per
AgeMileages Averages < 1959 >L960 All
TABLE TV_j
AVERAGE TRUCKING COSTS FOR 3 TON TRUCKSBASED ON ANNUAL MTLEAGE AND AgE
No " of Trucks 15 5 200-2000 Cost .4L " 64 " 46
3 Fixed Cost 38"70 69"50 49"20
No" of Trucks 6 4 102001-5000 Cost "22 " 30 "25? Fixed Cost 30.90 55.90 42 "90
No" of Trucks 2 B 105000 and Cost "13 "15 .l-5
up % Fixed Cost 16 " 30 30 " 90 28.30
No" of Trucks 24 L9 43Al-1 Cost " 27 " 23 .26
3 Fixed Cost 29 "7 0 39 " 00 37 " 50
AO=J
50
bushel-mile for the L960 and newer two ton trucks travellingl-ess than 2,001 miles per year" The lower cost was 0.19
cents per bushel-mil-e for the 1959 and older trucks travelli-ngin excess of 5,000 mil-es annually. The average cost for alltwo ton trucks was 0"34 cents per bushel--mil-e.
The same pattern was followed with the proportion ofthe total costs which were fixed, as with the transfer costs,
wÍth two exceptions" The 1960 and newer trucks traveltinq
between 2,001 and 5,000 miles had 63"3 percent of the costs
fixedi a percentage slightly higher than the same age group
with l-ess than 2t00L annua] miles" The 1959 and older truckstravelling between 2n001 and 5,000 mil_es annually had the
lower fixed cost ratio, 20"6 percent, slightly less than the
older trucks traverling in excess of 5,000 miles annuallv.
The average portion of total costs which were fixed, for all
two ton trucks, was 4I"9 percent.
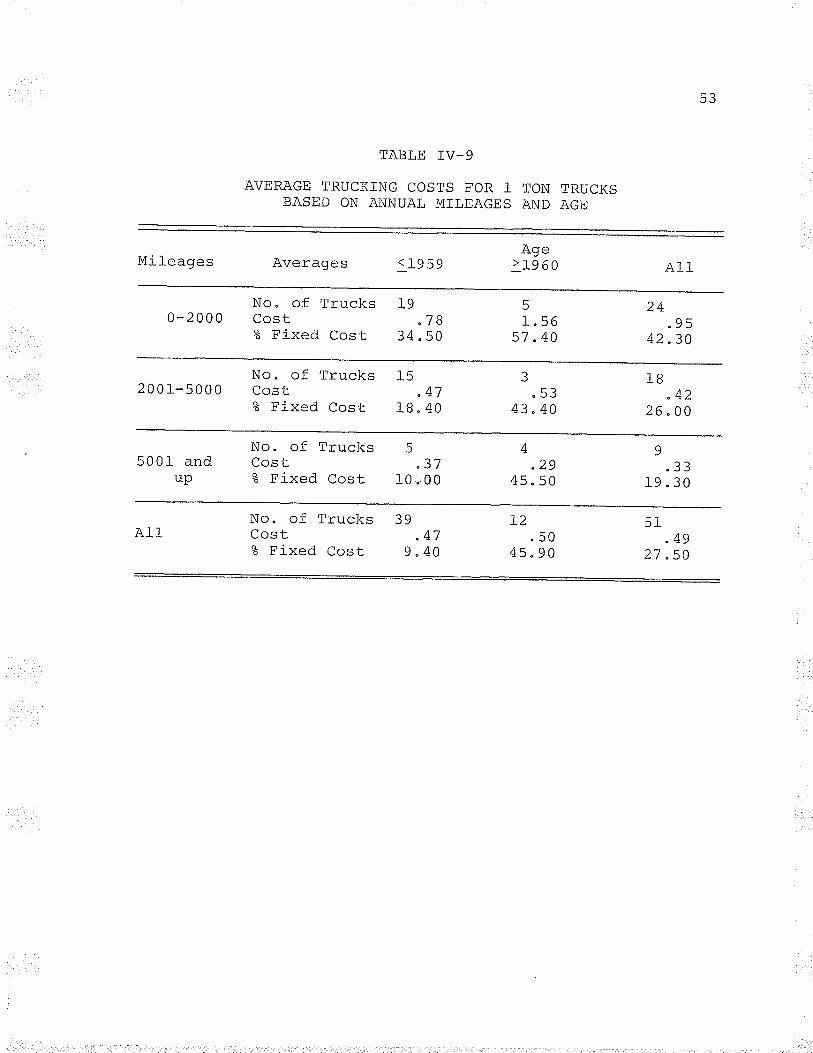
One Ton Trucks " Table IV-9 indicates that the general
trend in costs was the same as for the larger trucks. The
newer than 1960 one ton trucks travelling l-ess than 2 .OOI
miles annually had a grain transfer cost of I " 56 cents per
bushel-mile, while the same age group travelling more than
5,000 miles had a cost of 0"29 cents per bushel-mile. The
average cost for all 51 one ton trucks was 0 " 49 cents per
bushel-mil-e "
The proportion of the costs which were fixed varied
from 57"4 percent for the 1960 and newer trucks travelling
AgeMileages Averages <1959 >L960 All
AVERAGE TRUCKING COSTS FOR 2 TON TRUCKSBASED ON ANNUAL MILEAGE AND AGE
No" of Trucks 15 6 2I0-2000 Cost " 43 "52 " 46
å Fixed Cost 37 " 00 60.60 44 " 40
No" of Trucks 6 5 112001-5000 Cost .26 .39 "32å Fixed Cost 20 "60 63 " 30 4I"20
TABLE IV_B
No. of Trucks 3 0 35001 and Cost .19 " 19
up 3 Fixed Cost 23 "00 23 " 00
All_No" of Trucks 24 ILCost "30 "43? Fixed Cost 29 "30 63 " 10
51
35<4
41.90
52
less than 2 ,00L mil-es annual-l-y to 10. 0 percent for the l,g5g
and older trucks travel-ling in excess of 5,000 miles annually.
The average for all one ton trucks was 27 "5 percent.
Three-Quarter and One-Half Ton Trucks. Tabl-es IV-10
and rv-ll show the grain transfer costs and the portion of the
t.otal costs which were fixed, for the three-quarter and one-
half ton trucks " Because the number of trucks in these size
groupings was small some strata \^/ere vacant while those
supplying data have very limited numbers of trucks involved"
The average grain transfer costs for the three-quarter ton
trucks was 0.65 cents per bushel-mile whil-e the average cost
for the one-half ton trucks was 0.71 cents per bushel-mile"
In general, the costs decreased as both the age and the annual
mileages of the trucks increased"
The average percentage of the costs which !Íere fixed,
for the three-quarter ton Lrucks was 24"9 percent. The
corresponding percentage for the one-hal-f ton trucks was 22.4
r¡ercent "
All Trucks " The grain hauling costs and the portion
of the total costs which were fixed are qiven in Table IV-72.
When al-l trucks were considered ivithout regarding size, the
average grain transfer costs decreased as both age and annual
mileages of the trucl<s increased" The average grain transfer
cost was 0"34 cents per bushel--mile. The f960 and newer
trucks travelling less than 2t001 miles annually, had a grain
Mi I oenaq 7\rzar .'t ^É -O9"'rlrçqyçÐ Averages <1959 > 1960 All
TABLE TV-9
AVERAGE TRUCKTNG COSTS FOR 1 TON TRUCKSBASED ON ANNUAL MILEAGES ÄND AGE
No " of Trucks l_9 5 240-2000 Cost .78 1.56 .g5% Fixed Cost 34 " 50 57 " 40 42.30
No" of Trucks 15 3 IB200I- 5000 Cost " 47 " 53 " 42? Fixed Cost t_B " 40 43 . 40 26 " 0O
No" of Trucks 5 4 g5001 and Cost "37 "29 .33up ? FÍxed Cosr 10 " 0 0 45 " 50 t_9 .30
No" of Trucks 39 L2 5lAlt Cost " 4l " 50 .4g% Fixed Cost 9.40 45"90 27 "50
53
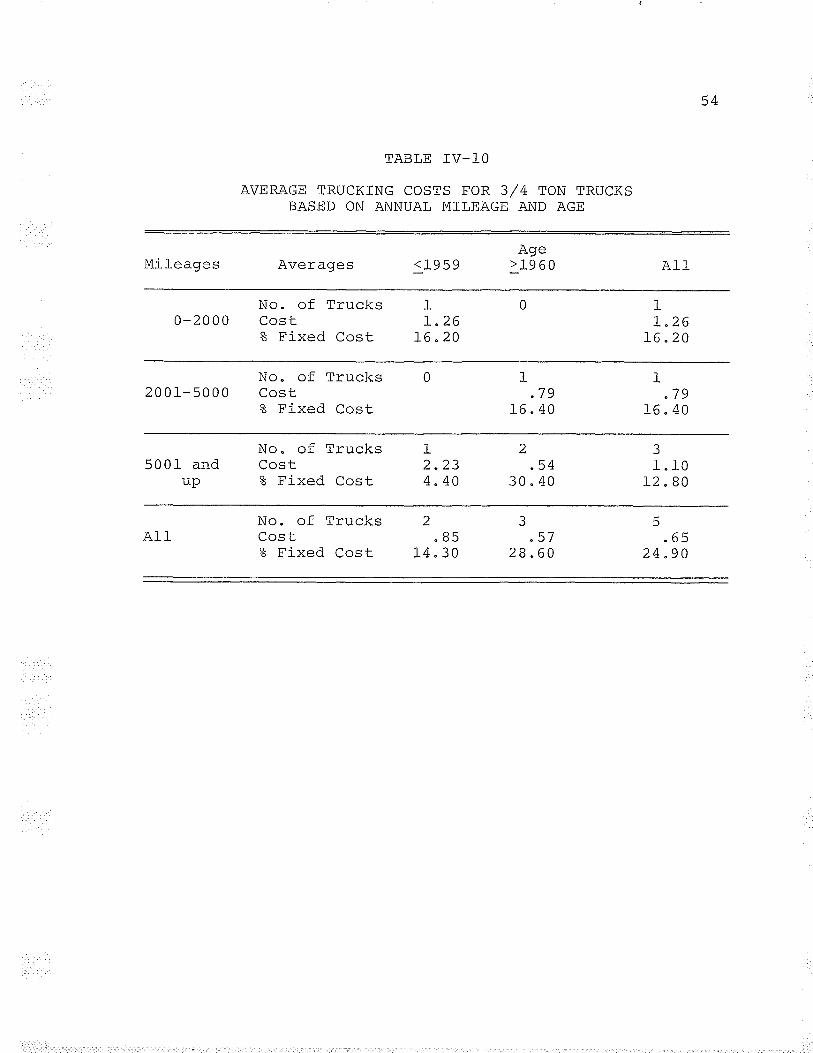
AgeMileages Averages <1959 > 1960 All
TABLE IV_10
AVERAGE TRUCKING COSTS EOR 3/4 TON TRUCKSBASED ON ANNUAL MILEAGE AND AGE
No" of Trucks I 0 I0-2000 Cost I.26 I"26
å Fixed Cost 16"20 16"20
No" of Trucks 0 1 I200I-5000 Cost "79 "79å Fixed Cost 16 " 40 16 " 40
No. of Trucks I 2 35001 and Cost 2.23 "54 1"10
up ? Fixed Cost 4"40 30.40 12"80
No" of Trucks 2 3 5Al-1 Cost "85 "57 "653 Fixed Cost 14"30 28.60 24 "90
54
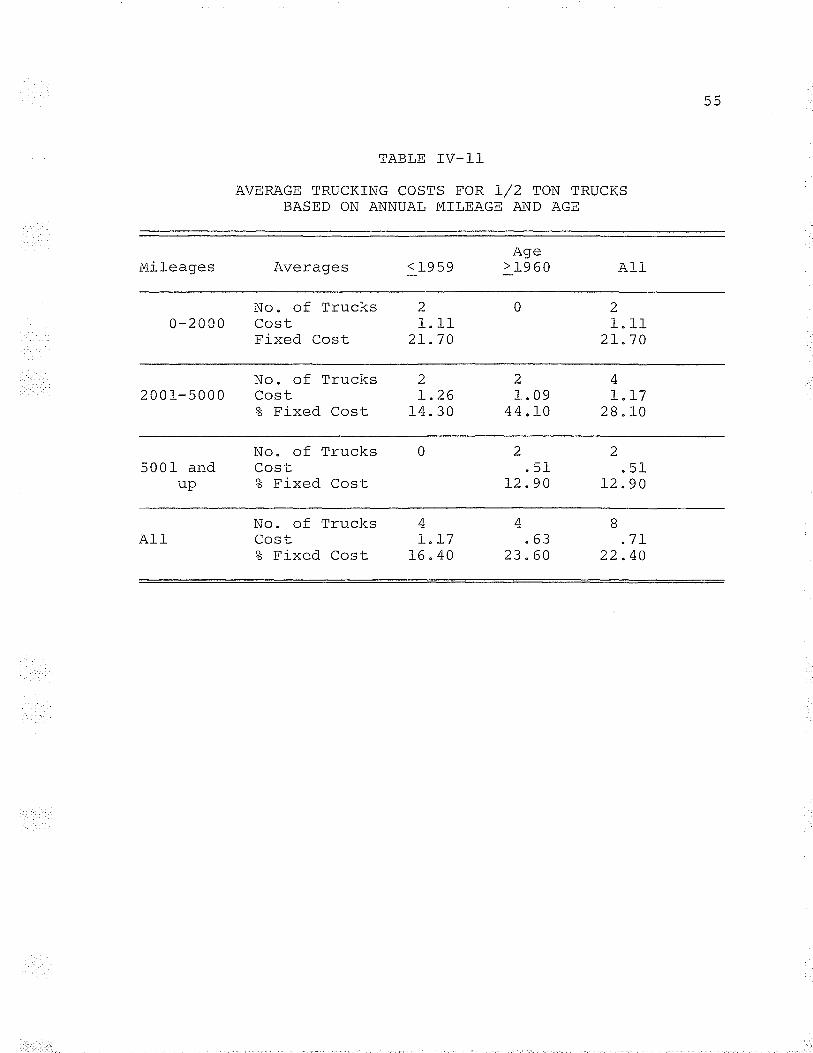
AgeMileaoes Ärzar:noq <1959 >l-960 A1l
AVERAGE TRUCKfNG COSTS FOR L/2 TON TRUCKSBASED ON ANNUAL MTLEAGE AND AGE
No" of Trucks 2 0 20-2000 Cost 1.11 1" 11
Fixed Cost 2I.70 21" 70
No" of Trucks 2 2 42001-5000 Cost L.26 I " 09 L "L7? Fixed Cost 14"30 44"10 28"10
TABLE IV-ll
No" of Trucks 0 2 25001 and Cost " 51 " 51
up ? Fixed Cost L2"90 L2"90
No" of Trucks 4 4 B
Atl Cost I"I7 "63 "7I? Fixed Cost 16 " 40 23 " 60 22 " 40
55
56
transfer cost. of 0"74 cents per bushel-mi-l-e. The 1960 and
ne\,ver trucks travelling more than 5,000 miles annually had a
grain transfer cost of 0.19 cents per bushel-mile, just 0"02
cents per bushel-mile l-ess than the 1959 and older trucks
with more than 5,000 annual miles"
The portion of the costs which was fixed decreased as
both the age and the annual mileage of the trucks increased"
The hiqher ratio was 63 " 5 r¡ercent for the newer Lrucks
travelling less than 2,001- miles, while the L959 and older
trucks travelling in excess of 5r000 miles had 14"3 percent
of the total costs as fixed costs " The averase for all L42
trucks was 34"8 percent.
The theoretical model, postulated in Chapter fI, was
fitted to both the raw, and the 1og, form, of the trucking cost)ldata. The resulting R- s were 0.30 and 0.84 respectively.
The côrresrlclndincr F-values of LL"27 and I43.77 were both
significant at the 5 percent l-evel-, with the 1og" form of the
d¡1-e lroincr r:ônsiderahlv thc more sionificant. The model- was
a better fit when the data were transformed, as it had the2greater R' and F-values. For the purpose of this stud.y the
following equation was utilized:
loq v = b + b. loq"X- + b^ log.X^ + b- log"X^ + b, l-oq"X,orl¿-¿5-5+-4
+ b- l_oq"X-5-f
REGRESSION ANALYSIS
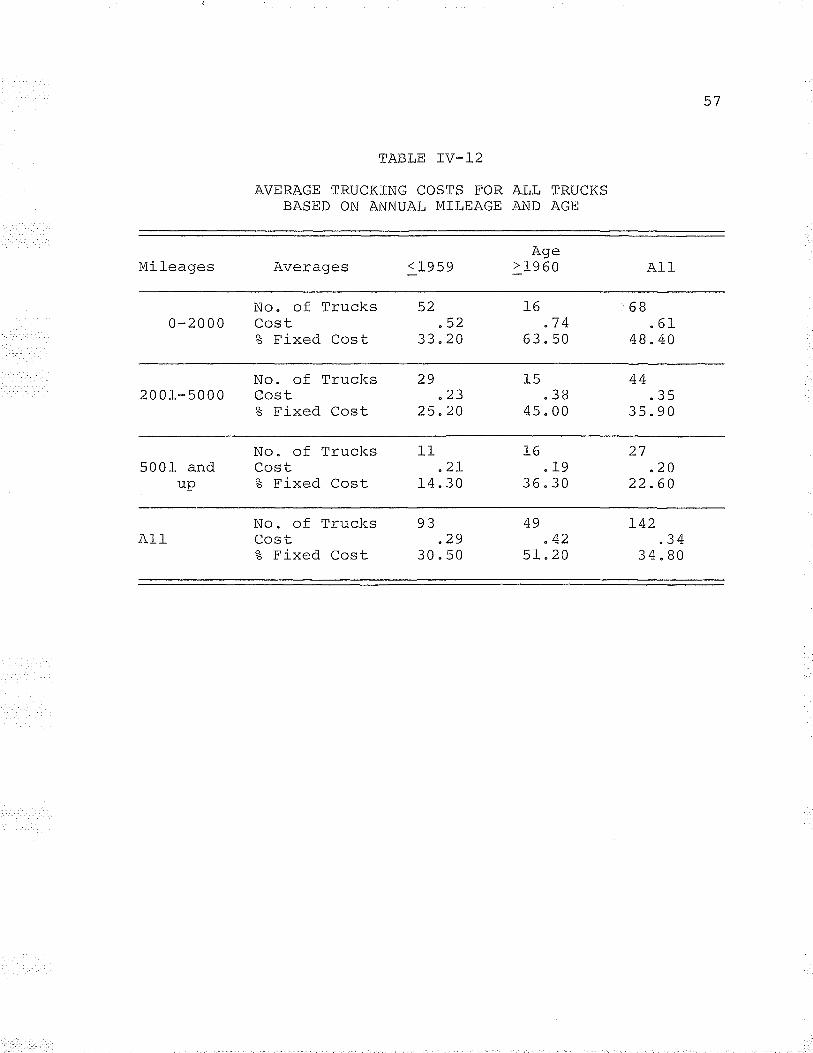
AgeMileaoes Ar¡eracres <1959 >1960 All
AVERAGE TRUCKING COSTS FOR ALL TRUCKSBASED ON ANNUAL MTLEAGE AND AGE
No" of Trucks 52 16 680-2000 Cost "52 .7 4 " 61
% Fixed Cost 33 "20 63 " 50 48 " 40
No" of Trucks 29 15 44200I-5000 Cost .23 ,3B " 35
% Fixed Cost 25"20 45"00 35"90
TABLE IV_L2
No" of Trucks 11 L6 275001 and Cost "2L " 19 "20up ? Fixed Cost L4 "30 36 . 30 22.60
No. of Trucks 9 3 49 L42All Cost "29 " 42 "34
% Fixed Cost 30.50 5L"20 34"80
57
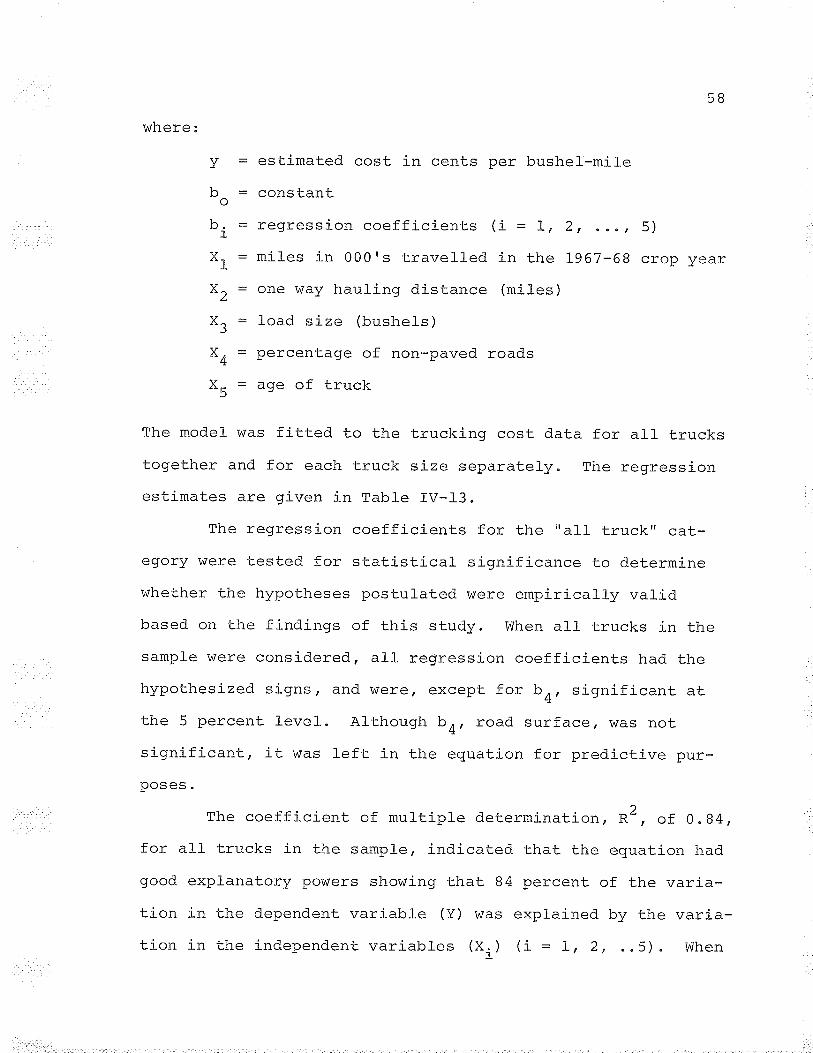
where:
y = estimated cost in cents per bushel-míl_e
bo = constant
b. = regression coefficients (i = 1, 2, .o., 5)
Xr = miles i-n 000's travetled in the 1967-68 crop year
Y,, = one way hauling distance (miles)
X¡ = load size (bushels)
X4 = percentage of non-paved roads
X5 = age of truck
The model was fitted to the trucking cost data for all trucks
together and for each truck si-ze separately. The regression
estimates are given in Tabte IV-l_3 "
The regression coefficients for the "all_ truck" cat-
egory were tested for statistical siqnificance to determine
whether the hypotheses postulated were empirically valid
based on the findings of this study" when all trucks in the
sample \^/ere considered, all regression coef f icients had the
hypothesized signs, and were, except for bn, significant at.l-l.¡a à narnan+- leVel" AlthOUgh b' fOad SUffaCe, WaS nOto nJ g¡¡L
significant, it was left in the equation for predictive pur-
U(J¡E¡ "
I
The coefficient of multiple determination, R", of 0.84,for all trucks in the sample, indicated that the equation had
good explanatory powers showing that 84 percent of the varia-
tion in the dependent variable (Y) was explained by the varia-
tion in the independent variables (X., ) (i = l-, 2, ".5) " When
5B
)lthe truck sizes were considered separately the R" s ranged
from 0"BB for the three ton trucks to 0.77 for the two ton
trucks "
For each size of truck the signs of all regression
coefficients were as hypothesized, \^/ith one exception" All
individual sizes of trucks showed a neqative coefficient for
road surface travelled on which was not paved. It was
hypothesízeð, that as the portion of non-paved roads increased
the cost of haulíng grain woul-d j-ncrease, not decrease" How-
a\7ar #1ra ranrgggig¡ COeffiCient fOr fOad SUffaCe WaS nOt, u¡¡e
statistically significant. Vüith the exception of trucks less
than one ton, all other regression coefficients were signif-
icant at the I percent level-" Thus, the empirical study
supported the hypotheses with respecL to annual mileage,
hauling distance, load size, and age of truck" fn the smaller
size group of trucks, the annual- mileage was significant at
the 1 percent level and the hauling distance was significant
at the 5 percent level; all other coefficients were insignif-
icant "
59
The magnitude of the regression coefficients for annual
mileage decreased as the size of the truck decreased. i^iith
the exception of the two ton trucks, the size of the coeffi-
cient for hauling distance increased as the size of truck
decreased" This may be a resuft of a higher dead-haul cost
per bushel load size as the truck size decreased " The coeffi-
cients for l-oad size lrere considerably larger for the one ton
trucks than for any other size" The age of truck was not
statistically significant in the case of trucks less than
one ton and was greater in magnitude for the one ton and
three ton than for the two ton trucks.In all- sizes of trucks one ton or larger, the regires-
sion coefficient was largest for load size with annual mile-
age rankíng second, hauling distance third, and truck age
fourth; the one exception was where age and hauling distance
ranked third and fourth respectivelv for three t.on trucks "
It may be observed that the average transfer costs d.ecreased
as distance and load size increased, although the rate of faIl.
was less for the former "
From the empirical analysis, the following conclusions
may be drawn with respect to the proposed hypotheses 2 Lo 6 "
2" The cost per bushel-mile decreases with increased
hauling distances "
3. The average cost per bushel-mile decreases as the
truck miles per period increase"
60
4. The average cost per bushel-mile decreases as the
size of the load increases "
5" The average cost per bushel-mile does not increase
as the portion of non-paved roads increases.
6 " The average cost per bushel-mile decreases as the
age of the truck increases "
ft was hypothesized that the average cost of transfer-
ring grain from the farm to the sal-es outlet in farmer owned
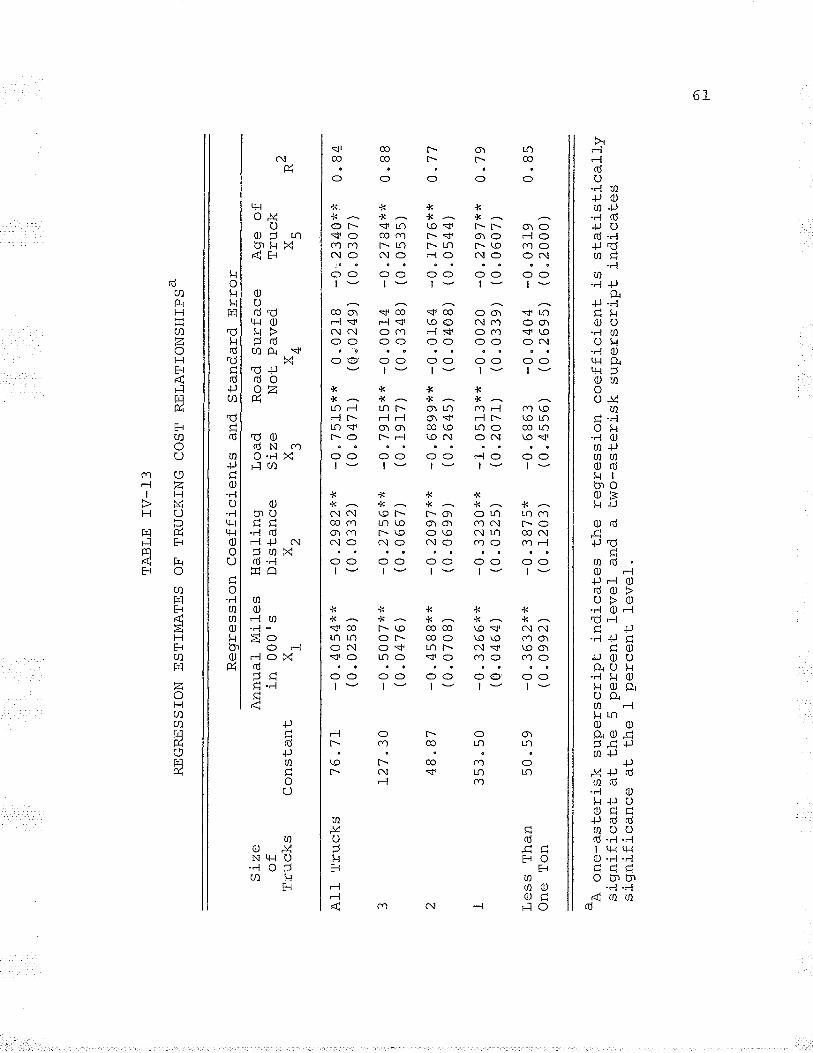
Stz
eof
Tru
cks
TA
BLE
IV-1
3
RE
GR
ES
SIO
N E
ST
IMA
TE
S O
F T
RU
CK
ING
CO
ST
RE
LAT
ION
SH
IPS
A
All
Tru
cks
L I !ËÞ
Ð
frfa
ltO
ne T
on
Ann
ual-
Mile
sin
00
0's
Con
stan
t X
r !
76"7
!
L27
"30
48 "
87
353.
50
50"5
9
Reg
ress
i-on
Coe
ffici
ents
an
d S
tand
ard
Err
or
(o -0 (o _U (o -n (0 _U (0
4054
x*.
02sB
)
5007
**04
76)
45B
B**
0708
)
J¿O
O^
^04
64)
3632
**09
92)
-A o
rl.-r
ster
isk
sign
ifica
nt
atsi
gnifi
canc
e at
Hau
ling
Load
Dis
tanc
e S
ize
X.
X.
¿3
-0 (0 -0 (o -0 (o -0 (0 -0 (o
29 8
2* x
0332
)
27 5
6x*
0667
)
2097
xx
0699
)
3230
**05
2s)
3875
*12
03)
supe
rscr
ipt
j-ndi
cate
s th
eth
e 5
perc
ent
leve
l an
d a
the
I pe
rcen
t le
vel"
Roa
d S
urfa
ceN
ot P
aved
A^ =
-U (o -U (o -0 (o -1 (o -0 (0
7 5l
-5* *
004
7r)
(0
79I5
x* -
0re
rT )
(0
6Bgg
** -
026
4s )
(0
0513
** -
020
7L)
(O
0 2l
B02
49)
0 01
403
48)
0L64
0408
)
0020
0339
)
Age
of
Tru
ck
.)^a
Ä-.
t(f
-0 (o -0 (0 -0 (o -0 (o
2340
** 0
" B
403
07)
2784
** 0
" B
B0s
3s)
r776
** 0
"77
0544
)
2797
x*.
0 "7
906
07)
6863
4s56
)
regr
essi
on c
oeffi
cien
t is
two-
aste
risk
supe
rscr
ipt
-0 (o04
04 -
026
95)
(00
319
2000
)
stat
istic
ally
indi
cate
s
0 "
85
F
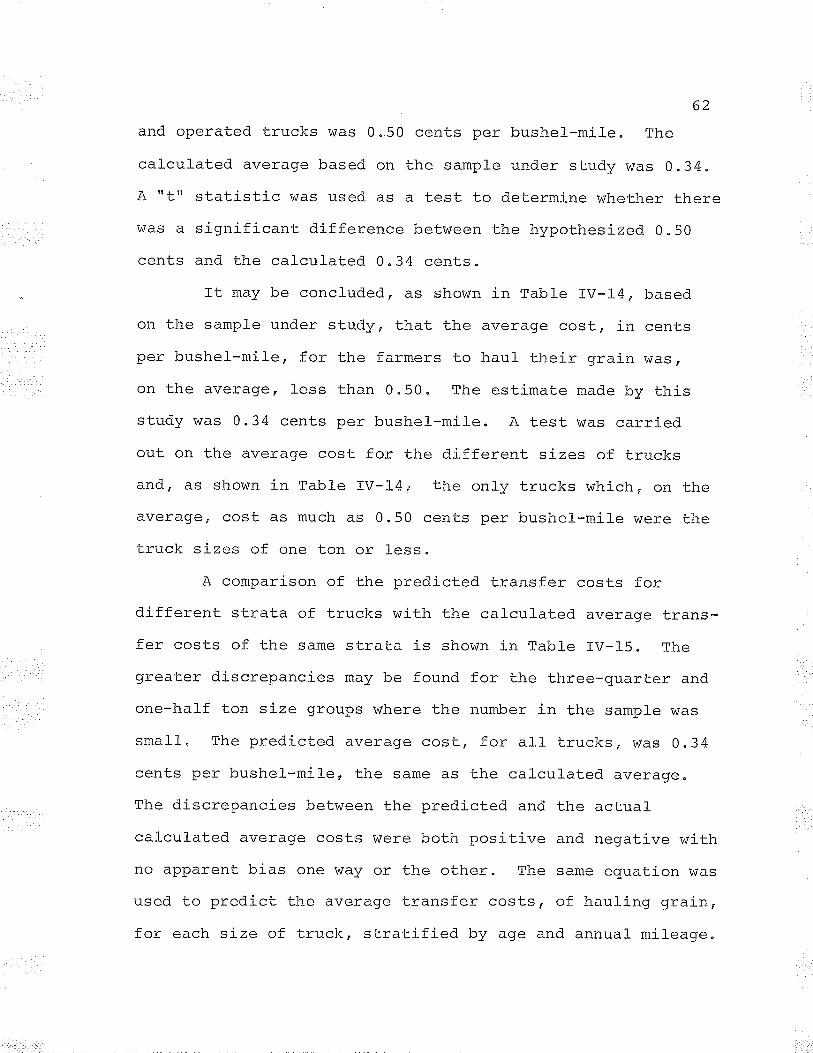
62
and operated trucks was 0.50 cents per bushel-mile. The
calculated average based on the sample under study was 0.34.
A rrtr¡ statistic v/as used as a test to determine whether there
was a signi-ficant difference between the hypothesized 0.50
cents and the calculated- 0"34 cents"
It may be concluded, as shown in Table IV-14, based
on the sample under study, that the average cost, in cents
per bushel-mil-e , for the f armers to haul- their grain was,
on the average, less than 0"50" The estimate made by thisstudy was 0"34 cents per bushel-mil-e. A test was carried
out on the average cost for the different sizes of trucks
and, as shown in Table rv-14, the onry trucks which¡ orr the
average, cost as much as 0.50 cents per bushel-mile were the
truck sizes of one ton or less.
A comparison of the predicted transfer costs for
different strata of trucks with the calcul-ated averaqe trans-
fer costs of the same strata is shown in Table IV-15. The
greater discrepancies may be found for the three-quarter and
one-half ton size groups where the number in the sample was
small" The predicted average cost, for al-l_ trucks, \^/as 0.34
cents per bushel-mile, the same as the calcul-ated average.
The discrepancies between the predicted and the actual
calculated average costs were both positive and negative \,rith
no apparent bias one way or the other" The same equation was
used to predict the average transfer costs, of hauling grain,
for each size of truck, stratified by age and annual mileage"
TEST OF DIFFERENCES BETWEEN AVERAGE TRANSFERCOSTS PER BUSHEL-MILE FOR DIFFBRENT SIZES
OF TRUCKS AND ONE-HALF CENT
Size Numberof of
Truck Trucks
A.L I.
â¿
<1
TABLE TV_L4
Mean Varianceof of
Sample Sample
13839355l-13
One tal_l_ed test
0.340 "260 "340"490"66
0"360 " 090"090 "29^
tr,A
srd "l-l arz
Size No " Actual-of in Average Cost
Truck Sample per Bu-rvlile
0 " 600"310.300.540.24
CalciltI
63
COMPARISON OF ACTUAL AND PREDICTEDTRANSFER COSTS FOR DIFFERENT SIZES
OF TRUCKS IN THE STUDY
All32I3/4r/2
Theor.t trr 5z
-3 " 10-4. a?-3"08-0 "20o ¿q
TABLE IV-15
L42
3551
5B
r"of¿.U¿¿"u52 "0L2"IB
m^ã+Ig-L
Þai a¡'l-pô- a^fr\vJ vv u
kôì ôñf
a ^^ôñf
7\ ¡a¡nl-ãvvçIJ u
0"340 .26
^ ¿.q
^ 11
PredictedAverage Costper Bu-Mile
0 "34^
)/l
0 " 3s0.500 "620"74
Discrepancy
0 " 00-0 "020.00
+0"01-0.03+0"03
The predicted and. the calculated costs may be found in
Appendix C, Table C-l-.
The major findings of this study have been outlined
previously in this chapter" They have confirmed Young's
conclusion that the size of the Lruck and the hauling dis-
Lance have significant effect on the average per bushel-míle
cost of hauling grain. However, the averagie cost was 0"34
cents as compared to the 0.50 cents per bushel-mile supported
by Young" This study was unable to conclude that the dead-
haul costs were the same regardless of the size of the truck,
as was assumed by Young" The additional average cosL to
transport a bushel of grain one mile as a resul-t of increased
hauling distances was 0.14 cents , or 0 " 16 cents lower than
the 0.30 cents predicted by Young"
COMPAR]SON OF RESULTS I^/ITH OTHER STUDfES
The regression coefficients o for the two cornmon var-
iables, used in the regression analysis were both of the same
sign, and were both significant at the 5 percent level" The
magnitude of the regression coefficients for the truck
capacity and the hauling distance were -A "7 0 and -0.16
64
respectively, in Young's analysisr âs compared to -0"76 and
-0.30 in Lhis study. The R2'= v/ere 0.46 and 0.84 respectively,
indicating that the variables added in this study were val--
uable in terms of explaining the components which determined
the f inal qrai-n transf er costs "
65
The difference, of 0.13 cents per bushel-mil_e, inaverage transfer costs, between the two studies arises intwo main areas; fuel costs, and repair and maintenance costs "
The fuel, and repair and maintenance costs, were 0.05, and
0"09, cents per bushel_-mil_er respectively, higher in theYoung study than in this study. part of the discrepancy inthe fuel cost may be accounted for by the change j-n policy,between the two survey periods, which now al]ows farm trucksto use tax free gasoline. No reason for the difference ínrepair and maintenance costs was evident, except that trucksmay not have been kept in the same state of repair because
of the economic conditions of the farm community during theL967-68 crop year"
Parallel to this study, Moore carried out a costanalysis on small commercial and custom truckers to determine
the cost of hauling grain from the farm to the sales outlet.The average costn pêr bushel-mile for these truckers was
calculated to be 0"29 cents per bushel--míl-e; compared to 0"34
cents per bushel-mile cost to farmers for farm owned and
operated trucks" The average cost for the three ton trucks,in the Moore study, was 0"26 cents per bushel-mile, the same
average cost as calculated for the farm trucks " Althouqh
the average costs were the same for the three Lon group oftrucks, the custom truckers carried 303 bushels with a one-
way haul of L9 "7 4 miles as compared to the farmers who hau-led
an average of 271- bushels 6"35 mil-es to the sales outlet"
In general,
similar to
lower than
the average costs determined
those determined by Moore, and
the costs presented by Young"
66
in this study \^/ere
both were somewhat
The main points of discussion in this chapter !^/ill
include a summary of the major findíngs of the study; implica-
tions of these findings to farmers, rail branchline abandon-
ment, and the elevator system; and suggestions for further
research "
SUMMARY AND GENERAL IMPLICATIONS
ECONOMIC IMPLTCATTONS AND CONCLUSIONS
CHAPTER V
In this section an attempt !^/i11 be made to draw some
general implications from the findings in this analysis. one
shoul-d realize the dangers of usi-ng an average aggregate cost
such as the average cost of hauling grain. Such a cost isbased on a large nurnber of trucks of differing sizes, hauring
distances o load sizes, ages, and annual mileages. The average
cost is a valid statistical figure but is not necessarily a
cost which is directly applicable to a specific trucker" There
may be no trucker whose cost is the average, but these resultsdo indicate the way in which certain factors (such as differentsizes) may influence these costs.
67
The average cost of hauling grain to Lhe sales outlet
in farmer orvned and operated farm trucks was estimated to be
0.34 cents per bushel-mil-e. This was significantly l-ess than
0.50 cents per bushel-mi1e" The estimated average cost, marginal
cost, of hauling an additi-onal bushel-mile was 0"L4 cents , or
1"40 cents to haul a bushel an additional 10 miles" This
6B
cost is based on the assumption of a constant average variablecost function over the relevant range and omitting the dead-
haul cost which becomes a fixed cost for a specific load and
does not change as the hauling distance changes. The impact
of hauling increased dist.ances above the average of 6 "27 miles
of the study appeared to be much reduced from both the averacre
of 0 " 50 cents normally used , or the average of o "34 cents
determined by the current analysis "
The average cost for loading-waiti-ng-unloading(dead-haul)
varied from 54"45 cents for the one-half ton trucks to 108"68
cents for the three ton trucks, with the average being BB "25
cents " one cannot assume an equal dead-haul cost per load.
for all sizes of Èrrrr.kq" .ather, the dead-haul cost per bushel
decreased as the load size increased. Since the d.ead-haul cosL
is fixed once the decision to make the journey is made, theâverâctê rlead-harr I r'nqì- nar l-rrrqha'l -mi
'l a, lvvÀ , varl-es rnverselv
with the hauling distance" The larger the load and the longer
the haul-ing distance, the lower was the dead-haul cost per
bushel-mi le "
The average speed travelled in hauling grain was 3lmiles per hour. There was no significant difference in aver-age speeds among the various sizes of trucks " As the haulinqdistance increased, it may be expected that more tarpaulinsare used and that the average speed may increase. Thís study
did not analyze the effect of speed on the cost of qrain
transportation "
69
The average housing cost f or trucks, that r^/ere housed,
was 0"01 cents per bushel-mile" This is a relatively small-
cost and may be considered. insígnificant in comparison with
the total haulinq costs "
As can be expected an increase in the cost of labor
will increase the average cost per bushel--mile. Labor costs
are significant in the trucking of grain, being 42 percent of
the total cost. Should the cost of labor be considered to be'l
near zero t- the average cost of grain transfer would be
considerably less than the costs estimated by this study.
Load size, annual mileages, truck ager and hauling
distance were found to have a si-qnificant effect on the aver-
age transfer cost of grain" As each of these variables
i-ncreases, the average transfer cosL per bushel-mil-e decreases.
Of Lhe four variables, load size, had the greater influenceaaa*^UII çUÐ L-.
This study showed that difference in road surfaces was
not a si-gnificant factor in determining transfer costs of
grain. Hov/ever, one would hypothesize that, for longer hauling
distances significantly greater portion of total- miles would
1o= long as the delivery pattern to the sales outlet issuch that the farmer may deliver his grain at his leisure orwhen he has no other task to perform there may be no cost leviedfor l-abor. Should the delivery system be such that time limitsare placed on the period within which the farmer may del-iver hisquota, delivery may be necessary at a time when the farmer is\zôr\z l-rrrcrz irnd.er theSe COnditiOnS the COS| fOf labOf maV beh'i oh irrhi r-h i n af Fa¡l: r^znrr1.ç] increase the c¡rai n hanl i ncr r':os.l- s -t r¿¡ u!!çvu, vvvu¿u f ¡¡v!uqÐç ç¡¡E Y!qf rf IIqU.|¡Y VVÐ LÐ o
70
be travelled on hard surfaced roads" Although the sample under
study found the road surface to be insignificant in determin-ing transfer costs, intuitively one would expect the transfercosL to be l-ess when the road surfaces were paved than when
the roads were not paved" Because the paved portion of theroads travel-led was relatively small, and because the haulincÌ
distances were relatively short the advantage of paved road.s
may not have been detected in this study.
The average fixed cost was 35 percent of the average
total cost for all trucks. The variation in the fixed costrati-o for three ton trucks ranged from 69 "s percent for thenewer than 1960 truck travelling less than 2,000 miles per year
to 16.3 percent for the trucks ol-der than 1959 travelling more
than 5r000 miles" The newer higher-valued trucks with low
mileages, because of the high averagie fixed costs, would nec-
essarily have a higher per bushel-mile cost as compared to a
low-valued truck used extensivefy" The average transfer costs
for the two extremes in the three ton trucks were 0.64 cents
per bushel mj-le for the 1960 and newer trucks travelling lessthan 2,000 miles annuallyo and 0"1-3 cents per bushel-mil_e forthe 1959 and older trucks travellj-ng more than 5,000 miles
annually" rn general, as the portion of fixed costs decreased
within a size stratification, the average transfer costs alsodecreased "
If the farmer had full equity in his truck and operatedit himself, the average cash outlayf \,{as 0.09 cents per bushel-
mile. with a cash outray as low as 0.09 cents per bushel-mi]e,
there might be a tend.ency f.or the farmer to reject
sible use of commercial trucking whose average cost
determined by Mooref was 0"29 cents per bushel-mile
ÏMPLICATIONS FOR FARMERS
When largie farm trucks were utilized extensively, with
annual miles greater than 51000, the average cost was 0.13
cents per bushel-mile" lt may, in fact, be cheaper for the
farmer to haul his grain a greater distance \,'/ith a large truck
than to haul his qrain a short distance wit h a smal1 truck.
For example, a farmer having to haul 5,000 bushels a distance
of 3.6 miles to the sales outlet in his 1963 one ton truck
which travels 4,000 miles annually would have transfer costs
of 0"53 cents per bushel-míle (Table IV-9)r or a total cost
of $90.40" To haul the same 5,000 bushels 6.83 miles in a
1953 three ton truck which Lravels 3,000 mil-es annual1y, the
transfer cost would be 0"22 cents per bushel-mil-e (Table IV-7)
the pos-
râS
77
for a total cost of S75"13"
Consideration must be given to other means of deliverínggrain to the sales outlet. The cost of hauling grain with a
1951 one ton truck travelling less than 2,000 miles was 0"78
cents per bushel-mil-e (Table IV-7). This would be 3"90 cents
to haul a bushel 5 míles. Custom truckers charge an average
2e .* Moore, op" cit
of 2.68 cents3 ao haul- grain
did not attempt to d.etermi-ne
truck ownership, although it
determining whether or not a
over the past few years, considerable discussion has
evolved concerning possible rail branch Line abandonment"
The findings of this study should aid in the determination ofthe expected j-ncreased grain hauling costs to farmers as aresult of branch line abandonment, by supplying costs of moving
grain by farm trucks. such costs are required in analyzingthe economic effect of branch line abandonment, on both theproducer, and the rail company.
since the average grain hauling costs per bushel are
inversely related to the size of the truck (tables rv-7 torv-l-l) the farmers, by the use of large trucks, are able tohaul their grain greater distances with little or no increasein the total grain hauling costs. rt was suggested, earl_ierin *hiq ¡lr¡n{-ar .t-i.r¡+ +l^^ ^^^L ^c 1^---1i-,lrr LrrfÐ urrcryLcr, r.riaE. Ene average cost of hauling gral_n an
additional 10 miles was 1 " 40 cents per bushel. This beingthe case, the economic hardships which the farmers would suffer,as a result of haulíng grain greater distances to the sal_es
outlet, flây not be as great as previously expected. The
IMPLICATIONS FOR BRANCH LINE ABANDONMEJ\TT
72
that same distance" This analvsis
the vaLue of independence in
may be an important factor in
truck should be owned.
3c.*..tuoore, oP. cit.
aband.onment
an increase
73
uneconomical branch lines frây, in fact, preventç-^.i ^L{- r+t^^!!ç¿9rIL IqLEÞo
of
in
The present grain handling system in the Vüest is char-
acterized by a profusion of smal-l elevators l-ocated on closely-
spaced railway l-ines. The system, with elevaùors spaced every
6 to B mi-les was based on the abilitv of the farmer to deliver
his grain with the horse and wagon" with increasing costs of
maintenance, repairs, and labor, many of the old elevators
may not be replaced" The elevator companies wil_l have to take
a close look at their role in the grain índustry"
Assuming the additional cost of hauling grain is 1.40
cents for 10 miles, the elevator companies must determine
whether the additional service given and the reduced costs of
operating fewer elevators is greater than the additional cost
to the farmers. The savings in elevator and railway costs
plus increased services offered may justify, economically, the
increased hauling distances, by producers, if the savings are- -^õ^,f l-^ {.l-¡o nrnrlìlñâr}JaÞ Þ EL¿ (JlI L(J urrç lJ! vuuuç! .
SUGGESTIONS FOR FURTHER RESEARCH
IMPLICATTONS FOR ELEVATOR COMPANTES
1. To determine the most efficient means of qrain
movement, research is required to derive a model which would
combine the cost structure of farm trucks, sma1l commercial
trucl<s o large commercial trucking operations, and the rail
74
system to determine the extent to which each may be utilized
most efficiently over varying distances "
2. Research is required to determine the optimum size
of elevators required to satisfy the demand for grain handling
facilities in conjunction with the ability and requirement,s
of the railway Lo handle the grain movement" When this is
known, research will be required to put all factors together
to determine the optimum elevator locations and the most
efficient means of transporting the grain t,o these points "
3. Research is required to determine the optimum
grain storage locations to meet sales obligations and to pro-
mote trad.e" Consideration must be given t,o storing grain in
foreign countries, d.omestic inland terminals, the role of
the counLry elevators in storage, and the possibility of
increased on-farm storaqe"
BIBLÏOGRAPHY
1. Currie, A.W" Canadian Transportation Economics. Toronto:
1 ñ-'^ T ñ T.+^--^r-: ^!^ Economics Analysis " Homewood:¿ " lJ Lr.g , u . -c . r.Ll Ler rtteLt-L d. LeRichard D" Irwin, L956"
? tr'nr.¡l¡a \7 C" Canadian Agricultural Policy The Historicalt v ôL
Pattern, toronto :---Ee-fñfverslEy of-Toronto pres sl--ï9ZE-"
University of Toronto Press , L967 "
BIBLIOGRAPHY
BOOKS
4" Hoover, E.M" The Location of Economic Activity. New York:McGraw-Hi 11 eoõk-cõ ";-TíAE
5" Hopkins, J"A. and E.O" Heady. Farm Records and Agcounting,Fifth Edition. Ames: Iowa State University Press, 1962"
6" Kohl-s, R.L. Marketing of Agricultural Products, SecondEdition" New-TõEE: the ¡,iãcmÏTfan Col ,-Ag6L.
7" Spurr, W.A. and C"P. Bonini. Statistical Analysis forBusiness Decisions. Homewood:- Rîcñãrã D" IT\,rÏn, L967 "
B" Vlilson, G"W. Essays on Some Unsettl-ed Questis¡ns in theEconomics of Transportation" Bl-oominclton: Foundationfor gconomlãs-ãnã-ilusTness-Studies, tÃdiana University,Indiana Business Report No" XLII, L962"
PERTODTCALS AND JOURNALS
75
1" Borts, G"H. "The Estimation of Rail Cost Functions,"Econometrica, Volume XXVIII, Number l, (January,19601, pp" l0B-131"
2. . "Increasing Returns in the Railway Industryr"Journal of Political Economy, Volume LXII , (L954) ,ppl--T6- ¡3¡ .
3" Edwards, F"K. "Cost Analysis in Transportation," AmericanEconomic Review, Volume XXXVII, Number II, (may,-l5T7) ,ÞÞ "--ZZT:46T "
4" Meyer, J"R. "Some Methodological Aspects of StatisticalCosting As lll-ustrated by the Determination of RailPassenger Costsr" American Economic Review, VolumeXLVIII, Number II, (May, 1958), pp" 209-222"
76
5. Roberts, M.J. "Some Aspects of Motor Carrier Costs: FirmSize, Efficiency, and Financial Healthr" LandEconomics, Volume XXXV, Number 3, (August;-T956) ,pp "--îTeata "
6" Cnl-rrì ôhôr T rrPfOblem:rv¿¡e! t u ô
The Financial Post,
t. Casavant, K"L" and D.C" Nelson. An Economic Analvsis ofthe Cost of Operating grain rrucEÏãg-Fî?ms-Tn nortil-.....................---
-
Dakota, Fargo: Department of Agricultural Economics,w-orEil¡akota State Universityo Ágricultural EconomicReport No" 54, July, 7969"
2" custom Rates Per Acre in the province of saskatchewan As
-
Shown by Mait Questionnaire Survey rfriouqñ-Wheat poofi,oõãÏs_, Sãslãtryñt-ãF-r'ann I'lanagement,unÏÇersity of Saskatchewan and Dominion ncoñomicsijivisioni (no detail-s) "
PUBLISHED REPORTS
Grain Elevators Vüithout Tracks, "(December 5, 1964)
"
3" Furniss, I.F. Cost Accountinq forr I lus tration,s taEïõns-5lVisîõñ,Agriculture, February, L968"
À Ground.water, R"A" and G"R" tr{inter. Cost Components inGrain Assembly, Vancouver: oepartmenE-õFAgrTEuîEuralEconomÏEs ,- Uni-versitv of Sritièh Colrml'rì e - ,rrr I rz L969 .vv!urlw!q, uvLy Í _
Johnson, L.M" Changes in Farm Organization_;Somerset-Manitou @ñfpeg: ¡anada oepartmentof Agriculture, Economics Division, 1964"
q
6. Report of the Royal- Commission onOue""'s prÏnteF ãnã Contro-l-ler1qÊ.'I
7" Tyrchniewicz, E"W. and Om P Trnari r:-ain Transportationin Canada:ResêaIõf,Center forManitoba o
R
Agriculture, Part
Young, K"B. _An ênalysis gg IÞg Cgst of Assembling Grainby Farm Trucks in Mani-toba, winnipeg;--Tepa¡EmeñE-õfaJrîõuTtural econoffis*ãñã' Farm iuãnågement, universityof Manitoba, Research Report Number II, October, L966"
Canada Department
Some Critical- rssues añð rmpffi.-[uccas]-onaf Yaper Nunþer Z) t Winnipeg:Transportation Studies, University of
August, 1968 "
r,of
Transportation, Volume I,of Stationary, March,
i. Grain Transportaties añã- rmpTfEatîons-TõmbeF Z) ;--fì;;i r'ê;,-
fmplications for----+F_--
77
9" Zasada, D, and Om P" Tangri" An Analysis of FactorsAffecting the Cost of Handling aq{ Sloqing Grain in¡,rffi-corintrv n revaEõrEl- wïnñpeg r Department oregr:icultuTãÏ econõmIcs anã Farm Management, Universityof Manitoba, Research Report No" 13, JuIy, L967"
OTHER SOURCES
t" Hodge, G. Grains, Trains, and Towns" Presented Lo theFourth Añnual Canadian Transportation Research Forum'Vancouver, May, 1968"
Lagace, B"G. Some, Implications of Rail Branch LineAbandonment for Location and Capacity of CountryËfêvãEõIE-Tn v¡esEêrã cana¿a. -unÞuETlsñea ¡'i" sc.TñesTs, LTnFersîty of-EãñTEoba, WJ-nnipeg, March, 1963"
Moore, G"ld. "Cost Analysis of Assembling Grain byCommercial Trucks." M"Sc" Thesis in process, Univer-sity of Manitoba, Winnipeg, L970.
¿"
4" f,(l-Oroan, -E; "u"Po¡aì n'l-qñL;;.=-IllËÞIÐ ¡L965 "
Spatial Competition and Division of GrainBetween Country Eler¡ators" Unpublished M"Sc.
unîversTty-õE- Mänfto6ãl- wTnnipeg, February,
V XfCNSddV
Within the past four decades the motor carriers have
become strong competitors with the railways. With the dense
network of rail lines, the railway companies finding thatmany branch l-ines are uneconomical, are becoming more reluc-tant to mai-ntain these lines bv internal cross-subsidization.f
Along with rail rationalization, many elevators situated
beside the rem¡inincr 'l inaq may disappear" In light of the
grain industry rationalization, attempts have been, and are
being, made to quantify the effects on the farmers, elevator
companies, railways, and local communities " The predicted
magnitude of the effects will vary depending on the cost
figures used in calculating the additional- cost to producers
whose delivery points will be farther from the farm. ft was
found by a Saskatchewan study that:
APPENDIX A
LITERATURE REVÏEI/ü
7B
ff current applications for abandonment in Saskatchewanbecomes ef f ective, many f armers \,úil-l- have to trucktheir wheat on the average of eighteen miles toelevators, compared to six miles now" It is estimatedthat the average age of farm trucks in Saskatchewan istwelve vears and the averaqe size is around one ton.
1" ,ara"tr,.-subsidization ofrealize a profit
I cross-subsidization" may be defined as thean uneconomical line bv those lines which
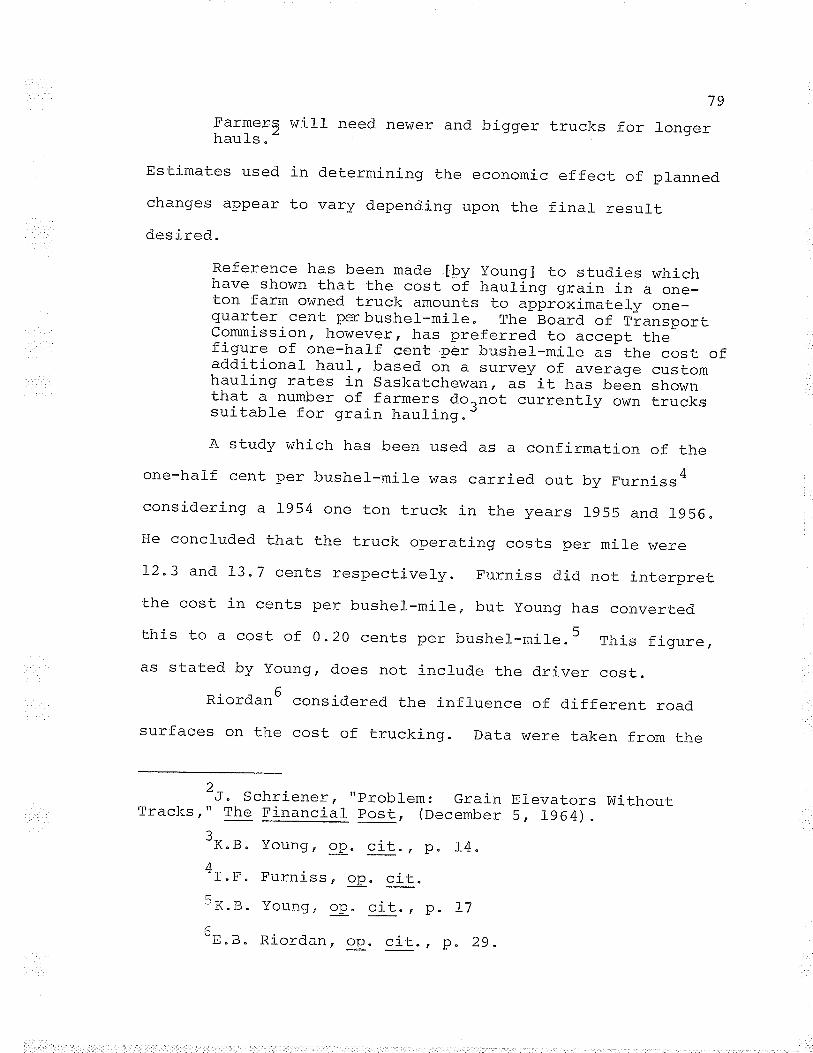
79
FarmerS will need nevrer and bigger trucks for longernaul-s.
Estimates used in determining the economic effect of planned.
changes appear to vary depending upon the finar_ resur_t
desi-red,
Reference has been made fby young] to studies whichhave shown that the cost of hauling grain in a one-ton farm owned truck amounts to appróximately one-quarter cent penbushel-mil_e" The Board of tiansportcommission, however, has preferred to accept thefigure of one-half cenù pèr bushel-mil_e as the cost ofadditional haur-, based on a survey of average customhaulíng rates in saskatcheivan" âs it has beén shownthat a number of farmers do.not currently own truckssuitabl_e for grain hauling.,A study which has been used as a confirmation of the
one-half cent per busher--mile was carried out by Furniss4considering a 1954 one ton truck in the years 1955 and 1956.He concluded that the truck operating costs per mil_e were
r2"3 and 73"7 cents respectively. Furniss did not interpretthe cost in cents per bushel-mile, but young has convertedthis to a cost of o.2o cents per bushel-mil-e"5 This figure,as stated by Young, does not incl-ude the driver cost.
Riordan6 considered the influence of different roadsurfaces on the cost of trucking. Data were taken from the
Tracks,--rI
" Schriener, "problem: GrainThe Financial post, (December
3_-K"B. Young, op. cit", p" 14.4-
L. " -t'" .b'urnl_ss , op. cit "
5 x. g. Young, * " n¡- o. 17
o*¡j".ts " Rl_ordan, op " cit. , p. 29
Elevators Without5, 1964)
"
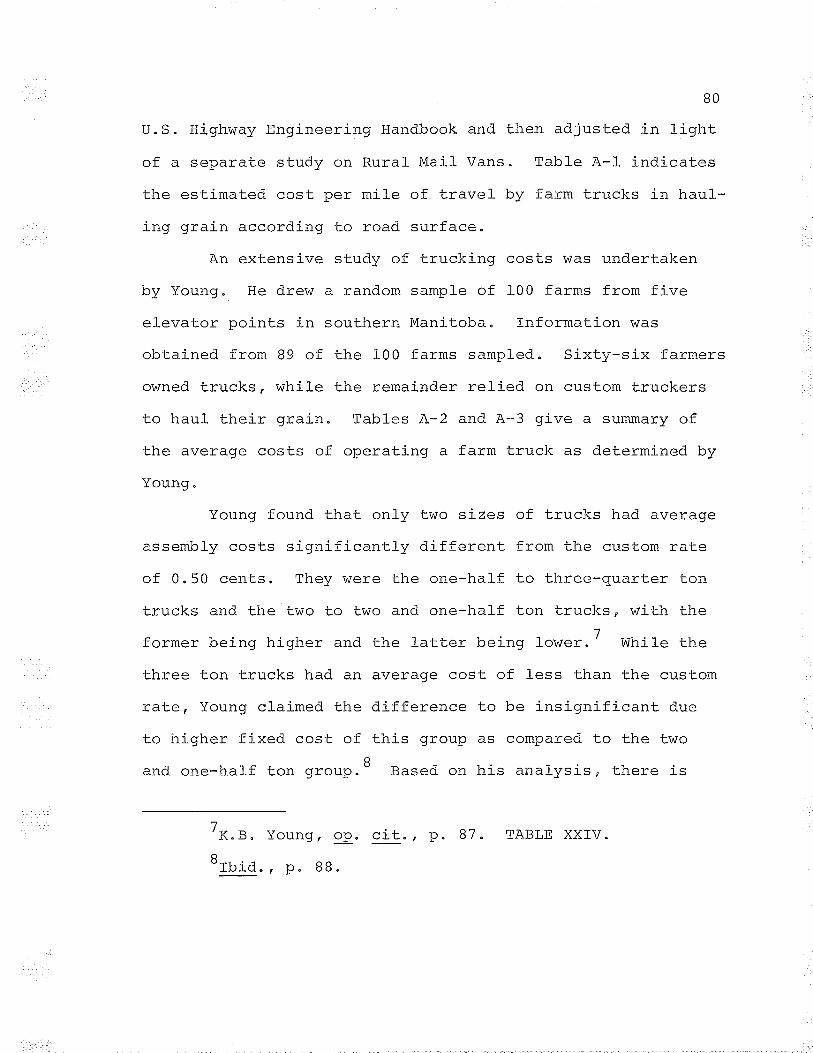
BO
U"S. IÍighway Engineering Flandbook and then adjusted in light
of a separate study on Rural- Mail Vans " Table A-1 indicates
the estimated cost per mile of travel by farm trucks in haul-
ing grain according to road surface"
An extensive study of trucking costs was undertaken
trw Yorrncr- He drew a random s¡mn]e of 100 farms from five
elevator points in southern Mani-toba. Information was
obtained from 89 of the 100 farms sampled " Sixty-six farmers
owned trucks, while the remainder relied. on custom truckers
to haul their grain" Tables A-2 and A-3 give a suÍrmary of
the average costs of operating a farm truck as determined by
Young "
Young found that only two sizes of trucks had averagie
assembly costs significantly different from the custom rate
of 0"50 cents" They were the one-hal-f to three-quarter ton
trucks and the two to two and one-half ton trucks, with the'7
former being higher and the latter being lower"' While the
three ton trucks had an average cost of less than the custom
rate, Young claimed the difference to be insignificant due
to higher fixed cost of this group as compared to the two
and one-half ton sroup.S
'K.8. Young, op. cit., p. 87 "
Brbid., p. BB.
Based on his analysis, there is
TABLE XXIV"
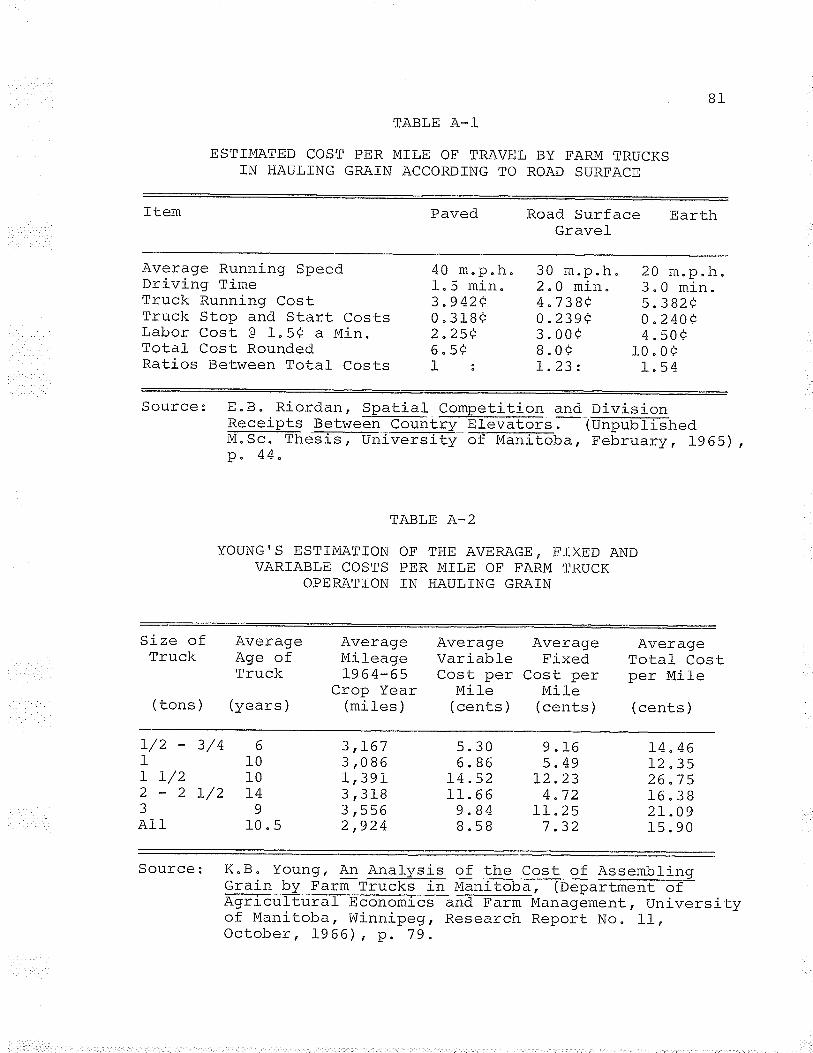
Item
ESTIMATED COST PER MILE OF TRAVEL BY FARM TRUCKSIN HAULING GRA]N ACCORDING TO ROAD SURFACE
Average Running Speedurl-vl_nq 'l'l-meTruck ñ.unning CostTruck Stop and Start CostsLabor Cost e 1.5Ê a Min.Total Cost RoundedRatios Between Total Costs
TABLE A-1
Source: E"B" Riordan, Spatial Competition and Divisi_onpsgsi pts Betweeñ-TõFntrt- Eïãvators . (úñpuETïãrrea-
À^I-l-l-ru;lìM:sc. rrre:i.r-s, rnrvãiETÇ õE-rviãnîEõra, FeËruary, 1965)p" 44.
Paved
40 m"p"h.1" 5 min"3"942ë0"318e2"2së6"5Ç1:
Road Surface EarthGravel
YOUNG!S ESTIMATION OF THE AVERAGE, FIXED ANDVARIABLE COSTS PER MTLE OF FARM TRUCK
OPERATION IN HAULING GRAIN
Size of AverageTrucl< Age of
Truck
(tons ) (years )
30 m"p"h"2.0 min"4 "7 38ë0 "239ë3 " 00+8"0ë1.23:
B1
r/21r L/22-23All
20 m"p"h"3"0 min"5 " 382+0 "240ë4"s0+
10.0+L"54
TABLE A-2
3/4 61010
L/2 L49;^l_u"5
Average Average Averagie AverageMileage Variable Fixed Total CostL964-65 Cost per Cost per per Mile
Source:
Crop Year lrrile(miles )
3,1673,086'l ?o1LTJJL
3,5562,924
K"B" Young, An Analysis of the Cost of A.qaml-rlinnet"i" ny qg.*-rffi M""ltgbg;-TDæ"ffiAgElêu1Eutãf Eõõñõmîcs añã r'anrL r'ianagèment, Universityof Manitoba, Winnipeg, Research Report No" fl,October , L966) , p" 79 "
(cents) (cents) (cents)
5"306. 86
l-4"s211"66
9 "84B"5B
Mile
q tÁ5"49
L2"234 "72
IL "257 .32
14"4612.3526"7516.382L "09'l q on
Size of AverageTruck Bu" -Mile
YOU}TG¡S ESTTMATION OF AVERAGE ASSEMBLYCOST PER BUSHEL_MILE
r/2 3/4Ir r/22-2L/23All
't_AiJL-t; là'-J
Variable Fixed Dead-Haull-nq'l- nôr l-nq-l- l-nqf nôr
Bu. -IvIile per Bu " -MileBu" -Mile
LI ,27 L23,95422 ,7 6r31,65027 ,77724,020
Q nrr r¡a "
" 1660'l oo/
" 3110" L232"L29L"L876
K.B. Young, å1. AnalysisGrain bv Farm Trucks inAqricultural Economicsoi ¡,lanitoba, winnipeg,October, 1966), p" 83.
.3236
.0938" L47I"0685" 1331" 1153
ö¿
laþor I'otarf-nq l- nar f-nc I narvvu e t/v!
Bu " -tYil-e Bu " -Mile
" 0926.1043.031_4" 0325"0362" 0553
of the Cost of Assemblino:;- ---:- ,
--l
^-Manitoba, (Department ofanA ¡'arm rrnanagement, UniversityResearch Report No. 11,
" 2L27" L459"0851.07 42
"0674" IL29
" 5167"5747"2984" 3658"47L3
B3
evidence to believe that the average cost of hauling farm
grain decreases as the size of the truck increases and as
the hauling distance increases. The regression coefficientsindicate that the load size is a more significant variablein reducing average costs than is the hauling distance.
The model used by young to test the hypotheses was ofthe cobb Douglas form. The same equation was used as a
predictive model- in estimating the average cost of haulinqgrain, given speci-fic values for the independent variabl_es.
There was no indication that any variables other than sizeaF F-v¡¡a'l- ^-.¡ 1^-,,1 .:
-^. ^1 .: -r --, - -a i-7i rt^ rrñ\Jr LrLr.-rs., crrrLr hauling distance \^/ere used" i^Iith an rrRzrr of0 " 46, one would expect that other variables such as aqe oftruck, road surface, and total annual mileage may be impor-
tant" ft shourd be not.ed that the predictions are estimated
averages based on the sample under study and may not be val_id
if the relatj-onship among the variabl-es changes or cosrs
change.
A more recent study o anal-yzing the cost components ingrain assembly in a sample region in the peace River District^ç 1-l 1^^-! l---r-1---- 1, ^ur frrrre¿ Ecr, was undertaken by Groundwater and trr7inter . ' one
of the aspects of the study was the cost of del-ivering grainfrom the farm storagie bin to the el-evator. The model chosen
for the analysis was taken from the young study.
'R.A.. Groundwater andGrain Assembly, (Vancouver:Economlcs;-TEã Universitv of
G.R" Winter, Cost Components in--'--ueparcmenE or Agrl_cult.uralBritish Columbia, JuJ-y, 1g69) "
B4
Casavant and Nelson8 carried out a study in North
Dakota in which they analyzed the cosL of haul_ing grain by
large trucks over long distances " The trucks were mainly ofthe tractor and trailer type used in hauling the grain to the
seaboard desLinations. It was noted that there lr/ere economíes
of scale available to about 450,000 miles annually. compar-
isons were made between the use of gasoline and diesel trucks
as wel-l a comparison between new and used equipment" rt was
found that there was excess capacity in the industry whj-ch
may be contributed to the trades areas. of specific concern
to the truckers was the tack of a back-hrul-.9 rt is evident
that the problem of a back-haul exists with the long haulers
as well as with the short hauls from the farm to the sales
outlet. rf that problem could be overcome, the average truck-ing costs could be reduced signifícantly"
B_, _K.L" Casavant and D.C" Nelson, An Economic Analysis3L +g cgets of operatins Grain rrgckins rFms Elõim-Dakota, (Fargo: Department of Agricultural_ Economics, Agricul-tural Experiment station, North Dakota state university, L967) "
o-e "back-haul" may be defined as â nã\/-loari ôn thereturn trip.
S XTCNEððV
VÍhen faced with the task of determininq the cost of
hauling grain by farm truci<s on the prairies, it was evident
that limited resources and time prevented a complete analysÍs
of each and every truck. With given constraints it was
necessary to estimate the desired costs by analyzing a sample
drawn from a population representative of the prairies " For
the purpose of this study the geographical location chosen
ran from just east of Winnipeg on the East; to Whitewoodn
Saskatchewan o?'ì J-lra TnÏact-" Carman on the Southi and the Ridinq
Mountains and Rorketon on the tqorth " I
The area represents the majority of the various condi-
tions which may be found in the grain-growing area of the
prairies. The types of farms vary from large wheat farms to
ranches with all combinations between the two extremes " The
soil ranges from the Red River Gumbo, to sand dunes" to
podzolic and most other soj-l types that one would find in
any grain-growing area" The terrain varies from flat plains,
to gently rolling plains, to hilly areas of the Parklandn
and valleys of different depths " Within the area the rail-
lrays have branch lines, mainlines ¡ lines for which applica-
tion for abandonment has been made, and areas vthere lines
SAMPLE CHARACTERTSTICS
APPENDfX B
B5
1th"selected are
geographical- areashown on the map;
chosen and the deliverv pointsFigure B-1"
have alreadv been lifted"
The random sampl irrg2 procedure was followed in
sel er:ti ncr the 2\ de'l i \zêr\/ noints and the I nrodrrr-:erq from"}-'each delivery point" The producers selected from each of
the del-ivery points \ivere chosen from the 1967-68 list of
permit hol-ders as supplied by the Canadian l{heat Board "
Thus, 200 permit book holders were chosen from whom data
were requested"
Two hundred questionnair"=2 t"r" mailed to the farmers
and 155 were picked up personally approximately two weeks
af ter Ï'rei no rer:ei r¡eri hrz l-he f armerS " Fort-v-f i ve \^têre not
col-lected because some farmers could not be contacted and
n{-}rare fnr narcnn='l r^ãõ^nd r^rnrr'l,4 nnt ñ^-^nôrâ+Â jnOLIlerS I L()r Per:;ulrcrJ lecisul¡u r vvvq¿s ¿rvs --. $l-Vang
the desired information" Of those completing the questionnaire
rêñ,râql- 2?.rid nOt haVe truCkS Or di-d not haul orain tO theY I q¿¡¿
sales outl-et. Nine or 5.8 percent used cusLom haulers. There
were, however, I42 trucks used in hauling grain which wereA
comprised of 46 three ton trucks, 35 two ton trucks o = 51 one
ton trucks, 5 three-quarter ton trucks, and B one-half ton
trucks. There was a bimodal distribution with respect to
B6
a'For a discussion on sampling procedure seei W.A.
Spurr and C.P. Bonnini, Statistical Analysis for BusinessDecisions , (Homewood: nÏEhard o;f rvin-, Inc " ,-AgA¡j;-
-ã-1.;-:;í
À ÀpÞ " 5 ro- 5¿r4 "
?-The questionnaire is included in Appendix D"ll=fncluded in the two ton trucks were 2 Lwo and one-
half ton trucks and 6 one and one-half ton trucks "
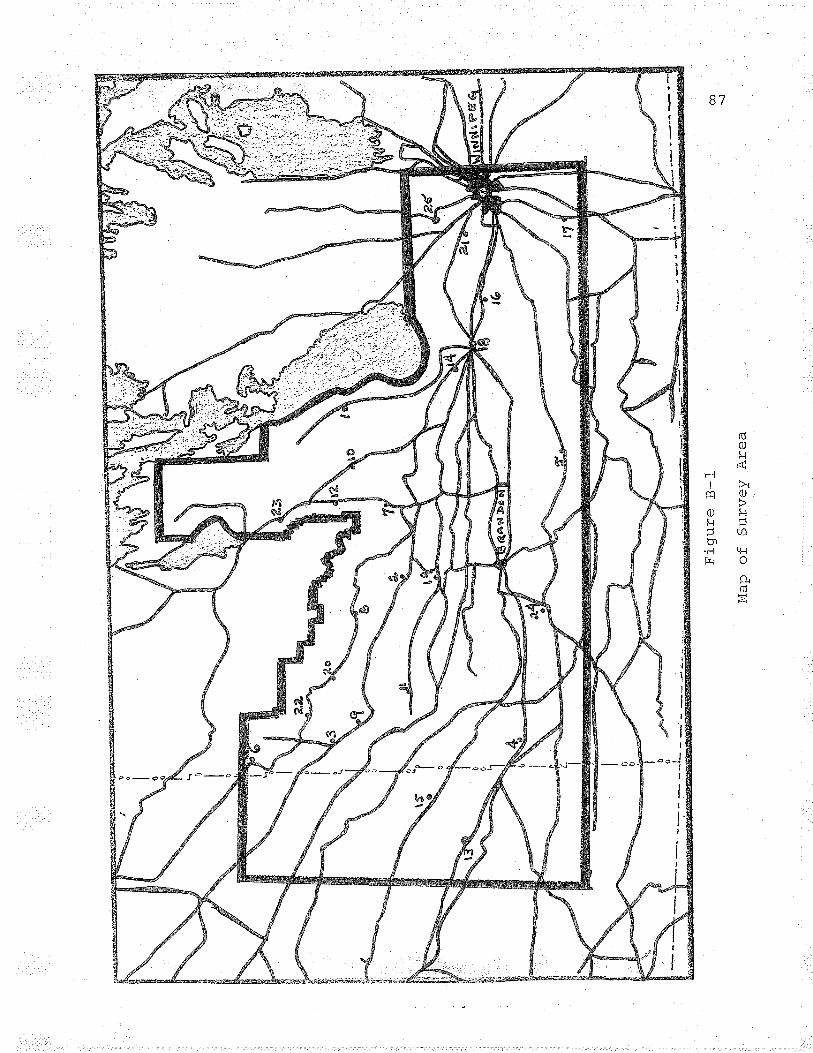
Fíg
ure
B-1
ùiap
of
Sur
vey
Are
a
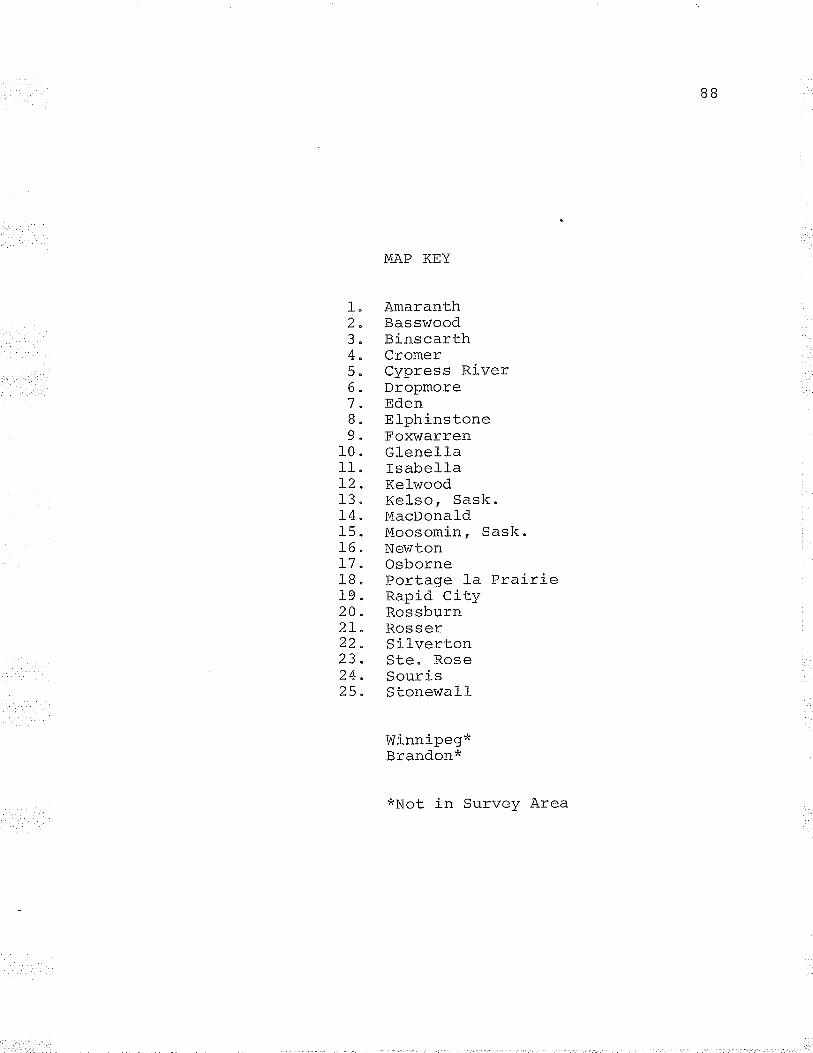
MAP KEY
1. Amaranth2 " Basswood3 " Binscarth4" Cromer5" Cypress River6" Dropmore7 " EdenB" Elphinstone9 " Foxwarren
10 " Glenella11. Isabel-la12. Kelwood13. Kelso, Sask"14" MacDonald15" Moosomin, Sask"16 " NewtonL7 " Osborne18 " Portage la Prairie19 " Rapid Citlr20 " Rossburn2L" Rosser22 " Silverton23" Ste. Rose24 " Souris25 " Stonewall
T¡7i nn i nan*vr!r¡¿r¿I,eY
Brandon*
BB
*Not in Survey Area
truck ages, with modes at 7964 and at rgs2 with very few
between 1955 and 1962"
The overall averagie load to capacity ratio) was 93.1_
percent with 94"3 percent for the three ton trucks, g2"B
percent for the two ton trucks, and 90 " B percent for the one
ton trucks. The average truck carried a load of 174"3lala^t-^1 ^r-ruÞirrers dn average of 6"27 miles for a one-way haul, and
travelled an average of 3,4I5.5 miles annually.
The average price paid for gasoline was 25"9 centsper gallon. The average number of miles per gallon6 and
the average cost per mile are given in Table B-1" The
average hourly wage rate reported was çL"72"
The number of mil-es the trucks lvere used in the deliv-ery of grain to the sales outlet was small_ relative to thetotal annual miles travelled. The portion of the milestravelled in hauling grain varied from 3.45 percent for thethree-quarter ton trucks, to 25"80 percent for the two tontrucks, with the average for the r42 trucks being 1,4.62 per-cent as shown in Tabl_e B-2 "
B9
I""Load to capacity ratio" is defined as the ratio ofthe average size load carried to the capacity of the truck.
6_-rn a personal conversation, a member of the Ford Motorcompany estimated the average truck mireage per gallon to beabout: three ton trucks 7 *"p"g.; two ton trucks 9 m.p.g.one ton trucks - between B and L2 m"p"g. (depending on theload carried); three-quarLer ton trucks rz m.p.g.; and one-hal-f ton trucks - 16 m.p.s.
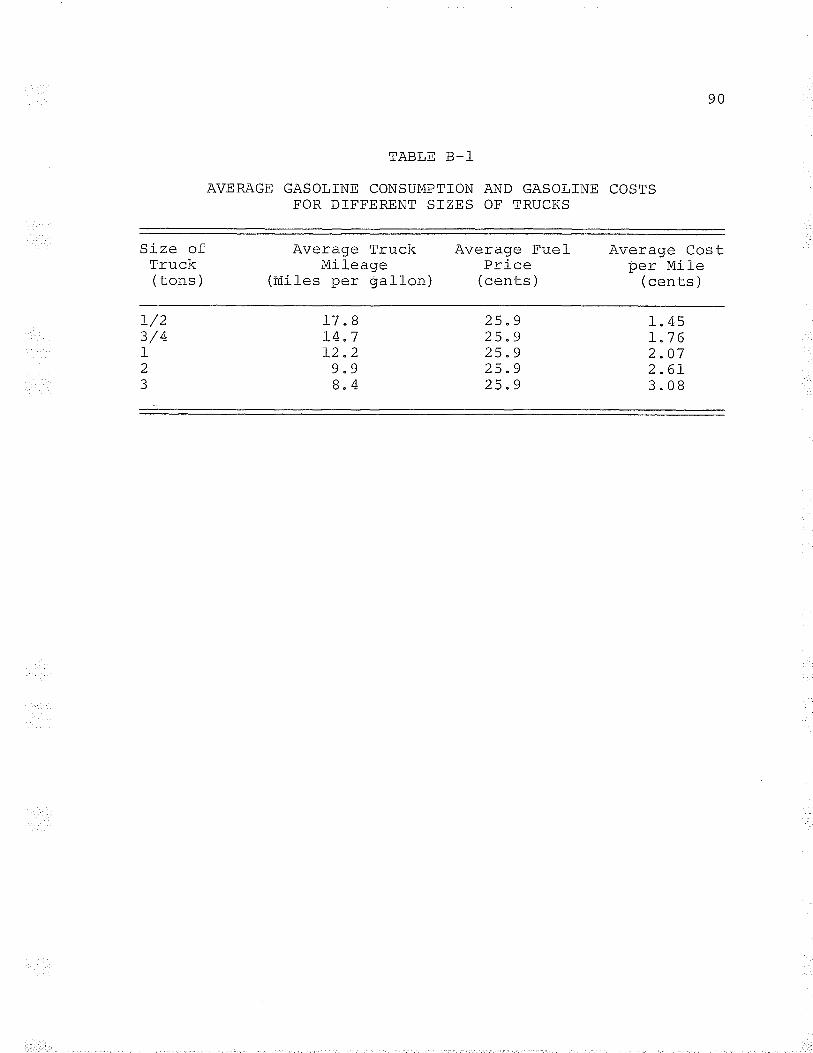
TABLE B-1
AVERAGE GASOLINE CONSUMPTIONFOR DIFFERENT SIZES
Size ofTruck( tons )
1 /23/4aI
z3
Âr¡or¡ aa rFrrr-g]ç
Mileage(miles per gallon)
I7 "BL4"7L2 "2qq
8"4
AND GASOLINE COSTSOF TRUCKS
Ar¡ar:ao F'rra I
Price( cents )
25"925"925 "925"925 "9
90
l-r^- ^ -^ F,^a +ðv Er a9 g \-(JÞ L
I/Er rYrI ICl¡on*ql
1 AÊ.
L"762"072 .6L3"08
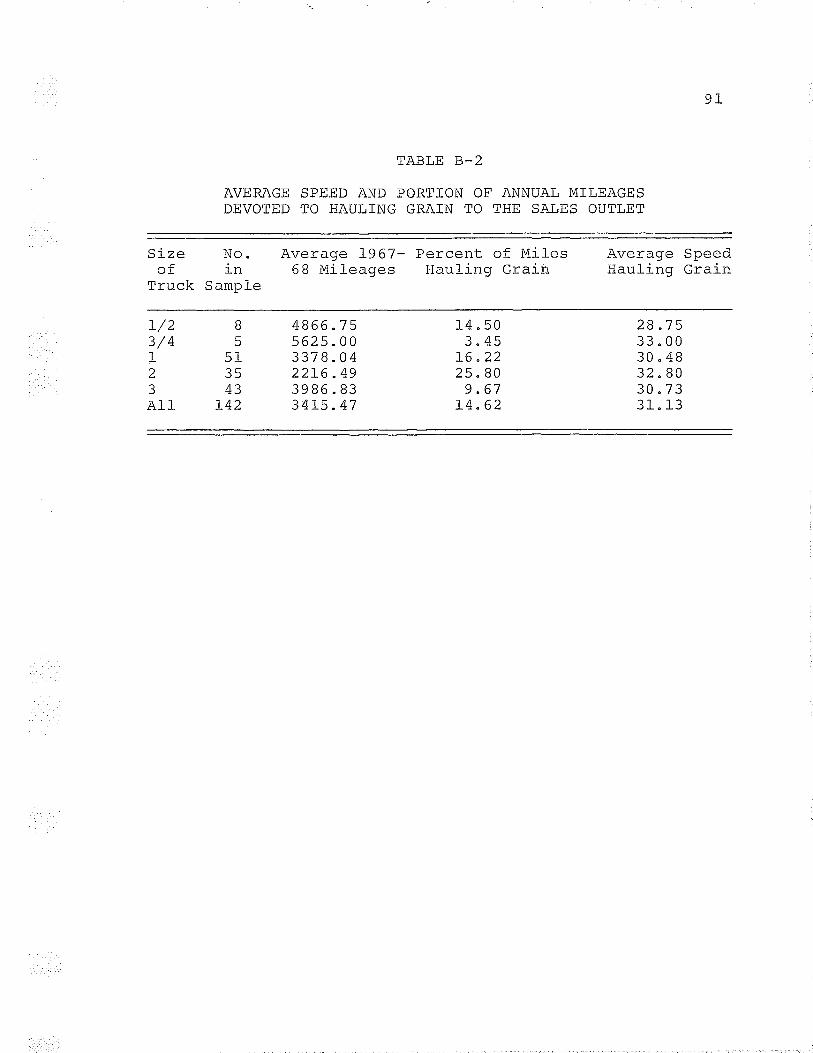
Size No.of in
Truck Sample
AVERAGE SPEED AND PORTION OF ANNUAL MÏLEAGESDEVOTED TO HAULING GRAIN TO THE SALES OUTLET
r/23/4tzJ
All
Âr¡ar¡aa 1Aâ,'7-hx tvl r lôâdôq
B
5513543
L42
TABLE 8.2
4866"755625"003378.0422L6 " 493986"8334L5 " 47
Percent of MilesHauling Grain
14.50') /t É.
L6"2225"80
9 "67l-4"62
91
Average SpeedTJ¡rr'l i na êra i n
28 "7533 " 0030"4832 " B030.7331.13
C XÏCNAddV
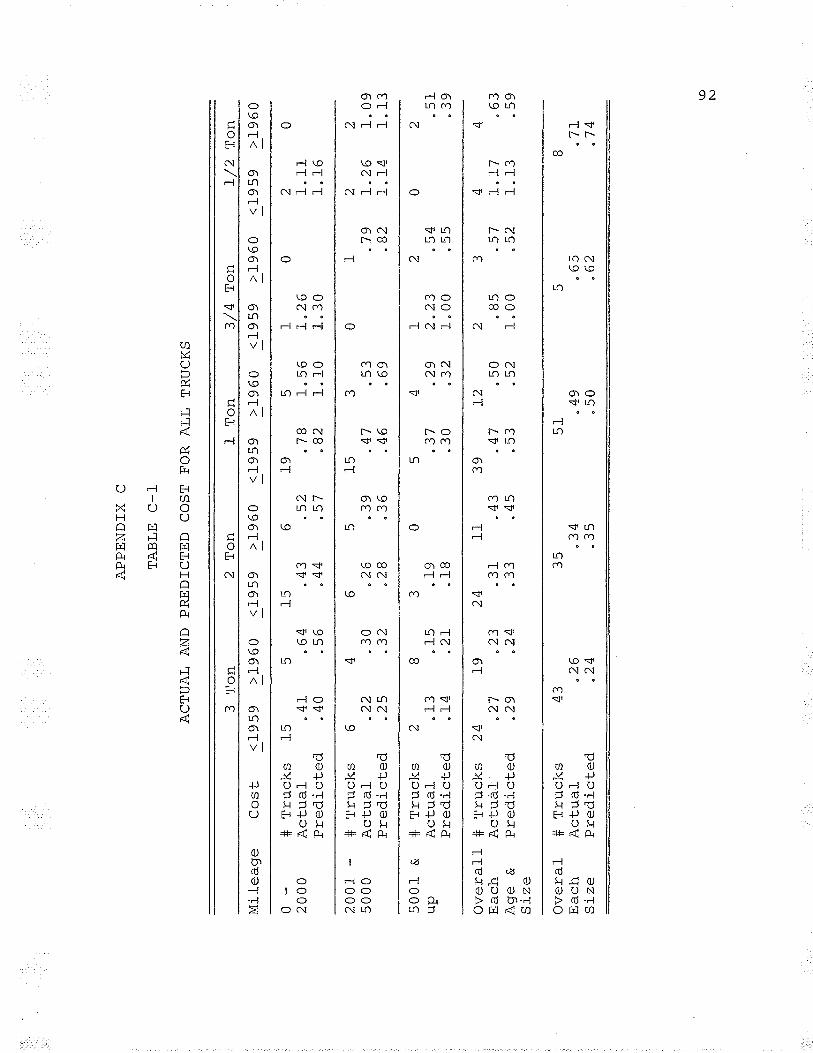
Mile
age
0- 2000
AP
PE
ND
]X C
TA
BLE
C-I
AC
TU
AL
AN
D P
RE
DT
CT
ED
CO
ST
FO
R A
LL T
RU
CK
S
UU
Ð
L
2001
5000
# T
ruck
s 15
Act
ual-
" 4I
Pre
dict
ed
" 40
5001
&up
<L9
59 >
1960
# T
ruck
sA
ctua
l-P
redi
cted
3 T
on
Ove
ral-1
# T
ruck
sE
ach
Act
uàl
Age
&
Pre
dj-c
ted
Siz
e
# T
ruck
sA
ctua
lP
redi
cted
515
"64
"43
"56
"44
<r9
59 >
1960
Ove
ral
# T
ruck
sE
ach
Act
ual
Siz
e P
redi
cted
"22
"25
2 T
on
.13
"L4
" 30 "32
2419
24
"27
"23
" 31
"29
"24
" 33
<19
59 >
1960
"15
"2r
"26
"28
"52
tr,
-7
I T
on
l9
5 15
.39
" 47
"36
"46
'lo "18
"78
.82
43
1" 1
0
.26
"24
3/4
Ton
<19
59 >
1960
1l-
39À
1 A
-"4
J "+
t" 4s
.5
3
I L "2
61"
30
" 30
h< "69
"34
<19
59 >
1960
I/2
Ton
"¿Y '7)
L2"5
0
1 2 "2
3r"
00
¿ 1" 1
11.
16
"79
"82
51"4
9 qn
23 " 85
1"00
22 L"26
1"
09
1"14
1"
13
rÀ qq "52
A t" 1
71"
13
" 65
-1 "63
"7L
.74
C XTCNSðdV
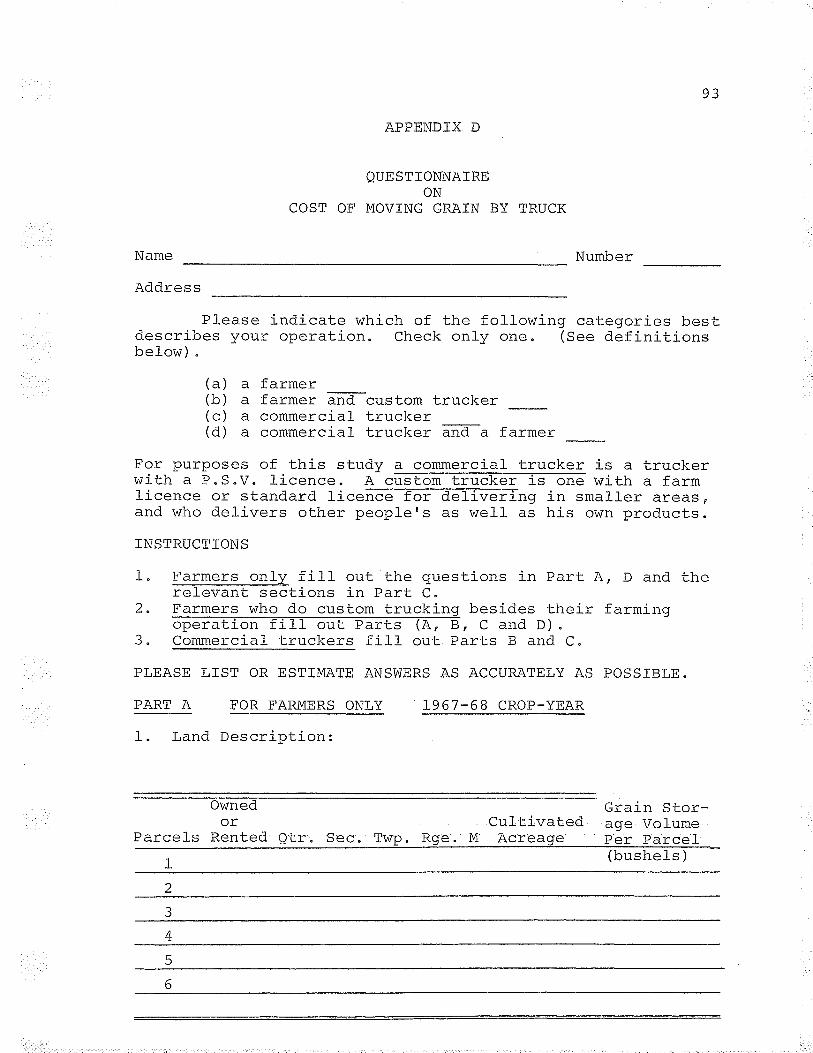
Name
Address
Please indicate which of the following categories bestdescribes your operation" Check only one. (See definitionsbelow) "
(a) a farmer(b) a farmer and custom trucker(c) a commercial trucker(d) a commercial- trucker ãñã--a farmer
APPENDIX D
QUESTIONNAIREON
MOVING GRAÏN BYCOST OF
For purposes of this study a cotnmercial trucker is a truckerwithaP"S.V" licence. Ac withafarmlicence or standard liceffig in small-er areas,and who delivers other T¡eople's as wel-l as his own prod.ucts.
INSTRUCTIONS
1"
TRUCK
2"
F'armarq nnIrz f i1'l nrr.t- +h^ ryrrocfinnq ìn Þ¡rl. ^
l-'r ¡nÄ +h^I qlrltu!Ð v¡rIJ rI-LI UL,|.L LIIe t:[uçÐ ulvl¡Ð lll r q! u At U qIlU LIICIeTêvant sections in Part C.Farmers who do custom truckinq besides their farminqôrrêrâf inn f ill nrrj- Þ:r1-q lA R î:nd nl\¿rt u I
Commercial truckers fíl] out Parts B and C"?
YJ
PLEASE LIST OR ESTIMATE ANSWERS AS ACCURATELY AS POSSIBLE"
Number
PART A
t_" Land Description:
FOR FARMERS ONLY
Ownedor
Parcels Rented Qtr. Sec" Twp. Rge"
T967-68 CROP-YEAR
CultivatedM Añr'â:ñâ
Grain Stor-age VolumePer Parcel-(bushels )
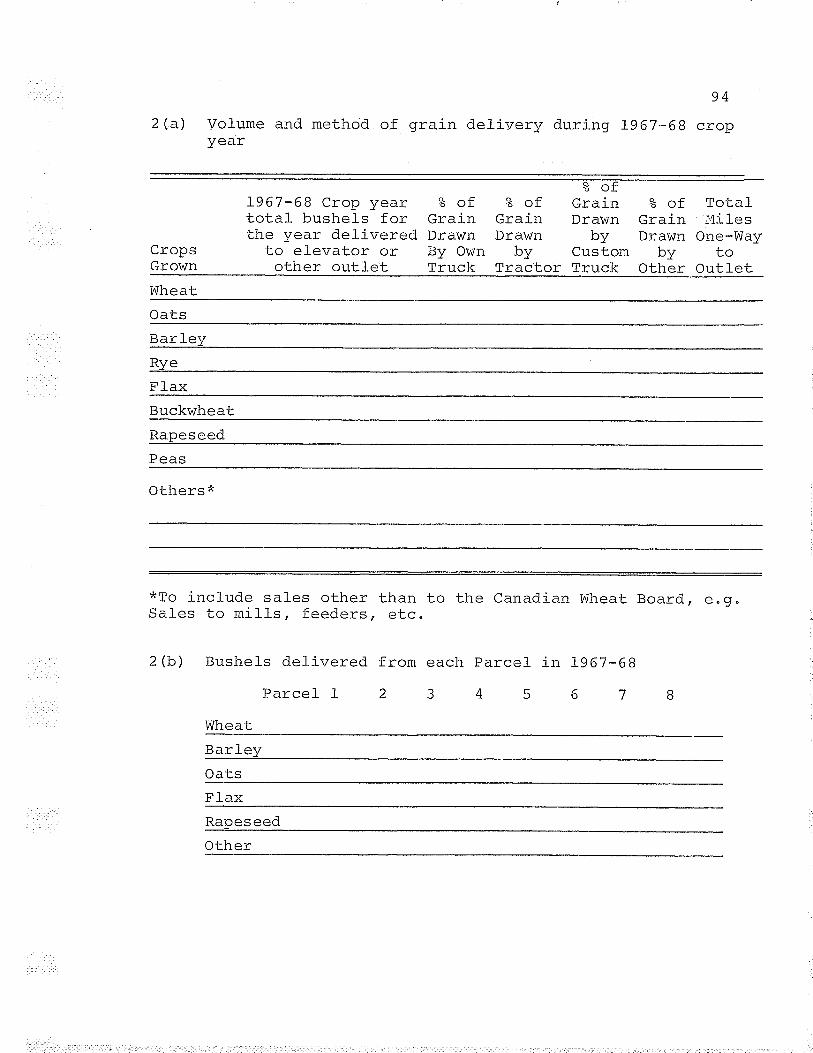
94
2(a) vol-ume and method of grai-n deli-very during 7967-68 cropyear
CropsGrown
Wheat
1967-68 Crop yeartotal bushels forthe year delivered
to elevator orother outl-et
Oats
Rye
f '_Lax
Buckwheat
Rapeseed
Peas
%ofGrainDrawnBy Ownl.'rucK
Others*
?ofGrainDra\ún
byTractor
*To include sal-es other thanSales to mills, feeders, etc
?ofGrain % of TotalDra\,'/n Grain l¡iil-es
by Drawn One-WayCn s tom hr.z tOTruck Other Outl-et
2 (b) Bushels del-ivered
Parcel 1
lüheat
ô:l-q
T'IAX
to the Canadian In/heat Board, ê.g.
Rapeseed
from each Parcel
Other
in L967-68
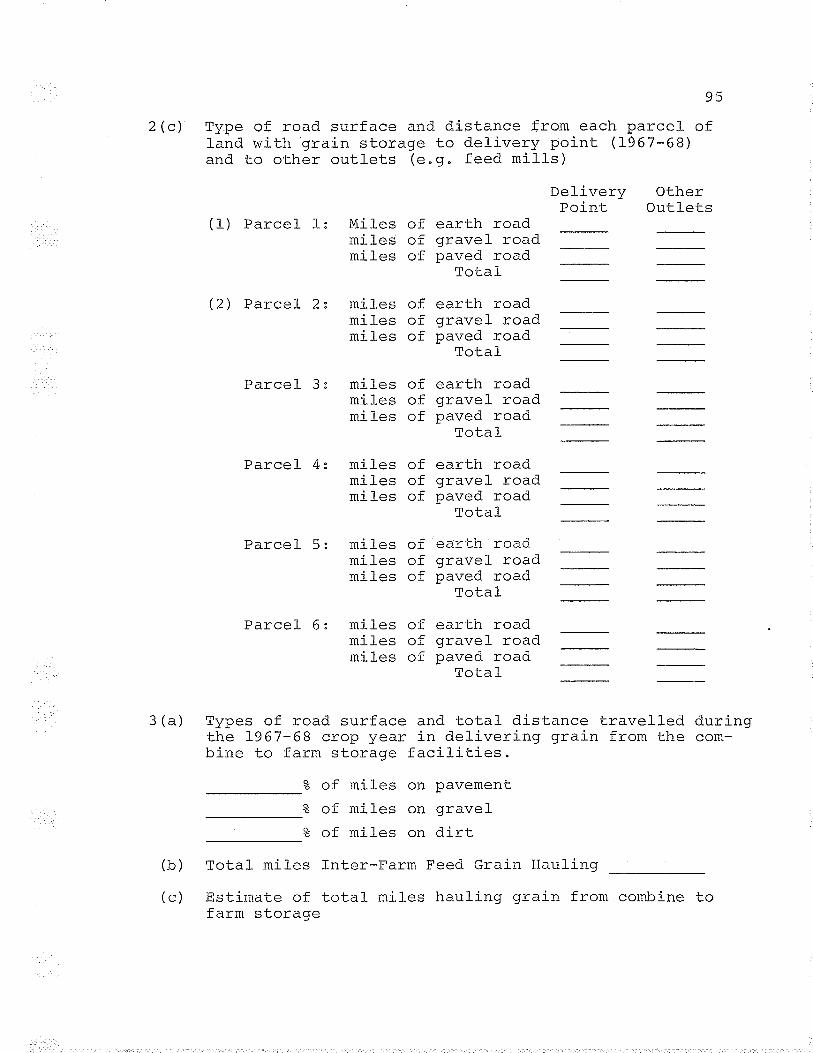
95
2 (c) Type of road surface and dj-stance from each parcel ofland with grain storage to del-ivery point (1967-68)and to other outlets (e.9" feed mil-ls)
Delivery OtherPoint Outlets
(2) Parcel 2
Miles of earth roadmiles of giravel roadmiles of paved road
Total
Parcel 3
miles of earth roadmil-es of gravel roadmiles of paved road
Total
Parcel- 4
míles of earth roadmiles of gravel roadmiles of paved road
m^J- -'lfULqA
Parcel 5
miles of earth roadmiles of gravel roadmiles of paved road
]ULqA
" /-\ m..*^^ ^1J \a/ aJ¡,sÞ -.= road surface and total- distance travelled during
the 1967-68 crop year in deliverJ-ng grain from the com*bine to farm storaqe facilities.
Parcel 6
mil-es of earth roadmiles of gravel roadmj I os of nar¡ed road
Total
miles of earth roadmil-es of gravel roadmiles of paved road
Total
(b) Total miles fnter-Farm Feed Grain Haull-ng
(c) Estimate of total mil-es hauli-ng grain from combine tofarm storaqe
? of miles on pavement
% of. míles on gravelZ of mil-es on dirt
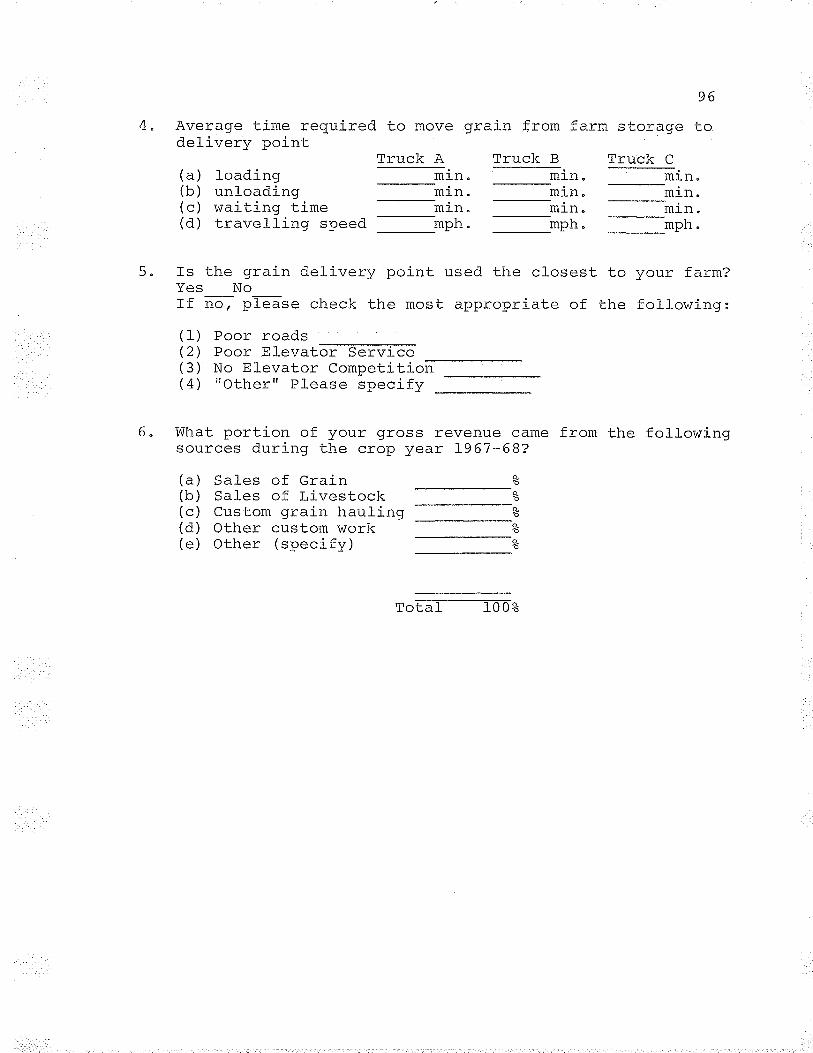
1I Ar¡ar¡na l-inra rêôrrìrarl fn marzo ar:ìn frnm! çYq4! uu uv ¡rrv v v
delivery point
(a) loading(b) unloadinglnl r^r¡i{-inn {-'i\ v/ ,-me(d) travelling speed *ph"
Í Tc {-lra arain Áa'l irzarr¡ nnin*t/v¿¡¡g
Yes NoTf nÕ - ¡lfJcc check the most
1) Poor roads2) Poor nlevatõf-3êrîfte
Truck A
3) No Elevator CompetitionL\ lrfì+hêrrt Þl a¡qa qna¡i frz
6" What portion of your gross revenue camesources during the crop year L967-68?
ml-n.ml_n "ml_n "
Truck B
(a) Sales of Grain
96
farm sfnrerre J;O
Truck C
lht
(c)(d)
Sales of LivestockCustom grain haulingOther custom work
used the closest
appropriate of
(e) Other (specify)
ml_n.ml_n "mph.
ml-n "mr_n.
'f-n rznrrr f arrr'?
{-lro fnl lnr^rina.
ml_n "mph "
from the fol-lowinq
zz
zz
m^r ^'l ì al ^
o-]ULAJ f,UUõ
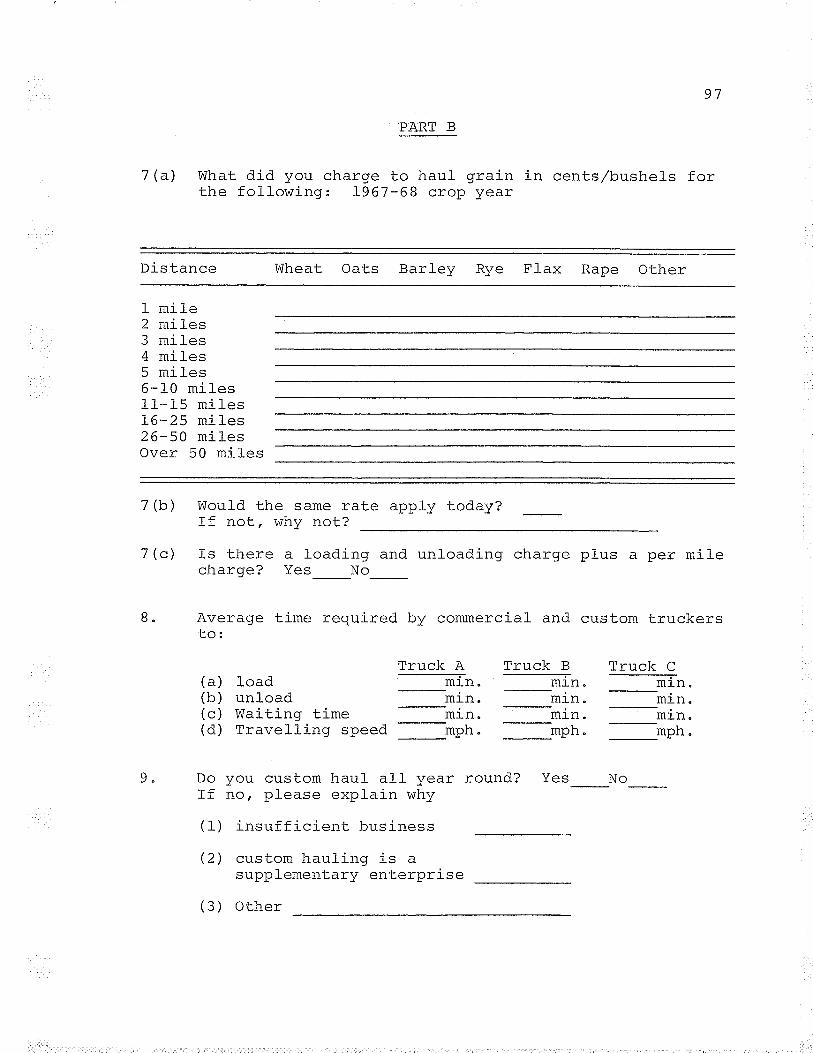
7 (a) Vühat did you charge to haul grain in cents/bushels forthe fol-lowinq: L967-68 crop vear
ñ.; -.r-U!Ð LOIIUE
I mile2 miles3 miles4 miles5 mil-es6-10 miles11-15 milesL6-25 miles26-50 mi-lesOver 50 miles
PART B
7 (b) Would the same rate appfy today?If not, why not?
R:rlarz Þrzo Fl'l 1-!q! ¿çJ r\J ç I JA.¿!
7 (c) fs there a loading and unloading charge plus a per milecharge? Yes No
97
Ârzar¡aa +ima r^^lf irnÄnv E! qyç urrrlç ! EYU!! gu#n"
Rape Other
(a)(b)l¡\(d)
loadunloadt^¡âafañ^ f 1ñô
Travelling speed
q Do you custom haul all yearTf n^ n'1 aaca ovnlain r^rlrrz¡¡v'È/4ugJu
(1) insufficient business
(2) custom hauling is aõrrññ1 aman'l-¡¡17 an'l-ornri qcÞUI/IJJEI[EilLq!J çrr uç!H! rov
(3) Other
by commercial and custom truckers
Truck A
-- ml-rì.ml_n "m.r-n "
Truck B Truck C
-
ml_n. ml_n .
mph "
round? Yes
mr_n.ml_n "mph.
ml_n.ml_n "
----t"^h
No
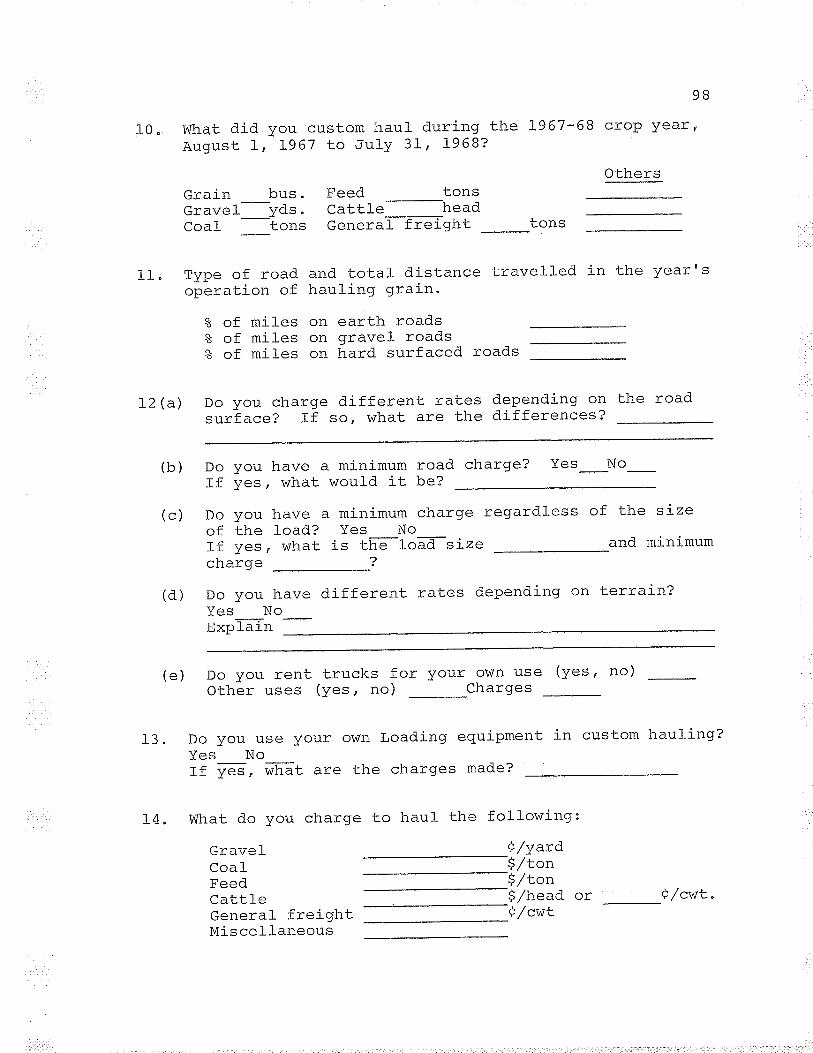
10.
qç
what did you custom haul during the l-967-68 crop year¡August 1, L967 to JulY 31, 1968?
OthersGrain bus " Feed tonsGravel-yds. Cattle---headCoal tons GeneraÏ- frêîght
-tonst1" tT¡rzna nf rnerl'J v"a^araJ- i nn r¡fvye!
Z of mileså of mil-es on giravel roadseo of miles on hard surfaced roads
12 (a)
and total distance travelled inhauling grain.
on earth roads
Do you chargesurface? If
(b) Do youIf yes
(c) Do youof theIf yesa]naraav¡¡s! Y v
different ratesso, what are the
lldvc=-L-^+, wlrcr. L
]IqVE
load?, what
(d)
a minímum road charge?woul-d it be?
Do you have different rates depending on terrain?Yes Nonxptãîn
-
a minimum charge regardlessYes No
(e) Do you rentOther uses
. --
--";-is the load size?
13
{-ha rza¡r I q
dependíng on the roaddifferences ?
Do you use Your o\^/nYes NoT f ve-s . #ñãt are che
-I ve I
1À 1J1^-+ .3^ -'arr ^L¡r^aLC " WIId. L LrU y Lru urror Y ç
Gravel^^^'l\-L-lo.fH'ôôô
^^+r_l ^
General freightMiscellaneous
t.rucks for(yes, no)
Yes No_
your o\^/n use (yes, no)
of the size
and minimum
T ^^¡ 'i *^JJ(JÕUrrrY
¡h = raocvr¡q! Yvv
Charges
to haul- the f ollowing:
^ /-.^-ÃY/ yaLv
equipment in custom hauling?
made?
$r/ton$/ton$/head orë/cwL
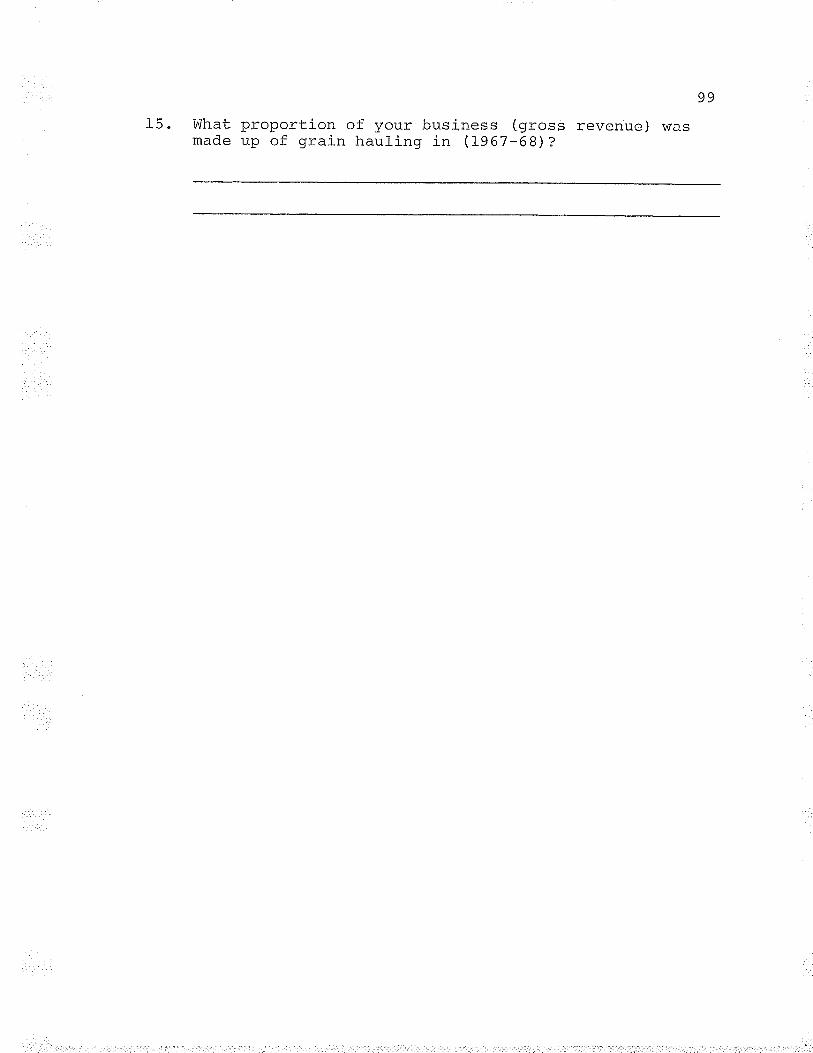
15 " !{hat proporti"on of your business (gross revenue) wasmade up of grain hauling in (1967-68) ?
99
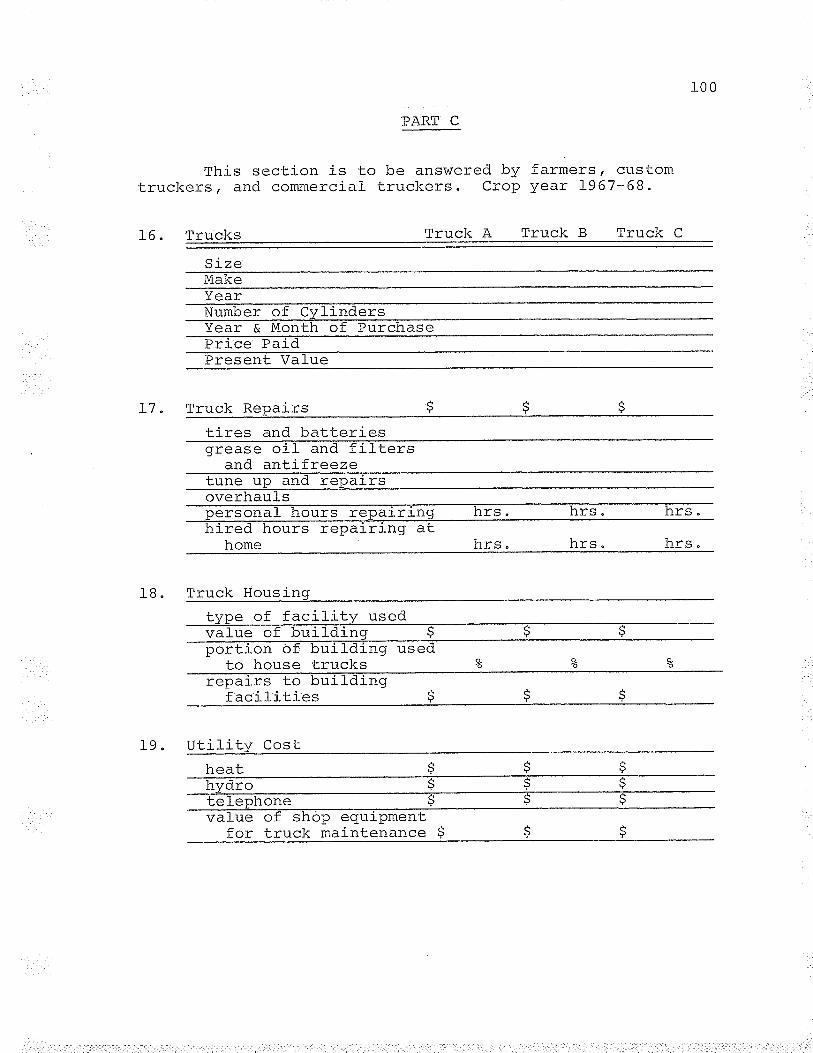
This section ís totruckers, and commercial
L6 Trucks
SizeMakeYearNumber of
PART C
- Price ÞaidYear & Month of Pur
be answered bytruckers " Crop
Truck A
L7
Present Value
Truck Repairstires and batteriesgrease oil and filters
and antifreezetune up and repairs
hired hours repairing at
farmers, customyear 1967-68 "
overhaufs
1B "
Truck B Truck C
home
Truck Housinq
100
#rzno nf f -a¡i I ì'l-rz rrqorluv Yv
- portion of buildinq usedto house trucks so Z Z
repairs to buildingfacilities
I9 Util-ity Costheathvdro!^l a
hrs
valuefor
orreall' q
truck
hrs "
op equr-pmenEmaintenance S
hrs "
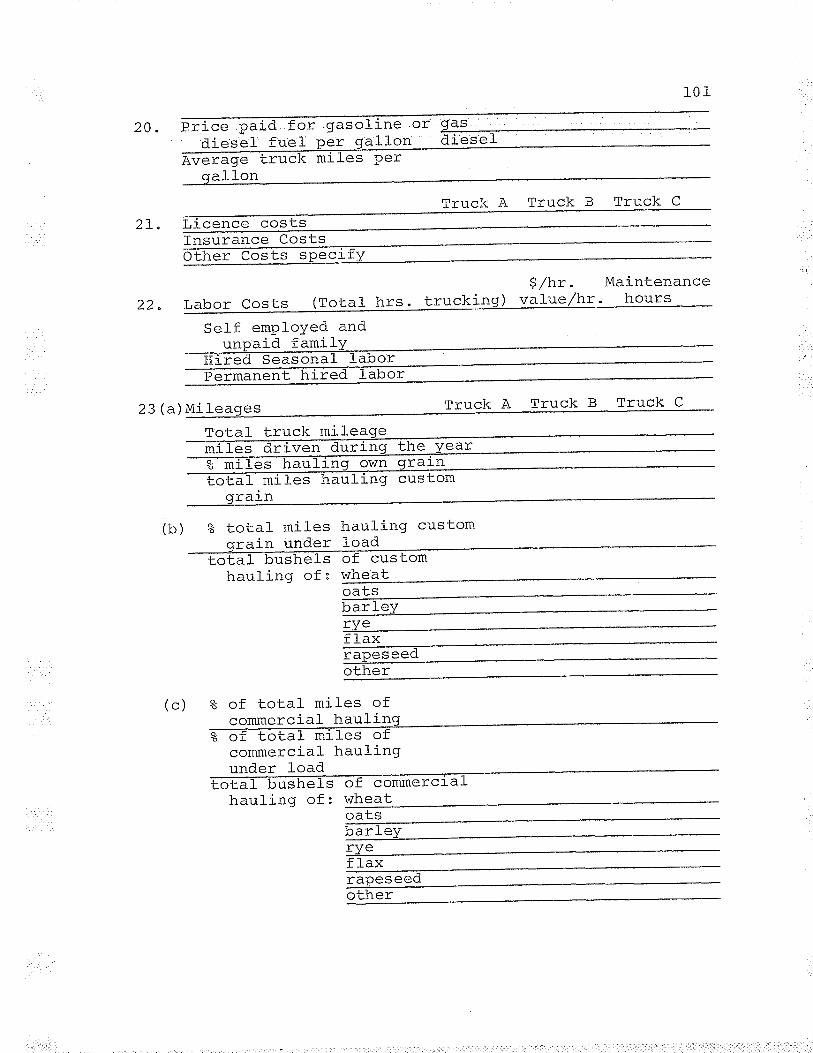
2A ÞEiãe paid for gasoline or 9?9 = , . - *.:¿i"=Ër fuel per gallon diesefa-¡eraqe truck miles Per
2r.
aIlon
Licence costsInsurance CostsõEher Costs specif
22$/lnr. Maintenance
Labor Costs (Tota-l hrs. trucking) val-ue/hr " hours. -
Self emploYed and
23 (a) Milea
uncaid famil
Permanent hirered Seasonal l-a
Total truck mileagemil-es driven duri-ng fire Year% m-'i I es haulÍng own grarn
--TõEãT miles hauling custom
-L'rr.1cK
(b) ? total miles haulíng customnrain under load
total bushels ot custom
'IrucK lJ
orabor
101
haulinq of: wheat
Truck C
'1'rucK
(c) % of total miles ofcommercial hauling
Z of totat ml-Ies orcommercial hauling
Truck
OAESh¡rl ar¡v\¿!¿vJ ¡ -
f\7 ã
flax
totaf busheunder load
nì-?rar
Truck C
hauling ofn{- ^^mmêrat'l â
wheatI'4L¡
l-r: r I orz
ryef l-axI ctuËÞgçs
other
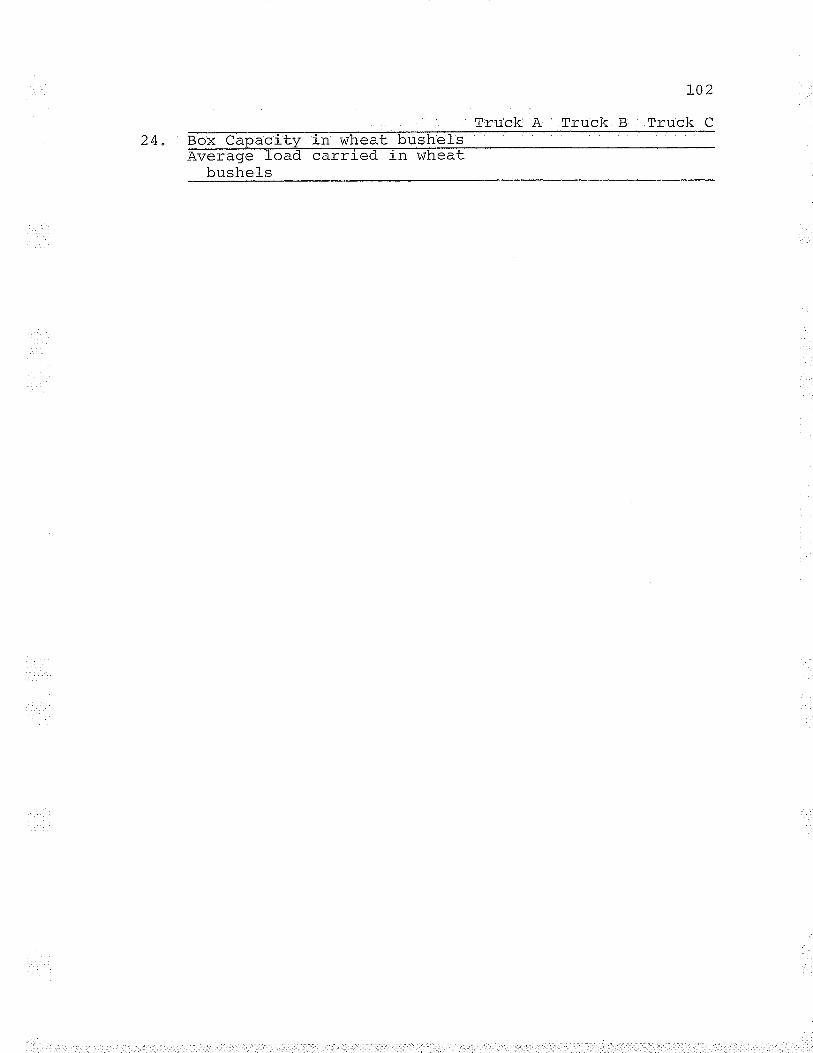
L02
T'ruck A Truck B Truck C
24.A
bushel-s
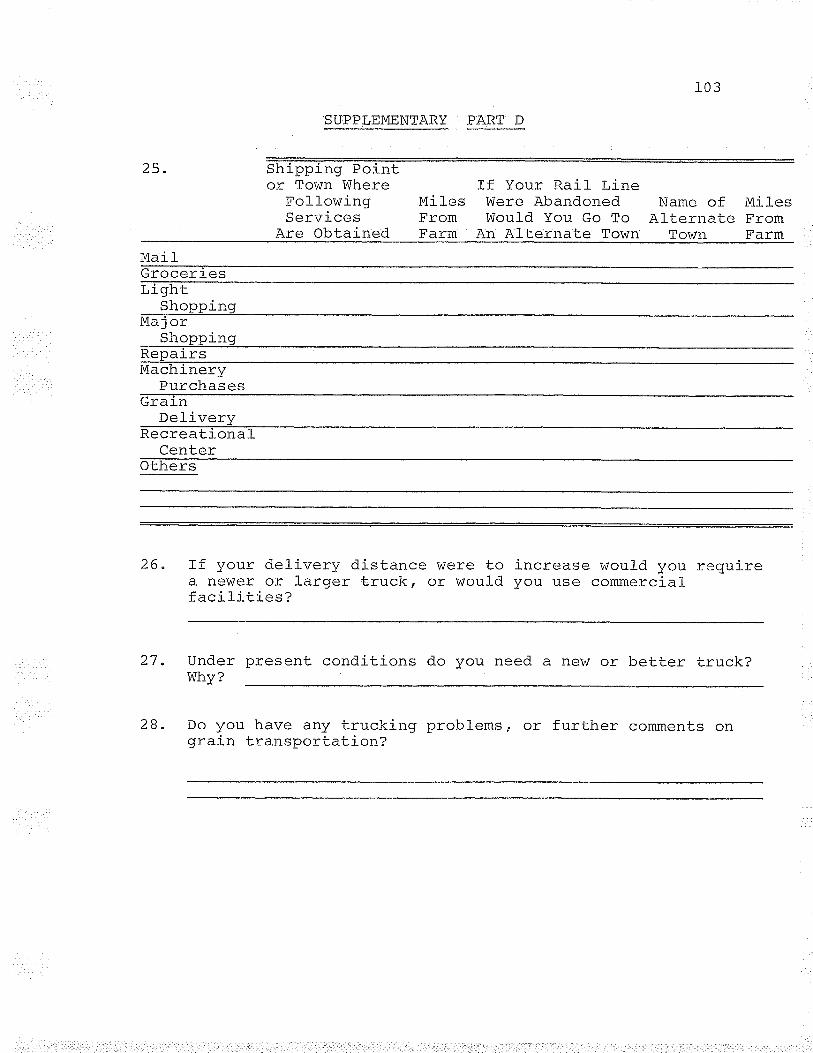
25"
LVIaI- t-Groceries
Qlr nnni na
Qlrnnni na
MachineryPurchases
Shipping Point
SUPPLEMENTARY PART D
or To\,{n VühereFollowing MilesServices From
Are Obtained Farm
Graj-n
Recreational-Deliver
OthersCenter
l_ï Your .L(ar_I lJl-neWere Abandoned Name of MilesWould You Go To Alternate From
An Alternate Town Tov/n Farm
26 If your deliverya newer or largerfaci lities ?
103
)'7 TrnÄar ^-esent conditions do vou need a new or better truck?J UJL
why?
28" Do you have any trucking problems t or further comments ongrain transportation?
distance \^iere totruck r or woul-d
increase would you requireyou use commercial