MASTER OF SCIENCE - MSpace - University of Manitoba
102
Cardi ovascul al Fi tnes s in Prepubescen t Children by Katherine M. McGany A Thesis submitted to the Faculty of Graduate Studies of The University of Manitoba in partial fulfilment of the requirements of the degree of MASTER OF SCIENCE Faculty of Kinesiology and Recreation Management University of Manitoba Winnipeg, Manitoba Copyright O 2008 by Katherine M. McGary
-
Upload
khangminh22 -
Category
Documents
-
view
0 -
download
0
Transcript of MASTER OF SCIENCE - MSpace - University of Manitoba

Cardi ovascul al Fi tnes s in Prepubescen t Children
by
Katherine M. McGany
A Thesis submitted to the Faculty of Graduate Studies of
The University of Manitoba
in partial fulfilment of the requirements of the degree of
MASTER OF SCIENCE
Faculty of Kinesiology and Recreation Management
University of Manitoba
Winnipeg, Manitoba
Copyright O 2008 by Katherine M. McGary

THE UNTVERSITY OF MANITOBA
FACI'LTY OF GRADUATE STTIDIES¡t¡t*tr*
COPYRIGHT PERMISSION
Cardiovascular Fitness in Prepubescent Children
BY
Katherine M. McGarry
A ThesisÆracticum submitted to the Faculty of Graduate Studies of The University of
Manitoba in partial fulfillment of the requirement of the degree
MASTER OF SCIENCE
Katherine M. McGarry @ 2008
Permission has been granted to the University of Manitoba Libraries to lend a copy of thisthesis/practicum, to Library and Archives Canada (LAC) to lend a copy of this thesis/practicum,and to LAC's agent (tIMI/ProQuest) to microfilm, sell copies and to publish an abstract of this
thesis/practicum.
This reproduction or copy of this thesis has been made available by authority of the copyrightowner solely for the purpose of private study and research, and may only be reproduced and copied
as permitted by copyright laws or with express wriffen authorization from the copyright owner.
of

Abstract
Assessing cardiovascular (CV) fitness in children is important for monitoring the
health status of this population and for evaluating different interventions in prevention
and treatment of obesity. Since the prevalence of children who are overweight or obese
has tripled since the determination of the 2OmSRT regression equation, the validity of the
equation to predict V0z-* per kg body mass (BM) could be in question. Purpose: To
compare CV fitness derived from a running test, the 2OmSRT, and a cycle test (body
mass independent exercise), while normalizingmaximal oxygen uptake (VOz) to various
body composition parameters (body mass (BM), fat free mass (FFM), and skin fold
corrected leg girth (SFLG) in prepubescent children across different body composition
levels. Method: Seventy-seven subjects (mean age 9.95-10.8 yrs) performed a 2OmSRT
to predict maximal oxygen uptake (VOz,',*) relative to BM and a subset of fifty-seven
also performed a cycle test to measure maximal oxygen uptake (V02''* ) using indirect
calorimeky. To determine absolute V02-o and VOz-o normalized to body composition
parameters (BM, FFM and SFLG) for the 2OmSRT a back calculation method was
performed. Subjects were classified into the three categories using (BF) using body fat;
non-overweight (520%), overweight (20.1-25.0%) and obese (>25.0%), and body
composition was also examined on a continuum. Physical activity was assessed using
pedometers (daily step counts, mean over 7 days). Results The 2OmSRT and the cycle
test were significantly correlated þ<0.05) independent of VOz expression. Using the
categorical data for body composition V02 per BM was significantly different (p>0.05)
between all body composition categories for the cycle test except V02 per FFM, which
was not significantly different between body composition categories. However an inverse
relationship between %BF and VOz.* per FFM was observed. When examined using
continuous data significant negative correlations were observed between %BF and VOz
per FFM and VOz per BM on the cycle (r-0.298,r:-0.662,p< 0.01). Conclusion: The
CV fitness of children decreases with increasing adiposity regardless of the method of
expression, (BM, FFM) on the cycle test. The 2OmSRT provides a moderately high level
of agreement with the CV f,rtness derived from cycle testing, which is body weight
independent. This allows the 2OmSRT to be used as a test of CV fitness.
Table of Contents
LIST OF EQUATrONS............
LIST OF FIGURES
INTRODUCTION
REVIEW OF'LITERATURE
METHoDS ro ASSESS CV Flrupss .....................17CV FrrNEss oF OBESE CsnnneN ......................18
Assessment of Different Protocols (Treadmíll, Cycle) and Measurements (Ventilatory Anaerobic
Body Composition Classification................ .........................23Physical Activity Measurement ................. ...........................24Age and Maximal Oxygen Uptake........... .............................25
METHODS ,............................33
Cen¡lovesculAR FTTNESS ASSESSMENTS.. .............................39
Maximal Efort during 21nSRT and Cycle Tests.... ............41
ASSESSMENT oF PySICHAL Asrrvrry LEVELS........-.---.--.-..- ............................44
STATISTICAL 4N4LYSIS......................... AE
74
APPENDIX Ä,: COVER LETTER AND PARENT CONSENT FORM
APPENDIX B: CHILD ASSENT FORM
APPENDIX D: BODY COMPOSITION CATEGORIZATION 94
List of EquationsEquation 1. BFl ..................37Equation 2.F3F2...................................................... ..................37Equation 3. Fat Mass & Fat Free Mass......... ...........37Equation 4. Skin Fold Corrected Leg Girth......... .....38Equation 5. 2OmSRT Predicted VOz-* (mlrkg/min) equation.. ....................40Equation 6. 2OmSRT Predicted VOz-* Q/min) equation.... ........40Equation 7. 2OmSRT Predicted VOz-o (mlkg FFN{/min) equation .............40Equation 8. 2OmSRT Predicted VOz-* (mVmm SFLG/min) equation .........40
List of FiguresFigure 1. Mean (SD) daily step count for weekday and weekend days. ........56Figure 2. Relationship between average daily step count and body fat. ........57Figure 3. Relationship between step carriage and body fat............. ..............58Figure 4. Relationship between final speed/stage and body composition category..........59Figure 6. Relationship between maximal cycle power output (mean and SD) and
body composition category. .....................64Figure 7. Relationship between body composition category and maximal oxygen
uptake relative to power output. ...............65Figure 9. A scatter plot of cycle absolute VOz and 2OmSRT absolute V02............ ...........72Figure 10.4 scatter plot of cycle VOzrelative to FFM and 2OmSRT VOz
relative to FFM...... ...............73Figure 11. A scatter plot of cycle VOzrelative to SFLG and 2OmSRT VOz
relative to SFLG.... ...............73
List of TablesTable 1. Characteristics of subjects. ......49Table 2.Body composition ....................51Table 3. Correlation of body composition parameters............... ...................52Table 4. Maximal20mSRT results. ......53Table 5. Maximal Cycle test results. ......54Table 6. Sub maximal Cycle test results. ..................55Table 1.Da1ly step counts ......................56Table 8. Correlation of maximal oxygen uptake during the 2OmSRT to %8F................60Table 9. Partial correlation between body fat and maximal oxygen uptake for the
2OmSRT controlling for average daily step count......... .................61Table lO.Partial correlation between body fat and oxygen uptake for the 2OmSRT
controlling for step carriage. .....................61Table 11. Correlation of maximal oxygen uptake during the cycle test to %FF..............67Table 12.Pafüal correlation between body fat and oxygen uptakes for the cycle test
controlling for average daily step count. ....................68Table 13. Partial correlation between body fat and oxygen uptakes for the cycle test
controlling for step carriage. ....................68Table 14.Conelations and pafüal correlation between 2OmSRT and cycle test...............71
4

NntroductionThe number of children who are categorized as being overweight and obese is
increasing at an alarming rate. It is estimated that since 1980 the number of children
overweight or obese has increased three-fold (Eisenmann, Heelan, & Welk, 2004).
National data from 1996 show that33Yo of boys and2TVo of girls are overweight and
l\Yo ofboys and9Yo of girls are obese (Tremblay, Katrnarzyk, & Willms, 2002). Not
only is there a shift in the number of children categorized as overweight or obese but
there is also an increase in body mass and body mass index (Thompson, Baxter-Jones,
Mirwald, & Bailey,2002; Wells, Coward, Cole, & Davies, 2002). Over consumption of
food and sedentary behaviour are implicated in the rise of obesity (Roblin, 2007;
Wittmeier, Mollard, & Kriellaars,2007).In the past decade, conveniences in terms of
easily accessible high calorie and over-portioned food, as well as conveniences that
decrease work requirements have been added to children's lives. The Kaiser Foundation
released a report on the computer related inactivity of children which reveals an alarming
amount of time spent in sedentary pursuits (6 hours 43 minutes per day) with increasing
multitasking possibly making intervention difficult (Roberts, Rideout, & Foehr, 1999).
Health Canada in the Physical Activity Guide for Youth recommends that children
engage in 90 minutes of physical activity per day with 60 in moderate intensity activity
and 30 in vigorous activity (Health Canada,2002). Canadian children are not meeting
these recommended guidelines (Tremblay & Willms, 2003). In Manitoba, as few as 4Yo
of children (8- 10 years old) meet the 90-minute guideline (Wittmeier et al., 2007). This
study demonstrated a significant inverse relationship between minutes engaged in
moderate physical activþ and body fat (BF) using objective measures of physical
activity and body composition.

Physical inactivity and an increase in adipose tissue can lead to several disease
states including but not limited to cardiovascular disease, diabetes, osteoporosis, and
respiratory disease (Lee, 2003; Warburton, Nicol, & Bredin, 2006). Previously these
diseases were largely restricted to adults, but today many of these diseases are developing
in adolescents and children (Bloomgarden,2004; Daniels, 2006). Obese children are
presenting with cardiovascular risk factors such hypercholesterolemia, hypertension, and
dyslipidemia (Groner, Joshi, & Bauer, 2006). Children are developing "metabolic
slmdrome" and this has significant impact not only the future but also on the current
health status of children (Weiss et a1.,2004). Obesþ during childhood is a strong
predictor ofobesity and coronary heart disease risk factors in adulthood (Janssen et al.,
2005). Physical inactivity, a leading cause of obesity, is an economic burden that has
been estimated to cost the Canadian health care system 5.3 billion dollars and4.3 billion
due indirectly and directly to obesity respectively (I{atzmarn¡k & Janssen, 2004).
Therefore, it is imperative to establish adequate physical activity levels in children and
ensure that they persist into adulthood to minim ize the adverse effects on the
cardiovascular system, glucose metabolism, bone quality.
Heart disease and stroke is still the number one cause of mortality in adults
However, prescription medication (cholesterol lowering) has been effective in reducing
the incidence of cardiovascular disease over the past 20 years, even though the primary
controllable factors of obesity and hypertension are still increasing (Cholestrol Facts and
Statistics 2007). Prevention of these factors through physical activity and proper diet is
the only real means to lead to effective reduction of the diseases as opposed to treatment

of symptoms (Appel, 2003; Balkau et a1.,2006). Assessment of cardiovascular (CV)
fitness is important in evaluating interventions, screening of children, and even detecting
cardiovascular disease. Low CV fitness in adults is a strong predictor and early indicator
of cardiovascular disease (Vanhees et a1.,2005). Cardiovascular f,rtness is the ability of
the heart and blood vessels to supply nutrients and oxygen to the muscles during
sustained exercise (Kent, 1994). In research prior to 2000, researchers almost
exclusively assessed CV fitness in children by measuring maximum oxygen uptake
(V0z-*) and expressing it relative to total body mass using treadmills, cycles and over-
ground running. This has been the standard for CV fitness assessment in adults and
children. It is important to evaluate CV fitness to document the current health status of
the population, as well as to evaluate effectiveness of interventions.
A recent consensus report from the European Society of Cardiology recommends
graded exercise tests to assess CV fitness. They recommend tests such as the 2 km walk
test, cycle test and the 20 meter shuttle run test (20mSRT) to evaluate CV fitness in
children (Vanhees et al., 2005).
The 2OmSRT developed by Leger et al in 1982 has the potential for wide spread
testing in children. Due to the small space required (l2x2l meters) and the validity of the
test when completed on vinyl or rubber surfaces it can be administered in a standard
school gym (Leger & Lambert, 1982). This test was designed as a maximal exertion CV
fitness test for prediction of maximal oxygen uptake (expressed in ml O2lkg/min).
Currently, the 2OmSRT is used as part of the Manitoba physical education curriculum to
test CV fitness in youth and children. The original predictive regression equation for
children was derived by testing 188 boys and girls aged 8-19 years using the 2OmSRT
test protocol and measuring oxygen uptake upon completion of their final stage for 20
seconds using the Douglas bag method (Leger, Mercier, Gadoury, & Lambert, 1988).
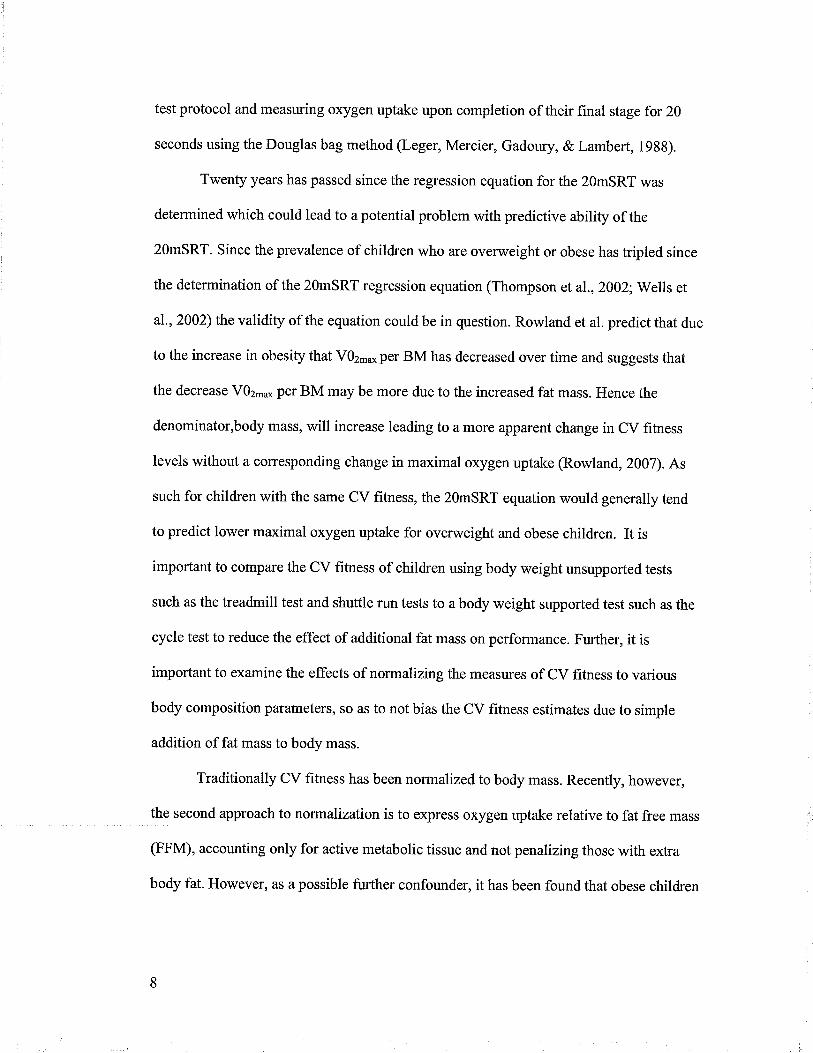
Twenty years has passed since the regression equation for the 2OmSRT was
determined which could lead to a potential problem with predictive ability of the
20mSRT. Since the prevalence of children who are overweight or obese has trþled since
the determination of the 2OmSRT regression equation (Thompson et a1.,2002, Wells et
a1.,2002) the validity of the equation could be in question. Rowland et al. predict that due
to the increase in obesity that VOz-oper BM has decreased over time and suggests that
the decrease V02-* per BM may be more due to the increased fat mass. Hence the
denominator,body mass, will increase leading to a more apparent change in CV fitness
levels without a corresponding change in maximal oxygen uptake (Rowland, 2007). As
such for children with the same CV fitness, the 2OmSRT equation would generally tend
to predict lower maximal oxygen uptake for overweight and obese children. It is
important to compare the CV fitness of children using body weight unsupported tests
such as the treadmill test and shuttle run tests to a body weight supported test such as the
cycle test to reduce the effect of additional fat mass on performance. Further, it is
important to examine the effects of normalizing the measures of CV fitness to various
body composition parameters, so as to not bias the CV fitness estimates due to simple
addition of fat mass to body mass.
Traditionally CV fitness has been normalized to body mass. Recently, however,
the second approach to normalization is to express oxygen uptake relative to fat free mass
(FFM), accounting only for active metabolic tissue and not penalizing those with extra
body fat. However, as a possible further confounder, it has been found that obese children
also tend to have statistically higher lean body mass (ie. greater FFM) than non-obese
children (Goran, Fields, Hunter, Herd, &'Weinsier, 2000; Huttunen, Knip, & Paavilainen,
1986; Maffeis et al., 1994; Souza, Cardoso, Yasbek, & Faintuch,2004). The increase in
FFM in obese children likely arises from the fact that they must canlr extra weight (fat
mass) while walking or running which may cause an increase in muscle mass in the
quadriceps and other gravity dependent muscle groups. Therefore, caution must be used
when assuming that extra body mass through accumulation of fat mass will not be a
factor in the cycle test. As such, methods which assess lower body muscle mass such as
computed tomography (CT), magnetic resonance imaging (MRI), dual energy x-ray
absorptiometry (DEXA) or even skin fold corrected leg girth (SFLG) may be a more
appropriate way to normalize oxygen uptake to account for the possibility of higher lower
lean body mass.
Techniques úllizing the slope of VC0zA/02 before and after the ventilatory
anaerobic threshold (VAT) have also been used to assess CV fitness in children (Tony
Reybrouck, Luc Mertens, Dirk Schepers, Jos Vincloi, & Marc Gewillig, 1997). Slope
was considered a body mass independent parameter, which allows for comparison
regardless of body composition. However, identifoing VAT is subjective and is
conkoversial as inter and intra rater differences are unavoidable (Gaskill et al., 2001).
A confounding factor when examining CV fitness and body composition is
physical activity. Due to the relationship between obesity and physical activity it is
difficult to determine the effect of carrying extra fat mass and not physical activity on CV
fitness. Therefore, studies should account for physical activity but most studies to date
have not controlled for physical activity and those that have conholled did not use

objective measures (Elliot, Goldberg, Kuehl, & Hanna, 1989; Ward et al.,1997).
Despite normalization to various parameters (FFM, BM, FM/FFM, etc), or using
body mass independent parameters (slope from before and after VAT) there is no
definitive answer on the status of CV fitness in obese children at this time. Certainly, we
know that as people age and retain a sedentary lifestyle that CV fitness decreases and is
associated with obesity (Fleg et al., 2005). However, in pre-adolescent children it is not
clear if a decrease in maximal oxygen uptake is as a result of poor CV fitness or the
testing methodology (expression of oxygen uptake, or type of test being overground or
cycle).
The studies reporting on the use of CV fitness tests in the comparison of obese to
non-obese children are equivocal. It stands to reason that de-conditioned children will
have lower CV fitness as assessed by oxygen uptake. Part of the problem in investigating
this issue has been the methodology including sample size (many are small samples),
different forms of body composition categonzation and grouping, and lack of control for
physical activity levels.
Some studies have found that VOz-u,* relative to FFM of obese children is not
significantly different than non-obese children, therefore, concluding that obesity in
otherwise healtþ children is not associated with decreased cardiovascular fitness
(Cooper, Poage, Barstow, & Springer,1990; Elliot et a1., 1989; Goran et al., 2000;
Maffeis et al., 1994; Treuth et al., 1998). In contrast, studies have also found VOz-*
relative to FFM to be significantly lower in obese children than in non-obese children,
therefore, concluding that obese children were seriously unfit (Huttunen et al., 1986;
Souza et al., 2004, Ward et al., 1997). When normalizing oxygen uptake to body
10
composition indicators, such as FFM, the CV fitness of obese children regardless of
protocol, running or cycling, is unknown. It is necessary to be able to assess the CV
fitness ofchildren to establish appropriate age dependent prevention and intervention
programs.
Summary
With the number of obese children increasing it is important to elucidate the
cardiovascular fitness status ofobese children. It has been suggested that decreased
maximal oxygen uptake (ml/kg/min) could be an issue due to the inflated size-
normalizing factor (BM) and not CV fitness. In order to assess this, we require tests that
evaluate CV fitness in children where the impact of obesity (fat mass) does not pre-
dispose obese children to a lower CV fitness score. One such method is the cycle test,
which is body mass independent. However, the common method to test CV fitness in
children in Manitoba schools is to utilize the 20mSRT. Therefore, a comparison
between two tests is necessary to determine the ability of the 2OmSRT to predict CV
fitness in children. Further, this study set out to evaluate different forms of normalization
of maximal oxygen uptake derived from the cycle test (that is to also examine oxygen
uptake relative to FFM and BM). This study set out to compare the maximal oxygen
uptake between the two tests (2OmSRT and cycle test) and to examine the re-expression
of maximal oxygen uptake in term of FFM and SFLG across body composition, while
accounting for physical activity.
11

Statement of the Problern
The purpose of this study is twofold. The first purpose is to compare the maximal
oxygen uptake between the 2OmSRT and the cycle ergometer tests in prepubescent
children. The second purpose is to compare the oxygen uptake using various
normalization factors (BM, FFM and SFLG) between different body composition
categories or along the continuum while accounting for physical activity.
The relationship befween maximal oxygen uptake and body composition will be
examined using two methods. The f,rrst will use a categorical approach with three
categories (non-overweight (5Z0%BF), overweight (20.I-25.0 %BF) and obese
(25.O+%BF). The second method will use a continuous approach, using a straight
comparison between BF data and oxygen uptake, while controlling for physical activity
level.
In order to evaluate each test's ability to assess CV fitness, the maximal oxygen
uptake will be compared between males and females since it has been established that
females have greater adiposity, lower physical activity level and cardiovascular fitness
(Cragg, Cameron, Craig, & Russell, 1999; Elliot et al., 1989).
72
Hypotheses
The hypotheses are not ordered according to the puq)oses but are organized in a
manner that allow for a more logical flow in the development of the results and
discussion.
1. Sex Difference. Males will have on average a greater maximal oxygen uptake than
females for both the 2OmSRT and cycle test independent of means of expression
(l/min, mllkg/min, ml/kg FFM /min, ml/mm SFLG/min).
2. Physical Activity. Physical activity represented by average daily step counts and step
carriage will be positively correlated to FFM and SFLG, and negatively correlated to
BMI, BF, and FM.
3. 2OnSRT. Children with increased adiposity will have lower maximal oxygen uptake
than those with less adiposity regardless of expression (l/min, ml/kg/min, ml/kg
FFlwmin, or ml/mm SFLG/min) for the 2OmsRT when %BF is expressed
categorically (acceptable body composition %BF< 20, overweight %BF 20.I-25.0 and
obese, %BF 25.0+) and on a continuum even when accounting for physical activity.
13

4. cycle. children with increased adiposity (%F.F, assessed using skin fold
measurements) will have lower maximal oxygen uptake than those with less adiposity
independent of expression (l/min, mlll<glmin, mlikg FFI\{/min, or ml/mm SFLG/min)
on the cycle when %BF is expressed categorically or on a continuum even when
accounting for physical activity.
5. 2OmSRT and Cycle. There will be a significant positive cor relation between
maximal oxygen uptake derived from the cycle test and 2OmSRT independent of
means of expression (l/min, ml/,<glmin, mllkg FFM /min, ml/mm SFLG/min).
t4
Review of Literature
This section is broken into fwo parts. The first part addresses CV fitness and
expression, as well the recommended methods for CV assessment. The second part
discusses the findings of several studies on the CV fitness of obese children. However,
the CV fitness in children remains equivocal because many of the studies are confounded
by their testing protocols, methods used to classiff obese and non-obese children,
techniques to assess physical activity, age ofthe subjects, and subject numbers.
GV FitnessCardiovascular fitness has been defined as the ability of the heart and blood
vessels to supply nutrients and oxygen to the muscles during sustained exercise (Kent,
1994). The usual measure of the capacity of the body to deliver and utilize oxygen is
maximal oxygen uptake (VOr.*). This measurement provides information on CV fitness
as it is been found to be highly correlated to cardiac output (Astrand & Rodahl, 1970)
One of the main criteria defining "true" VOz-o during an exercise test for adults
is the presence of a plateau in oxygen uptake with increasing workloads. If no plateau is
reached it is considered peak VOz. However, a study by Rowland et al. (1983) reported
that 213 of the children did not show a plateau and that there was no increase in peak V02
when working at a supra-maximal level (Rowland et al, 1983). Therefore, the study
concluded that utilizing V02plateau is not a good criteria to define a maximal tests in
children and also that peak VOz is equivalent to V0z-* in children and can therefore be
used interchangeably.
15
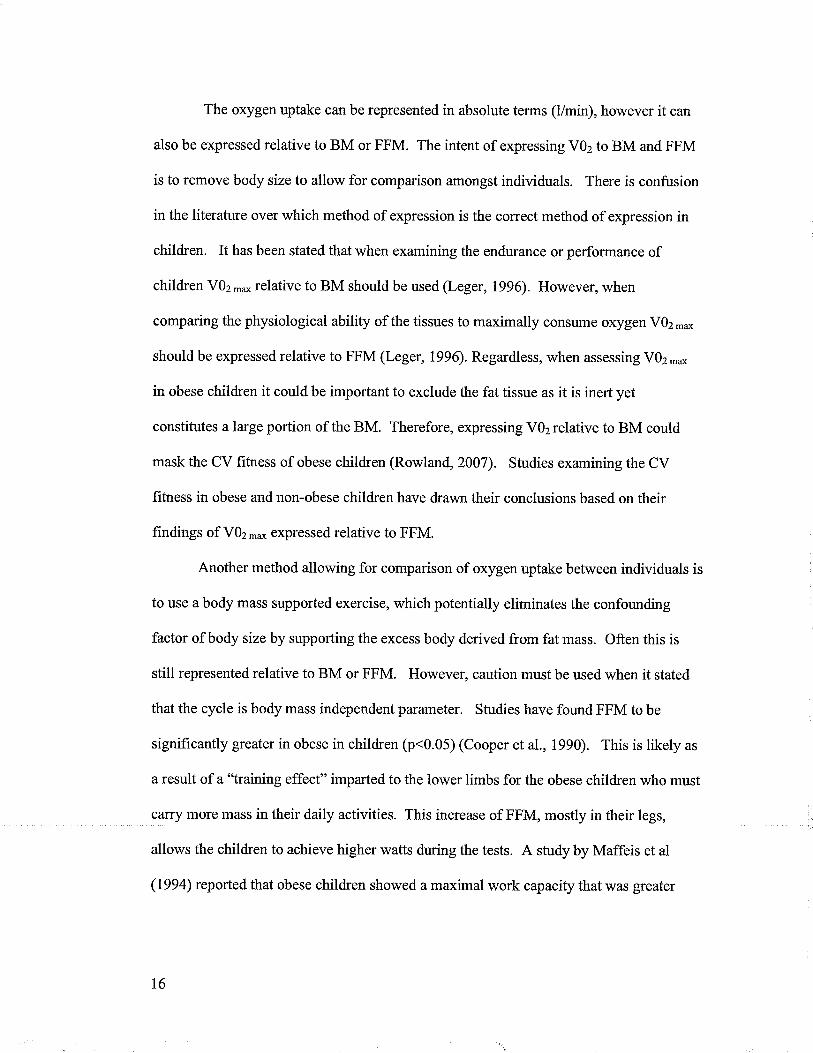
The oxygen uptake can be represented in absolute terms (l/min), however it can
also be expressed relative to BM or FFM. The intent of expressing VOz to BM and FFM
is to remove body size to allow for comparison amongst individuals. There is confusion
in the literature over which method of expression is the correct method of expression in
children. It has been stated that when examining the endurance or performance of
children VOz-* relative to BM should be used (Leger, 1996). However, when
comparing the physiological ability of the tissues to maximally consume oxygen VOz-o
should be expressed relative to FFM (Leger, 1996). Regardless, when assessing VOz-*
in obese children it could be important to exclude the fat tissue as it is inert yet
constitutes a large portion of the BM. Therefore, expressing V02relative to BM could
mask the CV fitness of obese children (Rowland, 2007). Studies examining the CV
fitness in obese and non-obese children have drawn their conclusions based on their
findings of V02-* expressed relative to FFM.
Another method allowing for comparison of oxygen uptake between individuals is
to use a body mass supported exercise, which potentially eliminates the confounding
factor of body size by supporting the excess body derived from fat mass. Often this is
still represented relative to BM or FFM. However, caution must be used when it stated
that the cycle is body mass independent parameter. Studies have found FFM to be
significantly greater in obese in children (p<0.05) (Cooper et al., 1990). This is likely as
a result of a "training effect" imparted to the lower limbs for the obese children who must
carry more mass in their daily activities. This increase of FFM, mostly in their legs,
allows the children to achieve higher watts during the tests. A study by Maffeis et al
(1994) reported that obese children showed a maximal work capacity that was greater
t6
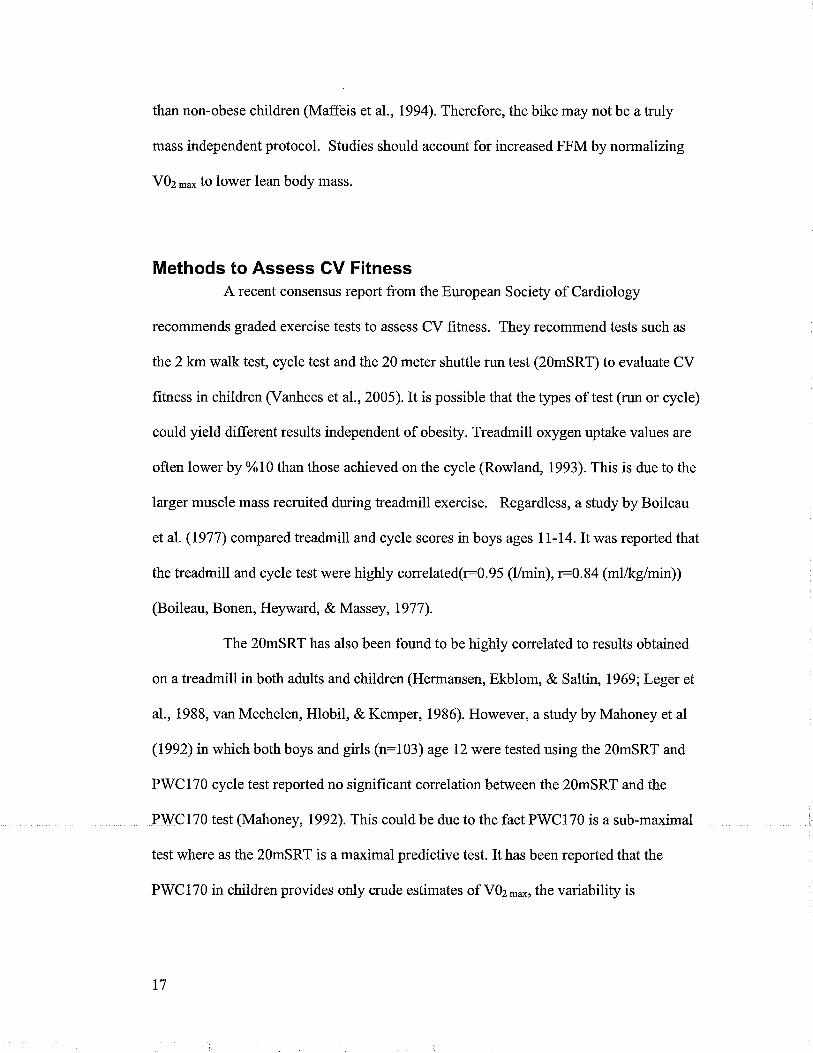
than non-obese children (Maffeis et aI., 1994). Therefore, the bike may not be a truly
mass independent protocol. Studies should account for increased FFM by normalizing
Y}z-^to lower lean body mass.
Methods to Assess CV FitnessA recent consensus report from the European Society ofCardiology
recommends graded exercise tests to assess CV fitness. They recommend tests such as
the 2km walk test, cycle test and the 20 meter shuttle run test (2OmSRT) to evaluate CV
fitness in children (Vanhees et a1., 2005). It is possible that the types of test (run or cycle)
could yield different results independent of obesify. Treadmill oxygen uptake values are
often lower by %10 than those achieved on the cycle (Rowland, 1993). This is due to the
larger muscle mass recruited during treadmill exercise. Regardless, a study by Boileau
et al. (1977) compared treadmill and cycle scores in boys ages 1l-l4.Itwas reported that
the treadmill and cycle test were highly correlated(r:0.95 (limin), r:0.84 (ml/kg/min))
(Boileau, Bonen, Heyward, & Massey, 1977).
The 2OmSRT has also been found to be highly correlated to results obtained
on a treadmill in both adults and children (Hermansen, Ekblom, & Saltin, 1969; Leger et
a1., 1988, van Mechelen, Hlobil, & Kemper, 1986). However, a study by Mahoney et al
(1992) in which both boys and girls (n:103) age 12 were tested using the 2OmSRT and
PWC170 cycle test reported no significant correlation between the 2OmSRT and the
PWC170 test (Mahoney, 7992). This could be due to the fact PWC170 is a sub-maximal
test where as the 2OmSRT is a maximal predictive test. It has been reported that the
PWC170 in children provides only crude estimates of VOz-o, the variability is
t7
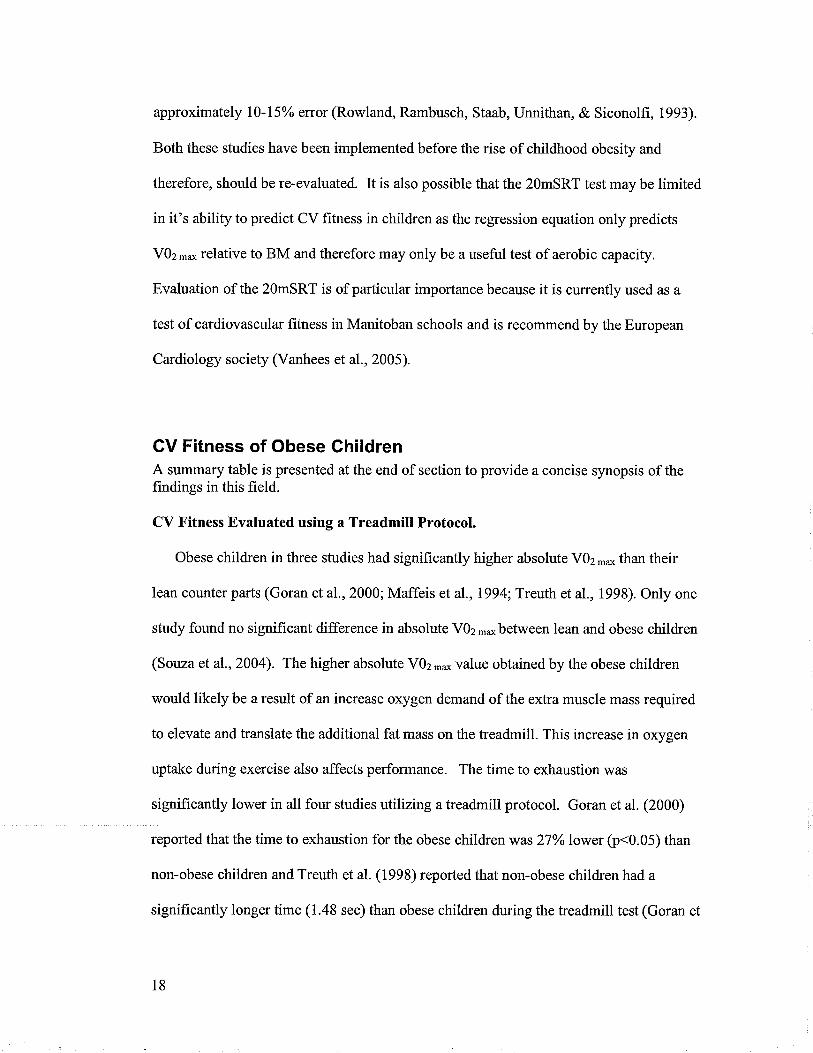
approximately I0-I5Yo error (Rowland, Rambusch, Staab, Unnithan, & Siconolfi, 1993).
Both these studies have been implemented before the rise of childhood obesity and
therefore, should be re-evaluated. It is also possible that the 2OmSRT test may be limited
in it's ability to predict CV fitness in children as the regression equation only predicts
VOz -o relative to BM and therefore may only be a useful test of aerobic capacity.
Evaluation of the 2OmSRT is of particular importance because it is currently used as a
test of cardiovascular fitness in Manitoban schools and is recommend by the European
Cardiology society (Vanhees et al., 2005).
GV Fitness of Obese ChildrenA summary table is presented at the end of section to provide a concise synopsis of thefindings in this field.
CV Fitness Evaluated using a TreadmÍll Protocol.
Obese children in three studies had signif,rcantly higher absolute VOz-* than their
lean counter parts (Goran et al., 2000; Maffeis et a1.,1994; Treuth et a1., 1998). Only one
study found no significant difference in absolute VOz -o between lean and obese children
(Souza et a1.,2004). The higher absolute VOz-o value obtained by the obese children
would likely be a result of an increase oxygen demand of the extra muscle mass required
to elevate and translate the additional fat mass on the treadmill. This increase in oxygen
uptake during exercise also affects performance. The time to exhaustion was
significantly lower in all four studies utilizing a treadmill protocol. Goran et al. (2000)
reported that the time to exhaustion for the obese children was 27Yo lower þ<0.05) than
non-obese children and Treuth et al. (1998) reported that non-obese children had a
significantly longer time (1.48 sec) than obese children during the treadmill test (Goran et
18
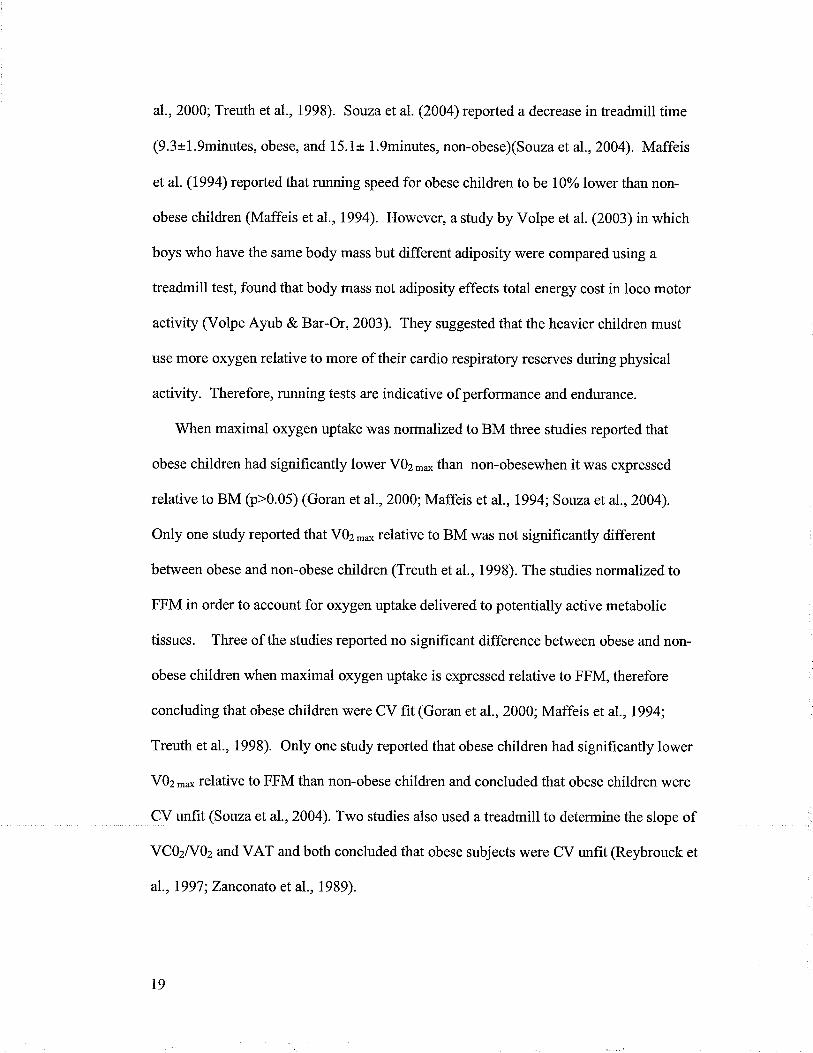
a1.,2000; Treuth et a1., 1998). Souza et al. (2004) reported a decrease in headmill time
(9.3't1.9minutes, obese, and 15.1* 1.9minutes, non-obese)(Souza eta1.,2004). Maffeis
et al. (1994) reported that running speed for obese children tobe l\Yo lower than non-
obese children (Maffeis et a1.,1994). However, a study by Volpe et al. (2003) in which
boys who have the same body mass but different adiposity were compared using a
treadmill test, found that body mass not adiposity effects total energy cost in loco motor
activity (Volpe Ayub & Bar-Or, 2003). They suggested that the heavier children must
use more oxygen relative to more of their cardio respiratory reserves during physical
activity. Therefore, running tests are indicative ofperformance and endurance.
When maximal oxygen uptake was normalizedto BM three studies reported that
obese children had significantly lower VOz -* than non-obesewhen it was expressed
relative to BM (p>0.05) (Goran et al., 2000; Maffeis et al., 1994; Souza et a1.,2004).
Only one study reported that VOz-* relative to BM was not significantly different
between obese and non-obese children (Treuth et al., 1998). The studies normalized to
FFM in order to account for oxygen uptake delivered to potentially active metabolic
tissues. Three of the studies reported no significant difference between obese and non-
obese children when maximal oxygen uptake is expressed relative to FFM, therefore
concluding that obese children were CV fit (Goran et a1., 2000; Maffeis et a1.,1994;
Treuth et al., 1998). Only one study reported that obese children had significantly lower
VOz-* relative to FFM than non-obese children and concluded that obese children were
CV unfit (Souza et a1.,2004). Two studies also used a treadmill to determine the slope of
YC}zN}z and VAT and both concluded that obese subjects were CV unfrt (Reybrouck et
a1.,1997;Zanconato et al., 1989).
I9
From the treadmill studies it is difficult to determine the CV fitness of obese children
as three studies concluded obese children do not have reduced CV fitness (Goran et a1.,
2000; Maffeis et al, 1994; Treuth et al., 1998) and three studies concluded CV f,rtness to
be reduced in obese children (Reybrouck et al., t997; Souza et a1.,2000; Zanconato et al.,
198e).
Evaluation of Studies Using a Cycle Protocol to assess CV fitnessFive studies used a cycle protocol, three used indirect calorimetry to measure
V0z.* (Elliot et al., 1989; Huthrnen et al., 1986; Maffeis et al., 1994), one predicted
VOz-o using the PWC170 sub-maximal test (Ward et al., 1997) and one measured the
difference between unloaded pedaling on the cycle and anaerobic threshold (Cooper et
al., 1990). Regardless of testing protocols measuring maximal oxygen uptake it was
found that absolute V0z.* was not significantly different between obese and non-obese
children (Cooper et al., 1990; Elliot et al., 1989; Huthrnen et al., 1986; Ward et al.,
1997). Unlike the treadmill, the cycle is to some extent body weight supported and
therefore, obese children do not require greater energy to move their larger bodies, as
they must do in loco motor exercise (running/walking). When oxygen uptake is
expressed relative to BM three studies reported lower VOz-* in obese children than their
lean counter parts (p<0.01XHuttunen et al., 1986; Maffeis et al., t994; Ward et al.,
1997). However, when expressed relative to FFM Maffeis et al (1994) and Ward et al
(1997) found no significant difference between obese and non-obese children ( Maffeis et
al.,1994; Ward et al., 1997). In contrast, Hutlunen et al. (1986) reported a significant
difference between obese and non-obese children (Huttunen et al., 1986). Cooper et al.
(1990) found obese children did not have significantly increased A VOz or Aanaerobic
20

threshold as compared to the non-obese children. Therefore, concluding that obese
children were CV fit.
From the cycle studies three studies concluded that obese children do not have
reduced fitness (Cooper et a1.,1990; Elliot et al., 1989; Maffeis et al. 1994) and two
studies reported that obese children do have reduced CV fitness (Huttunen et a1., 1986;
Ward et al,1997).
There is no def,rnitive answer on the status of CV fitness of children of different body
compostions from any of the studies. The variation in findings may be due to the
confounding effect different protocols and measurements, physical activity measurement,
obesity classification, age of the subjects, small subject numbers and even the year in
which the study was performed. Each of these issues will be discussed individually in the
following pages.
Assessment of Different Protocols (Treadmill, Gycle) and Measurements(Ventilatory Anaerobic Threshold)
TreadmillThree treadmill studies increased the workload by increasing the gradient of the
treadmill (Goran eta1.,2000; Reybrouck etal.,1997;Zanconato et al., 1989) and only
one study increased the work load by increasing speed (Maffeis et al., 1994). The impact
of evaluating CV fitness using a steep gtade on the headmill may have signif,rcant
differential impact on obese children (Treuth et a1., 1998). The high slope the obese
children walk/run may cause local calf fatigue, which could force termination of the test
before VOz-* is reached (Rowland, 1993). A speed test maybe more appropriate, and
may generate a smaller bias between obese and non-obese children. Also, a speed test
2l
may represent more accurately the way in which children play and assess terrestrial
physical work capacity better, but not necessarily CV fitness. However, the treadmill
protocols may be more benef,tcial than cycle protocols as the researcher can control the
speed and grade where as it can be diffïcult on non-mechanically braked cycles for the
subjects to maintain the pace (Rowland, 1993). However, the cycle is a more body mass
independent method of activity and therefore, helps eliminate the effect of fat mass in
order to make better comparisons.
CycleComparison of the cycle study results is also difficult as the studies utilized both
indirect calorimetry (Huttunen et al., 1986; Elliot et al., 1989) and the change in V02-*
and VOz measured during'tnloaded" pedaling (Cooper et al., 1990), and sub-maximal
testing ( Ward et al., 1997). Obese children did not have significantly increased A VOz or
Aanaerobic threshold as compared to the non-obese children. However, unloaded
pedaling would not indicate the same level of workload between obese and lean subjects,
as the moment of inertia of the limbs would be gteater for obese subjects resulting in
higher workloads during "unloaded" pedaling for their group. Ward et al (1997) used a
sub maximal test, PWC170 cycle test, with 3 minute stages at HR of 120 BPM, 150 BPM
and 180 BPM to predict Y}z at 170 BPM (Ward et al., 1997). The use of sub maximal
test is not the best indicator of CV fitness in children as the variability can be wide (10-
15Yo enor at one standard deviation)(Rowland et al., 1993). The differing protocols
make comparisons amongst studies difficult and therefore the CV fitness of obese
children is definitive.
22
Ventilatory An aerobic Threshold
A study by Zanconato et al(1989) used VAT to assess CV fitness (Zanconato et
al., 1989). The VAT was assessed using a treadmill protocol but a limitation to this
study was that the VAT was not expressed relative to FFM and therefore, comparison to
other studies is limited. Another study by Reybrouck et al (1997) examined the effect of
body composition on cardiovascular f,ttness using the slope of VC0zlY}zbefore and after
the ventilatory anaerobic threshold (Reybrouck et al., 1997). This is touted as a body
mass independent measurement of oxygen uptake. The slope calculated above the VAT
was much steeper in the obese subjects (1.3t0.2) than non-obese (1.10*0.2). This was
interpreted as indicating that obese subjects had reduced CV fitness. However, the
difficulty in interpretation of a precise point of the ventilatory threshold also restricts the
utility of the f,rndings. Also, studies have found that in children VAT is not identifiable in
18% of subjects due to erratic breathing (Hebestreit, Staschen, & Hebestreit, 2000).
Body Gomposition Classification
Also, there is no consistent definition for obesity and body composition
categorization. Studies have used various techniques to measure body composition
including mass height ratios, triceps skin-fold thickness and BMI percentile cutoffs
(Cooper et aL.,1990; Elliot et al., 1989; Hutlunen et al., 1986; Maffeis et a|.,1994;
Reybrouck et al., 1997; Souza et a1.,2004; Zanconato et a1., 1989) . Only one study
utilized BF to define obesity (Goran et a1., 2000). Percentiles change with population
changes and therefore, as the children have become more obese over the past decades
longitudinal comparisons amongst studies may not be possible. In addition, all of the
23

studies reviewed had only two categories, obese and non-obese. Only three studies had
body composition categories in which overweight children were not grouped with obese
children or with those children with acceptable body composition (Goran et a1.,2000;
Maffeis et a1.,1994; Souza et a1.,2004). Classifuing acceptable body composition and
overweight subjects together could affect the results. It may mask differences between
those children with acceptable body compositions and obese and overweight. One
approach to avoid the classification issues is to treat adiposity as a continuous variable or
to categonze into two or more categories (i.e. obese, overweight and lean).
Physical Activity Measurement
There is inconsistency in the methods to assess physical activity performed in
studies examining CV fitness in prepubescent children. Four studies examined physical
activity using self-reporting questionnaires @lliot et a1., 1989; Huttunen et al., 1986;
Ward et al, 1997; Zanconato et al., 1989) and only one study examined actual energ.y
expenditure of the prepubescent children (Treuth et al., 1998). Two of the studies found
that physical activity was reduced concomitant with maximal oxygen uptake (Ward et al.,
1997; Zanconato et a1., 1989). However, the study by Zanconato et al (1989) assessed
maximal oxygen uptake relative to body mass and therefore, might not be a true
reflection of CV fitness for children carrying excess adipose (Zanconato et al., 1989).
A study by Elliot found that CV fitness was the same befween obese and non-
obese siblings but physical activity was significantly lower in obese sibling when
compared to the non-obese sibling @lliot et al., 1989). Another study reported that
physical activity was the same for both the obese and non-obese children but that CV
fitness was significantly lower in obese subjects (Huthrnen et a1., 1986).
24
There are some limitations in the utilization of questionnaires completed by
parents in assessing physical activity levels of their children. When answering
questionnaires parents tend to overestimate their child's activity levels and intensity of
their activity (Bender, Brownson, Elliott, & Haire-Joshu, 2005). Also, it may be even
more difücult for a parent to accurately complete the questionnaire on behalf of their
child as the parent does not witness the activity of their child while at school. Although
not as quick and convenient as a questionnaire, objective measurements such as doubly
labeled water, pedometers and accelerometers are valid and reliable in the assessments of
physical activity (Nichols, Morgan, Sarkin, Sallis, & Calfas, 1999; Ravussin, Harper,
Rising, & Bogardus, 1991; Tudor-Locke, Williams, Reis, & Pluto, 2002). Only one
study utilized an objective measurement (doubly labeled water) to assess energy
expenditure and reported that energy expenditure was signifîcantly greater in obese
children than their lean counterparts (Treuth et a1., 1998). However, physical activity
(total energy expenditure/basil metabolic rate) and CV fîtness was not significantly
different in obese and non-obese children. Therefore, energ.y expenditure and physical
activity are not necessarily the same, as obese children must expend more energy (to
move their increased body mass) during equal amounts of physical activþ than their lean
counter parts. The inter-relationship between childhood physical activity, CV f,rtness and
body composition has not been well studied.
Age and Maximal Oxygen Uptake
Many of the studies are confounded by the fact that they included both
prepubescent and pubescent subjects. Four of the studies had subjects that were
pubertal or post pubertal (Cooper et al., 1990; Elliot et al., 1989; Huthrnen et al., 1986;
25
Maffeis et a1.,1994). Maximal oxygen uptake increases with age from childhood to
adolescent. However, at puberty the rate at which maximal oxygen uptake rises with age
increases more rapidly for boys due to the increase in muscle mass during puberty
(Armstrong & Welsman, 1994). Also during puberty there is an increase in sedentary
lifestyle compared to children (Armstrong & Welsman, 1994; Carspersen, Pereira, &
Curran, 2000). Therefore, the mixing of boys and girls, and pubertal and prepubertal
subjects, may also have increased the variability of measurements in physical activity and
energy expenditure potentially disguising some of the differences in the results by
increasing variability. Therefore it is difficult to make any conclusion on prepubescent
children only.
Subject Number
Five studies had a small sample size and therefore may have suffered from failing
to show differences or showing differences due to the effect of individuals (Cooper et al.,
1990; Elliot et al., 1989; Maffeis et aL.,1994; Reybrouck et aL.,1997; Treuth et a1.,
1998). The small sample sizes also limit the gerneralizability of the studies. However,
in six of the studies the subject number in the obese categories was the same, or higher
with obese subjects being over represented (Goran et a1., 2000; Huthrnen et al., 1986;
Maffeis etal.,1994; Reybrouck etal.,1997; Souza eta1.,2004; Treuthetal., 1998). This
is not consistent with the literature in which many studies have less obese subjects than
non-obese subjects. Five studies had differing number of subjects in their categories
(Cooper et al., 1990; Maffeis etal.,1994; Souza et al., 2000; Zanconato et al., 1989).
However, this is not a problem for analysis as there are three methods to address in which
26

the findings can be verified. First, one can examine the relationship without
categonzation where one would adopt correlation of continuous variables (eg body fat
and maximal oxygen uptake) as a means to identifu the effect of body composition of CV
fitness. Second is a technique called "boot strapping" to generate artificially larger
sample sizes but this technique has only recently been adopted (Hopkins,2007).
Differing cell sizes is also not an issue if there are three or more categories as, Anova is
still acceptable with larger overall sample sizes as ANOVA is robust to small deviations
in sample sizes (Hopkins, 2007).
Summary
In summary, there are different methods of VOz expression (eg. normalized to BM
or FFM). There is some confusion as to the interpretation of what each method of
normalization means (eg. BM may measure performance, FFM the physiological ability
of the tissues to maximally consume oxygen). There is also concern over the CV testing
methods (2 mile walk test, 20mSRT, and cycle test) as each could yield different results
regardless of obesity. To date, the CV fitness in prepubescent children and in particular
obese children is unknown. Only one study using a treadmill protocol reported reduced
CV fitness in children who were obese (Souza eta1.,2004). However, half of the cycle
studies reported lower cardiovascular fitness of obese children (Hutfunen et a1., 1986;
Ward et al., t997). Two studies found obese children to have a reduced CV status
determined by using the slope of VCOz versus V0zand VAT (Reybrouck et al., 1997; S.
Zanconato et al., 1989). However, the inconsistent findings could be athibuted to the
protocols differences (treadmill versus treadmill based upon speed or grade, and treadmill
versus cycle) and to the definition of obesity and classification of children which have
27

been different among studies. Further, f,rve studies (Cooper et al., 1990; Elliot et al.,
1989; Maffeis et al., 1994; Reybrouck et al., 1997; Treuth et a1., 1998) had very small
sample sizes and therefore may have suffered from failing to show differences or
showing differences due to the effect of individuals and five studies included subjects
who were pubertal or posþubertal. The effect of physical activity on CV fitness is not
clear with four (Elliot et al., 1989; Huttunen et a1., 1986; Ward et al., 19971. Zanconato et
al., 1989) of five studies (Treuth et a1., 1998) using self report questionnaires completed
by parents on behalf of the children, which could have systematic bias in representing
actual physical activity. The impact of physical activity needs to be addressed as a
possible confounder to the obesity & oxygen uptake relationship. Further study is
required to establish this relationship using increased sample sizes and well controlled
techniques.
28

Study
Goran et al.(2000)
SubjectNumber andAseN:39 (obese)N:39 (non-obese)Age: 9.6t1.3years)
Protocol
Treuth et al(1 ee8)
Graded treadmillprotocol
Started 0% gradeand speed of4krn/hr for 4 minthen increasedgrade by 10%until20% afterwhich speedincreased
ObesifyClassificationMethod
N:12 obesegirlsN:12 non-obese girlsAge:7-10 yrs
o/oBF >30,obeseo/oBF <20, non-obese
Assessed usingDEXA
Souza et al(2000)
PhysicalActivityMeasurement
Graded treadmillprotocol
Started at l0%o,
increased grade2.5o/o every 2 minuntil 22.5o/o afterlvhich speed wasincreased by0.6mph
N/A
N:40, obese
N:16, non-obese
Age: 6-l I
Findings(Obese results, Non-Obese)* p'0.05
Obese , > 95'npercentileNon-obese. 10-95'l'percentile
Assessed usingmass to heightratio
V02n u* @/min)( 1 .56*0.40, I .24*0.27)*
VOzn,o* (ml/kg/min)(32.0+4.1,44.2t3.2) *
VOzno* (m1/kgFFM/min)(59 .2*4.9 , 57 .9+5 .8)
Graded treadmillprotocol (Bruce)
29
Double labeledwater
Conclusion
Obese, BMI >95th percentileNon-obese,BMI between5o'h-75'hpercentile
V0z.o* (ml/min)(682*121 , 47 3* .7)*
V0z,o* adjusted BM(rnl/min)(570+21,585t24)
V02,,0* adjusted FFM(ml/min)(580t24,575+24)
Obesechildren donot havereducedfitness
N/A V02n,o* (l/min)(1.54*0.42,1.4t.35)
V0z,o* (ml/kg/min)(29.9*6.7 , 47 .2*5.3)*
V02n,o* (m1/kgFFM/min)(50.9* 10.8, 47 .2*5.3)x
Obesechildren donot havereducedfitness
Obesechildren havereduced CVfitness

Study
Maffeis et al.(1ee4)
SubjectNumber andAseN:14, obese
N:8, non-obese
Age: 9.510.8years
Protocol
Treadmill, speed
in creased 1km/hrevery minute
CycleWorkloadincreased 25Wevery minute
ObesityClassificationMethod
Obese, massgreater than20% ideal mass
for age andheightNon-obese-t0%-10%(50'h percentilemass to heighQ
Elliot et al(1 e8e)
PhysicalActivityMeasurement
N:33, obese
N-33, non-obese
Age: 9-18years
N/A
Findings(Obese results, Non-Obese)* p<0.05
Incremental cycletest
TreadmillV02."* (l/min)(l .5 5 t0.29, 1.23=0.22)*
V0z,u* (ml/kg/min)(33.5*5.8,40.2*6.6)*
V02."* (ml/kgFFM/min)(47 .4r7 .6, 48.2=6.9)
CycleV0z.o* (l/min)(1.40+0.21, 1.16=0.2)
VOz-"* (ml/kg/min)(29.2*4.2,39.8r4.6)*
VOz.o* Qrl/kgFFM/min)(41 .4x.6.2,45.9r3 .5)
30
Obesity, tricepsskin foldthickness >85'l'percentile,
Conclusion
Obesechildren donot havereducedfitness
Questionnairecompleted byparents
Obese childrenless active thannon-obesechildren
V02."* (l/min)(2.4r5.9,2.2*6.7)
V0z,no* (ml/kg/min)(26.9=5.4,39.5t5.8)*
V0z,oo* Qnl/kgFFM/min)(45.7+7.2.45.1=6.8)
Obesechildren donot havereducedfitness
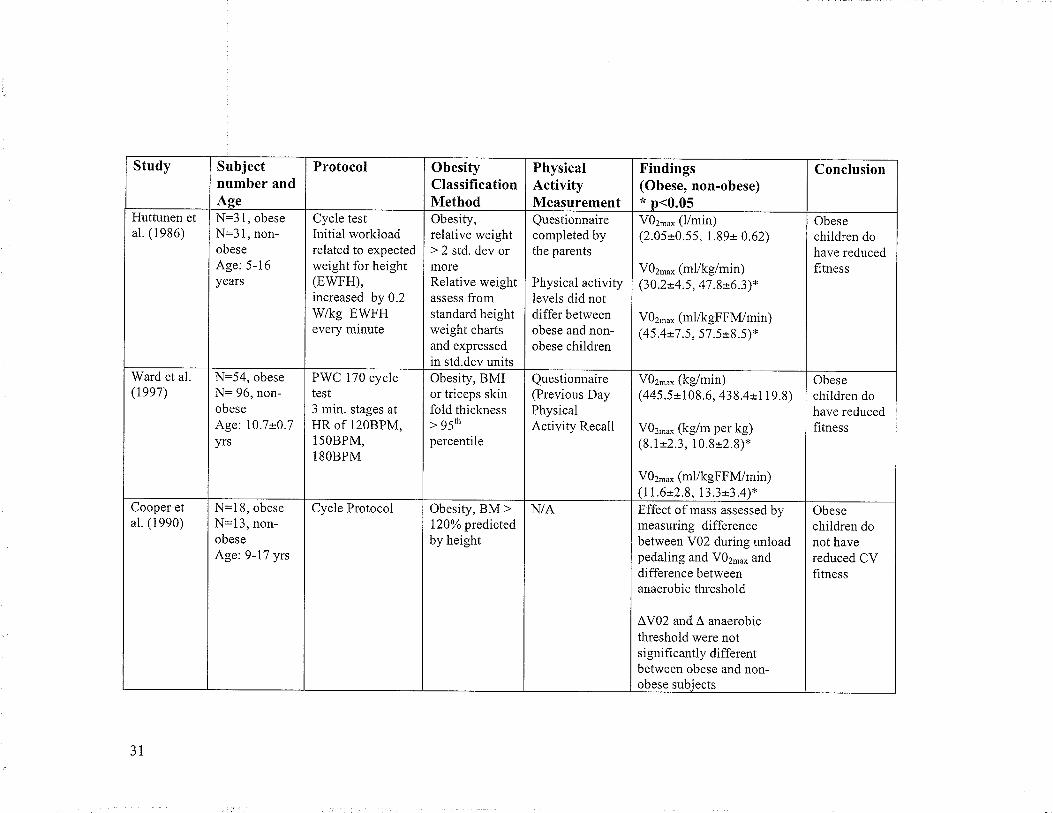
Study
Huttunen etal. (1986)
Subjectnumber andAseN:3 I, obeseN:3 1, non-obese
Age: 5-16years
Protocol
Ward et al.(lee7)
Cycle testInitial workloadrelated to expectedweight for height(EWFH),increased by 0.2Wkg EWFHevery minute
N:54, obese
N= 96, non-obese
Age: 10.7*0.7yrs
ObesityClassificationMethod
Cooper etal. (1990)
Obesity,relative weight> 2 std. dev ormoreRelative weightassess fromstandard heightweight chartsand expressedin std.dev units
PWC 170 cycletest3 min. stages atHR of 120BPM,15OBPM,l8OBPM
PhysicalActivityMeasurement
N=l8, obese
N:13, non-obeseAge: 9-17 yrs
Questionnairecompleted bythe parents
Physical activitylevels did notdiffer betweenobese and non-obese children
Findings(Obese, non-obese)* n<0.05
Obesity, BMIor triceps skinfold thickness> g5'h
percentile
Cycle Protocol
V02,,o* (l/min)(2.05*0.55, 1.89r 0.62)
V02,,0* (ml/kg/min)(30 .2*4.5 , 47 .8*6 .3)*
V0z,n* (m1/kgFFM/min)(45.4=7 .5,57.5*8.5)*
3T
Questionnaire(Previous DayPhysicalActivity Recall
Obesity, BM >120% predictedby height
Conclusion
V0z-o* (kg/min)(445.5+108.6, 438.4t1 1 9.8)
V02."* (kg/m per kg)(8.1*2.3, 10.8=2.8)*
V0z,u* (ml/kgFFM/min)(11.6t2.8, 13.3t3.4)*
Obesechildren dohave reducedfitness
N/A Effect ofrnass assessed bymeasuring differencebetween V02 during unloadpedaling and V02',0* anddifference betweenanaerobic threshold
ÂV02 and À anaerobicthreshold were notsi gnifi cantly differentbetween obese and non-obese subiects
Obesechildren dohave reducedhtness
Obesechildren donot havereduced CVfitness

Study
Reybrouck et
al. (1997)
SubjectNumber andAseN:29, obeseN:29, non-obese
Age: 5-15 yrs
Protocol
Graded treadmillInitial speed
5.6km/hr, gradeincreased by 2%every minute
Zanconato et
al. (1989)
ObesityClassificationMethod
N: 23, obese
N:37, non-obeseAge: 9-14years
BMI, cut-offvalues unclearMean BMIobese 25.0*3.8Mean BMInon-obeseI 8.0=3 .2
PhysicalActivityMeasurement
Graded treadmillprotocol
N/A
Findings(Obese results, No n-Obese)* p.o.os
Obesity, > 20o/o
ideal mass forage and height
CV fitness assessed bycalculating the slope (VC02/V02), before and after VAT.
VAT significantly lower inobese subjects than non-obese subjects (p<0.05)
Slope was significantlysteeper (1.3t0.2) for obese
children than non-obesechildren (1.10t0.2)
3¿
Questionnairecompleted byparents
Conclusion
Obesechildren dohave reducedf,rtness
Used VAT to determine CVfitnessVAT (ml/kg/min)signihcantly lower in obesechildren than non-obesecounteroarts (o<0.00 1 )
Obesechildren dohave reducedfitness

Methods
Design
This was a cross-sectional assessment of pre-pubescent school age children. The
study was designed to address the potential problem of assessing CV fitness in children
who have substantial adipose tissue accumulation. In so doing, this study is stronger than
other studies in the area by:
1) Measuring physical activity through step counts. Other studies used selÊreports to
measure physical activity. No study used an objective measure of physical
activity. Physical activity is important to measure because not all lean children
are active, and there may be some obese children that are active.
2) This study design has a larger sample size than most of the other studies
attempting to evaluate cardiovascular fitness of children.
3) This sfudy treats adipose as a continuous variable, as well as categorization into
groups (three categories instead of two). The design does not combine
overweight into the acceptable body composition class but rather heats it as a
separate class. It also uses a rational approach to determine categories whereas
other studies used percentiles and other methods to categorize subjects.
4) This study also measures CV fitness using a running speed test (as opposed to a
graded (elevation) treadmill test) for comparison to cycle ergometry.
5) SFLG was assessed to help to control for the issue of greater LBM in lower limbs
in obese subjects.
JJ
Subjects
Children of both sexes aged 8- 10 years of age were recruited through 3 public
schools, 1 private school and a home schooling association in Winnipeg, Manitoba.
Written consent was obtained from the parents/guardians of the subjects and verbal assent
was obtained from the child. See Appendix A and Appendix B for parental information
forms, consent forms and the verbal script to obtain child assent. Permission from the
school principal was obtained to collect the data in the public and private schools.
Subjects were excluded from participating in the study if they had a physical or mental
handicap, severe asthma, attention deficit hlperactivity disorder (ADHD), diabetes, or
other health conditions that did not allow them to perform a maximal effort test. Ethical
approval was received from the Education/f,lursing Research Ethics Board at the
University of Manitoba.
Sample Size
A power analysis aids in determining the sample size required to succeed in
detecting a genuine difference based upon estimated expected differences and observed
variance. The minimum number of subjects required to assess a difference between obese
and non-obese children in the dependent variable, VOz-* per FFM (ml/kg FFlvf/min) was
determined. An alpha value of 0.05 and power level of 0.8 were used. Two power
analysis calculations were performed as follows.
Using the data from the study by Maffeis et al. (1994) standard deviation of 3.65
ml/kg FFM/min was used (Maffeis et al., 1994). In addition, for the power analysis the
mean difference (4.5 mllkg FFlll/min) between groups was established by using the
34

maximal oxygen uptake for overweight and obese children (41.4 ml/kgFFlM/min) and for
non-obese children (45.9 mlll<gFFl\4/min). The minimum number established was 16
overweight or obese and 16 non-obese.
A power analysis was also used in order to determine the minimum number of
subjects required to assess a difference in V02 -* per FFM (ml/kg FFI\{/min) between
obese and non-obese children using variance and mean differences for a treadmill
protocol. The variances and mean differences used in the pov/er calculation were
determined by referring to a study by Treuth and colleagues (Treuth et al., 1998). Based
upon the reported means and variances, 20 overweight or obese and20 non-obese
subjects are needed per group.
In the case of this study, which has separated the group of children into three
groups, the sample size calculation is adequate and appropriate since the primary
comparison is still between the obese and non-overweight (Hopkins, 2007). There is not
an inflation of the Type I elror, so there is no need to perform all comparisons between
the three body composition groups. The rationalization of the three categories provides
additional validify to the study beyond the statistical benef,ts of illustrating a continuous
relationship. In addition, the sample size determination is also suitable (N being greater
than 32 corresponding to 1 6 + 1 6) for the examination of the relationship between
continuous variables (BF and V02).
35
Measurements
Body Gomposition
Each child's height, body mass, leg girth and skin fold measurements were
recorded. Prior to body mass and height measurements the child was asked to remove
their shoes. Body mass (kg) was measured using a digital scale and height (cm) was
measured using a tape measure posted to the wall. Body mass index
(height(cm)/mass(kg)2) was derived. Skin fold (mm) measurements (Harpenden Skin
Fold Calipers) were taken at the right triceps, calf and subscapular areas in triplicate
(Slaughter et a1., 1988). The mean \¡/as calculated for each site. If the calculated
variation was greater than 5Yo from the mean, the skin fold measurement furthest from
the two other measurements was dropped. Percent body fat was calculated using two of
the Slaughter regression equations (shown below) - BFl with the mean triceps and calf
(BFl) and BF2 with triceps and sub scapular (Slaughter et al., 1988). The Slaughter
equations for predicting percent body fat have high correlations (r=0.82 to 0.96) with body
fat measured by DEXA @isenmann etal.,2oo4). However, when compared to DEXA the
skin fold equations such as Slaughter underestimate percent body fat @isenmann et al.,
2004). Fat mass (FM) and fat free mass (FFM) were derived from the measured body
mass and derived body fat using the equations below.
The children were categorized into different body composition categories using
BF1, BF2 and BMI (see Appendix D). The BMI international age dependent cut-off
values were used to classi$r the children into three categories, acceptable body
composition, overweight and obese. However, after reviewing the data BMI yielded a
dishibution under-representing obese category, which is consistent with the literature and
36
also given that BMI is less specific and sensitive than skin folds for assessment of
adipose tissue accumulation, BF was used for further body composition categorization.
Similar results were observed independent of the classif,rcation method and completely
consistent with the observed relationship between continuous variables (Appendix
D).The thresholds chosen (%BF) were <20, 20.1-25, and25.0+ for the analysis. BFI and
BF2 were highly correlated but BFI was chosen as the variable to represent BF as it had
improved correlations relative to BMI, SFLG, and FFM. The classification method used
BF>20% because it is known as the cutoff for blood borne marker expression for those
children with increased risk of CV disease factors (Dwyer &F,lizzard, 1996).
Equation 1. BFl
Females: Percent Body Fat = 0.610 (triceps + calf) + 5.1
Males: Percent Body Fat= 0.735 (triceps + caþ +1.0
Equation 2. BF2
Females: 1.33 (hiceps * sub scapular) - 0.13 (hiceps * sub scapular)2-2.5
Males: 1.21 (triceps f sub scapular) - 0.008 (triceps f sub scapular)2 -1.7
Equation 3. Fat Mass & Fat Free Mass
Fat Mass (ke) : Body Mass - {(%F.Fl100) * Body Mass}
Fat Free Mass (kg) : Body Mass - Fat Mass
Skin Fold Corrected Leg Girth
The length of thigh (greater trochanter to medial chondyle of tibia) was measured to
JI

assess the mid-point. At the mid-point, a skin fold measurement (Harpenden Skin Fold
Calipers) was taken in triplicate and the girth was measured using a tape measure. The
mean for the site was calculated. If the calculated variation was above SYo themean was
adjusted by dropping the skin fold measurement firthest from the two other
measurements. Stewart and Tothill (2002) found the SFLG measurement valid in
predicting fat free mass volume in the thigh (Stewart and,Tothill, 2002).However, this
method has not been validated in severely obese individuals.
Equation 4. Skin Fold Corrected Les Girth
Skin fold corrected leg girth (mm) : Leg girth - n (skin fold)
38
Gardiovascular Fitness Assessments
20mSRT
The test consisted of the subject running back and forth on a 20 meter(m) course
and touching the 20 m lines at the same time as a prerecorded audio CD emitted a timing
sound. 20 meters was measured to the nearest 0.01 meters (Digi-Roller Plus, Calculated
Industries, Carson City, Nevada, USA). The lines were marked with cones. The subjects
were instructed to have both feet on or behind the line and were reminded during the test
if they did not follow this rule. This test was conducted in a gym during regular school
hours in groups of six. In addition, apacer participated in the 2OmSRT. The pacer led the
students to maximize their effort and provided verbal encouragement. Each subject wore
an electro transmitting chest strap (Polar T31 or T61) and a wristwatch receiver (Polar
E600 or 6i80). The test started with subjects running at a speed of 8.5 lÍn/hr. The speed
was increased 0.5 km/hr every minute, with each increase in speed corresponding to a
level or stage. 'When the subject could no longer keep pace with the timing signal and
missed touching the 20 m line in time with the timing signal two times that subject's test
was complete. The last partial and completed stages were recorded. A partially completed
stage is recorded as the number of shuttles run in that stage. Each stage has a given
number of shuttles that are completed in the one-minute. The number of shuttles
increases every two-three minutes. For example, stage I has seven shuttles and stage 3
has 8. The maximal effort speed (km/hr) in the last fuIl stage is used to predict V0z-*.
The test has also been validated in children and predicted VOz -* for children is
39

calculated with the speed and age (years) using the following equation (Leger et a1.,
1988).
Equation 5. 2OmSRT Predicted vor-"@
VOz ** (ml/kg/min) : 3 1. 025+3.23 8 Speed -3.248 Ãge+0. I 53 6 (Age* Speed)
In order to compare children the equation was altered to account for FFM and
SFLG. The calculated V02-* relative to body mass, using the equation above was
multiplied by the subject's body mass to obtain absolute VOz-* (l/min). The absolute
VOz-* was then expressed relative to FFM and SFLG derived from the body
composition data. This method has not been validated in the literature and was used for
exploration.
Equation 6. 2OmSRT Predicted V0" -"*û&!!)sg!!g,VOz** (l/min) = [{31.025+3.238 Speed-3.2484ger0.1536 (Age*Speed)}*BM] /1000
Equation 7. 2OmSRT Predicted V0.'""@
VOz-* lml/kg FFN4/min¡: [{31.025+3.238 Speed-3.2484ge1-0.1536 (Age*Speed)}*BM]IFFM
Equation 8. 2OmSRT Predicted V0" -"
VOz-* lml/mm SFLG/min¡: [{31.025+3.238 Speed-3.248{se+0.1536 (Age*Speed)}+BM/SFLG
40

Gycle Test
Oxygen uptake \¡/as measured while the subject performed a maximal cycle
(Monark 818 Ergomedic) test. The seat was adjusted so the knee was slightly flexed
when the pedal was at its lowest position. The feet were strapped to the pedals and the
handlebars were adjusted until comfortable for the subject. If the seat was still too high
for a subject when lowered as far as possible, wooden blocks (8.5 cm X 37.7 cm X 3.6
cm) were strapped to the pedals using zip ties. During the testing each subject wore an
electro-transmitter around the chest to transmit HR signal (Polar coded T31). Subjects
were instructed to pedal at 60 RPM for the duration of the test. An initial workload of 41
W (0.67 kp @ 60 RPM) was applied. The workload increased by 15 W (0.25 kp) every
minute. One-minute stages were chosen to help keep the children engaged during the test.
The test was terminated when the subject reached volitional fatigue or could no longer
maintain the revolution rate. Verbal encouragement was provided to help the subject
achieve a maximal test.
Maximal EffoÉ during 2OmSRT and Gycle Tests
For adults to achieve a true V0z-* there must be a plateau in oxygen uptake with
increasing workloads. However, a study by Rowland et al. (1983) found that a VOz
plateau is not a good criteria to define a maximal tests in children as 213 did not attain one
(Rowland et al., 1983). They also found that peak VOz is equivalent to VOz.* in
children. This study will use the term VOz.* and it will be def,rned utilizing heart rate
and respiratory exchange ratio (RER) when possible (Rowland et al., 1983).
4t

For the 2OmSRT, maximal effort was assessed using heart rate. Maximal exercise
effort on the cycle was defined according to heart rate and respiratory exchange ratio. It is
important to have validated maximal effort to exclude the effects of motivation from
influencing the performance, or the effects of selective muscle fatigue.
Heart rate: Rowland recommends that a running test be deemed maximal if a
heart of >190bpm is achieved as it accounts for variation in heart rates (Rowland, 1993).
If the subject achieved a heart rate >190 BPM during the 20mSRT, it was deemed
maximal. If the subject achieved a heart rate >180 BPM during the cycle test it was
deemed maximal. A slightly lower value (180 versus 190BPM) for the cycle test was
used as a smaller total muscle mass is know to be recruited in cycling.
Respiratory exchange ratio: Cycling RER in children can range from 1.02 to 1.11
(Hansen, Frober, Nielsen, & Hyldebrandt, 1989; Tanner, Heise, & Barber, 1985)). During
the cycle test the subjects must obtain a RER >1.05, an average determined to be deemed
a maximal test (Rowland,1993). RER was not measured during the 2OmsRT.
If a subject did not achieve aheartrate ) 19OBPM they were asked to repeat it on
another day. All those that needed to repeat the 2OmSRT test were able to do so with
more than a day between testing. If a subject met one of the fwo criteria for the cycle test
(HRà 180BPM, RER >1.05) then the test was deemed maximal.
42

lndirect Galorimetry
Cardiovascular fitness was determined using indirect calorimetry during the cycle
test. The oxygen uptake (ml/min) and COz production was assessed using an automated
metabolic system (SensorMedics@, Yorba Linda, Ca). Subjects' oxygen uptake (FIO¡%)
and carbon dioxide (FECO¡%) production was measured breath by breath. The gas
analyzers was calibrated every fourth test using a two-point calibration method with two
sets of gase s (26% 0z and 0.4o/o C02; 16 o/o 02, 0% C}z). The flow sensor was calibrated
before testing sessions using a 3-liter calibration syringe. Subjects wore a nose clip and
Hans Rudolph pediatric mouthpiece attached to a micro guard filter and flow sensor
clipped to a headpiece for support. VOz -* was calculated using 10 point averaging of
breath-by-breath data. Sub-maximal VOz was calculated at minute three, (52.9W,0.92
kp), and minute five (83.5W,I.421<p,) by averaging the last 30 seconds of the stage.
43

Assessment of Physical Activity Levels
Each subject was given a pedometer (SC-T2, Stepscount.com) to wear on their
right hip along the right mid-axillary line for seven days (5 weekdays and 2 weekend
days). This position has been found to be optimal for step count accuracy (Horvath,
Taylor, Marsh, & Kriellaars,2006). Subjects were instructed to put the pedometer on
after rising from bed in the morning. The pedometer was to be worn at all times, except
when sleeping, bathing or swimming. The subjects were asked to record their steps prior
to bed and any activities they participated in during the day on the log sheet provided for
the seven days (Appendix C). The number of steps taken per day has been found to be a
valid measured of physical activity as the pedometer correlated highly (r: 0.86) with
accelerometers (Tudor-Locke et a1.,2002). The average daily step count for those who
had between two and seven days of pedometry data with step counts greater than 500
during a single day were used to calculate average daily physical activity. The average
weekday and weekend steps were computed. A new parameter, step carriage, was derived
as an estimate of energy expenditure. Step carriage is the product of the mean step count
and the body mass. Step carriage represents the amount of load (BM and FM and FFM)
that must be carried as a result of gait. This variable is being used in an exploratory
manner.
44
Statistical Analysis
Sex Differences
Differences between boys and girls for anthropometric measurements, physical
activity, and maximal oxygen uptake as well as other measures of the 2OmSRT and cycle
test and were evaluated using independent t-tests.
Physical Activity
Correlation was performed on the average daily step count and body composition
parameters (8F1, BMI, FM, FFM, SFLG, FMÆFM and a1l maximal oxygen uptake
measures). Significance level was set at p< 0.05.
The 2OnSRT
One way, univariate ANOVA was performed on body composition categories (as
a factor) for each of the four measures of maximal oxygen uptake per test (20mSRT and
cycle). In addition ANCOVA was performed using sex and physical activity as the
covariates. Specifically, the impact of physical activity (covariate) on the four maximal
oxygen uptake measures (dependent, multivariate) that were examined for each category
of body composition (factor). Associations between %BF as continuous and maximal
oxygen uptake (expressed in absolute terms and relative to BM, FFM, SFLG) were
assessed using Pearson product correlation. Partial correlations were also performed
controlling for average daily step count and step carriage.
Cycle Test
The same statistical methods used above for the 2OmSRT were also used to
analyze the cycle test data.
45

The 2OnSRT and Cycle Test
Associations between 2OmSRT and the cycle test were assessed using Pearson
product correlation. Partial correlations were also performed conholling for sex and
physical activity. In the case of these correlations, case-wise deletion was used resulting
in equal number of subjects (i.e. the N size was equal to the lesser of the two).
Variation in cell sizes
There are two issues regarding sample size to contend with in this study. The first
is the issue of small differences in the number of subjects employed in the univariate
ANOVAs that were repeated for each of the four different methods of normalization.
This is a of negligible concern, as the total subject number for each test (cycle and
2OmSRT) was greater than 50, so a reducti on in 2 or 3 subjects between dependent
variables being tested results in no detectable differences in variance, or biases due to the
effect of a single case, or for that matter does not alter any of the underlying assumptions
of ANOVA.
There are three approaches in dealing with missing data, one is to ignore the
influence, which is acceptable with larger N sizes. The second option is to perform case-
wise deletion which removes otherwise valid data, and third is to perform data imputation
(fill the missing values with estimates derived from the rest of the sample). In this study,
the difference in sample size was no larger than 3 subjects between dependent variables,
and the primary maximal oxygen uptake dependent variables (expressed relative to BM
and FFM) were the same size. As such, the assumption of normality between each of the
46
univariate ANOVAs per dependent variable would not be violated from small subject
number differences with such alarge sample size.
The second issue, and possibly the more severe, is the comparison of different
sample sizes in each body composition category during one-\¡/ay ANOVA (three body
composition categories as the factor). By random sampling techniques of children within
a class within a school, the likelihood of having the same number of children in each
body composition category is highly unlikely, as the sampling will normally depict the
actual distribution in each category (which is the case in this study). This results in an
unbalanced design. In reality the effect of different sizes in each cell, may result in some
small violations of equal variances between groups which would have little practical
effect on the analysis, while other violations may render the one-way blocked ANOVA
result incorrect. In order to examine this effect of unbalanced sizes it is imperative that
the researcher examine the variances between groups and as long as the variances are
similar (i.e. there is no significant skewing in variance) the ANOVA will be robust and
provide reasonable answers. The effect of non-uniform variance can be substantive in
very small samples. This study has a moderate sample size, and is also protected by the
fact that a validation check for results of the ANOVAs was obtained by correlation
between continuous variables (yielding similar results). If the between categories
variances are unequal, then the likelihood of incorrectly reporting a signif,rcant difference
in the means when none exists increases. This chance is greater when the population
variances are very different from each other, particularly if there is one sample variance
very much larger than the others. As such, the variance befween categories was
examined to insure that a serious violation of the uniform variance rule was not
47
occurring. It is readily apparent when examining the standard deviation bars and values
for the datathat there a uniform variance was observed. This approach to the analysis is
suitable for this design and experimental question (Tom Hassard, Biostatistician
University of Manitoba, personal communication, June 17,2008).
Further, all previous studies published using categorical approaches have used
unbalanced designs without explanation of methods used to insure that statistical
inferences were not biased by the imbalance. To a lesser extent the comparisons between
males and females is also subject to this problem, but in this case both tests (assumption
ofequal variance and unequal variance) were used and both results provided identical
statistical inferences.
48

Results
The subject characteristics are presented first, the remaining results are presented
in order of hypothesis (sex differences, physical activity, 2OmSRT, cycle, and 2OmSRT
and cycle).
Descriptive Results
Subject CharacteristicsSeventy-eight children participated in the study. The characteristics of the
subjects are reported in Table 1. As expected for pre-pubescent children, there were no
statistical differences in age, mass or height between boys and girls. Although of note,
there was a non-statistical, but greater body mass (3.3 kg) for the females.
Table 1. Characteristics of subjects.Mean (SD) are reported.
Boys(n:34)
GirIs(n:44)
Overall
Age (years) 9.e (0.81) 10.0 (0.81) 9.9 (0.80)Mass (kg) 3s.9 (8.1s) 39.2 0t.6r\ 37.8 t10.33)
Height (cm) 142.2 (8.30) 142.6 (6.76\ 142.4 (7.43\No significant differences in height, mass and age between sexes (independent t- test).
CharacterÍstics of the Schools
The subjects were recruited from three public schools, one private school and a
home schooling association. One public school was situated in a low socioeconomic
neighborhood. The other two public schools were situated in the south end of Winnipeg
in medium to high socio-economic neighborhoods. The private school children were
from affluent families. Children recruited from the home school association were
educated at home by their parent(s). These children lived in various parts of the city of
Winnipeg and surrounding rural areas.
49
Body Composition
This study provided various body composition measures (Table 2) inctuding BMI
derived from height and mass, BFI and BF2 derived from skin folds, FM and FFM
derived from BM and BFI and BF2, as well as SFLG derived from girth and skin fold of
the upper thigh. BMI was not significantly different between the boys and girls (p:0.94)
consistent with no differences in height or mass in pre-pubescent children. It is important
to note the trend for BMI and BM was to have the average female values greater than the
males consistent with the findings for BF. Independent t-tests were performed to assess
differences (Table 2) and correlations were performed to examine relationships (Table 3)
among body composition measures. A common body composition indicator reported in
the literature is FM to FFM ratio, and it is reported in this thesis for comparison. The
difference in fat mass between sexes \¡/as approaching signif,rcance (p: 0.064),
50
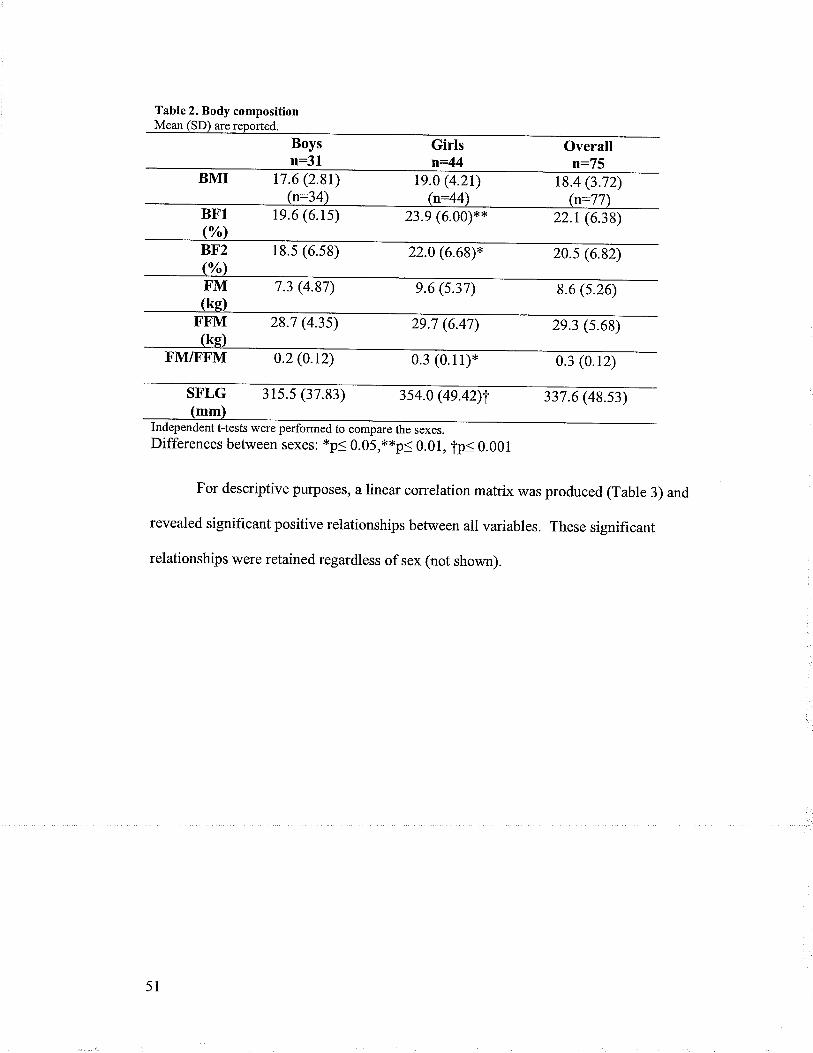
Table 2. Body composition
n:31Girlsn=44
Overalln: /5
17.6 (2.81) Ie.o (4.2r) 18.4 (3.72)t=44
1e.6 (6.1s) 23.9 (6.00)** 22.t (6.38)
18.s (6.s8) 22.0 (6.68)* 20.s (6.82)
7.3 (4.87) e.6 (s.37) 8.6 (s.26)
28.7 (4.35) 29.7 (6.47\ 2e.3 (s.68)
FM/FFM 0.2 (0.12) 0.3 (0.11)* 0.3 (0.12)
SFLG 3ts.s (37.83) 3s4.0 (4e.42)l 337.6 (48.s3)mm
Independent t-tests were performed to compare the sexes.Differences between sexes: *p< 0.05,**p< 0.01, TpS 0.001
For descriptive purposes, a linear correlation matrix was produced (Table 3) and
revealed significant positive relationships between all variables. These significant
relationships were retained regardless of sex (not shown).
51
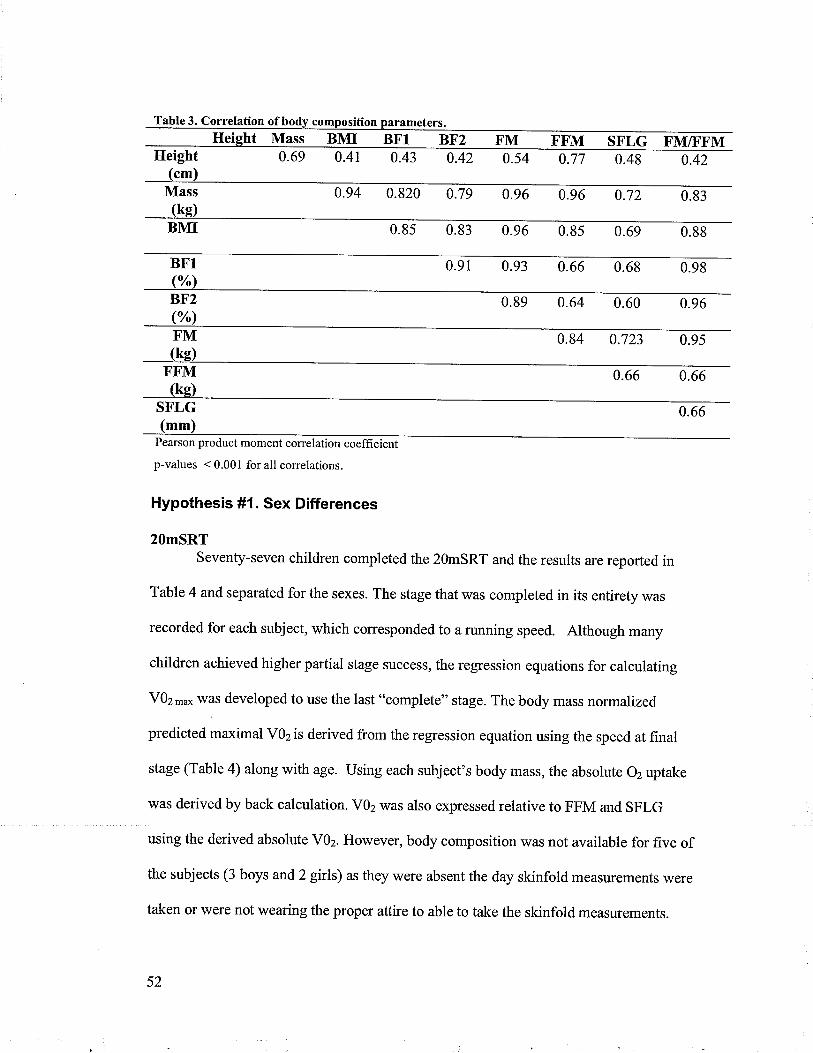
Table 3. Correlation of
Ileightht Mass BMI BFl BF2 F'M FFM SFLG FM/FFM
0.69 0.41 0.43 0.42 0.54 0.77 0.48 0.42
0.820 0.79 0.96 0.96 0.72 0.83
BMI 0.85 0.83 0.96 0.8s 0.69 0.88
BFl 0.93 0.66 0.68 0.98
0.89 0.64 0.60 0.96
0.84
BF2
F'M
(kg)SFLG 0.66(mm
Pearson product moment correlation coefficient
p-values < 0.001 for all correlations.
Hypothesis #1. Sex Differences
20mSRTSeventy-seven children completed the 2OmSRT and the results are reported in
Table 4 and,separated for the sexes. The stage that was completed in its entirety was
recorded for each subject, which corresponded to a running speed. Although many
children achieved higher partial stage success, the regression equations for calculating
VOz-* was developed to use the last "complete" stage. The body mass normalized
predicted maximal VOz is derived from the regression equation using the speed at final
stage (Table 4) along with age. Using each subject's body mass, the absolute 02 uptake
was derived by back calculation. VOz was also expressed relative to FFM and SFLG
using the derived absolute V02. However, body composition was not available for five of
the subjects (3 boys and 2 girls) as they were absent the day skinfold measurements were
taken or were not wearing the proper attire to able to take the skinfold measurements.
52

Heart rate was important in determining that maximal exertion and exhaustion
was achieved upon test termination, as opposed to termination due to motivation. Based
on our criteria only three subjects failed to meet either of the criteria (fR ¿ 190 positive
talk test). This high rate of achievement may be due to the presence of a pacer or "rabbit,
for each of the shuttle run tests and the factthatthe sfudents were aware that effort was
being monitored. End stage or maximal HR (Table 4) was not significantly different
between the sexes indicating that motivation was not a factor in differences observed
between the boys and girls.
Table 4. Maximal 2OmSRT results.Mean (SD) are reported.
Boysn:34
Girlsn:43
OverallN:77
Stage 4.1 (r.76) 3.1 (1.41)* 3.5 (1.6s)
Speed 10.0 (0.88) 9.s (0.71)* e.7 ( 0.83)km/h
V0z 1.7 (0.36) t.7 (0.43) t.7 (0.3e)tn
V0z 46.7 (3.80) 40.0 (3.46)xx 4s.2 (3.8s)mlnV0z s8.1 (6.32) s7.3 (4.26) s7.6 (s.20)
FFM/min n:31V0z s.3 (O.ee) 4.7 (0.72)**
n:74s.0 (0.8e)
mUmmSFLG/min n:31200.9 (r2.se)
(n:28)HR
(BPIVI)
n:41 n:7te9.8 (8.2e) 200.3 ( 10.34)
(n:35) ln:63)Independent t-tests were used to detect significant differences betrveen sexes.tp<O.05,**p<0.01
Cycle TestFifty-seven subjects (n:30 girls,n:27 boys) of the seventy-eight subjects
participated in the cycle test. The reduction in sample size was primarily due to
requirement for transportation to the testing facility, as opposed to ease of evaluation in
the school. The measured absolute V02 (l/min) \¡/as expressed relative to BM, FFM, and
53
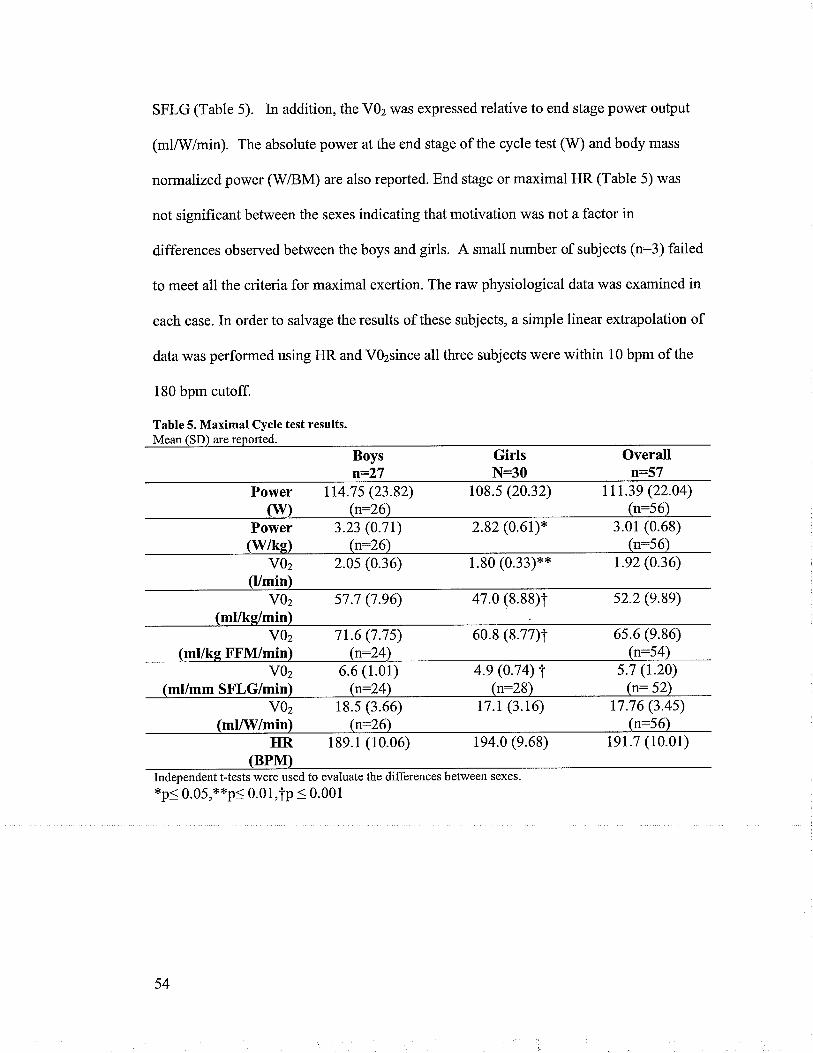
SFLG (Table 5). In addition, the VOz was expressed relative to end stage power ouþut
(ml/!V/min). The absolute power at the end stage of the cycle test (W) and body mass
normalized power (WiBM) are also reported. End stage or maximal HR (Table 5) was
not signif,rcant between the sexes indicating that motivation was not a factor in
differences observed between the boys and girls. A small number of subjects (n:3) failed
to meet all the criteria for maximal exertion. The raw physiological datawas examined in
each case. In order to salvage the results of these subjects, a simple linear extrapolation of
data was performed using HR and V0zsince all three subjects were within 10 bpm of the
180 bpm cutoff.
Table 5. Maximal Cycle test results.Mean ISD) are reported.
Boysn:2'7
GirlsN:30
Overalln:57
Power lr4.7s (23.82) 108.s (20.32) 111.39 (22.04)(\il) (n:26\ (n:56)
Power 3.23 (0.71) 2.82 (0.6t)* 3.01 (0.68)(wke) (n:26) (n:s6)
voz 2.05 (0.36)(l/mÍn)
1.80 (0.33)** t.e2 (0.36)
vOz s7.7 (7.96) 47.0 (8.88)T s2.2 (e.9e)
vOz 7t.6 (7.7s) 60.8 (8.77)T 6s.6 (e.86)(ml/ke FFM/min) (n:24) (n:54)
voz 6.6 (1.0r) 4.e (0.74) I(ml/mm SFLG/min'¡ (rr-24]' (n:28)
s.7 (r.20)(n:52)
vOz 18.s (3.66) r7.t (3.16) 17.76 (3.4s)(mlAil/min¡ (n:26) (n:56)
HR 18e.1 (10.06)(BPIVT)
194.0 (e.68) 1e1.7 (10.01)
Independent t-tests were used to evaluate the differences between sexes.*p< 0.05,**p< 0.01,tp < 0.001
54

Sub-maximal Cycle Test
The average heart rates were calculated for the last 30 seconds of two sub-
maximal stages: 52.9W (0.9 kp, 60 rpm, stage 3) and 83.5V/ (I.42kp,60 rpm, stage 5).
The results are reported in Table 6. HR was statistically different between stages
þ<0.05) for both sexes, and the heart rate was higher for girls at the same pov/er output
levels. The change in heart rate per unit change in power output (^HR/AW) was higher
for girls but not statistically.
Table 6. Sub maximal Cycle test results.Mean (SD) are reported.
Boysn:24
Girlsn:28
Overalln:52
HR at 52.9W 138.7 (15.46) a t53.7 (21.85)**, b(bpm) (n:24) (r27)
146.9 (20.47)(n:50)
HR at 83.sW t62.2 (17.00) a 178.9 (16.75)T, b(bpm) (n:23\ (n:27)
17t.4 (18.70)(n:51)
^HR/AW0.8 (0.2e) 0.e (0.48)(¡:23\ (n:27)
0.8 (0.40)(n:50)
Independent t-tests were used to evaluate the differences between sexes and stages.
Differences between sexes: *p< 0.05,**p< 0.01, TpS 0.001Differences between stages: a - statistical difference (dependent t-test) between stages forboys, b- difference in stages for girls
Hypothesis #2. Physical Activity
The average daily step count for each day worn (Monday -Sunday) is illustrated
in Figure 1. The children '\¡/ore the pedometers and recorded the results over an average
of almost six days (mean of 5.81) of a total possible seven days.
55

ooCLq,
U)
å(úo
.âl-o-
,(sø-
20000 l18000 -]-r6ooo +14000 -f-12000 l-loooo f-sooo il6000 ff l
4ooo il2ooo H0+
^ò"\rô'
\ù. ..""'" ^""t'. -e -'"C .""-"
Day
Figure 1. Mean (SD) daily step count for weekday and weekend days.
The seven-day average daily step count, as well as the weekend and weekday
averages are illustrated in Table 7. Subjects data was only included if they had more than
two days of pedometry data with step count >500. Females had signifîcantly lower mean
v/eekday step counts (1581 less steps).
Table 7. Daily step counts.Mean ¡rSTll arc rcnnrfe¡l
Boysn:26
GÍrls Overalln:35 n:61
Average daily stepcount
(steps/dav)
10918 (3331) e45r (3203) t0077 (3312)
Average weekday stepcount
(steps/day)
1rr49 (3640) 9s68 (3121)* t0242(34rs)
Average weekend dailystep count(steps/dav)
e6s2 (4es3) 9381 (4999) 9488 (4e23)
Average daily step 391234 (132627)carriage
(step count x mass(ke))
360823 (134071) 37378s (133210)
Independent t-tests were performed.* p< 0.05 denotes significant difference between sexes
56

Correlation was performed on the avetage daity step count and body composition
parameters (8F1, BMI, FM, FFM, SFLG, FMÆFM). A signif,rcant negative relationship
ftr<0.025) was observed between average daily step count and BMI (r-0.308), FM (r_-
0.302), FMÆFM (r-0.302), SFLG (r*-0.313), and BFl (r:-0.3l2)(Figure 2). There was
no significant correlation befween average daily step count and FFM (r:0.189). Step
carriage and BFlwas not correlated (r:0.209)(Figure 3), but step carriage was correlated
to FM (r:-0.275, p:0.035) and FFM (r-0.407, p0.001). Further study of step carriage
as an energ-y expenditure indicator is warranted.
20000
1 8000
16000
14000
12000
1 0000
8000
6000
4000
2000
0
BF ("/")
Figure 2. Relationship between average daily step count and body fat.Best fit line is shown (r: -0.312,p:0.016).
Ë,
oC)a.oU)
àõooct(ll
o
57
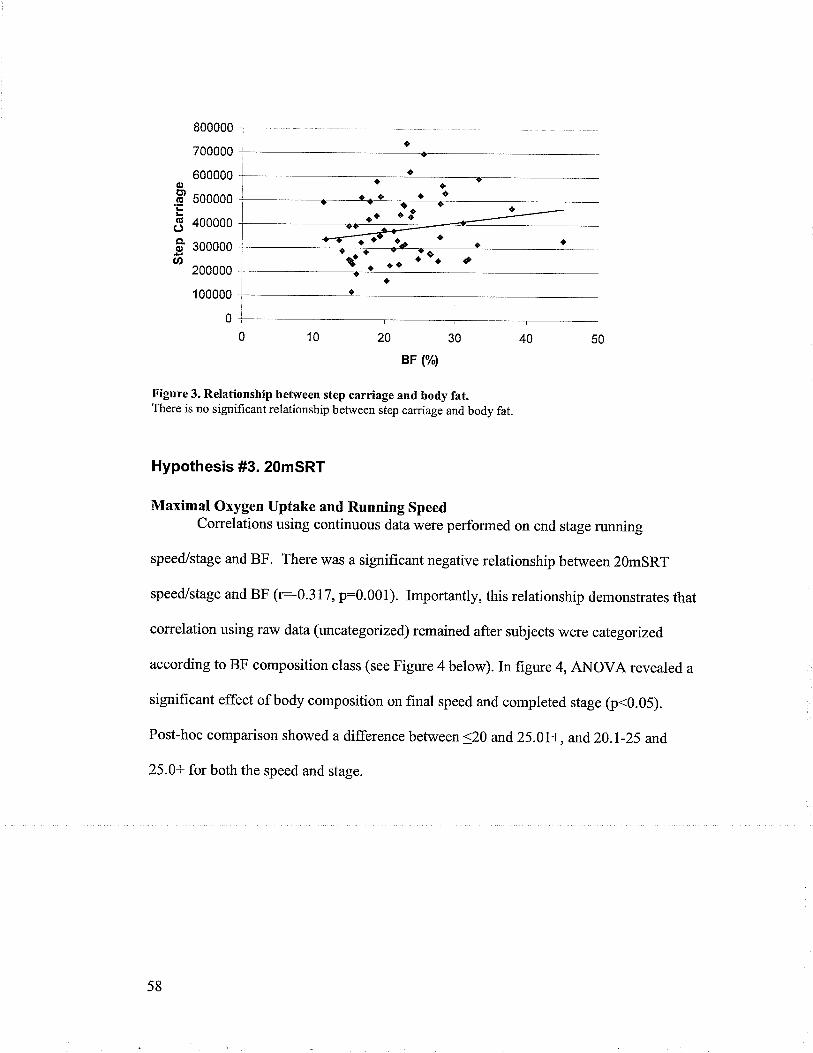
oê àtôa- a
aaa
800000
700000
600000
500000
400000
300000
200000
I 00000
0
BF ("/")
Figure 3. Relationship between step carriage and body fat.There is no significant relationship between step carriage and body fat.
Hypothesis #3. 2OmSRT
Maximal Orygen Uptake and Running Speedcorrelations using continuous data were performed on end stage running
speed/stage and BF. There was a significant negative relationship between 2QmSRT
speed/stage and BF (r:-0.317, p:0.001). Importantly, this relationship demonstrates that
correlation using raw data (uncategorized) remained after subjects were categorized
according to BF composition class (see Figure 4 below). In figure 4, ANOVA revealed a
significant effect of body composition on final speed and completed stage (ir<0.05).
Post-hoc comparison showed a difference between <20 and 25.01+, and20.l-25 and,
25.0+ for both the speed and stage.
olt¡.q
Goa.o
at,
58
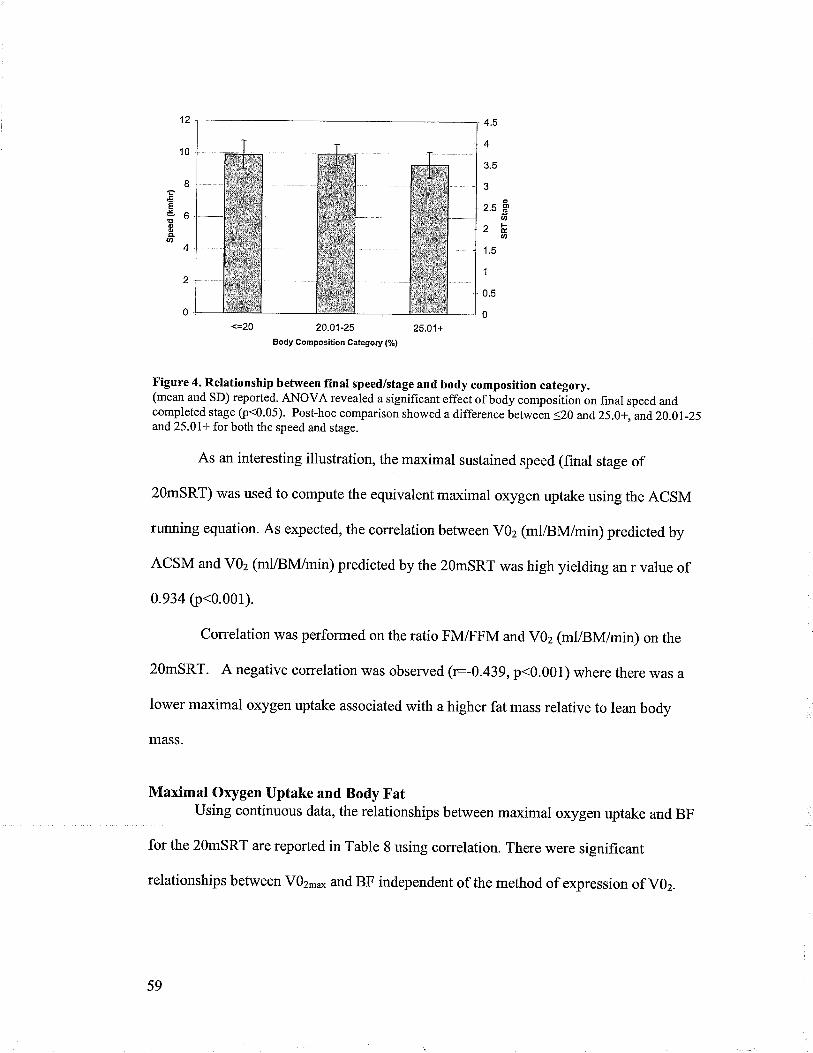
eI!oo4Ø
12
10
I
6
4
2
0
4.5
4
3.5
J
o2.5 g
an
^ts¿É.Ø
1.5
1
0.5
0
20.01-25
Body Composlt¡on Category (%)
25.01+
tr'igure 4. Relationship between final speed/stage and body composition category.(mean and SD) reported. ANOVA revealed a significant effect of body compositionon final speed andcompleted stage þ<0.05). Post-hoc comparison showed a difference between <20 and 25.0+, and,20.0l-25and 25.01+ for both the speed and stage.
As an interesting illustration, the maximal sustained speed (fînal stage of
2OmSRT) was used to compute the equivalentmaximal oxygen uptake using the ACSM
running equation. As expected, the correlation between V02 (ml/BM/min) predicted by
ACSM and VOz (ml/BN{/min) predicted by the 2OmSRT was high yielding an r value of
0.934 (p<0.001).
Correlation was performed on the ratio FMÆFM and VOz (ml/Bl\4/min) on the
2OmSRT. A negative correlation was observed (=-0.439, p<0.001) where there was a
lower maximal oxygen uptake associated with a higher fat mass relative to lean body
MASS.
Maximal Oxygen Uptake and Body FatUsing continuous data, the relationships between maximal oxygen uptake and BF
for the 2OmSRT are reported in Table 8 using correlation. There were significant
relationships befween V0z-* and BF independent of the method of expression of VOz.
59

Table 8. correlation of maximal oxygen uptake during the 2OmsRT to body fat.o/rBF
VOz 0.758(t/min) (<0.001)
VOz -0.441(ml/kg/min) (<0.001)
Y}z 0.518(mVkg FFM/min) (<0.001)
V0z(ml/mm SFLG/min)
0.404(<0.001)
Corelation coefficient þ value) reported.
The same relationships between the maximal oxygen uptake and body fat were
observed when partial correlations were performed using physical activity (daily step
count and step carriage) on the continuous data, However, the interaction between sex
and body composition, which was not significant when maximal oxygen uptake on the
2OmSRT was expressed relative to FFM, became significant when controlling for
physical activity (daily step count or step carriage). The same relationships reported in
Table 8 were preserved when factoring in sex and controlling for physical activify (daily
step count or step caniage) when evaluating the relationship between maximal oxygen
uptake and body composition class.
60
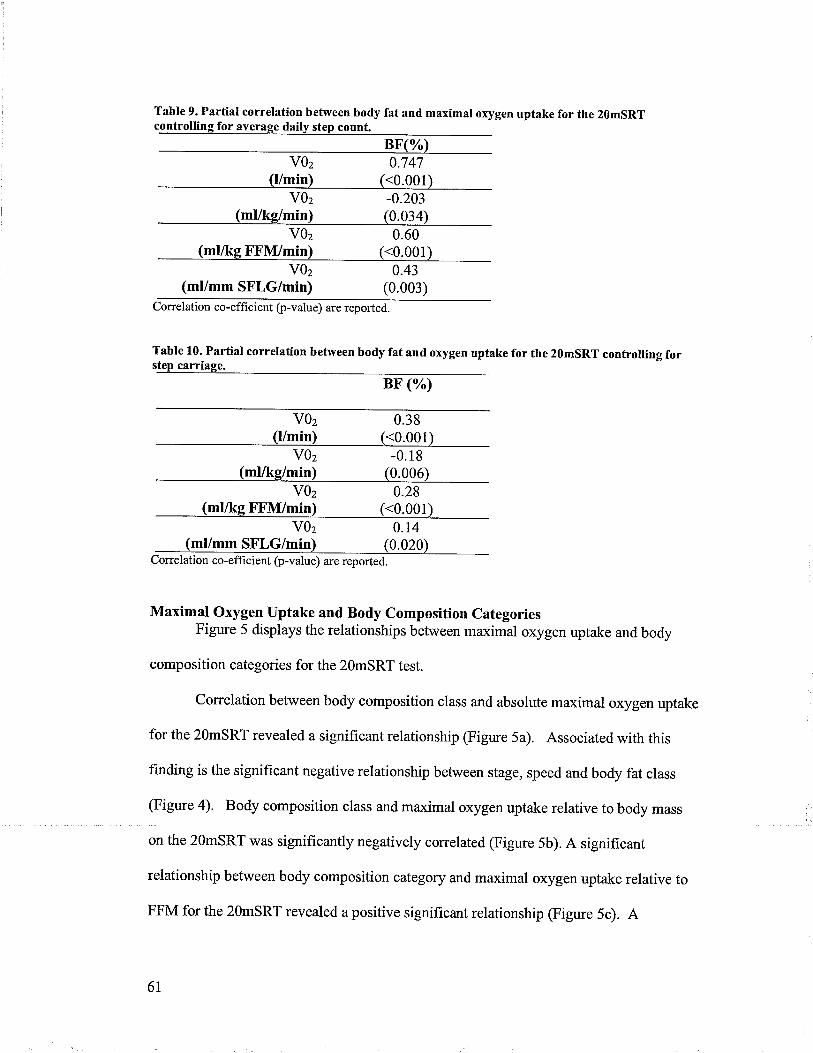
Table 9. Partial correlation between body fat and maximal oxygen uptake for the 2g6SRTa
V0z(Vmin)
0.747(<0.001)
V0z(mUkg/min)
-0.203(0.034)
V0z(ml/kg FFM/min)
0.60(<0.001)
V0z(ml/mm SFLG/min)
0.43(0.003)
Correlation co-efhcient þ-value) are reported.
Table 10. Partial correlation between body fat and oxygen uptake for the 2OmSRT controlling fort
V0z(l/min)
0.38(<0.001)
V0z(ml/kg/min)
-0.18(0.006)
V0z(mUkg FFM/min)
0.28(<0.001)
V0z(ml/mm SFLG/min)
0.14(0.020)
Correlation co-effìcient þ-value) are reported.
Maximal Oxygen Uptake and Body Composition CategoriesFigure 5 displays the relationships between maximal oxygen uptake and body
composition categories for the 2OmSRT test.
Correlation between body composition class and absolute maximal oxygen uptake
for the 2OmSRT revealed a signif,rcant relationship (Figure 5a). Associated with this
finding is the significant negative relationship between stage, speed and body fat class
(Figure a). Body composition class and maximal oxygen uptake relative to body mass
on the 2OmSRT was signifîcantly negatively correlated (Figure 5b). A significant
relationship between body composition category and maximal oxygen uptake relative to
FFM for the 2OmsRT revealed a positive significant relationship (Figure 5c). A
61

signif,rcant positive relationship was observed for body composition class and maximal
oxygen uptake relative to skin fold corrected leg girth for the 2OmSRT (Figure 5d).
Post-hoc comparisons were performed on the ANOVAs for all V02 measurements
(l/min, ml/kglmin, ml/kg FFI\{/min, ml/mm SFLG/min) to determine which categories
were signif,rcantly different for the 20mSRT. When V02¡¡¿çwas expressed in absolute
terms there was a signif,rcant difference between all body composition categories (gO *20.I-25.0,20.1-25.0 &.>25.0, <20 &.25.0+.) When expressed relative to BM there was a
significant difference between .20 &.25.0+, and when expressed relative to FFM there
u/as a significant difference was betweena20 &,25.0+ although the difference between
20.1-25.0 &,25.0+ is approaching significance (p:0.056). V02relative to SFLG was
significant between <20 &,20.1-25.0 and <20 &,25.0+.
62
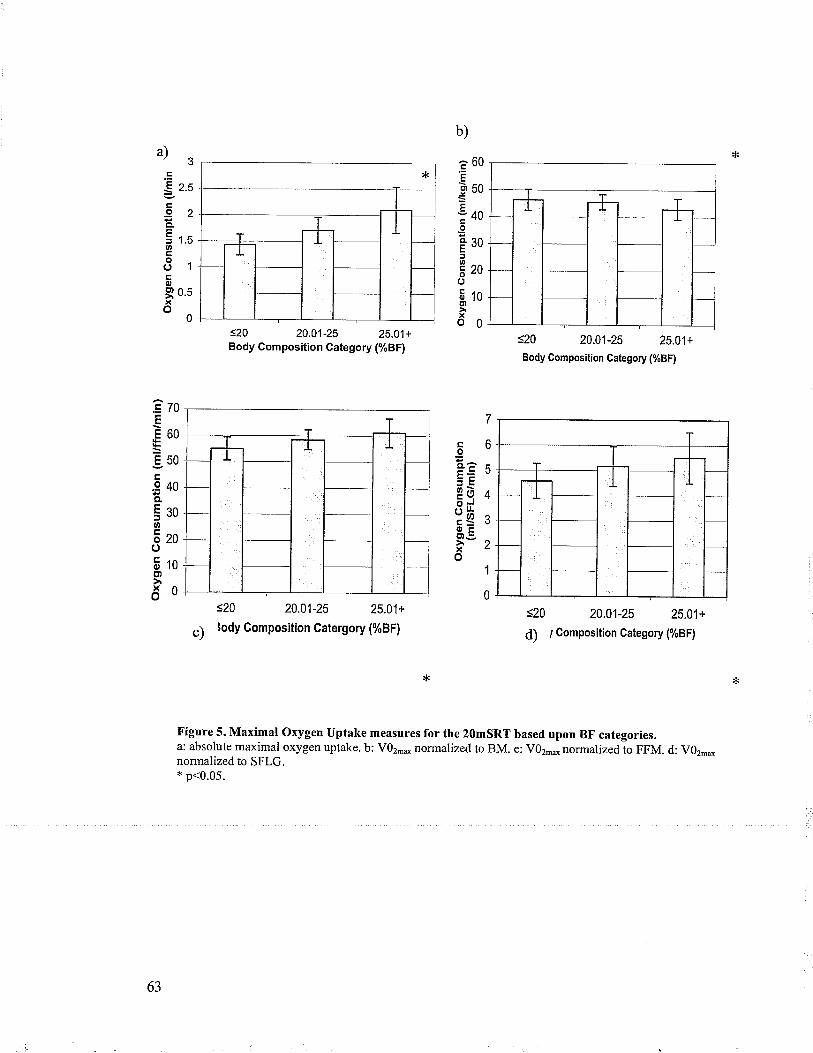
b)
a)3Ê60E
guo
:40IÊ30rEzoo5roE'l
xo0
.=
S z.s
.92êi r.sooo1ÉoI0.5xo
0
ÊzoE
E60
950.9 40o.
5soø
Ezoo5togt
ðo
s20 20.01-25 25.01+Body Composition Gategory (%BF)
s20 20.01-25 25.01+
c) lody Gomposition Catergory (%BF)
<20 20.01-25 25.01+
Body Composition Category (%BF)
<20 20.01-25 25,01+
d) ¡ Composition Gategory (%BF)
coCLâ
3ÈPò(5
r/r*
otr9.:"xo
Figure 5. Maximal Oxygen Uptake measures for the 2OmSRT based upon BF categories.a: absolute maximal oxygen uptake. b: V02,* normalized to BM. e: V02*normalized,to FFM. d: VOz-*normalized to SFLG.* p<0.05.
63

Hypothesis #4. Gycle TestMaximal Oxygen Uptake and Maximal Power
Correlations using continuous data were performed on maximal cycle power
output and BF. There \¡/as a significant positive relationship between cycle power and
BF (r:0.329, p:0.016). Importantly, these relationships demonstrated with correlation
using raw data (uncategorized) remained after subjects were categonzedaccording to BF
composition class (see Figure 6 below). In Figure 6, ANOVA revealed a significant
effect of body composition on maximal cycle po\ryer output (p<0.05). Post-hoc
comparison (p<0.05) revealed a difference between the <20 and 25.0+ categories.
<=2O 2O-O1-25 25.01+
Body Composition Gategory (7")
Figure 6. Relationship between maximal cycle power output (mean and SD) and body compositioncategory.ANOVA revealed a significant effect of body composition on peak power output (p<0.05). Post-hoc
comparison reveled a difference between 5.20 and25.0l+.
Correlation on the continuous data between SFLG and maximal cycle power
ouþut yielded a positive relationship with a p-value near significance (=0.268,p:0.057).
160
140
^ 120ãË 100.sõ80960oo' 40
20
0
64
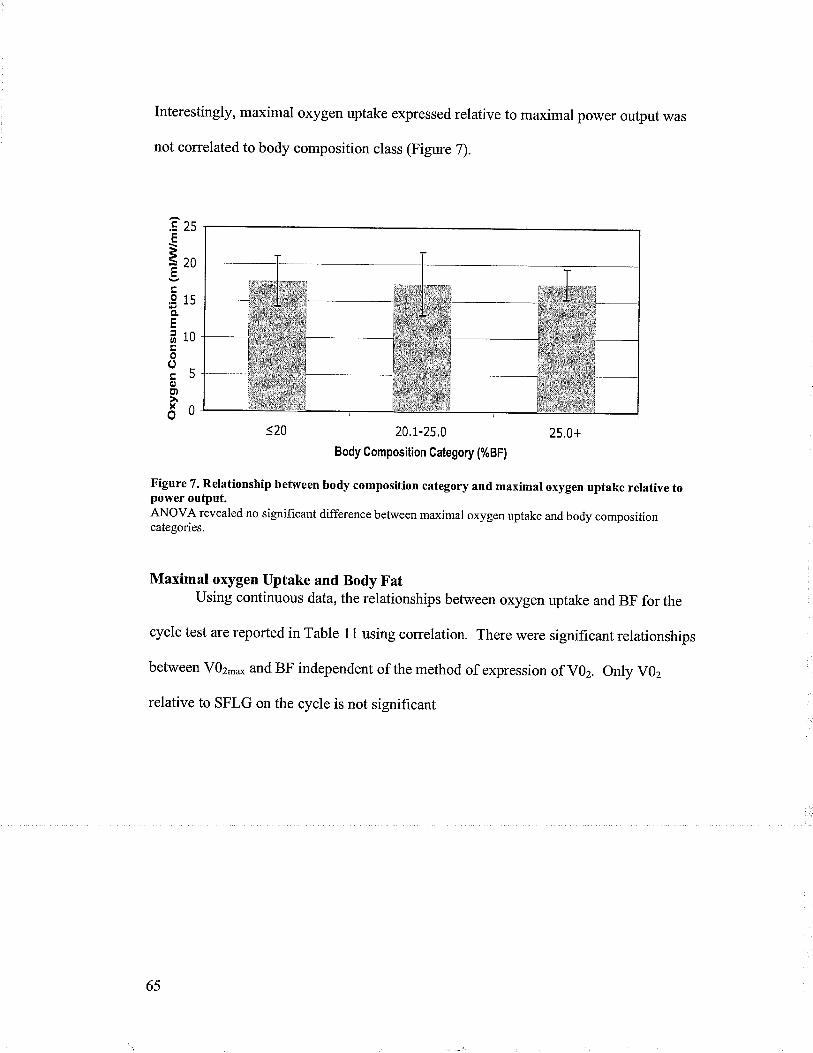
Interestingly, maximal oxygen uptake expressed relative to maximal power ouþut was
not correlated to body composition class (Figure 7).
25
20
15
10
5
0
20.1-25,0
Body Gomposition Gategory (%BF)
25.0+
çÈ
ã7
oqF
o
ooooxo
Figure 7. Relationship between body composition category and maximal oxygen uptake relative topower ouþut.ANOVA revealed no significant difference between maximal oxygen uptake and body compositioncategories.
Maximal oxygen Uptake and Body FatUsing continuous data, the relationships between oxygen uptake and BF for the
cycle test are reported in Table 11 using correlation. There were significant relationships
between VOz-* and BF independent of the method of expression of VOz. only V02
relative to SFLG on the cycle is not significant
65

cycle test to body fat.BF(%)
V0z(Umin)
0.423(<0.001)
V0z(ml/kg/min)
-0.662(<0.001)
V0z(mUkg FFM/min)
-0.298(0.014)
V0z(ml/mm SFLGimin)
-0.r29(0.1 e6)
Correlation co-efhcient þ-value) are reported.
The same relationships between the oxygen uptake and body fat were observed
when partial correlations were preformed using physical activity (daily step counts and
step carriage) on the continuous data, except for the correlation between VOz relative to
FFM and %BF which became non-significant when partially correlated to step count
(Table 12 &,Table 13). Also, the relationship between VOz relative to SFLG and%oBF
was significant when controlling for step carriage but not step count. The same
relationships reported in Table 11 were preserved when factoring in sex and controlling
for physical activity (daily step count and step carriage) when evaluating the relationship
between oxygen uptake and body composition class.
67

Table 12. Partial correlation between body fat and oxygen uptakes for the cycle test controlling foraverage daily step count.
BF (%)V0z
(l/min)0.44
(<0.001)V0z
(mVkg/min)-0.61
(<0.001)V0z
(ml/kg FFM/min)-0.16
(0.1 63)V0z
(ml/mm SFLG/min)-0.03
(0.433)Correlation co-efficient þ-value) are reported
Table 13. Partial correlation between body fat and oxygen uptakes for the cycle test controlling forstep carriage.
BF (%)
V0z(t/min)
0.16s(0.01)
V0z(ml/ke/min)
-0.33(<0.001)
vOz -0.26(ml/ke FFM/min) (0.025)
V0z(mVmm SFLG/min)
-0.25(0.032)
Correlation coefficient þ-value) are reported.
Maximal Oxygen Uptake and Body Composition CategoriesFigure 8 displays the relationships between oxygen uptake and body composition
categories for the cycle test.
A significant relationship was observed between body composition category and
absolute maximal oxygen uptake on the cycte (Figwe 8a). Associated is the significant
positive relationship between maximal power output and body composition category. A
significant negative relationship was observed between body composition class and
maximal oxygen uptake relative to body mass on the cycle (Figure 8b).
68

There was a moderate positive relationship between skin fold corrected leg girth
and body composition class (r:0.532, p:0.001) and, similarly between fat free mass and
body composition class (r:0.597, p:0.001). Correlation between body composition class
and maximal oxygen uptake relative to fat free mass reveled no significant relationship
(r:-0.265, p:0.053) on the cycle (Figure 8c). A scatter plot of the variables reflected a
linear relationship with a negative slope equal to -0.453. However, it should be noted that
the relationship between V02 relative to FFM and BF on the cycle becomes significant
when using raw data (Table 11). Associated is the non-significant relationship between
maximal oxygen uptake and power when subjects are categorized according to body
composition (Figure 7). No significant relationship between body composition class and
maximal oxygen uptake relative to sFLG was observed on the cycle (Figure 8d).
Post-hoc comparisons were performed on the ANOVAs for all V02 measurements
(l/min, ml/kglmin, ml/kg FFIWmin, ml/mm SFLG/min) to determine which categories
were significantly different for the cycle. When VOz.* is expressed in absolute terms
there is only a significant difference between .20 e 25.0+ body composition category.
When expressed relative to BM there is a significance difference between 20.l-25.0 &,
25.0+ and <20 &.25.0+, and when expressed relative to FFM or sFLG there is no
difference between any body composition category.
69
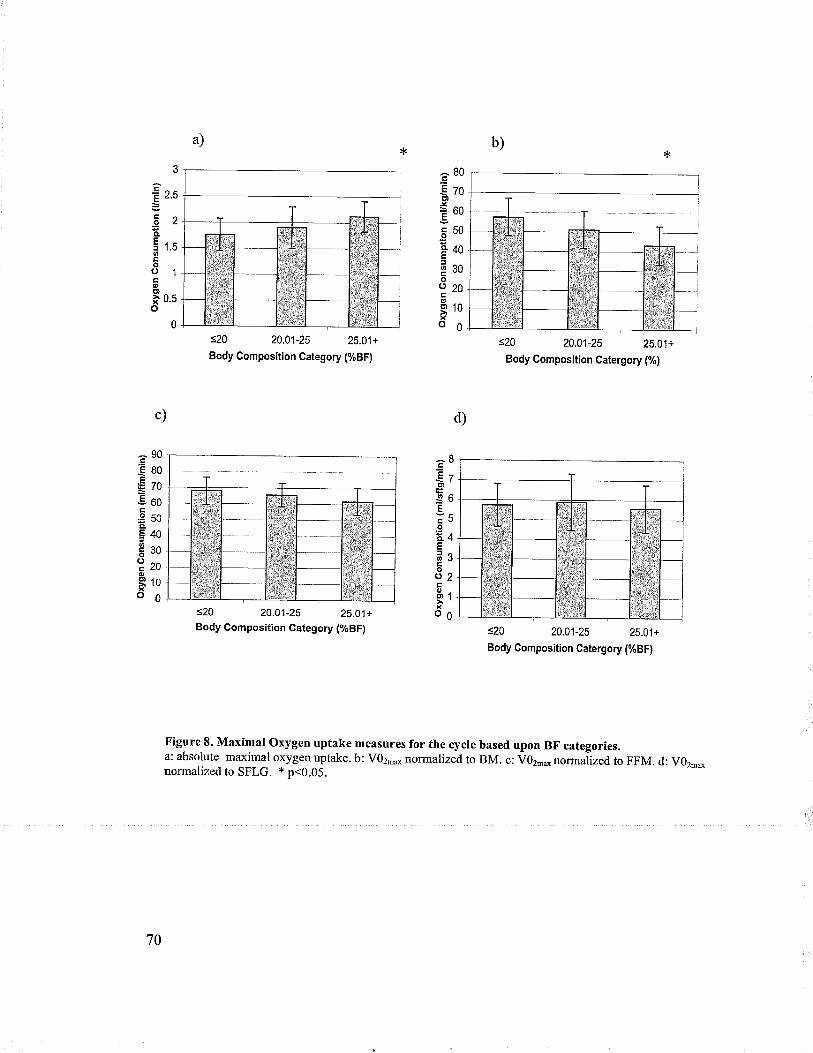
3
-È o<E .'u
Eno¿ãfLçf 1.Cooo1ooI 0.5o
0
â80€zoÈt¡Jì60È
ãuo*40t
Esoo
220o910xo6
d)c)
s20 20.01-25 25.01+
Body Gomposition Category (%BF)
s20 20.01-25 25.01+Body Gomposifion Gategory (%BF)
s20 20,01-25 25.01+
Body Composition Catergory (%)
=20 20.01-25 25.01+
Body Gomposition Gatergory (%BF)
EBÈa¡'t
-Q6EvÃcJoE¿4È
OJÊoo2og1xo6
Ê90EeoÊ€703ooç€50CL
E40Éso?eoo9too0
Figure L Maximal oxygen uptake measures for the cycle based upon BF.categories.a: absolute maximal oxygen uptake. b: V02** normalized to BM. c: V02md norm alized, to FFM. d: V0z.onormalized to SFLG. + p<0.05.
70
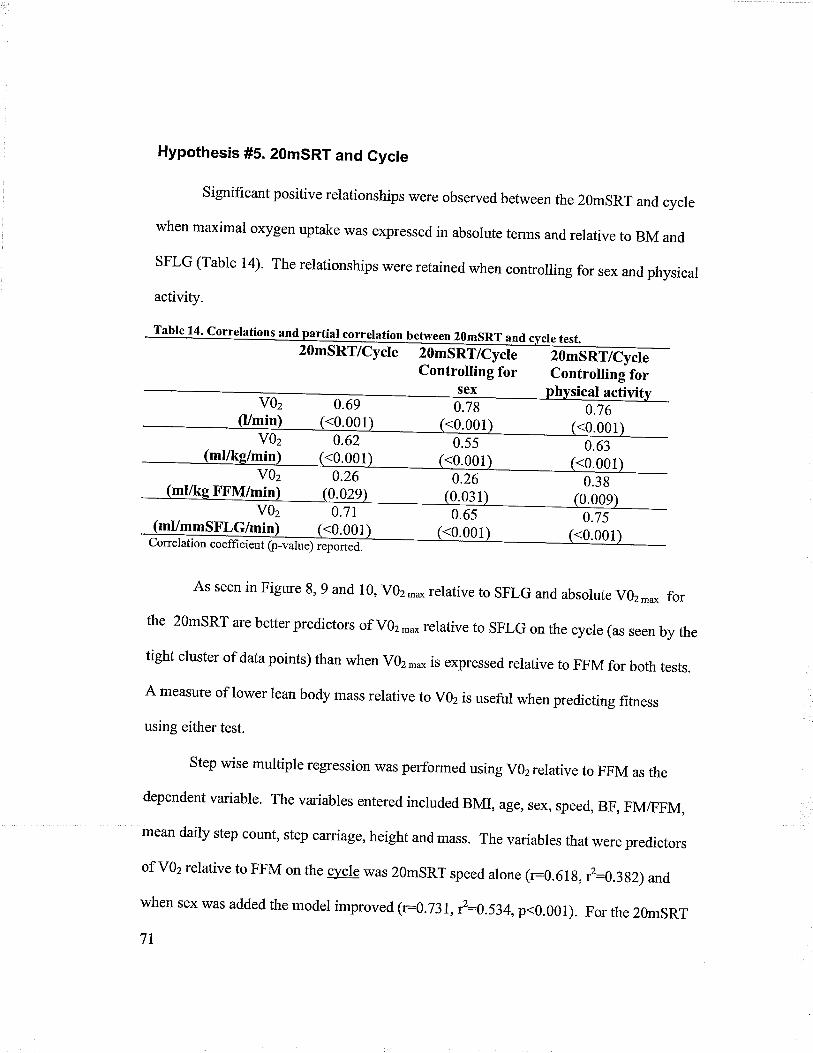
Hypothesis #5. 2OmSRT and Cycle
Significant positive relationships were observed between the 2OmSRT and cycle
when maximal oxygen uptake r¡/as expressed in absolute terms and relative to BM and
SFLG (Table 14)' The relationships were retained when controlling for sex and physical
activity.
Table 14. correlations and partial correlation between 2OmsRT and cvcre test.20mSRT/Cycle 20mSRT/Cycle 2OmSRT/Cycte
Controlling for Controlling forsex0.78
0.65<0.001
hvsical activi
u.)r 0.63(<0.001)VOz 0.26 0.2
0.7s<0.001
0.69
mVmmSFLG/min <0.001Correlation coefficient O-*t".) ."p"rt ¿
As seen in Figure 8, 9 and 10, vOz,n* relative to sFLG and absorute vOz-* for
the 2OmSRT are better predictors of VOz-* relative to SFLG on the cycle (as seen by the
tight cluster of data points) than when VOz -o is expressed relative to FFM for both tests.
A measure of lower lean body mass relative to vOz is useful when predicting fitness
using either test.
Step wise multiple regression was performed using V02relative to FFM as the
dependent variable. The variables entered included BMI, age, sex, speed, BF, FM/FFM,
mean daily step count, step carriage, height and mass. The variables that were predictors
of vOz relative to FFM on the c]¡cre was 2OmsRT speed alone (r:0.61g, l:0.3g2) and
when sex was added the model improved (r:0.731, r2=0.534,p<0.001). For the 2OmsRT
71

v02 expressed rerative FFM the model refurned BFI and sex as predictors (=0.620,r2:0'385, p<0'00r). The incrusion of speed and age would necessarily increase theprediction to nearly 100% (in fact 99-l%) as these are partof the 2OmsRT predictionequation' In addition, the use ofFMÆFM would not be indicted as FFM was used toback calculate the absolute v'z in the modified 2'msRT equation.
õl
ag>l
L)
-'
2.8
2.6
2.4
2.2
2
1.8
1.6
1.4
1.2
I
*. F"v+ îþ 's 'rù
o.5 1.5 2 2.52OmSRT VO2 (Vmin)
Figure 9. A scatter plot of_cycle absolute V02 and 2OmSRT absolute V02.The |Íne of best fit is significant.
3.5
72
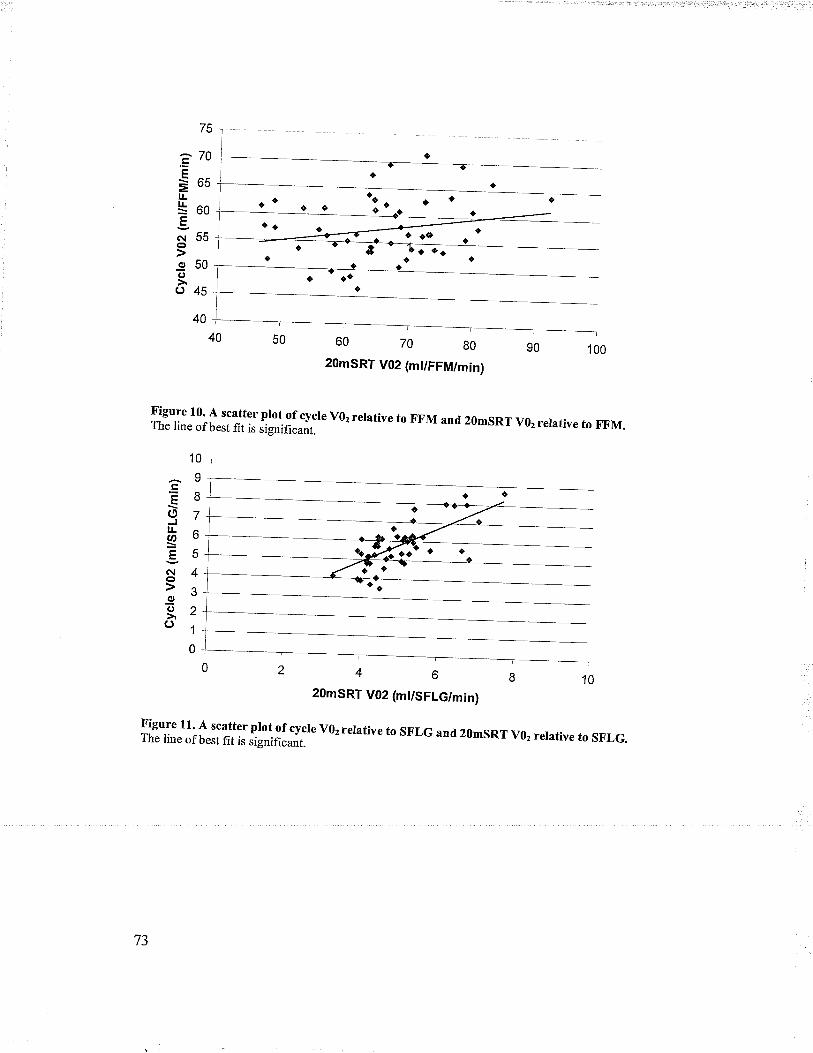
ou lu g0
2OmSRT V02 (mt/FFM/min)
Figure 10' A scatter plot of cycle v02 relative to FFM and 2gmsRT v02 relative to F,F.M.The line of best fit is significant.
10
II7
o
5
4
3
2
1
0
2OmSRT V02 (mt/SFLG/min)
ilig.iliJhflï?lJïfå#:#;" v02 rerative to SFLG and 20msRr v02 rerarive ro sF,LG.
75
î70Ê
Ëosl¿*oo€n¡55o950o()45
40
EottØ
E(ìoo(,
o
IJ

DiscussionThis sfudy sought to compare two tests (2OmsRT and cycle) to examine the cv
fitness of children normalized to various body composition parameters (BM, FFM,
SFLG)' children were categorized into three categories based on %BF and were also
examined using %BF as a continuous variable. The 2OmsRT is an excellent physical
work capacity test, however its characte úzationof cv fitness of children, especially
obese could be improved. The results obtained through the back calculation may over-
estimate the absolute maximal oxygen uptake of obese children because the method
assumed uniform tissue compartment distribution among the children (same proportion ofmuscle' bone and fat), therefore potentially creating a systematic bias in maximal oxygen
uptake expressed relative to FFM and sFLG. As such the only valid comparison between
cycle and 2OmsRT arises when using the predicted maximal oxygen consumption
normalized to BM from the 2OmsRT and the same units derived from the cycle test. Inthis comparison, there was moderate agreement R:0.62) befween the two tests which waspreserved when accounting for physical activity. As such, the 2O'SRT was a validpredictor of cv fitness using the cycle test as the benchmark. The results derived fromthe 2OmsRT were not interpreted further and thus a ne\¡/ regression equation needs to be
developed so as to allow comparisons between cycle and 2OmsRT using lean body mass
normalization. The negative trend observed between %BF (categorized) and v02.*expressed relative to FFM and sFLG and the partial correlations findings along with the
simple correlation between body fat and maximar oxygen uptake per FFM on the cycre
indicate compromised cv fitness of those children with increased adiposity. Therefore,
the knowledge that maximal oxygen uptake decreases with increasing adiposify on cycle
74
combined with the finding that the 2OmsRT is significantly correlated to the cycle test
regardless of v02 expression even when accounting for physical activity indicates that
regardless of the method of testing, cV fitness is lower in those children with higher
adiposity.
Sex Differences
It was observed that boys had lower BF and higher cardiovascular fitness than
girls independent of the method of expressing maximal oxygen uptake whether it be to
BM' FFM' or sFLG derived from the cycle test. The finding of a statistically significant,
negative relationship between adiposity and cv fitness of children is consistent with our
hypothesis and the literature, which has demonstrated clear difference between sexes.
Physical Activity
Physical activity (daily step count) was significantly negatively correlated to
BMI' BF' and SFLG but not significantly correlated to FFM, although a negative trend
was observed' The negative correlation between SFLG, FFM and physical activity
likely reflects the "haining" effect (increased FFM, SFLG) with increasing BF. These
findings refute our hypothesis of a positive relationship between SFLG, FFM and
physical activity, but are consistent with the hypothesis that BMI and BF decreases with
decreased physical activity.
75
20mSRT
V0z-o relative to BM (determined from the original regression equation) was
significantly lower in those with increased adiposity whether examined using body
composition categories (Figure 5) or continuous BF data. However, the back calculation
method to determine absolute V02, V02-* per FFM and V02-o per SFLG is limited as
the equations assumed a uniform tissue compartment distribution among the children
(same proportion of muscle, bone and fat) for each body composition category. An
increase in absolute maximal oxygen uptake was observed for heavier children (children
with higher FM) despite having substantially lower running speeds. It would be expected
that the energy expenditure to run at the same speed would be increased but to have
observed an increase with a decreasing running speed likely meant that the back
calculation method was providing an over-estimation for the heavier children, therefore,
there is a systematic bias in the 2OmSRT maximal oxygen uptake expressed relative to
FFM and SFLG and the results must be interpreted with caution. As a result, our
conversion is limited and to make a conclusion using the results of the 296SRT derived
maximal oxygen uptake values is unjustified. Further study is required to determine a
regression equation to predict maximal oxygen uptake relative to FFM and SFLG or use
of DEXA in order to determine the distribution of fat mass in the children. Therefore, we
can not refute or accept the hypothesis in regards to children with increased adiposity
having lower maximal oxygen uptake than those with less adiposity regardless of
expression (l/min, mllkg FFAzI/min, or ml/mm SFLG/min) for the 2OmSRT when %BF is
expressed categorically or on a continuum even when accounting forphysical activity.
76
Cycle Test
The f,rndings from the cycle test are not consistent with the hypothesis that
children with increased adiposify will have lower absolute maximal oxygen uptake when
compared to lean children using %BF (categorically, or on a continuum) when
controlling for physical activity. when maximal oxygen uptake was expressed in
absolute terms, those with higher body fat had signif,rcantly higher maximal oxygen
uptake compared to their lean counterpart (Figure 8a) due their extra mass carried. It
should be noted that those children with higher adiposity also had highest power out
(Figure 6). However, whether the increase in absolute maximal oxygen uptake in obese
children is indicative of cardiovascular fitness is unknown. It is possible that the increase
in V02-* (l/min) is a consequence of increased muscle mass, a peripheral component of
CV fitness. The increase in power and absolute VOz could be a consequence of the
increased FFM, and in particular increased lower lean body mass. A positive significant
correlation was reported between BF and FFM and SFLG. Obviously, the children with
more body fat (increased lower leg muscle mass) could achieve a higher absolute Vgz-o
and power output due to the increase in working tissue that can be recruited during the
exercise. Mechanical efficiency is not a factor as V02-o expressed relative to power (W)
was not significantly different among the body composition categories. However, it
could also be a reflection of an increased ability of the heart to deliver oxygen.
Therefore, whether the finding of increased absolute oxygen uptake with body fat is a
measure CV f,rtness is unknown and oxygen consumption should be normalized to body
composition parameters in order to compare those with differing body compositions.
77

However, the rest of the findings from the cycle test are consistent with the
hypothesis that children with increased adiposify will have lower maximal oxygen uptake
than their counter parts when expressed rerative to BM, FFM and $FLG using %BF
(categorically and on a continuum) even when controlling for physical activity.
When the cycle VOz was expressed relative to body mass the maximal oxygen
uptake decreased with increasing body fat (Figure 8b). However, the correlation between
VOz relative to FFM and body composition category was not significant (Figure 8c),
although there is an inverse trend with adiposify and vOz.*per kg FFM. on the cycle
there was no signif,rcant relationship between V02 relative to SFLG and body composition
category @igure 8d). Nonetheless, there was a downward trend in VOz relative to SFLG
with an increase in body fat even though the obese children had higher FFM and SFLG.
Interestingly, the inverse relationship between body fat and maximal oxygen uptake (per
kg FFM or mm SFLG) became even more apparent when controlling for step carriage as
both relationships became significant. step carriage may better represent energy
expenditure than step counts alone, as a physical activity indictor. Which of the two
factors influences cardiovascular fitness to a greater extent in this population is unknown.
So using step carriage must be interpreted with caution as further examination as a
measure of energy expenditure is warranted. However, energ"y expenditure may be a
better measure of physical activity because those who were heavier expended equal
energ-y as their lean counter parts (no signif,rcant correlation was observed) even though
they took fewer steps. Therefore, this may be further evidence that those with increased
adiposity are CV unfit. This is also consistent with the findings of others, which observed
t8

higher lower lean body mass in obese children, that is that energy expenditure of stepping
is adequate to trigger a muscle mass adaptation.
The appropriate means to evaluate continuous data is by correlation of raw data,
as opposed to simply proceeding to an analysis using classification into body composition
categories. The correlation between raw data @F and mllkglmin,ml{kg FFi\4/min)
showed a significant negative relationship, although not very strong. However, when
physical activity was accounted for VOz.* per kg FFM and V0-* per mm SFLG were
not significant although trending in the right direction. The statistically significant
negative correlation between body fat and maximal oxygen uptake relative to fat free
mass derived from the cycle data is indicative of compromised CV fitness as Vgz-*
expressed relative FFM is considered the best measure of CV fitness- the physiological
ability of the tissue to maximally consume oxygen (Goran et al., 2000). Interestingly, the
ability to predict that children with higher fat mass will have lower cardiovascular fitness
may be limited in this study due to the fact that a few individual lean children rÀ/ere very
inactive (hence also CV unfit) based upon the pedometry data (See scatter plot of Figure
2). Leaner children with low physical activity likely have lower CV f,rtness and this does
create a high variance in maximal oxygen uptake for this category of body composition.
Due to the significant association between FFM and SFLG with increasing body
fat, it is plausible to speculate that the decrease in V02per FFM could be attributed to
simply a difference in mechanical efficiency during cycling along the adiposity
continuum. This would be analogous to substantial difference in efficiency between an
elite runner and novice runner. In order to examine this possibility, the maximal oxygen
uptake was expressed relative to the cycle power (Figure 7) revealing that the efÍrciency
79

\¡r'as constant across categories. As such, this likely did not account for differences
observed.
2OmSRT and Cycle Test
It is important to note that there was a significant and moderately strong
correlation between the maximal oxygen uptake between the 2OmSRT and cycle test,
regardless of method of expression (Figureg&10). That is, the lowest scores on the cycle
test were associated with the lowest scores on the 2OmSRT. This finding shongly
supports our hypothesis of a positive correlation between the two tests (20mSRT and
cycle). The signif,rcant positive correlation indicates that children who performed poorly
on the cycle test in terms of CV fitness were also those that performed poorly on the
shuttle run (finished at earlier stages). Further support is the f,rnding from step wise
multiple regression in which cycle maximal oxygen uptake relative to FFM was strongly
predicted by the speed achieved in the shuttle run test, and then secondarily by sex. This
lends support to the possibility of adapting the 2ûmSRT equation. Secondary analysis of
the data could be performed on the cycle and 2OmSRT tests to evaluate this possibilify.
One issue of using two different protocols is the specificity of each test. The
2OmSRT is a loco-motor test where as the cycle test is body weight supported. Although,
the two tests are different much of the muscles recruited during each test is similar as
each uses mainly lower lean body mass during the exercise. Also, the tests differ in the
fact that the 2OmSRT is stop/start which requires the subject to accelerate, decelerate and
turn their body and therefore is more of an agility test where as the cycle test is
continuous. It is well document that maximal oxygen uptake on the cycle is lower than on
the treadmill by approximate|y l0%o. This is because the running test recruits more
80
active metabolic tissue than when cycling. Moderate correlation is then expected
between the fwo tests, which is consistent with our findings except when maximal
oxygen uptake is expressed relative to FFM(r:29). This could possible be because when
expressing maximal oxygen uptake relative to FFM uniform body tissue distribution is
assumed- When maximal oxygen uptake is expressed relative to SFLG, a more specific
measure, which represents lower limb, FFM the correlation became stronger (r:0.71).
Another reason for only moderate correlation could be motivation. However, this
\¡/as accounted for and was not a factor in the testing as all subjects wore heart rate
monitors to ensure maximal heart rate was achieved for both test and in particular the
2OmSRT. So although the 2OmSRT and the cycle test are independent tests the co.
extensiveness of the ranges overlap, and there is moderate correlation so the tests are not
mutually exclusive.
Comparison of Findings to Literature
Studies have reliably demonstrated that V02 relative to BM decreases with
increasing fat mass on the cycle, 2OmSRT and treadmill @lliot et al., 1989; Goran et al.,
2000; Huthrnen et al., 1986; Maffeis et al, 1994; Reybrouck et al., 1997; souza et al.,
2004; Ward et al., 1997). The relationship between V02relative to BM and BF in our
study for both the 2OmSRT and cycle is consistent with the literature. When Vgzwas
expressed relative to FFM our study is in agreement with the findings by Huttunen et al.
(1986) and Ward et al(1997) in which V02per kg FFMwas lower for obese children than
non-obese children when measured on a cycle (Huthrnen et al., 1986; Ward et al., 1997).
Other studies are in contrast to our findings but these studies compared obese to
81
overweight children and overweight to lean children where as our study had three
discrete body composition categories @lliot et al., l9g9; Maffeis et a1.,1994).
There are no studies that have attempted to adapt the results of the 2gmSRT to
express VOz relative to FFM. However, there is a strong correlation (r:0.88 for boys and
r:0.76 for girls) between the 2OmSRT and treadmill results ( Mahoney, 1992). For
running tests, two studies reported a decrease in VOz relative to FFM in obese children
compared to non-obese children (Maffeis et a1., 1994, Souza et al., 2004). Our findings
demonstrated an increase in V02 relative to FFM for body fat. Two treadmill studies
reported V02 relative to FFM of obese children to be higher than non-obese children
although not significant (Goran et al., 2000; Treuth et al., 199g). These studies
compared obese to overweight children and overweight to lean children. As stated above
the 2OmSRT test does not directly measure maximal oxygen uptake like the treadmill
studies and also only predicts maximal oxygen uptake relative to body mass. Our method
of deriving V02 relative to FFM from the 2OmSRT over-estimates the absolute maximal
oxygen uptake for heavier children. As such, our findings should be not be interpreted
for evaluating CV fitness, but simply to be used to consider redeveloping a 29mSRT
equation.
Our findings are similar to those studies that recorded physical activity using selÊ
report @lliot et a1.,1989; Ward et a1.,1997). Although the obese children in our study
took fewer steps per day, their step carriage was not significantly different among body
composition categories (there was an insignificant, positive correlation)(Figure3). A
study by Treuth et al reported total daily energy expenditure (TDEE) measured using
doubly labeled water to be higher for obese children (Treuth et al., l99g). Although
82
direct comparison is difficult, it is reassuring to find that the step carriage (an indirect
energy expenditure assessment) findings concw with those of the TDEE measurement.
The TDEE measurement combines basal metabolic rate and physical activity,whereas
step carriage reflects energy expenditwe related to stepping. Further research on the
utility of step carnage is warranted.
Conclusion
The f,rst hypothesis regarding the difference in male and female CV fitness was
supported, whereby males had greater CV fitness than females. The second hypothesis
relating to the relationship between step data was body composition characteristics were
largely supported where mean daily step counts were negatively correlated to BMI, BF,
FM and SFLG. The third hypothesis regarding the abitity of the 2OmSRT to evaluate CV
fÏtness in obese children was not supported, as the back calculation method was suspect.
Therefore, the data derived from the original equation was not interpreted. The fourth
hypothesis was supported by the findings in our study in which a decrease in V02-owas
observed with increasing adiposity based upon cycle testing. However, the methods of
expression of maximal oxygen uptake did not provide consistent results. The fifth
hypothesis was supported as a significant positive correlation between the cycle and
2OmSRT was observed. Due to the decrease in CV fitness with increased adiposity on
the cycle and the ability of the 2OmSRT to predict cycle test scores results, with the best
predictor being FFM when examined using multiple regression, it seems to reasonable to
conclude that regardless of testing method the CV fitness in children with increased
adiposity are CV unfit. This supports the need to redevelop or refine the 2Q6SRT
83
equation to provide for better predictive ability of CV fitness in children with higher FM,
probably by expression relative to FFM.
Limitations
There are several limitations associated with this study. First, the 2OmSRT is a
predictive maximal VOz test based upon a regression equation using metabolic data from
children in the late 1980s. This equation predicts V02 relative to total body mass, as such
the back calculation of absolute maximal oxygen uptake was based upon the premise that
all children have uniform distribution of major tissue compartments (muscle, bone, and
fat). In this study we multiplied the predicted V02 relative to BM by the subject's mass
to obtain the absolute maximal oxygen uptake. However, this has resulted in an over
estimation of absolute V02 for those carrying more total body mass, in this case the
children with excess fat mass (as fat mass is highly proportional (r:0.96) to total body
mass). Also, many children achieved higher partial stage success in the shuttle run, but
the regression equations for calculating V02 ** uses the last fully completed stage.
Therefore, subjects may have had higher VOz-o than the regression equation predicted.
This may have resulted in a greater degree of variance within the sample by creating a
"step" resolution, that is the predicted maximal oxygen uptake values were a discrete
separation apart (no values in-between).
The second limitation of the study relates to the use of the SFLG as a measure of
lower lean body mass. Although SFLG is a useful and easy method to estimate lower
lean body mass, it is known that using an anterior skinfold thickness underestimates
84

superficial adipose tissue (Tothill & Stewart, 2002). Also the literature has not validated
the SFLG use in severely obese individuals (Tothill & Stewart, 2002). Even though the
results for FFM and SFLG paralleled each other in direction, the statistical signif,rcance
was not always in agreement. This study supports the notion of assessing lower body
muscle mass (or lower lean body mass), but we recommend that other instruments be
used to assess it, such as DEXA, ultrasound, CT or MR[.
Our study was partially limited in the sex distribution, as the sample had more
obese girls than obese boys. A larger sample of obese boys should be obtained in future
studies.
Even though this was the only study to factor in an objective measure of physical
activity, the measurement was limited to pedometry which does not convey intensity of
activity. We attempted to account for this by developing a new pedometry derived
measure termed step carriage, to account for the load that each step carried Further
examination of this parameter is warranted. Additional studies should utilize
accelerometry and concurrent heart rate measurements.
85

Appendix A: Cover Letter and Parent Consent Form
RESEARCH PARTICIPANT INFORMATION AND CONSENT FORM
Title of Study: Body Composition and Aerobic Power in Children
Principal Investigator: Dr. Dean Kriellaars, RR303 Health Sciences Centre RehabilitationHospital, 810 Sherbrook Street, 787-3505Co-Investigators: Phil Gardiner (474- 8770), Katherine McGarry (333-7898),ElizabethReady (474-8641) Health Leisure and Human Performance Research Institute, 307 MaxBell Center.
This consent form, a copy of which will be left with you for your records and reference,is only part of the process of informed consent. It should give you the basic idea of whatthe research is about and what your participation will involve. If you would like moredetail about something mentioned here, or information not included here, you should feelfree to ask. Please take the time to read this carefifly and to understand anyaccompanying information. Feel free to discuss it with your friends, family or yourdoctor (if applicable) before you make your decision.
Purpose ofStudvThe purpose of this study is to develop a better understanding of how to assess thecardiovascular fitness of children. The 20 meter shuttle run test commonly called thebeep test is used for this pu{pose, however, a limitation might be that children that areobese may be unfairly disadvantaged because of the extra mass they carry. As such thetest may not evaluate the cardiovascular fitness of these children. We need to determine ifthis is indeed the case. V/e will be testing children of all body compositions in this studywith a 20 meter shuttle run test and a cycle test. With the number of obese andoverweight children increasing it is becoming imperative to be able to assess thecardiovascular fitness ofchildren to establish appropriate prevention and interventionpfoglams.
Studv proceduresYour child will be asked to perform 2 maximal aerobic tests. If yorn child has anyknown condition that prevents them from doing intense physical activity please do notenroll them in this study.If you agree that your child may take part in this study, your child will be asked to do the
following:
Body composition: He/she will be asked to speci$ age, date of birth, and gender. Heightwill be measwed using a mechanical scale and mass will be measured using a digitalscale. Waist circumference and leg girth will be measured using a tape measure.Percent body fat and muscle mass will be calculated by measuring 4 skin fold sites -triceps (arm), calf (leg), scapula (shoulder) and the thigh. In this method a skin fold
86

caliper will be used. Your child's skin will be gently pinched with this device and theskin fold will be measured. All these measwements will be done in private, not in sight ofother children.
Pedometer/accelerometer: Your child will also be asked to place a pedometer andaccelerometer on his/her belt on the top of his/her pant waistband on the left side. Thepedometer and accelerometer will be worn for seven days at all times, except forsleeping, bathing and swimming. Your child will be given a log sheet to reõord the stepcount from the pedometer before bed. The pedometer should be reset to zero everymorning.
2Ometer shuttle run test: This test will take place in a gym. Your child will be given av/ann up period and instruction on how to participate in the 20meter shuttle run test.Your child will wear a heart rate monitor (strap worn around the chest and wrist watch)for the duration of the test. The 20meter shuttle run test requires a subject to run betweentwo lines 20m aparttouching the line at the same time a pre-record tape emits a timesignal. Each minute the time between emitted sound signals will become shorter.Therefore, the participant must run faster. The test is complete when the child reachesthe target heart rate or can no longer keep pace.
Cycle test: This test will take place on an upright stationary cycle at the University ofManitoba, Fort Gary campus. The researcher will be in contact to make an appointmentto bring your child to our lab. During the test your child will wear a heart ¡¡ô.ritor.Oxygen uptake using a metabolic cart will assess cardiovascular fitness. A metabolic cartmeasures the amount of oxygen used by the body by measuring the amount of oxygeninhaled and exhaled. Your child will be asked to wear a mouthpiece similar to a inorkelmoutþiece and a nose clip. The moutþiece is attached to the metabolic cart by tubing.By breathing through the moutþiece exhaled air is collect to measure oxygen uptake.Your child will be given a warm-up period and familiarizationperiod weáring themetabolic gear. Following, your child will be instructed to begin pedaling at a constantspeed. During the test the resistance will increase until they reach the targetheart rate orcan no longer maintain the speed.
There are set criteria for what is deemed a maximal test and if your child does not meetthese criteria for either the 2Ometer shuttle run test or the cycle test the research will askhimlher to repeat the test after they have rested for period of time.
Even if you agree to allow your child to participate in this stud¡ the researcher maydecide to remove your child from this study if the researcher thinks your child is unableto complete the trial safely. Your child can stop participating in this study at any time.There are no serious consequences of sudden withdrawal from the study.
Duration of studv:Body composition measurements will take 5 minutes. The 2Ometer shuttle run test will
take 15 minutes to complete including \Ã/arïn-up, inskuction period and cool-down. Thecycle test will last 20 minutes including set-up, wann-up familiarization and cool-down.
87

Risks and DiscomfortsThe risks of this study are minimal/none. The subject may feel tired and out of breathe atthe end of the aerobic power tests. These tests are short in duration (12-15min) andtherefore, the discomfort is kept to a minimum. Your child may also experience a drymouth from breathing through the mouth piece during the cycle test.
BenefitsThis study will benefit the subjects by giving them an insight on their fitness and activitylevel. We hope that what is learned from this study will help improve the health ofchildren by establishing appropriate prevention and intervention programs.
CostsAll the procedures, which will be performed as part of this study, are provided at no costto you/ your child.
Pavment for participationYour child will receive no payment or reimbursement for any expenses related to takingpartin this study. Your child's name will be entered into a draw for apat of rollerbladesto be awarded at the end of the study (odds of winning I in 60).
ConfidentialitvInformation gathered in this research study may be published or presented in public;however your child's name and other identi$ring information will not be used orrevealed. Despite efforts to keep your child's personal information confidential, absoluteconfidentiality cannot be guaranteed. Your child's personal information may be disclosedif required by law.
The University of Manitoba Education and Nursing Research Ethics Board may reviewrecords related to the study for quality assurance puq)oses.
All records will be kept in a locked secure area and only those persons identified willhave access to these records. If any of your child's research records need to be copied tothe Ethics Board, your child's name and all identifying information will be removed. Noinformation revealing any personal information such as your child's name, address ortelephone number will leave the University of Manitoba Human Performance Laboratory,RR359 Rehabilitation Hospital, Health Sciences Centre.
Debriefine/feedbackWhen the study is finished a presentation will be given in which the summary of themajor findings will be given. Your child's results and the results of the whole group(without identi$ring information) may be given to you upon your request.
88

Statement of ConsentYour signature on this form indicates that you have understood to your satisfactionthe information regarding participation in the research project
"nd "g.." to allow
your child to participate as a subject. Please also ensure to initiat eacñ page afterreading the Ínformation given to you. fn no way does this consent waivè yã,r, o.your child's legal rights nor release the researchers, sponsors, or involvedinstitutions from their legal and professional responsibilities. you are free towithdraw your child from the study at any time, and /or refrain from answering anyquestions you prefer to omit, without prejudice or consequence. your continuedparticipation should be as informed as your Ínitial conseñt, so you should feel free toask for clarification or nerv information throughout your child-'s participation bycontacting Dean Kriellaars, 787-3505.
This research has been approved by the Education and Nursing Research EthicsBoard. If you have any concerns or complaints about this project you may contactany of the above-named persons or the Human Ethics Secretariat at 474-7722, or e-mail [email protected]. A copy of this consent form has been givento you to keep for your records and reference.
----Provide for Signatures as Required--
Parent/guardian S ignature Date
Child's Name þlease print) Date
Contact Number
Researcher and/ or Delegate's Signahrre Date
89
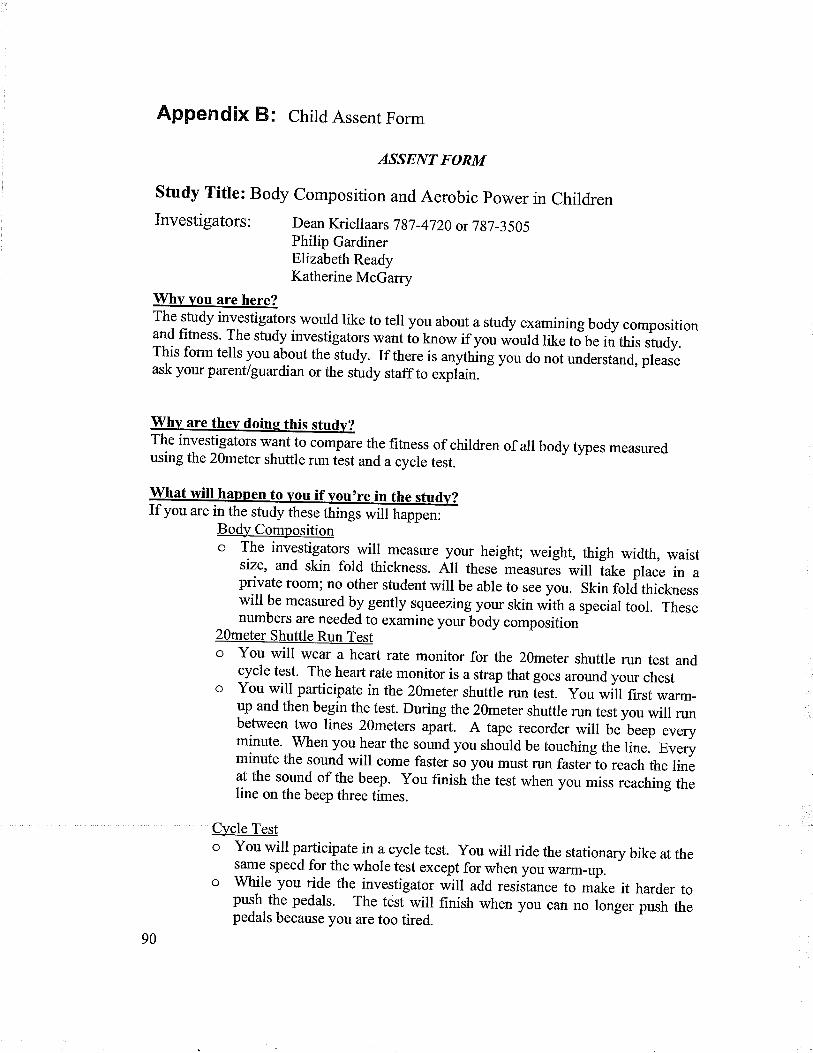
Appendix B: Child Assenr Form
ASSENT FONPT
study Title: Body composition and Aerobic power in childrenInvestigators: Dean Krielr aars 7g7-4720 or 7g7-3505
Philip GardinerElizabeth ReadyKatherine McGarry
Whv vou are here?The study investigators would like to tell you about a study examining body compositionand fitness. The study investigators want io know if you would like to be in tnis *¿r.This form tells you alout the study. If the_re is anything you do not understand, pleaseask your parcntlgnrdian or the sfudy staff to .*pluin. - '
Whv are thev doins this studv?The investigators want to compare the fitness of children of all body types measuredusing the 2Ometer shuttle run test and a cycle test.
Bod)¡ Compositiono The investigators_will measure your height; weight, thigh width, waist
size, and skin fold thickness. All these o,.ur.rr.-. will take place in aprivate room; no other student will be able to see you. skin fold thicknesswill be measured_by gently squeezing your skin *ith u special tool. Thesenumbers are needed to examine your body composition
20meter Shuttle Run Testo You will wear a heart rate monitor for the 2}meter shuttle run test and
cycle test. The heart rate monitor is a strap that goes around your chesto You will participate in the 2Ometer shuttÈ run iest. you will first warm_up and then begin the test. During the 20meter shuttle run test you will runbetween two lines 20meters apárt. A tape recorder wilr be beep everyminute. 'when you hear the sound you should be touching the line. nveryminute the sound will come faster so you must run fasteito reach the lineat the sound of the beep. you finish the test when you miss reaching theline on the beep three times.
Cycle Testo You will participate in a cycle test. you will ride the stationary bike at the
same speed for the whole test except for when you watm_up.o while you ride the investigator will add resiitance to mãke it harder topush the pedals. The test will finish when you can no longer push thepedals because you are too tired.
if vou're ÍnIf you are in the study these things *ill hupp.rl
90

o During the cycle test you will wear a mouthpiece (like a snorkelmouthpiece) that is attached to a tube that connects with the metaboliccart.
o The metabolic cart is a machine that measures the amount of oxygen andin the air you breathe out. From that measurement we can determine yourfitness
Physical Activity(Pedometer/Accelerometer) :
o A pedometer and accelerometer are small devices that clip onto your pantsand measures you physical activity. You will *eu. the pedometer andaccelerometer for seven days, except when sleeping, bathing orswimming. You will be given a log to record you step counts before goingto bed each day.
WilI the studv hurt?It will not hurt when the study investigators measure your height, weight, leg size andwaist size. When they measure your skin fold thickness you will feetã tlgtrt pinch. youwill get tired and out of breath during the 20meter shuttle run test and cycle tèst. Themoutþiece might be uncomfortable, but it doesn,t hurt.
Benefits of beinq in the studvBy participating in the study you will get to know your physical activity and fitness level.we hope that what we learn from this study can help other children as well.
What vou get for beinq the studvIf you choose to be part of the study your name will be entered into a draw for a pair ofrollerblades. Your name will stay in the draw even if you decide that you no lonler whatto be part of the study.
What if vou have anv questions?You can ask questions at any time, now or later. You can talk to the study staff, yourfamily or someone else.
Who will know what I did in the studv?Any information you give to the study staff will be kept private (or secret). your namewill not be on any study paper and no one but the study staff will know you were in thestudy. Any medical information about you are will be kept private. The
-only time the
research information may be seen is when it's being checkei to make ,*. ih.information is being kept properly.When the study is finished a presentation on the general findings will be given to thestudents and parents of everyone who participated.
9t

Do vou have to be in the studv?You do not have to take part in the study. No one will be angry at you if you don,t wantto be in this study, just say so. We will also ask your parents iith.y *ouíA like you to bein the study. Even if yow parents want you to be in thè study, you can still say n-o. If yo.,say yes now, you can change your mind at any time. It's up to you.
I)o vou have anv questions?
What questions do vou have?
91
Assent
I want to take part in this study. I know I can change my mind at any time.
Verbal assent given Yes IPrint name of child
Written assent if the child chooses to sign the assent.
Signature of Child Age Date
r confirm that r have explaÍned the study to the participant to the extent
compatible with the participants understanding, and that the participant has
agreed to be in the study.
Printed name of Signature ofperson obtaining assent person obtaining assent
92
Date

APPENDIX Cl Step Count Log
Step Count Log Sheet Before Bed
Name:
Start Date:
Day Step Count Before Bed
Day I
Day 2
Day 3
Day 4
Day 5
Day 6
Day 7
Please list any activities participated in during the day (eg. Gy* class, swimminglessons. hockev oractice et
Dav ActivitiesDay 1
Day 2
Day 3
Day 4
Day 5
Day 6
Day 7
93
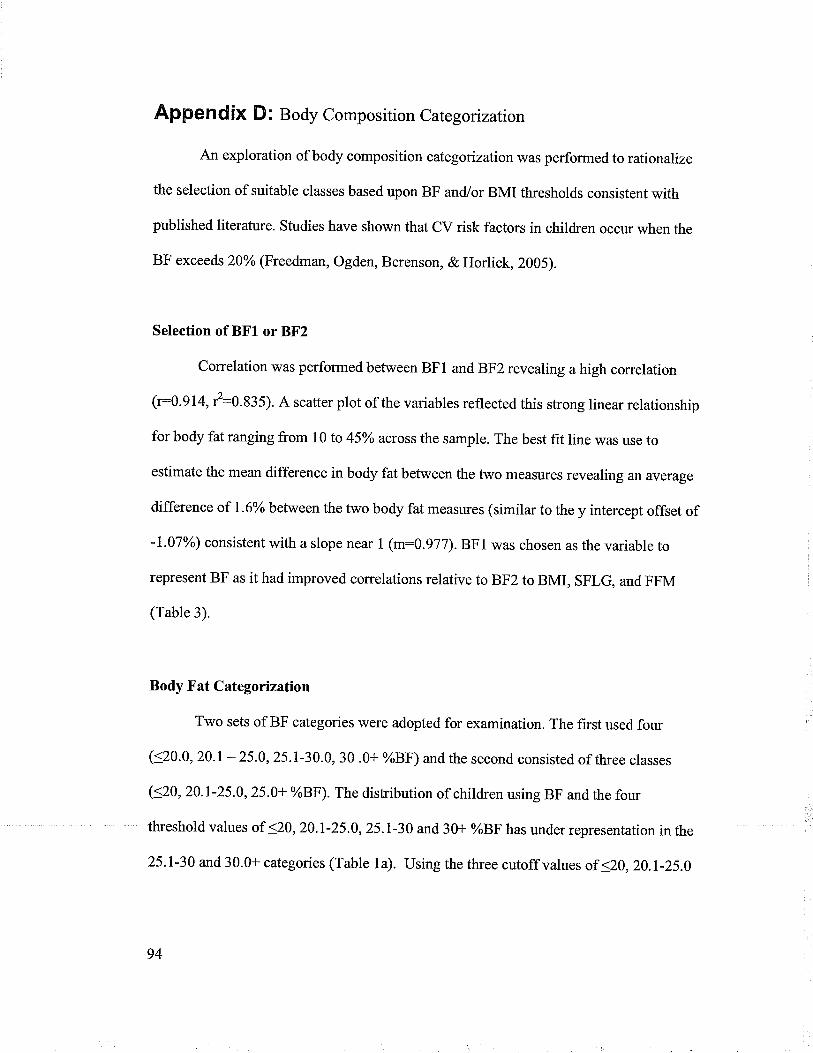
Appendix D: Body Composition Categ onzation
An exploration of body composition categonzation \¡/as performed torationalize
the selection of suitable classes based upon BF and/or BMI thresholds consistent with
published literature. Studies have shown that CV risk factors in children occur when the
BF exceeds 20% (Freedman, Ogden, Berenson, & Horlick, 2005).
Selection of BFl or BF2
Correlation was performed between BFI and BF2 revealing a high correlation
(t:0.9I4,êO.a:S¡. A scatter plot of the variables reflected this strong linear relationship
for body fat ranging from 10 to 45Yo across the sample. The best f,rt line was use to
estimate the mean difference in body fat between the two measures revealing an average
difference of I.6Yo between the two body fat measures (similar to the y intercept offset of
-1.07%) consistent with a slope near I (m:0.977). BF1 was chosen as the variable to
represent BF as it had improved correlations relative to BF2 to BMI, SFLG, and FFM
(Table 3).
Body Fat Categorization
Two sets of BF categories were adopted for examination. The fnst used four
(520.0, 20.1 - 25.0, 25 .t-30.0, 3 0 .0+ %BF) and the second consisted of three classes
(<20,20.1-25.0,25.0+ %BF). The dishibution of children using BF and the four
threshold values of <20,20.1-25.0,25.1-30 and 3ùr %BF has under representation in the
25.1-30 and 30.0+ categories (Table 1a). Using the three cutoff values of <20, 20.1-25.0
94

and 25.0+ %BF provided an even distribution (Table
being under represented.
Table 1. BF categorization into four categories.Number (n, %) of subjects in each of the four BF composition ca
18) of subjects with no category
ies for the 2OmSRT and test.<20.0 20.1-25.0 25.1-30.0 30.0+
20mSRT 33 G4.59 2l (28.37 9 02/t 10.8rtest 25 (46.29 t4 (2s.9 6 fl1.11 14.81
Table 2. Bf,' categorization into three categories.Number (N, 7o) of subjects in each of the three BF ition categories for the 2OmSRT and c
.0 20.1-25.0 25.0+20mSRT 44 2I 0837 20 (27.0
test (46.29 t4 (2s.92 t5 (27.
BMI Categorization
BMI and the international age dependent cutoff values for acceptable body
composition (ABC), overweight (OW) and obese (OB) were also used in the analysis
(cole, Bellizzl Fleg, & Dietz,2000)(Table 19). BMI yielded a distribution under-
representing obese category as is often observed in literature (Table 19).
rMale Female
OV OB OV OBt8.44 2t.60 18.3s 2t.5719.10 22.7 19.07 22.81
10 19.84 24.0 19.86 24.tr
Age
Table 4. BMI categorization.Number fN. %) of 2OmSRT and
Acceptable Body OverweightComnosition
Obese
20mSRT 60 (77.9 L2 (15. 6.495
95
cle test 43 (75.44 t0 07.s4 7.02

Similar results were observed independent of the classif,rcation method and
completely consistent with the observed relationship between continuous variable (Table
5). Given that BMI is less specific and sensitive than skin folds for assessment of adipose
tissue accumulation, BF was used for further body composition categorization. The
thresholds chosen were <20, 20.1-25, and 25.0+. This classification method uses BF
>20yo which is a known cutoff for blood borne marker expression for those children with
increased risk of CV disease factors. Also this set of thresholds resulted in an even
distribution of subjects.
ANOVAs were performed for both body composition categorization(three classes versus
four classes) and oxygen uptake. Regardless ofclassification used classes the results
were similar (see table below) with the exception of absolute V02meas¡red on the cycle.
The p-value is approaching significance and may be atypell error.
Table 5. Com ol cateqories and o P-value
CycleBody Composition Catesory
(s20,20.I -25. 0, 25. 1 -3 0.0,>30)
(s20, 20.1-25.0, 25.0+)
V0z(l/min)
0.073 0.014
V0z(ml/ke/min)
0.001 0.001
V0z(ml/keFFM/min)
0.143 0.149
V0z(ml/SFLG/min)
0.294 0.797
96
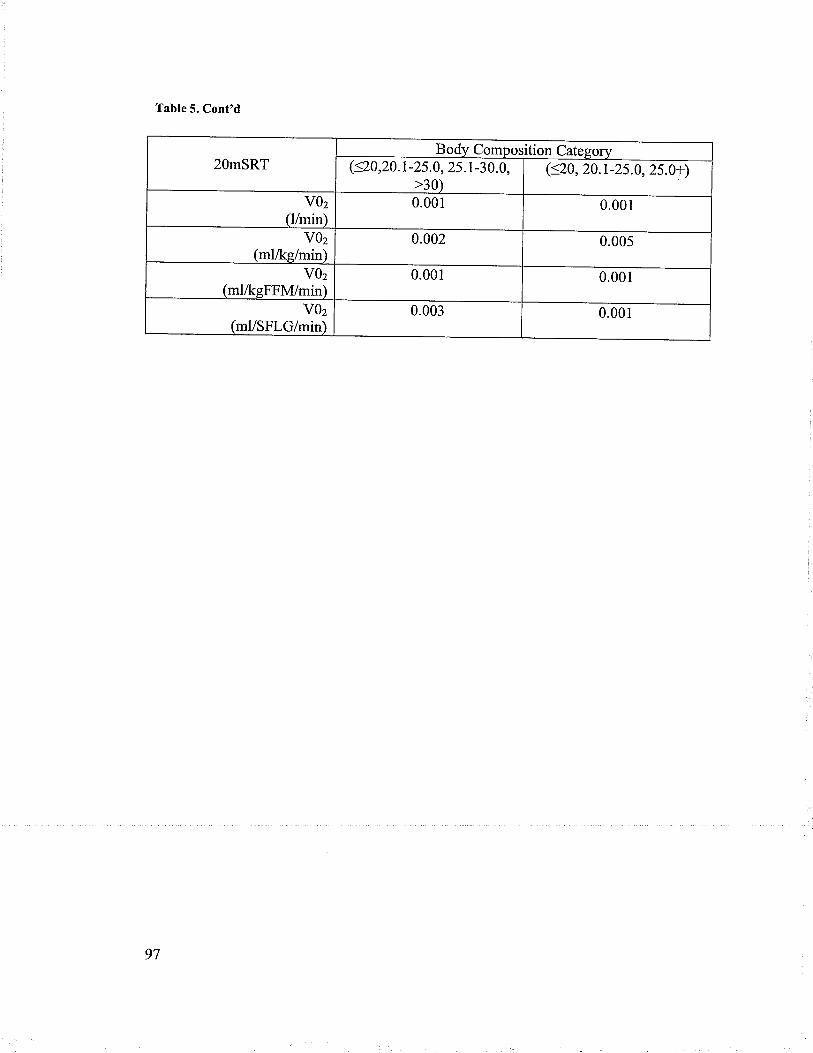
Table 5. Cont'd
20mSRTBody Composition Category
(<20,20. I -25.0, 25 .1 -3 0. 0,>30)
(s20, 20.r-25.0, 25.0+)
V0zlllmin)
0.001 0.001
V0zlml/ks/min)
0.002 0.005
V0z(ml/ksFFN4/min)
0.001 0.001
V0z(ml/SFLG/min)
0.003 0.001
97
References
Center for Disease Control and Prevention.(2007) . Cholesterol Facts and Statistics .
Appel, L. J. (2003). Lifestyle modification as a means to prevent and treat high bloodpressure. J Am Soc Nephrol, l4(7 Suppl 2), S99-S102.
Armstrong, N., & Welsman, J. (1994). Assessment and Interpretation of aerobic fitness inchildren and adolescents. Exercise and Sport Sciences Reviews, 22(I),435-476.
Astrand, P. o., & Rodahl, K. (1970). Physical work capacity. lnTextbook of workP hys io lo gy. Toronto: McGraw-Hill Book Company.
Balkau,8., vierron, E., Vernay, M., Born, c., Arondel, D., Petrella,4., et al. (2006). Theimpact of 3-year changes in lifestyle habits on metabolic syndrome parameters:the D.E.S.I.R study. Eur J Cardiovasc Prev Rehabil, I3(3),334-340.
Bender, J. M., Brownson, R. c., Elliott, M. 8., & Haire-Joshu, D. L. (2005). children'sphysical activity: using accelerometers to validate a parent proxy record. Med SciSports Exerc, 3 7(8), 1409-1413.
Bloomgarden,Z. (2004). Type tr diabetes in the young. Diabetes Care, 27(4), 998-1010.Boileau, R., Bonen,4., Heyward, v., & Massey, B. (1977). Maximal aerobic capacity on
the treadmill and bicycle ergometer of boys 11-14 years of age. J Sports med PhysFitness, I 7(2), 153-162.
Carspersen, C., Pereira, M., & Curran, K. (2000). Changes in physical activity patterns inthe United States, by sex and cross-sectional age. Medicine and Science in Sportsand Exercise, 3 2(9), 1 601- 1 609.
Cole, T. J.,Bellizzi, M., Fleg, J.L., &,Dietz, W. (2000). Establishing a standarddefinition for child overweight and obesity worldwide: International Survey.BitûI, 320,1240-t243.
cooper, D., Poage, J., Barstow,T., & springer, c. (1990). Are obese children truly trnf,rt?Minimizing the confounding effect of body size on the exercise response. TheJournal of Pediatrics, I I 6, 223-230.
Cragg, S., Cameron, C., Craig, C.L., & Russell, S. (1999). Canada,s Children andYouth: A physical activity profile. Ottawa, ON: Canadian Fitness and LifesfyleResearch Institute.
Daniels, S. (2006). The consequences of childhood overweight and obesity . The Future ofChildren, I 6(1), 47 -67.
Dwyer, T., &Blizzard, C. (1996). Defining obesity in children by biological endpointrather than population distribution.Int J Obes Relat Metab Disord, 20(5472-480),472-480.
Eisenmann, J. c., Heelan, K. ,{., & welk, G. J. (2004). Assessing body compositionamong 3- to 8-year-old children: anthropometry, BIA, and DXA. Obes Res,r 2(t0), 1633-1640.
Elliot, D.L., Goldberg, L., Kuehl, K. s., & Hanna, c. (1989). Metabolic evaluation ofobese and nonobese siblings. J Pediatr, I t4(6),957-962.
Fleg, J. L., Morrell, C. H., Bos, A. G., Brant, L. J., Talbot,L. ^.,Wright,
J. G., et al.(2005). Accelerated longitudinal decline of aerobic capacity in healtþ olderadults. Circulation, I I 2(5), 67 4-682.
Freedman, D. s., ogden, c. L., Berenson, G. s., & Horlick, M. (2005). Body mass indexand body fatness in childhood. Curr Opin Ctin Nutr Metab Care, 8(6),618-623.
98

Gaskill, S.8., Ruby, B. C.,'Walker, A. J., Sanchez,O. A., Serfass, R. C., & Leon, A. S.(2001). Validity and reliability of combining three methods to determineventilatory threshold. Med Sci Sports Exerc, -tj(11), 1g41-1g4g.
Goran, M., Fields, D., Hunter, G., Herd, s., & weinsier, R. (2000). Total body fat doesnot influence maximal aerobic capacity. International Journal of Obesity, 24,841-848.
Groner, J. 4., Joshi, M., & Bauer, J. A. (2006). pediatric precursors of adultcardiovascular disease: noninvasive assessment of early vascular changes inchildren and adolescents. Pediatrics, I IB(4), 1683-1691.
Hansen, H., Frober, J., Nielsen, J., & Hyldebrandt, N. (19g9). A new approach toassessing maximal aerobic power in children: the Odense school child study. -r.Sports Med. Phys. Fitness., 28, 7 4-7 B.
Health Canada. (2002). Canada's Physical Activity Guidefor Children: Government ofCanada.
Hebestreit, H., staschen, 8., & Hebestreit, A. (2000). ventilatory threshold: usefulmethod to determine aerobic fitness in children? Med Sci Sports Exerc., 32(II),t964-1969.
Hermansen, L., Ekblom,8., & saltin, B. (1969). cardiac output during submaximal andmaximal treadmill and bicycle exercise. Journal of apptied physiologlt, 29,82-86.
Hopkins, V/. (2007). Understanding Statistics by using spreadsheeti to generate andanalyze samples. Sport. Sci, 11,23-36.
Horvath, s., Taylor, D. G., Marsh, J. P., & Kriellaars, D. (2006). Effect of pedometery onnormal gait assymetry and step count University of Manitoba.
Huttunen, N.-P., Knip, M., & Paavilainen, T. (1986). physical activity and f,rtness inobese children. International Journal of Obesity, I0,5lg-525.
Janssen, l.,Katzmarzyk,P. T., Srinivasan, s. R., chen, w., Malina, R. M., Bouchard, c.,et al. (2005). Utilify of childhood BMI in the prediction of adulthood disease:comparisonofnationalandinternationalreferences.ObesRes, 13(6),1106-1115.
Katrnarzyk,P., & Janssen, I. (2004). The economic costs associated wittrphysicalinactivity and obesity in canada: an update. canadian Journal oyzppneaPhysiology, 29(I), 90-1 I 5.
Kent, M. (Ed.) (1994) The Oxford Dictionary of Sports Science and Medicine. NewYork: Oxford University Press.
Lee, I. M. (2003). Physical Activity and Cancer Prevention-Data from Epidemiologicstudies. Medical and sciences in sports Exercies, ii(l1), lg23-1927.
Leger, L. (1996). Aerobic performance In D. Docherty @d.), Measurement in pediatricsexercise science (pry. 183-223). Champaign: Human Kinetics.
Leger, L.A., & Lambert, J. (1982). A maximal multistage 20-m shuttle run test to predictVO2max. European Journal ofApplied physiologt, 49,I-lZ.
Leger, L. 4., Mercier, D., Gadoury, c., & Lambert, J. (1988). The multist age 20 metershuttle run test for aerobic fitness. Journal of sports sciences, 6, 93-101.
Maffeis, c., schena, F.,zaffanello, M., zoccante,L., schutz, y., & pinelli, L. (rgg4).Maximal aerobic po\¡/er during running and cycling in obese and non-obesechildren Acta Paediatica, 83, 1 13- 1 I 6.
Mahoney, C. (I992).20-MST and PWC170 validity in non-Caucasian children in theUK. British Journal of sports medicine, 26(l),45-47.
99
Nichols, J. F., Morgan, C. G., Sarkin, J. 4., Sallis, J. F., & Calfas, K. J. (1999). Validity,reliability, and calibration of the Trihac accelerometer as a measure of physicalactivity. Med Sci Sports Exerc, 3l(6),908-912.
Ravussin, 8., Harper, I. T., Rising, R., & Bogardus, C. (1991). Energy expenditure bydoubly labeled water: validation in lean and obese subjects. Am J Physiol, 261(3Pt t),F402-409.
Reybrouck, T., Mertens, L., Schepers, D., Vinclor, J., & Gewillig, M. (1997). Assessmentof cardiorespiratory exercise function in obese children and adolescents by bodymass-independent parameters. Eur J Appl Physiol Occup Physiol, 75(6),478-483.
Roberts, D., Rideout, V., & Foehr, U. (1999). Kids & media @the new millennium.Washington, D.C: Kaiser Family Foundation.
Roblin, L. (2007). Childhood obesity: food, nutrient, and eating habit trends andinfluences. Applied P hysiology Nutrition and Metabolism, 3 2(5), 63 5-645.
Rowland, T. (1993). Aerobic exercise testing protocols. In T. Rowland (Ed.), Pediatriclaboratory exercise testing. Windsor: Human Kinetics Publisher.
Rowland, T. W. (2007). Evolution of maximal oxygen uptake in children. Med Sport Sci,50,200-209.
Rowland, T. W., Rambusch, J. M., Staab, J. S., Unnithan, V.8., & Siconolfi, S. F.(1993). Accuracy of physical working capacity (PWC170) in estimating aerobicfitness in children. J Sports Med Phys Fitness, 33(2),184-188.
Slaughter, M.H., Lohman, T. G., Boileau, R. 4., Horswill, C.,A.., Stillman, R. J., VanLoan, M. D., et al. (1988). Skinfold equations for estimation of body fatness inchildren and youth. Hum Biol, 60(5),709-723.
Souza, M., Cardoso, 4., Yasbek, P., & Faintuch, J. (2004). Aerobic endurance, energyexpenditure and serum leptin response in obese, sedentary prepubertal childrenand adolescents participating in a short-term treadmill protocol. AppliedNutriti onal Inv estigation, 2 0(10), 900-904.
Tanner, C., Heise, C., & Barber, G. (1985). Correlation of the physiologic parameters ofa continuous ramp versus an incremental James exercise protocol in children. Am.J. Cardiol, 67, 309-312.
Thompson,4.M., Baxter-Jones, A. D., Mirwald, R. L., & Bailey, D. A. (2002). Seculartrend in the development of fatness during childhood and adolescence. Am J HumBiol, 14(5),669-679.
Tothill, P., & Stewart, A. D. (2002). Estimation of thigh muscle and adipose tissuevolume using magnetic resonance imaging and anthropometry. J Sports Sci,20(7),563-576.
Tremblay, M., Katzmar4k,P., & Willms, J. (2002). Temporal trends in overweight andobesity in Canada, 1981-1996. International Journal of Obesity, 26,538-543.
Tremblay, M., &'Willms, J. (2003). Is the Canadian childhood obesity epidemic relatedto physical inactivity? International Journal of Obesity and Related MetabolicDisorder, 27(9), 1 100-1 105.
Treuth, M., Figueroa-Colon, R., Hunter, G.,'Weinsier, R., Butte, N., & Goran, M. (1998).Energy expenditure and physical f,rtness in overweight vs nonoverweightprepubertal girls. Intern ational Journal of Ob esity, 2 2, 440-447 .
Tudor-Locke, C.,'Williams, J. E., Reis, J. P., & Pluto,D. (2002). Utility of pedometersfor assessing physical activity: convergent validity. Sports Med, 32(12), 795-808.
100

van Mechelen,'W., Hlobil, H., &, Kemper, H. (1986). Validation of two running tests asestimates of maximal aerobic power in children. European Journal of AppliedPhysiology, 55, 503-506.
Vanhees, L., Lefewe, J., Philippaerts, R., Martens, M., Huygens, 'W., Troosters, T., et al.(2005). How to assess physical activity? How to assess physical f,rtness? Eur JCardiovasc Prev Rehabil, I 2(2), 102-114.
Volpe Ayob,8., & Bar-Or, O. (2003). Energy cost of walking in boys who differ inadioposity but are matched for body mass. Med. Sci Sports Exerc., 35(4),669-674.
Warburton, D., Nicol, C., & Bredin, S. (2006). Health benefïts of physical activity:theevidence. C an adi an Me di c al A s s o ci at ion Journ al, I 7 4(6), 80 1 -8 09.
Ward, D. S., Trost, S. G., Felton, G., Saunders, R., Parsons, M. 4., Dowda, M., et al.(1997). Physical activity and physical f,rtness in African-American girls with andwithout obesity. Obes Res, 5(6), 572-577.
'Weiss, R., Dziura, J., Burgert, T. S., Tamborlane, W. V., Taksali, S. E., Yeckel, C. W., etal. (2004). Obesity and the metabolic syndrome in children and adolescents. NEngl J Med, 350(23),2362-2374.
Wells, J. C., Coward, W.4., Cole, T. J., & Davies, P. S. (2002). The contribution of fatand fat-free tissue to body mass index in contemporary children and the referencechild. Int J Obes Relat Metab Disord, 26(10), t323-I328.
'wiffmeier, K. D. M., Mollard, R. c., & Kriellaars, D. J. (2007). objective assessment ofchildhood adherence to Canadian physical activity guidelines in relation to bodycomposition . Applied Physiolo gy Nutrition and Metabolism, 3 2(2), 217 -224.
Zanconato, S., Baraldi, E., Santuz, P., Rigon, F., Vido, L.,DaDalt, L., et al. (1989). Gasexchange during exercise in obese children. Eur J Pediatr, 148(7), 614-617.
101