Bodney J. Mailer - MSpace - University of Manitoba
176
CULTIVAR IDENTIFICATION OF OILSEED BAPE, Brassica napus, BY HIGH PERFORMANCE LIOUID CHBOMATOGRAPHY (HPLC) AND RANDOMLY AMPLIFIED POLYMORPHIC DNA (HAPDS) A Thesis Submitted to the Faculty of Graduate Studies, University of Manitoba by Bodney J. Mailer ln Partial Fulfilment of the Requirements for the Degree of Doctor of Philosophy Department of Plant Science February, 1993
-
Upload
khangminh22 -
Category
Documents
-
view
0 -
download
0
Transcript of Bodney J. Mailer - MSpace - University of Manitoba

CULTIVAR IDENTIFICATION OF OILSEED BAPE, Brassica napus,
BY HIGH PERFORMANCE LIOUID CHBOMATOGRAPHY (HPLC) AND
RANDOMLY AMPLIFIED POLYMORPHIC DNA (HAPDS)
A Thesis Submitted to the Faculty of
Graduate Studies, University of Manitoba by
Bodney J. Mailer
ln Partial Fulfilment of the Requirements
for the Degree of Doctor of Philosophy
Department of Plant Science
February, 1993

¡*l National ubrary
Acouisitions andBibliographic Services Branch
395 wellinqton StreetOtlawa, OntarioK1A ON4
Bibliothèque nationaledu Canada
DÌrect¡on des acquisitions etdès services bìbliographìques
395, rue WellingtonOltawa (Ontario)KlA ON4
You¡ lile Vôt@ téléence
Oü I¡¡e Nalrc téléenêe
The author has granted anirrevocable non-exclusive lieenceallow¡ng the National Library ofCanada to reproduce, loan,distribute or sell copies ofhis/her thesis by any means andin any form or format, makingthis thesis available to interestedpersons.
The author retains ownership ofthe copyright in his/her thesis.Neither the thesis nor substantialextracts from it may be printed orotherwise reproduced withouthis/her permission.
ISBN ø-315-6166ø_ø
L'auteur a accordé une licenceirrévocable et non exclusivepermettant à la Bibliothèquenationale du Canada dereproduire, prêter, distribuer ouvendre des copies de sa thèsede quelque manière et sousquelque forme que ce soit pourmettre des exemplaires de cettethèse à la dispositíon despersonnes intéressées.
L'auteur conserve la propriété dudroit d'auteur qui protège sathèse. Ni la thèse ni des extraitssubstantiels de celle-ci nedoivent être imprimés ouautrement reproduits sans sonautorisation.
Canadä
CTLTMR IDENTIFICATION OF oILSÊED RAPE, Brassica !gP!s, BY
EIGE PERFORMANCE LIQI'ID-CEROMATOGRAPEY (ELC) AND
RANDOMLY AIIPLIFIBD PoI,YHORPEIC DNA(RAPDs )
BY
RODNSÍ J. }IAILIR
A Thesis subÃrÍtted to the Faculty of Graduate Studies of the University of Mânitoba in partial
fulfillment of the requirements for the degree of
DOCTOR OF PEILOSOPEY
o 1993
Pemrission has been g¡anted to the LIBRARY OF TI{E ITNMRSITY OF MANTTOBA to lmd o¡
sell copies of this thesis, to the NATIONAL LIBRÂRY OF CANADA to rricrofiln this thesls and
to lend o¡ sell copies of the fitm, and IJNTVERSITY MICROEILMS to publish an abstract of this
thesis.
The author ¡ese¡ves other pubtications rights, and neithe¡ the thesis nor extensive exkacts ftom it
may be printed or otherwise r€pmduced without th€ autho/s perrrission.

il
ABSTRACT
lnterest in the methodology for unambiguous identification of plant cultivars has
increased in recent years with international recognition of Plant Breeders
Rights. Oilseed rape (Brasslca napus L.) poses a particular difficulty as
cultivars of this outcrossing species may be heterogenous populations rather
than single genotypes. The methodology for discrimination of oilseed rape
cultivars therefore must distinguish characteristics which are more variable
among cultivars than within a cultivar.
Two methods were investigated to determine if they were suitable for the
identification of oilseed rape cultivars: reversed-phase high-performance liquid
chromatography (RP-HPLC) and randomly amplified polymorphic DNA
(RAPDS).
The HPLC technique involved analysis of ethanol extractable seed
components, some of which were identified as phenolic compounds. A
significant influence of environment on seed components was identified in the
comparison of samples from different sites. However, sufficient differences
were found among cultivars to discriminate among the 29 cult¡vars in the study.
Extraction and chromatographic conditions have been shown to be reproducible
over time, Using HPLC together with discriminate analysis, it was possible to
identify unknown cultivars correctly, based on the accumulated data set.

ilt
RAPD anaìysis was also successful in discriminating among a selected
set of 23 cultivars ol B, napus, An initial screening of a set of 100 random
sequence 10-mer primers identified 22 primers which produced polymorphic
markers. A set of six primers were selected which produced a total of 23
clearly discernible polymorphic markers ranging in size from 300 to 2800 base
pairs. These markers were sufficient to distinguish among the 23 cultivars.
Analysis of seed of five cultivars obtained from field trials at four locations gave
evidence of stability of the markers over source of the seed. Repeatability of
the test was investigated using four different thermocyclers, each of which
produced identical band patterns.
The two methods, RP-HPLC and RAPDs, were shown to have potential
as a means of cultivar identification in applications such as Plant Breeders
Rights.

IV
ACKNOWLEDGEMENTS
lwish to express my thanks to Dr. R.Scarth for her assistance in this
project and her help in preparing this manuscript. lalso thank my
committee members, Drs. J, Daun, B. Fristensky, W. Kim, and S.R. Rimmer
for their guidance and support throughout the course of this research.
Special thanks to Dr. T.C. Osborn for assistance in establishing the RAPD
protocol. The financial support of the University of Manitoba, Canadian
Grain Commission Grain Research Laboratories, NSW Department ol
Agriculture and the Australian Grains Research and Development
Corporation are gratef ully acknowledged.

FOREWORD
This thesis was written using manuscript format. The first manuscript,
"Optimisation and Evaluation of Reversed-Phase High-Performance Liquid
Chromatography For Cultivar ldentification ol Brassica napus L" has been
submitted to the Journal of Seed Science and Technology. The second
manuscript "Cultivar ldentification in Brassica napus L. Using RP-HPLC of
Ethanol Extracts" has been accepted for publication in The Journal ol The
American Oilseed Chemists' Society. The third, "Discrimination Among
Cultivars of Oilseed Rape (Brasslca napus L.) Using DNA Polymorphisms
Amplified From Arbitrary Primers", has been submitted to Theoretical and
Applied Genetics.

VI
TABLE OF CONTENTS
1. INTBODUCTION
2. LITERATURE REVIEW
Reproductive Biology of B. napus
History and Development of Oilseed Rape................
Economic lmportance of Canola
Plant Breeders Rights ............
Methods of Cultivar Discrimination
Physical Characteristics
Morphology
Phenology
Biochemical Methods
Glucosinolates
Phenolic Compounds
Oil Composition
Electrophoresis
High Performance Liquid Chromatography ......
DNA Fingerprinting ................
FIFLPS
PCB and BAPDs
DNA Isolation Methods
Applications ol RAPDs
PAGE
1.1
2. 1
2. 1
2.2¿,.7
2.42.52.5
2.10
2.12
2.14
¿,¿u

VII
3. OPTIMISATION AND EVALUATION OF RP.HPLC
Summary
lntroduction
Mater¡als and Methods
Results
Discussion
4. CULTIVAR DISCRIMINATION BY HPLC
Abstract
lntroduction
3. 1
JZ
J. .)
s4J/
3.1 0
5. 1
5.2ÃâÊ,8
5.11
t,1 ç.
6. 1
7.1
8.{
9. 1
10.1
4. 1
424ó
4.44. 11
Experimental Procedures
Results and Discussion ..
5. CULTIVAR DISGRIMINATION BY RAPDS
Summary
lntroduction
Materials and Methods
Results
Discussion
6. GENERAL DISCUSSION
7. SUMMARY / CONCLUSIONS
8. RECOTI/IMENDATIONS FOR FURTHER STUDY
9. REFERENCES
10. APPENDIX

vilt
LIST OF TABLES
TABLE PAGE
3,1 Sources of seed selected for RP-HPLC studies ..... 3.13
5,1 Cultivars and seed suppliers used for method
development (all cultivars ate B. napus oleifera
annua, spring types, unless otherwise specified).
The sample numbers are used elsewhere in the
paper to identify cultivars ........,.......,... 5.19
5,2 Primers used for RAPD analysis and discrimination
of B. napus 5.20

IX
LIST OF FIGURES
FIGURE PAGE
2,1 Genome relationship of Brassica species. A,B,C
are genome symbols and n = number of chromosome
pairs (U 1935) ........,.... 2. 1
2,2 Markers of a polygenic tra¡t can be selected by
screening samples from the extremes of a
continuously varying population which will be
high or low respectively for alleles for that trait
(Waugh and Powell 1992) .....,....... 2.22
3,1 Chromatogram of B. napus cy Westar (flow rate
1 ml min'l, injection volume 20 pl, column
temperature 40"C, detector 210 nm) 3.14
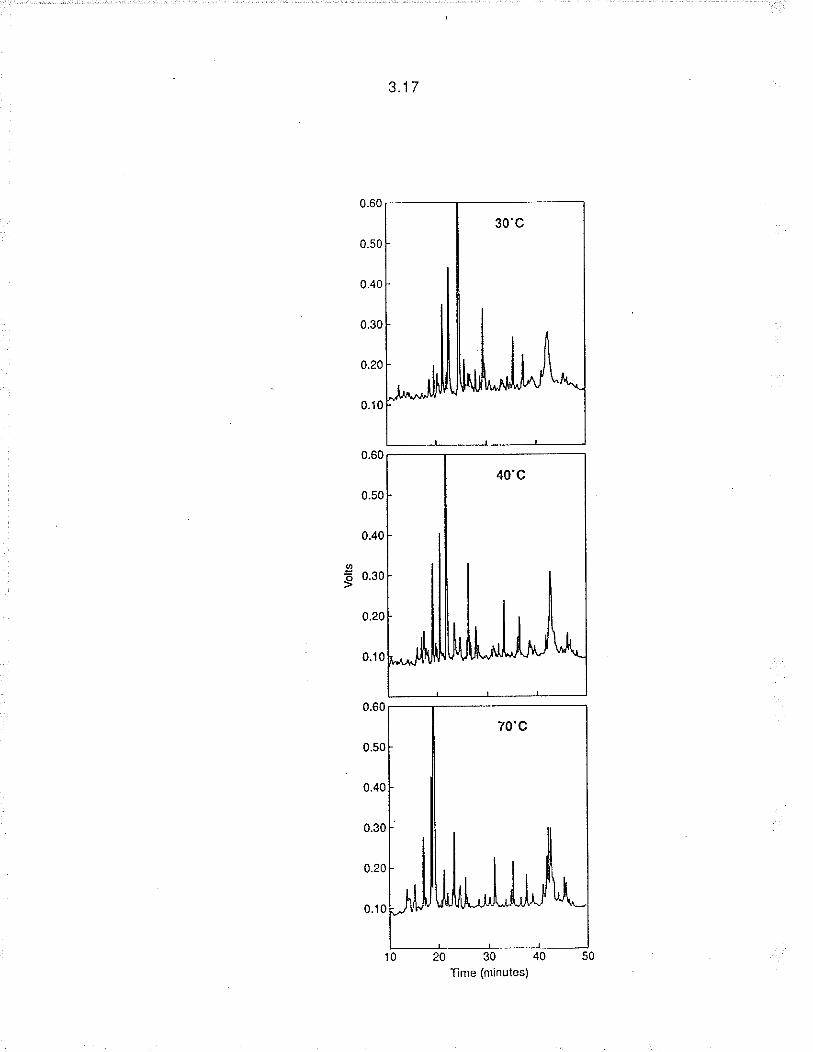
3,2 The effect of temperature on peak resolution.
(Operating conditions as for Fig. 3.1) ....................... 3.16
3,3 The linear response of increasing injection volume on
five chromatogram peaks (operating conditions as for
Fig. s.1) 3.18
3,4 Detector response at three wavelengths; 210 nm, 240 nm,
and 280 nm (operating conditions as for Fig.3.1) .... 3.20

3.5
X
Scan of chromatogram peak (27 minutes) between 3.22
200 and 400 nm (A - cv Westar; B - sinapine standard)
Chromatograms of five cultivars oÍ B. napus cy Stellar,
Regent, Delta, Westar, Hero and one cultivar B. rapa
cy Tobin (operat¡ng conditions as for Fig. 3.1) ........ 3.24
HPLC chromatogram of ethanol extract of B. napus
cv Excel, injection volume 20 pl, column temperature
40"C, flow rate 1 ml min'1, wavelength 210 nm ...,.,. 4.17
Detector response at two wavelengths; 210 nm and
280 nm (operating conditions as for Fig. 4.1) ........... 4.19
Chromatograms of six cultivars of B. napus.
Chromatograms have been amplified for detail
(operating conditions as for Fig. 4.1) ....,................... 4.21
Five overlaid chromatogram s ol B. napus cy Stellar
grown at five different sites: A = The Point, B = Baggot,
C = Teulon, D = Dauphin and E = Roblin (operating
conditions as for Fig. 4.1) ..,............. 4.23
Canonical Discriminant Analysis of five B. napus and
one B. rapa cultivar grown at different sites. D = Delta;
H = Hero; S = Stellar; R = Regent; W = Westar; T = Tobin
X = unidentified samples (SCGA - Westar) for testing
cultivar identification,..........,. 4.25
4.1
4.2
4.3
4.4
4.5

XI
4,6 SAS average linkage cluster analysis of 29 cultivars
of oilseed rape based on 10 peak areas from
Table 4.1 4.27
5.1 RAPD profile of DNA from 23 cultivars (numbered
as in Table 5,1)of oilseed rape using primers #329(a)
and #341(b) (Table 5.2). Only 23 of the 24 cultivars
are shown due to the limitations of the gel b0x........ 5.21
5.2 Four samples of each of five cultivars of B. napus
harvested from separate trials at diverse sites in
Manitoba and Saskatchewan...,............ 5.23
5.3 Average linkage cluster analysis (UPGMA) ol 24 x 24
matrix of Nei and Li (1979) similarity indices using
NT-SYS (Rohlf et al 1971) 5.25
5.4 RAPD profiles generated by 4 lhermocyclers;
A: Techne MW-2; B: Techne PHC-2; C: Thermolyne
TEMP.TRONIC and D: Ericomp Ez-Cycler; wilh
primer #329 and 4 cultivars; 1. Midas, 2. Bronowski,
3. Profit ( B. napus), and 4, Horizon (8. rapa) ......... 5.27

1. INTRODUCTION
Numerous cultivars of rapeseed (Brassica napus) are released annually from
breeding programs around the world. The ch aracterizat¡o n of th.ese cult¡vars
has become increasingly important for plant breeders, particularly with the
¡ntroduction of Plant Breeders Rights (PBR) legislation in many countries and
the need to demonstrate Distinctness, Uniformity and Stability (DUS, Plant
Varieties Journal 1991). Rapid, accurate methods of cultivar identification are
desirable to allow plant breeders lo monitor the use of their genetic material. ln
addition, these methods could be used to verify seed purily to ensure quality
standards are maintained for producers and processors. Plant breeders might
apply the methods to select breeding lines with desirable characteristics ¡f
desirable quality parameters can be related to markers.
Agronomic and phenotypic characteristics including flower colour, plant
height and leaf shape, previously employed for cultivar discrimination, may not
show sufficient distinctness to d¡fferentiale among cultivars. These characters
or traits are often unsatisfactory. They require plants to be grown to full
maturity under controlled conditions to avoid environmental influence. The
factors may also be dependent on the stage of plant development. However,
phenotypic and morphological characteristics such as plant growth period
(Halligan et al 1991) and seed shape (Barker et al 1992, Keefe 1992) continue
to be used for cullivar identification .
The need for better methods of cultivar discrimination is reflected in the

1.2
number of methods developed over recent years. Electrophoresis of seed
proteins to create cult¡var characteristic "fingerprints" has been the most
prominent and successful method for cultivar identification of commercial crops
such as wheal, Triticum aestivum L. (Wrigley et al 1982); cotton Gossyprt-rrn
spp. (Rao et al 1990); strawberries, Fragaria x ananassa Duch. (Nehra et al
1991)and pasture legumes, Trifolium spp. (Gardiner and Forde 1988). High-
performance liquid-chromatography (HPLC) of seed proteins has also been
used in crops including soybean, Glycine max L. (Buehler et al 1989); maize,
Zea mays L. (Smith 1988); rice, Oryza sativa L. (Huebner et al 1990); oats,
Avena sativa L. (Lookhart 1985); and wheat (Marchylo et al 1988). Applications
of chromatography for cultivar identification have been discussed at length by
Morgan (1989).
Predominantly autogamous (selfing) species are relatively simple to
characterize as the plants withìn a cultivar are genetically identical.
Characterization of predominantly allogamous (outcrossing) species is more
difficult as the cultivar consists of a heterogenous population. Despite this,
electrophoresis has been shown to be useful for predominantly allogamous
species (Gilliland 1989) including lhe Brassicas (Gupta and Robbelen 1986;
Chen et al 1989).
The most common rapid tests used by International Seed Testing
Association (ISTA) laboratories were shown in a recent survey (Van der Burg
and Van Zwol 1991) to be biochemical and electrophoretic tests.

1.3
Electrophoresis, restriction fragment length polymorphisms (RFLPs),
polymerase chain reaction (PCR), and high-performance liquid-chromatog raphy
(HPLC) were described as experimental techniques requiring the development
of simple and standardised laboratory protocol. The interest in cultivar
discrimination in Brassicas has resulted in many specialised tests based on
seed composilion such as fatty acids in oilseed rape (8. napus), (White and
Law 1991) or glucosinolates in Brasslca vegetables (Heaney and Fenwick
1980, Adams ei al 1989). Volatile hydrolysis by-products of glucosinolates in
swede (8. napus L. var napobrasslca (1.) Peterm.)(Cole and Phelps 1979) have
also been used.
ln recent years the analysis of plant genomic DNA has become common
in characterizing plant and animal species. Restriction fragment length
polymorphisms (B FLPs) have been used to invest¡gate genomic relat¡onships
(Song et al 1988; Figdore et al 1988). Aithough RFLP technology is now well
established, the technique has several disadvantages including the time and
labour requirements and the need for the use of radioactive material.
The relatìvely recent development of the polymerase chain reaction
(PCR) to amplify DNA and subsequently the use of randomly amplified
polymorphic DNA (RAPDs, Williams et al 1990) or arbitrarily primed PCR (AP-
PCB, Welsh and McOlelland 1990) have produced a useful new tool for cultivar
discrimination, RAPDs are a method of generating a type of genetic marker
based on DNA amplification which requires no knowledge of target DNA

1.4
sequence. The markers are generated by the amplification of random DNA
segments with single primers of arbitrary nucleotide sequence. The primers are
generally 1O-base o lig o n ucleotides and are used to find polymorphic regions
within the genome defined by the primer sequence. The products formed and
examined by agarose gel electrophoresis reveal sequence var¡ation in the form
of variable numbers of bands of variable length which may be characteristic of
the species and/or cultivars within a species. RAPDs may be the best method
available for plant cultivar discrimination without many of the limitations of RFLP
analysis. RAPD markers are considered to be dominant markers because the
presence of a given RAPD band does not distinguish whether its respective
locus is homozygous or heterozygous. Although this requires consideration in
phylogenetic studies, it does not reduce the usefulness of the technique for
f ingerprinting and cultivar identification.
This study investigates the application of RP-HPLC and RAPDs to the
discrimination of oilseed rape cultivars. The aims were to determine if there
were sulficient d¡fferences among B. napus cultivars to discriminate between
them, Both of the techniques were shown to have potential as a means of
successful discrimination, based on the range of cultivars tested. lt is also clear
that both methods have their own advantages and disadvantages and can be
adapted to suit individual needs and facilities.

2, LITERATURE FEVIEW
Reproductive Biology ol B, napus
The genus Brassica L. ìs in the Cruciferae family which includes numerous
closely related and important crop plants such as swede and turnip and several
oilseed species, Cytological studies have shown that the three species,
Brassica napus 1., B. juncea (L.) Czern. & Coss. and B. carinata A. Braun, are
amphidiploids derived from monogenomic or diploid species B.nþra (L,) Koch,
B. rapa L. and B. oleracea L. (Downey and Röbbelen 1989). The relatìonship
among the species is illustrated in Fig.2,1
Fig,2.1 Genome relationship of Brassica species. A,B,C are genome symbols
and n = number of chromosome pairs (U 1935).
B.nigraBB
(n=8)
B. car¡nataBBCC(n = 17)
B. junceaAABB
(n = 18)
B. oleraceacc
(n;9)B, napus
AACC(n = 19)
B, rapaAA
(n = 10)

2.2
The two rapeseed species B. napus and B. rapa have both spring and winter
types. Brâsslca napus is predominantly self pollinating although under open
field conditions, 20-30% outcrossing may result from pollination by wind and
insects (Rakow and Woods 19871. B. rapa is normally self-incompatible
although Downey and Röbbelen (1989) describe bud pollination or the use of
high levels of atmospheric CO, to be successful procedures to circumvent this
natural barrier,
History and Development of Oilseed Rape
Seed oil and meal quality of B. napus and B. rapa cultivars have been
considerably altered from classical oilseed rape cultivars through breeding. The
development of these new cult¡vars has resulted in a new classification of
oilseed rape known in Canada as'canola'. Canola is the seed oÍ B, napus and
B. rapa species, the oil component of which conlains less than two percent
erucic acid and the solid component of which contains less than B0 pM of any
mixture of 3-butenyl glucosinolaie,4-pentenyl glucosinolate,2-hydroxy-3-butenyl
glucosinolate, and 2-hydroxy-4-pe nte nyl glucosinolate per gram of oil free solid
as measured by the gas liquid chromatographic method of the Canadian Grain
Commission (Canola Oìl and Meal Standards and Regulations 1990), Low
glucosinolate and erucic acid oilseed rape cultivars are often referred to as
'double low'o¡lseed rape in many countr¡es,

2.3
Other breeding objectives include increased seed yield together with
increased seed oil and protein concentration (Downey and Robbelen 1989).
Further changes to oil quality are also desirable, such as the reduction of the
polyunsaturated fatty acid linolenic acid to improve storage characteristics of the
oil, as has been achieved in the B. napus cv Stellar (Scarth et al 1988).
Further improvements of the seed meal are desirable including reduction of
f¡bre content through the production of yellow seed coated cultivars, reduced
meal glucosinolates, sinapine and phytic acid concentrations to improve stock
feed palatability (Downey and Robbelen 1989).
High losses resulting from frost damage requires that future cultivars have a
high frost resistance level (Daun et al 1985). The development of cultivars
resistant to disease such as blackleg, caused by Leptosphaeria maculans
(Desm) Ces. and de Not., and increased tolerance to sclerotin¡a caused by
Sclerotinia sclerotiorum are important breeding objectives in Canada (Downey
and Robbelen 1989).
Economic lmportance of Canola
Fatty acid composition determines the value of seed oil. Current canola oil has
a relatively low saturated and high polyunsaturated fatty acid concentration,
making it a nutritionally superior oil (Canada's Canola 1988). Canola oil is
widely used in margarine, cooking oils and salad dressings in Canada. There

2.4
also exists a limited market for an oil with high levels of the long chain fatty
acid, erucic acid, for industrial purposes (Downey and Robbelen 1989). Canola
meal provides a quality animal stockfeed.
Approximate world production of rapeseed is 28.6 million tonnes (protein
meal 15.6, and oil 9.4; Fats and Oils in Canada 1991). Canadian oilseed rape
production in 1992 was 3.688 million tonnes (Statistics Canada, Fats and Oils
Report, 1992). Canada is the world's largest exporter of canola with about 2
million tonnes exported annually (Fats and Oils in Canada 1991).
Plant Breeders Rights
The most pressing needs for simple and unambiguous methods of cultivar
identification has been due to the introduction of Plant Breeders Rights. The
lnternational Union for the Protection of New Variet¡es of Plants (UPOV) is
concerned with international plant varietal protection. Canada is the 20th
member country of UPOV. The Canadian Plant Breeder's Rights Act became
law on August 1 , 1990 allowing protect¡on of prescribed species for up to 18
years. To meet the criteria for registration under the act (Plant Varieties
Journal 1991), varieties must be demonstrated to be new, specifically that the
variet¡es must not have been sold in Canada prior to submitting an application
for protection; distinct, in that a variety must be measurably diff erent f rom all
other varieties; uniform, with any variation predictable and commercially

2.5
acceptable; and the var¡ety must be stable in its characterist¡cs over successive
generations. Currently there are six categories covered by Plant Breeders
Rights in Canada including wheat, canola/rape, soybean, potato,
chrysanthemum and rose (Plant Varieties Journal 1991).
Methods of Cultivar Discrimination
The need for species and varietal markers was realised long before the
inlroduction of Plant Breeders Rights. Numerous tests have been developed
to permit taxonomic studies to be undertaken on plant species. Classical plant
classification is based on a phenetic comparison of morphological characters.
Biochemical tests to study plant constituents such as phenolics and fatty acids
(paper chromatography) were developed prior to the instrumental methods
which are used more commonly today. ln recent years, the development of
HPLC, gas-chromatography and electrophoresis techniques have made plant
identification less labour intensive and more precise. DNA fingerprinting has
been the most recent of these developments and appears to have great
potential, DNA techniques are used for identity testing, genome linkage
mapping, measuring genetic variation, populaiion and pedigree analysis,
localization of quanlitative trait loci and epidemiology (Debenham 1992).

2.6
Physical Characteristics
Morphology. Morphology refers to the form and structure of the plant. The
advantage of morphological descriptors, on the basis of seed characters for
marketing and at seed delivery sites, is that the time taken to evaluate seed of
the cult¡var is minimised. Morphological discriminators of plants are numerous
and examples of these are described in detail by Martiniello (1992) for var¡etal
registration of Mediterranean leguminous forage crops. They include: stem
characteristics such as height, colour and lateral branches; leaf shape, shape of
margin and features of the upper leaf surface; floral characteristics such as
number of inflorescences, petal colour, number of flowers per inflorescence;
fructiferous organs, shape, pod segmentation, seeds per pod, seed colour, seed
shape and hi¡um colour.
Discrimination on the basis of seed shape is often the only method of
routine variety checking of seed bulks at grain intake. in recent years image
analysis has been shown to provide relatively accurate discrimination in wheat
grains, despite some overlap among cultivars, as most varieties have grains
which exhibit a combination of shape and size which is typical or unique to the
variety (Keefe 1992, Barker et al 1992). Morphological differences were
employed to discriminate among Cenchrus pasture species (Nicholson et al
1985) using characteristics of the fascicle including lenglh, shape and colour
although shape varied with maturity and was not considered as a reliable
character.
2.7
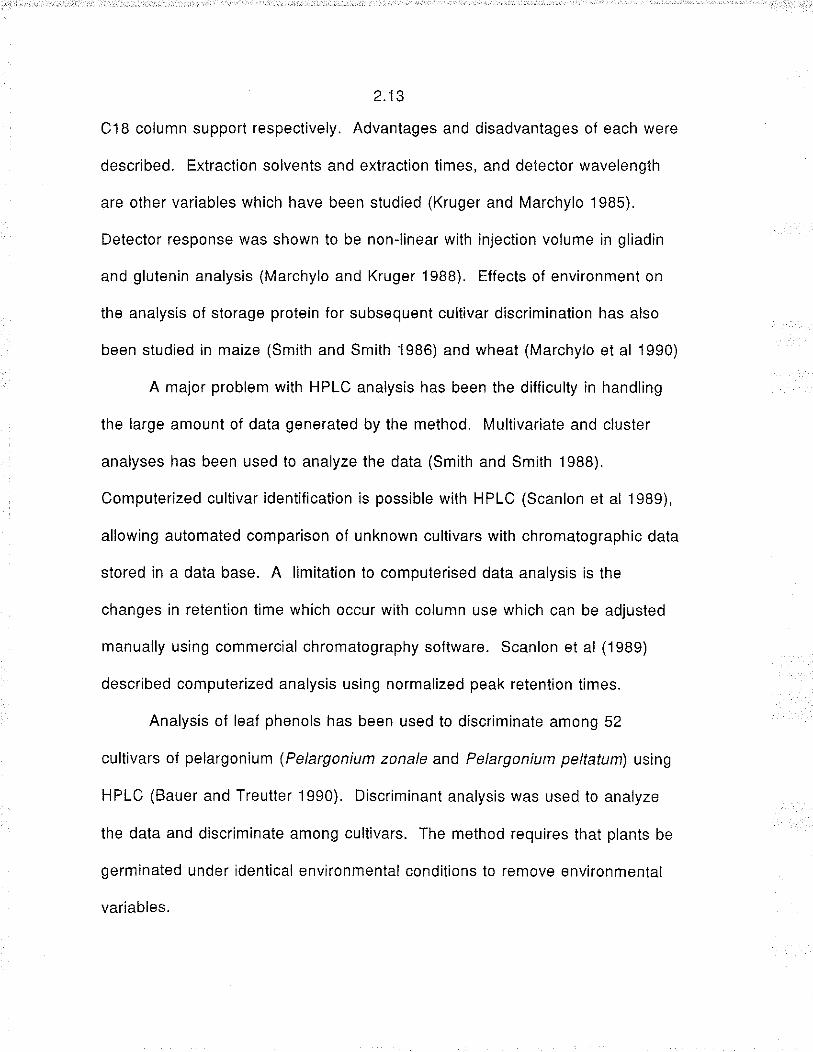
Phenology. Phenology is the study of periodic biotic events such as flowering,
dry matter and seed product¡on. lndividual and species specific characteristics
have been studied such as heading date in ryegrass (Halligan et al 1 991 ) in
which 18 cultivars were discriminated when grown under specif¡c vernalization
and daylength combinations,
Biochemical Methods
Chemical analysis provides an addit¡onal number of characters to distinguish
among plant cultivars. Although these characters are often more distinct
among cultivars than morphological and phenological characters, they are also
often subject to the same environmental influences. The compounds which are
suitable for discrimination within a species are generally specific characters of
the species such as the fatty acid profiles (White and Law 1991) and
glucosinolates (Horn and Vaughan 1983) within Brassica species.
Glucosinolates: Of particular interest in Brassica species is the occurrence and
distribut¡on of glucosinolates. Glucosinolates are a class of sulphur containing
compounds which when hydrolysed by the myrosinase enzyme present in
Brassica vegelative and seed tissues, release thiocyanates, isothiocyanates
and nitriles which reduce feed palatability and adversely affect iodine uptake of
the thyroid gland in non-ruminant animals (Downey and Röbbelen 1989). Horn
and Vaughan (1983) showed glucosinolates to be useful as chemotaxonomic

2.8
markers among 14 Brassica species stud¡ed. Glucosinolates, however, were
less reliable for cultivar discrimination in B. napus (Adams et al 1985) in which
only two patterns were observed, one exhibited in all cultivars with high levels
of glucosinolates in the seed meal and the other common to all cultivars with
low levels of glucosinolates. Adams et al (1989) had some success in
distinguishing among nine cultivars of swede (Brassica napus l. var.
napobrassica (L.) Peterm.) when they used glucosinolates extracted from plant
roots. The volatile products released from cruciferous material upon enzymatic
reaction on glucosinolates include isothiocyanates and nitriles. Using gas
chromatography-mass spectrometry of isothiocyanates and nitriles and
canonical variate analys¡s, Cole and Phelps (1979), were able to differentiate
among 14 cultivars of swede. Although the study involved analyses of samples
before and after storage, there was no study carried out to determ¡ne the effect
of environment which has been shown to alter the levels of glucosinolates
(Mailer and Wratten 1985) and presumably also the levels of volatile by-
products.
Phenolic Compounds: Other compounds of specific interest for discrimination
in Brassica species are sinapine (3,5-d im ethoxy-hyd roxycin namoylch o lin e) and
related low molecular weight phenolic choline esters. Sinapine is responsible
for the disagreeable taste of eggs, a result of the production of trimethylamine,
produced by poultry fed with rapeseed meal (Bell 1989). Bouchereau et al

2.9
(1991) found qualitative and quantitative distribution patterns of these
compounds to be characteristic of the genus and therefore to have potential for
Cruciferae chemotaxonomy. There are a wide range of phenolic and flavonoid
compounds in Brassica species as demonstrated in a review listing 1 20
flavonoids in over 100 species (Fursa et al 1986). These compounds have
been used in many studies to generate taxonomic data (Hoshi and Hosoda
1978). Phenolics have also been used in other species including Pelargonium
(Bauer and Treutter 1990) for cultivar identification.
Oil Composition: Sterols in oils from a selection of seeds of Brasslca and
Sinapis species have also been found io be species specific (Appelqvist et al
1981), although no study of cultivar discrimination was reported. No differences
were found between spring and winter types ol B. rapa. Fatty acids in the oil of
B. napus have also been studied as a chemotaxonomic tool (White and Law
1991) although the effects of temperature on fatty acid profiles have been well
documented (Canvin 1965), Despite the success of fatty acid profiles together
with canonical variate analysis to distinguish among three cultivars grown in the
United Kingdom, it is unlikely that this method would succeed under all growing
conditions. Fatty acid profiles have been shown to vary widely across
environments in Australia (Mailer 198B).

2.10
Electrophoresis
Separation of seed protein by elther starch or polyacrylamide gel
electrophoresis is a routine procedure for many crops for seed certification,
genetic purity testing, to distinguish among cultivars and to study within
population genetic variability (Ladizinsky and Hymowitz 1979). The composition
of seed proteins is highly stable and only slightly affected by environment
(Ladizinsky and Hymowitz 1979) as they are generally storage proteins and not
likely to change in dry mature seed. Proteins include prolamlns (alcohol
soluble), albumins (water soluble), globulins (saline soluble) and glutelins
(insoluble in saline solution, alcohol or neutral aqueous solution) based on the
protein classification of Osborne (1924). Electrophoresis technology continues
to develop as described by McDonald and Drake (1990) using a ,pharmacia
Phast' commercial rapid and automated electrophores¡s system for var¡etal
identif ication of seeds.
Wheat cultivars can be identified by several electrophoretic techniques
including gliadin analysis by starch gel electrophoresis or polyacrylamide gel
electrophoresis (acid PAGE), and wheat storage proteins (gliadins and
glutenins) by sodium dodecyl sulphate gradient polyacrylamide gel
electrophoresis (SDSGPAGE) (Marchylo et al 1989), Besides cultivar
identification, identification of high molecular weight glutenin subunits is
important because of their relationship to breadmaking quality. similar analysis
has been used to identify cultivars of barley (Marchylo 1987), oals lAvena

2.11
sativaL.l (Hansen et al 1988) and maize (Smith 1988).
Although electrophoretic analysis of seed storage proteins is widely used
as a method for cultivar discriminaiion in predominantly autogamous species,
particularly cereal crops, SDS-PAGE has also been used successfully, in
predominantly allogamous species including pasture grasses (Gardiner and
Forde 1988), As only part¡al d¡stinctness is usually achieved among cultivars of
allogamous species, electrophoresis was used to test individual plants (Gilliland
1989) and the cultivar description based on the frequency of plants which
expressed certain electrophoret¡c patterns. Alternatively, a bulked sample was
used, sufficiently large to represent the genetic variation of the population.
Electrophoresis has been used for cultivar identification in many crops
including field beans lPhaseolus vulgaris L.l (Hussain et al 1986); watermelon
lCitrullus lanatus Thund. (Matsum. and Nakai)l (Biles et al 1989); cotton
lGossypium arboreum L. and G. hirsutum L.l (Rao et al 1990); strawberry
lFragaria x ananassa Duch.l (Nehra 1991); sweetpolalo Upomoea batatas (L.)
Lam.l (Kennedy and Thompson 1991) and kiwifruit lActinidia deliciosa (A.Chev.)
C.F.Liang et A.R. Fergusonl (Messina et al 1991). Ladizinsky and Hymowitz
(1979) describe the use of electrophoresis for species identification in 45
different genera f rom 13 plant families.
Electrophoresis has been used to study relationships among Brassica
cultivars (Yadava et al 1979; Chen et al 1989; Coulthart and Denford 1982),
evolution of cauliflower types (Allen et al 1986) and to identify genelic markers

2.12
for breeding (Gardiner and Forde 1988). lt has become a common technique
for cultivar discrimination and seed pur¡ty testing in a range of Brasslca crops
includìng B, napus (Gupta and Röbbelen 1986; Chevre et al 1991), B. oleracea
(Arus et al 1985), and Raphanus sat¡vus L. (radish) (Saharan et al 1991).
High Performance Liquid Chromatography (HPLC)
HPLC analysis of proteins for cultivar discrimination has been developed
as a method for cultivar identification, particularly for cereal crops (Bietz and
Cobb 1985). lt is sometimes used in conjunction with electrophoresis to
provide positive identification of cultivars (Smith 1988). The application of
H PLC to cereal crop analysis permits identification of cultivars as well as the
ability to detect seed batch adulteration as each seed in the cultivar should be
identical and analysis of single seeds can identify seed variation. HPLC
applications to cereal crop identification include wheat (Bietz and Cobb 1985),
oats (Lookhart 1985), maize (Smith and Smith 1988), and rice (Huebner et al
1990). Studies have been undertaken to improve HPLC procedures including
studies of gradient conditions, elevated temperatures and the addition of
internal standards (Bietz and Cobb 1985). They showed that more than 100
analyses per day were possible with faster flow rates and gradients, resulting in
improved reproducibility with shorter runs. lmproved resolution was also
obtained with higher temperatures. Marchylo and Kruger (1985) investigated
the use of 3 different columns of 7.5, 10 and 25 cm lengths with C3, CB and
2.13
C18 column support respectively. Advantages and disadvantages of each were
descrjbed. Extract¡on solvents and extraction times, and detector wavelength
are other variables which have been studied (Kruger and Marchylo 1985).
Detector response was shown to be non-linear with injection volume in gliadin
and glutenin analysis (Marchylo and Kruger 1988). Effects of environment on
the analysis of storage protein for subsequent cultivar discrimination has also
been studied in maize (Smith and Smith 1986) and wheat (lúarchylo et al 1990)
A major problem with HPLC analysis has been the difficulty in handling
the large amount of data generated by the method. Multivariate and cluster
analyses has been used to analyze the data (Smith and Smith 1988),
Computerized cultivar identification is possible with HPLC (Scanlon et al 1989),
allowing automated comparison of unknown cultivars with chromatographic data
stored in a data base. A limitat¡on to computerised data analysis is the
changes in retention time which occur with column use which can be adjusted
manually using commercial chromatography software. Scanlon et al (1989)
described computerized analysis using normalized peak retention times.
Analysis of leaf phenols has been used to discriminate among 52
cultivars of pelargonium (Pelargonium zonale and Pelargonium pelfafum) using
HPLC (Bauer and Treutter 1990). Discriminant analysis was used to analyze
lhe data and discriminate among cultivars. The method requires that plants be
germinated under identical environmental conditions lo remove environmental
variables.
2.14
DNA Fingerprinting
DNA analysis is commonly used in animal pedigree analysis, medical science
and anthropology. The results in conjunction with statistical analysis can be
used to show identity or relatedness. For plant ch aracterization, genetic
markers are ideal as they are not affected by the environmental factors which
influence the expression of morphological and agronomic traits. Genetic
markers may be produced from isozyme analysis, restriction fragment length
polymorphisms (RFLPS) or randomly amplified polymorphic DNA (RAPDS),
lsozyme analysis uses polymorphisms of enzymes which differ in
electrophoret¡c mobility as genetic markers. lt is rapid and inexpensive but is
limited by a lack of polymorphisms and the need for a var¡ety of staining
solutions for marker detection (Anderson and Fairbanks 1990).
Restriction Fragment Length Polymorphisms (RFLPS). Substantially more
markers are provided by restriction fragment length polymorphisms (RFLPs)
than for isozyme analysis. The number of markers is unlimited although costs
for material and labour are restrictive. Methods for studying RFLPs to produce
DNA markers are well documented (RFLP Training Manual 1989). They are
often used in combination with other markers such as isozymes, morphological
and phenological characteristics (Landry et al 1987) for varietal identification,
genetic analysis of quantitative traits and breeding methodologies. RFLPs have
several advantages including the ability to detect Mendelian inheritance

2.15
(genomic RFLPs) and maternal inherilance (organelle RFLPs). They are
detectable in all tissue and at all ages of maturity. Multiple alleles are identified
with each probe and an unlimited number of probes are available. ln additìon,
they are not effected by environmental influences (Landry et al 1987).
The majority of published data on RFLPs refers either to the
development of linkage maps which are applied to mapping ol quant¡tative trait
loci or to phylogenetic analyses. These studies include barley (Heun et al
1991), maize and lomato (Helentjaris et al 1986), lentil (Havey and Muehlbauer
1989), bananas (Gawel et al 1992), lettuce (Landry et al 1987), and pepper
(Livneh et al 1990), and several studies on Brassica (Chevre et al 1991,
Figdore et al 1988, Song et al 1991, Landry et al 1991). The use of RFLPs
and the development of linkage maps has made possible selection of breeding
lines based on markers linked to genes controlling quantitative traits. These
markers have been linked to quality characteristics such as soluble solids in
tomato (Osborn et al 1987) or disease resistance, including powdery mildew
resistance in barley (Schuller et al 1992) and lettuce (Paran et al 1991).
Polymerase Chain Reaction (PCR) and RAPDs. Since its inception ¡n 1983,
application of PCR has had a major impact on molecular biology (Mullis 1990).
It allows selective amplification of specific segments of DNA from the total DNA
using oligonucleotides as primers. An oligonucleotide is a short chain of
specifically ordered nucleotide bases which will bind to a complementary site in

2.16
single stranded DNA.
The polymerase chain reaction was the basis for the development of a
secondary technique referred to as randomly amplified polymorphic DNA
(RAPDs, Williams et al 1990) or arbitrarily primed PCR (AP-PCR, Welsh and
McOlelland 1990). RAPDs involve the amplification of DNA segments using
random sequence oligonucleotide primers, generally of 10 bases, to find
polymorphic regions within the genome, defined by the primer sequence. The
products formed and examined by agarose gel electrophoresis reveal sequence
variation in the form of variable numbers of bands of variable length which may
be characteristic of the species and/or cultivars within a species. RAPDs
require no previous sequence information for f¡ngerprinting of cultivar genomes,
none of the probes necessary for RFLPs and no âutoradiography. The markers
may be visualised and photographed immedialely in the gel rather than
requiring transfer to a membrane. Polymorphic RAPD markers may also be
combined with RFLPs to provide probes, eliminating the need for recomblnant
DNA cloning of probes in bacteria (Williams et al 1993).
RAPDs may detect a single base change in genomic DNA (Williams et al
1990), although perfect pairing between primer and template may not always
occur and there is some evidence of mismatch amplification. Polymorphisms
may also result from deletions of a priming site, or insertions that separate
priming sites making them too far apart to amplify or insertions that change
DNA segment length, The probability of a primer finding binding sites on
2.17
opposite strands of the template within a distance that can be traversed by the
DNA polymerase is simple to calculate (Williams et al 1991 b). lt appears that
the number of bands is independent of the number of potential sites and
appears to be controlled by competition between the substrates rather than by
the number of potential sites. Martin et al (1991) developed a formula for
calculating the number of random primers necessary in order to find a marker
linked to the locus of interest. The probability of obtaining a marker within a
specified distance of a target gene in NlLs (near isogenic lines) depends on the
number of primers screened, the genome size in map units, and the degree of
DNA sequence convergence between the Nlls in the region surrounding the
targeted gene. If the sequences are similar, a pr¡mer is less likely to find a
polymorphism. The expected minimum distance = c/2 (nx + 1) where c =
genome size in cM, n = number of primers, x = average number of primer
products per primer.
DNA lsolation Methods. The first step in DNA fingerprinting by either RFLPs or
PCR is the extract¡on of DNA from plant material. There are many methods
published for DNA isolation, the melhod often being related to the purity of the
DNA required for the purpose, Many methods require the use of phenol or
chloroform and detergents such as cetyltr¡methylammonium bromide (CTAB )
and sodium dodecyl sulphate (SDS), Even rapid methods for PCR generally
require grinding of plant material in pestles that must be cleaned between uses,

2.18
heating for 60 minutes, and emulsification with chloroform. Often a density
gradient centrifugation step in cesium chloride is used to partition the DNA from
enzyme inhibiting po lysaccharides. This purification step may be replaced with
the use of CTAB.
The extraction method used should provide reasonably high quality DNA
with a minimum of labour input. Plant materìal is often harvested onto ice,
frozen as quickly as possible at -80"C and stored until required for extraction.
The samples are then ground in liquid nitrogen or dry ice, avoiding thawing of
plant tissue. lt has been shown that it is more convenient to harvest the plant
material and lyophilise immediately to avoid using dry ice or liquid nitrogen
(Kidwell and Osborn 1992). The lyophilised material can be stored in a
dessicator at 20"C.
Extraction of DNA as described by Rogers and Bendich (1988) involves
breaking, generally by grinding, or digestion of cell walls and disruption of cell
membranes, in the presence of detergent including SÐS or CTAB. DNA is
protected from endogenous nucleases with detergents and ethylenediaminetetra
acetic acid (EDTA). EDTA, a chelating agent, binds Mg** ions generally
considered a necessary cofactor for most nucleases. The buffer/tissue mixture
is emulsified with chloroform or phenol to denature and separate proteins from
the DNA. During extraction, shearing of DNA strands must be avoided. The
time between thawing frozen, pulverlzed lissue and exposure to extraction
buffer should be minimized to avoid nucleolytic degradation of the DNA,

2.19
A miniprep method was developed by Kidwell and Osborn (1992) for
RFLP and PCR analysis using CTAB. CTAB forms complexes with
polysaccharides but precipitates nucleic acid when NaCl concentrations are
lower then 0.5 M. DNA is precipitated in buf fer (pH 8.0) in the presence of
CTAB at low NaCl concentration, thus removing many polysaccharides which
are still soluble at the lower NaCl concentration,
A simple method was described by Oard and Dronavalli (1992), requiring
no phenol, chloroform, detergents or mortar and pestles. Small pieces of
frozen plant material are ground in 1.5 ml Eppendorf tubes using disposable
grinding sticks, TE extraction buffer (trizma base 10 mM (pH 8.0), 1 mM
EDTA) with mercaptoethanol is added, the tube is heated in boiling water for 10
min. and centrifuged. DNA is precipitated from the supernatant with ammonium
acetate/ethanol, resuspended in TE buffer and incubated with RNase.
Edwards et al (1991) collected plant material using sterile Eppendorf
tubes to pinch out leaf disks to prevent the possibility of contamination from
handling. The tissue is macerated with a disposable grinder and DNA extracted
in 400 pl TE buffer (pH 7.5) containing SDS. The samples are extracted for 1
hour at room temperature, centrifuged and the DNA precipitated from the
supernatant with isopropanol. After drying, the sample is resuspended in TE
buffer, and stored at 4"C at which temperature it is stable for more than a year.
Belween 2.5 and 25 pl are used for PCR, depending on tissue maturity.

2.20
Applications of Randomly Ampl¡tied Polymorphic DNA (RAPDs)
Applications of RAPDs have included the identification oi Brassica species
(Quiros et al 1991) and conifers (Carlson et al 1991), identification of species of
Pyrenophora lto and Kuribyashi; (Reeves and Ball 1991) and isolates of
Colletotrichum graminicola (Ces,) G.W. Wils., (Guthrie et al 1992), parentage
determination in maize hybrids (Welsh and McClelland 1990) and cultivar
identification of broccoli and cauliflower (Hu and Quiros 1991).
RAPDS, in conjunction with NlLs can be used to identify markers linked
to genes of interest. To create NlL, the F, from an initial cross is backcrossed
to a recurrent parent, the parent in which the desirable characteristic will be
incorporated. Repeated backcrossing with repeaied selection for a desirable
character at each generation results in a genotype essentially identical at all loci
to lhe recurrent parent with the except¡on of the loci surrounding the gene of
interest. Polymorphisms deiected in NIL therefore have a high probability of
being linked to that gene. Using RAPDs to identify polymorphisms in NlL,
Martin et al (1991) identified three markers fiom 144 random primers, tightly
linked to a gene conferring resistance lo Pseudomonas syringae pv. tomato.
The identification of RAPD markers took four weeks compared to a predicted
two years using RFLPs.
Michelmore et al (1991) used bulked segregant analysis from the
homozygous individuals of an F. population, in which DNA from individuals

2.21
segregating for downy mildew resistance was bulked, as was DNA from
susceptible plants. The two bulked samples, which were homozygous for
alternative alleles at the resistance gene loci, have heterozygous backgrounds
due to contribution of other unselected alleles from the individuals in the bulk.
Any polymorphisms detected were therefore likely to be linked to resistance
genes. ln 300 PCR reactions, three markers were identified which were linked
to the target locus.
Traits controlled by polygenic systems include yield and quality and are
characterized by continuous variation across the populat¡on. This variation can
be visualised as a normal distribution (Fig. 2.2), with individuals at extremes of
the curve being low in the number of individual genotypes present. DNA from
the individuals in the tails of the distribution are pooled to form a bulk and
screened with RAPDs to identify markers linked to the quantitative trait. The
efficiency of this method is improved with the use of recombinant inbred lines
(RlL) and in particu{ar, doubled haploid families since dominance related effects
are absent and linkage data can be obtained directly. RIL are derived by
repeated sibling crosses starting with the second (Fr) generation from a cross
resulting in homozygous plants. The family can be extensively replicated
assisting in the partitioning of phenotypic variation into heritable and non-
herjtable components, for example, in Arabidopsis thatiana (Reiter et al 1992).

2.22
aa 33 34 35 37 38 39 40 41 42 43 44 45 46
Co n ce ntrqtio n (%)
Fig.2.2. Markers of a polygenic tra¡t (e.9, oil concentration) can be selected by
screening samples from the extremes of a continuously varying population
(Frequency = number of individual genotypes) (from Waugh and Powell 1992).
Map positions of polymorphisms can be determined using RAPDs and
recombinant inbreds. Two polymorphisms closely linked genetically will either
both be present or both absent in any RlL. ln markers which are more distantly
linked, co-segregation diminishes because of recombination between
chromosomes from the parents during the breeding process. Well saturated
genetic maps can quickly be constructed using RAPD markers as described for
Oc0)l(tq)t_LL5
31 36
oìl

2.23
Neurospora crassa (Kubelik 1991) and Arabidopsis thaliana (Reiter et al 1992).
Paran et al (1991)using NIL and 200 RAPD primers to generate 1880 RAPD
bands, identified 10 markers linked to downey mildew resistant genes in lettuce.
RAPD (or AP-PCR) is far easier than other techniques for identifying
DNA markers as no RFLP probes have to be identified. The generation of
clones and plasmid purification are unnecessary. Polymorphisms can be
visualised directly from the gel by ethidium bromide or fluorescent detection.

Optimisation and Evaluation of Reversed.Phase
High-Performance Liquid Chromatography For
Cultivar ldentification ol Brassica napus L.
R. J. Mailer and J. Daun
Canadian Grain Commission, 1404-303 Main Street
Winnipeg, Canada, R3C 3G8
and
R, Scarth
University of Manitoba, Winnìpeg, Manitoba, Canada, R3T 2N2
Submitted to Seed Science and Technology
Contribution No. 940

3.2
Summary
Cultivar identification has become increasingly important with the international
recognition of Piant Breeders Rights. The objective of this study was to define
a method to identify cultivars oÍ Brassica napus 1., a predominantly self
pollinating species, using reversed-phase high-performance liquid
chromatography (RP-HPLC) based on the separation of ethanol extractable
seed components. Characteristic profiles were achieved using 70% ethanol
extracts of defatted flour. Chromatography was carried out using a Vydac C18
reversed-phase column. A water/acetonitrile gradient, containing 0.1%
trifluoroacetic acid (TFA), from 0 to 50% acetonitrile over 60 minutes, provided
optimum resolution. Maximum number of peaks were obtained at detection
wavelength 210 nm and several peaks had greater absorbance at 240 nm.
Repeated analysis indicated that extraction and chromatographic condilions
were reproducible. The results of this study show that the method has potential
for ch aracte r¡zatio n of B. napus cultivars.

3.3
lntrod u ctio n
Oilseed rape (Brassica napus l, var. oleifera Metzg.) is a valued commercial
crop due to the high quality oil and meal, New cullivars of rapeseed are
constanily being developed from breeding programs around the world.
ldentilication of these cultivars is increasingly important for plant breeders,
particularly with the introduction of Plant Breeders Rights (PBR) legislation in
many countries. Although B. napus is a predominantly self pollinating species,
up to 30% outcrossing may occur (Rakow and Woods 1987). lt is therefore
difficult to characterize as each cultivar consists of a heterogenous population,
The ability to identify seeds is important to allow plant breeders to monitor the
use of their genetic material. Accurate identification also allows seed purity to
be verified by seed testing laboratories and certification authorities and ensure
quality standards are maintained.
Despite numerous investigations for ch aracterization of outcrossing
species such as B. napus, unambiguous identification has not been possible.
Phenotypic ch aracteristics, including flower colour, plant height and leaf shape
do not show sufficient distinctness to differentiate among cultivars and are often
influenced by environment and stage of plant maturity. Glucosinolate profiles
have been used to identify swede (8. napus L. var. napobrassica (L.) Peterm.),
a related taxon (Adams, Vaughan and Fenwick, 1989). Electrophoresis and
reversed-phase high-performance liquid chromatography (RP-HPLC) of seed

3.4
proteìns has been used to characterize cultivars of many crops jncluding wheat,
Triticum aestivum L. (Marchylo, Hatcher and Kruger, 1988); oats, Avena sativa
L, (Lookhart, 1985); soybean, Glycine maxL. (Buehler, et al. 1989); and maize
Zea mays L. (Smith, 1988). Although most electrophoresis work has been on
predominantly autogamous (selfing) species, the technique has been shown to
be useful for predominantly allogamous (outcrossing) species (Gilliland, 1989).
Protein patterns have been utilised for cultivar idenlification in Brassica species
by polyacrylamide gel electrophoresis (PAGE)(Ladizinsky and Hymowitz, 1979;
Gupta and Röbbelen, 1986). The wide range of phenolic and flavonoid
compounds in Brassica species have been used to generate taxonomic data
(Hoshi and Hosoda, 1978).
The objective of this sludy was to develop and optimize a method of
cultivar identification ¡n B. napus based on RP-HPLC analysis of seed
components including proteins and phenolic compounds.
Materials and Methods
Seed samples of five cultivars of B. napus, cy Westar, Stellar, Hero, Delta and
Regent; and 1 of B. rapa L. cv Tobin, were obtained from cultivar evaluation
trials grown in 1991 at sites in Saskatchewan and Manitoba as detailed in Table
3.1 . Two of the cultivars had similar pedigrees, cy Stellar and Regent, and the
other three cultivars, cy Delta, Westar and Hero had dislinct pedigrees. Two

3.5
additional seed samples, cy Global and Westar, were used to develop the
HPLC method.
The analyses were carried out us¡ng a Waters HPLC system including
two 51 0 pumps, a Wisp autosampler, column oven with temperature control and
a 994 LC programmable photodiode array UV-Vis Detector, The data system
incorporated an IBM AT compatible computer together with Waters "Maxima"
integration software which controlled the solvent gradient, peak integration and
data handling. A Vydac 2181P54 C18,5 gm x 30 nm,0.46 x 25 cm column
was used for chromatography. Elution solvents were water (Solvent A), purified
through a Millipore Super-Q system (Millipore Corp., Bedford, Mass,) and
Millipore type HA 0.45-pm filter, and HPLC grade acetonitr¡le (ACN, Solvent B)
obtained from Fisher Scieniific (Fair Lawn, N.J.). Trifluoroacetic acid (TFA,
Sequanol grade) was obtained from Pierce Chemical Co. (Rockford, lll.).
Optimisation of extract¡on conditions
Samples of two cultivars, Global and Westar, selected because of their distinct
pedigrees, were used to develop the HPLC method. Seed was ground in a
Retsch Grinder fitted with a 0.5 mm screen prior to extraction of oil with a
Tecator Soxtec apparatus, The flour was again ground prior to analysis.
Extraction of soluble components from the flour was achieved us¡ng both water
and 7 0o/o ethanol. Flour (0.04 g) was weighed into 2 ml plastic microcentrifuge
tubes, extraction solvent (1.0 ml) added and the tubes shaken for t hour on a
3.6
reciprocating shaker. The tubes were centrifuged on a high speed centrifuge
for 5 minutes and the clear supernatant removed for HPLC analysis.
O pti misati o n of e lution co n diti ons
1. Evaluation of elution solvent gradients, flow rates and TFA levels. A
series of solvent gradients were investigated to determine the optimum gradient
for good peak resolution within a minimum time. Gradients started at 100%
water (Solvent A) increasing to 25, 50 or g0l" acetonitrile (ACN, Solvent B)
over 30, 60, 90 and 120 minutes. Flow rates of 0.5, 1 ,0 and 2.0 ml min'l were
investigated. Solvents contained TFA ion-pairing reagent (Buehler et al 1989),
added to decrease non specific ¡nteractions with the column matrix.
Concentrations of 0, 0.05, 0.10, and 0.20% TFA were added to the elut¡on
solvents to determine the ideal amount.
2. Eflect of column temperatures. Above ambient column temperatures
were necessary to avoid diurnal fluctuations. Temperatures of 30,40,50,60
and 70"C were investigated.
3. Effect of injection volume on resolution. lnjection volume has been
shown to be non-linear in the quant¡tative analysìs of gliadins and glutenins
(Marchylo and Kruger 1988). To determine if quantitat¡ve errors may occur as
a result of injection volume, volumes of 5, 10, 20, 50, 100 and 200 pl were
tested. The relationship of detector response to injection volume was
calculated to ensure linearity.

3.7
4, Detection wavelength. Chromatograms were acquired and detected at
2'10 nm as is typical for protein analysis in cereals (Marchylo, Hatcher and
Kruger 1988). Using the 994 LC UV-Vis detector, samples were monitored
simultaneously al 240 and 280 nm to determine the maximum sensitivity.
5. Reproducibility of extraction and injection. Repeated inject¡ons (n=10)
of a single sample were carried out to test instrumental variability. Similarly, 10
independent extracts of a sample of meal were made over a period of two
weeks to determine laboratory error.
6. Statistical Analysis. Chromatograms were integrated with Waters'
Maxima software. Peak areas of the chromatogram components were utilized
to study reproducibility of extracts and injection using SAS Proprietary Software
Release 6.06.01 (SAS lnstitute, Cary, NC, USA) and procedure Proc Means.
Resu lts
Optimisation of extraction conditions
Similar chromatograms were obtained from water or ethanol extracts. The
water extracts contained some additional, poorly resolved components and
precipitated some material (possibly protein) within 16 hours. Higher levels of
B. napus protein are soluble in aqueous solution than in 70 % ethanol
(Appelqvist 1972). Electrophoresis of the eluted peaks f rom the ethanol
extracts did nol produce evidence of protein, possibly due to insufficient

3.8
concentrations. As aqueous extracts presented no additional advantage under
the conditions described, all subsequent analyses were carried out using 70 %
v/v elhanollwalet.
O pti m ¡sation o'Í eluti o n con diti o ns
1, Solvent gradient and TFA concentration. Optimum resolution in
minimum time was achieved with the following conditions. Seed componenls
were eluted with a solvent flow rate of 1 ml min-l, with 100% Solvent A for 5
minutes followed by a linear gradient to 50% solvent B in 60 minutes. The
final concentrat¡on of 50% solvent B was maintained for 10 min. The addition
of dissociating agents such as TFA is common in protein analysis (Buehler et al
1989) to improve peak shape and definition. Despite the fact that most of the
peaks appear not to be proteins, based on electrophoresis data, the lack of
TFA resulted in some peak broadening and poor resolut¡on, There was no
visible difference in the effect of 0.05, 0.10 and 0.20 .k vlv fFA. For
subsequent analysis, 0.10 % v/v was used to ensure the level was adequale.
Using this gradient, flow rate and TFA concentration, a well resolved
chromatogram was obtained (figure 3.1 ) and the same conditions were used f or
the remainder of the evaluation.
2. Column temperature. lncreased temperatures resulted in reduced
retention time and peak resolution (ligure 3,2). Lower temperatures produced
peak broadening. Optimum resolution was achieved at 40"C using llow rates of

3.9
1 ml min'1.
3. Injection volume. Up to 20 pl injections produced sharp well resolved
peaks, however, 50 to 200 pl resulted in progressively broader, leading peaks.
Despite the poor peak shape at higher injection volumes, a linear regression
analysis of peak area vs injection volume, determined on 5 arbitrary peaks,
indicated that the peak response was linear over the range of injection volumes
(r'? > 0.95, figure 3.3; Appendix ll).
4. Detection Wavelengths. Greatest number of peaks were detected
and integrated at 2'l 0 nm but several individual peaks had higher absorbance at
240 nm (figure 3.4). Detail at 280 nm was less informative than 210 or 240
nm and therefore was not used for subsequent analysis. Scanning of individual
peaks was possible with the 994 LC UV-Vis detector. Scans of several peaks
from 200 to 400 nm indicated maxima at approximately 235 and 320 nm (figure
3,5).
5. Reproducibility of extraction and injection, A sample of Westar was
extracted and the extract was injected 10 t¡mes. ln addition, a sample of
Westar was extracted 10 times over 2 weeks and the 10 extracts were
analyzed, Excellent reproducibility was achieved in both repeated injection of a
single extract (retention time cv = 0.04-0.10, peak area cv = g.45-7.50, n = I0
peaks) and repeated extraction of a single sample over a two week period
(retention time cv = 0.03-0.09, peak area cv = 1.41-7.50, n = 1O)(Appendix I a
and I b).

3.1 0
Over 100 peaks were initially integrated from each of the
chromatograms. For statistical analysis of the data jt was necessary to select a
reduced number of components, The majority of peaks eluted ìn a small area
of the chromatogram and only peaks between 20 and 43 minutes were
selected. For each of the 6 cult¡vars, variability among cultivars ranged from
small differences in peak area for some cultivars to large differences in others
(figure 3.6). Initial observation of the chromatograms suggested there was
greater uniformity within chromatograms of the same cultivar and sufficient
variation among chromatograms of different cultivars to distinguish among
them.
Discussion
The conditions established in this study produced well resolved chromatograms.
Reproducibility of retention times compares favourably with those of Marchylo
and Kruger (1985) using an Aquapore RP-300 column (cv ol 0.19-O.47%)
although no measure of peak reproducibility was given. Bietz and Cobb (1985)
reported retention times of g peaks with 27 replicate wheat analyses (cv = 0.00-
0.47 %l but again peak area statistics were not reported. For wheat grown
under different environmental condìtions, chromatograms were divided into 4
segments for statistical analysis (cv=1 .5-16.9t , Marchylo et al 1990).
Ethanol extracts a wide range of compounds as ind¡cated by the variable

3.11
absorbance maxima of individual components. To provide some indication of
the characteristics of these compounds, absorption ranges of some peaks were
scanned between 200 and 400 nm using a photodiode array ultra-violel (U.V.)
detector. The wavelength spectrum produced profiles characteristic of phenoiic
compounds indicating that several of the components are phenolics. This is
consistent with the findings of Sosulski, Zadernowski and Kozlowska (1980)
who identified several phenolic compounds extracted from oilseed rape in 80%
ethanol. The spectral maxima at 235 and 320 nm correspond to the hydroxyl
group of the phenolic compound and the C. group respectively (Harbourne
1964). Based on a comparison of the U.V. absorption pattern and the
retention time of a commercial standard, the large peak at approximately 27
minutes was identified as sinapine, a major component of B. napus meal (figure
4.1). Several other components with retention times between 20 and 43
minutes appeared to be phenolic compounds based on their spectrum,
including ferulic acid (R.1 .= 28.24 min) and coumaric acid (R.T.= 26.03 min)
identified by comparison with commercial standards. Addition ol lhe 70%
ethanol to the flour in two parts (0.3 ml water added followed by 0.7 ml ethanol)
caused some early eluting peaks to disappear. These were speculated to be
glucosinolates hydrolysed by endogenous myrosinase, ldentification of the
majority of chromatographic components was not carried out as the objective
was to use the profile as a fingerprint of the individual cultivar.
The cultivars selected to evaluatc this technique included cultivars with
3.12
similar pedigrees, Stellar and Regent, and cultivars with distinct pedigrees,
Delta, Westar and Hero. There were sufficient differences between even the
cultivars with similar pedigrees to discriminate between them (figure 3.6). ln
previous studies (Mailer, Daun and Scarth, 1993), chromatographic differences
of the majority of seed components described have been shown to show some
var¡ation over a range of growing sites. These results indicate that
environmental influence may have some effect on the ch aracte rizalio n of
cult¡vars of B. napus seeds based on ethanol extractable components. The
differences among cult¡vars however was sufficient to discriminate them despite
env¡ronmental influence.
The utility of phenolic compounds for diagnostic purposes is supported
by many previous studies of phenolic compounds measured by H PLC analysìs
such as cultivar identif ication of Pelargonium (Bauer and Treutter, 1 990),
taxonomy oÍ Brassica (Hoshi and Hosoda, 1978), and eucalyptus (Hillis, 1967)
and studjes of geographical origins in honey (Ferreres et al 1991).
These results indicate that RP-HPLC of ethanol extractable components
is a useful method for the separation and analysis of ethanol extracts from the
defatted flour of seeds of B. napus cultivars. Optimum condilions have been
described. The characteristic profiles for the cultivars studied indicate that this
method has potential for the identification of B. napus cultivars.

Table 3.1. Sources of seed selected for RP-HPLC studies
Site Westar Regent Delta Stellar Hero Tobin
Dauphin
The Pas
Roblin *
Teulon
Waskada
Canora
North Battleford .
Paddockwood
Tisdale
Baggot
The Point
Portage
La Salle
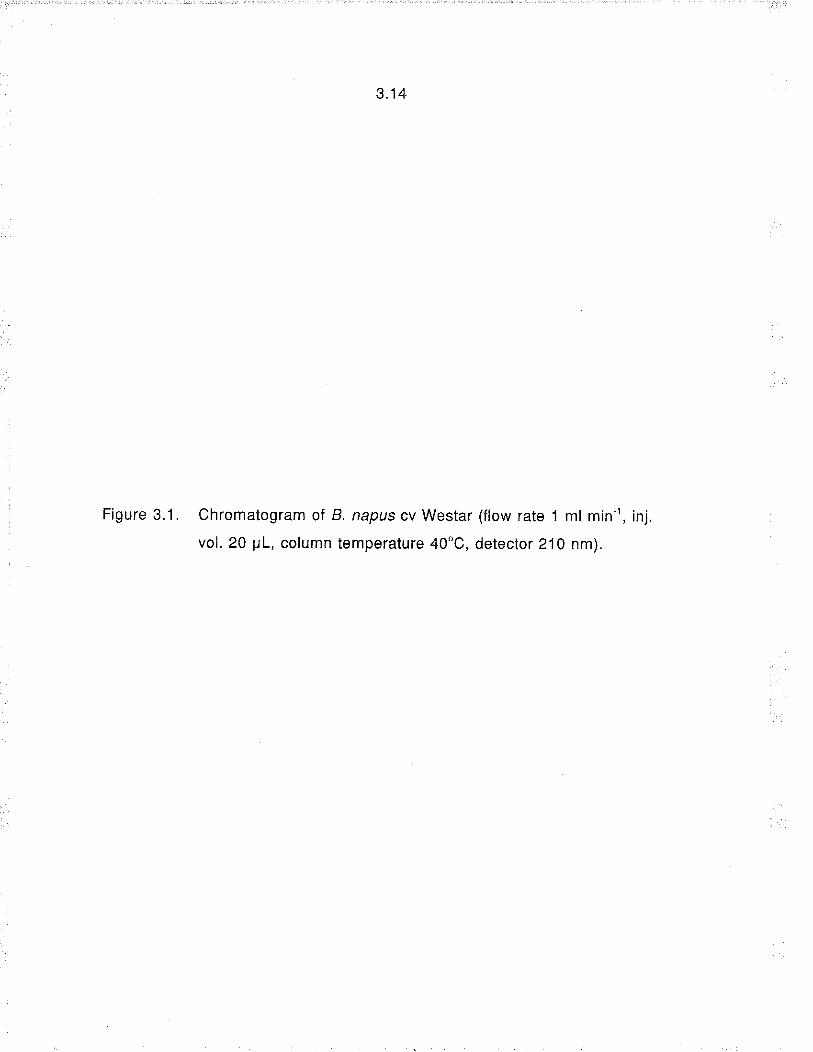
Figure 3.1, Chromatogram of B. napus cv Westar (flow rate 1 ml min-', inj,
vol, 20 pL, column temperature 40oC, detector 210 nm).

3.15

Figure 3.2. The effect of temperature on peak resolution (other operating
conditions as for figure 3.1)
.t. t I
0
0
0.40
0.30
0.20
0.10
-Ll
40'c
hil
Jl,l-J;lt'
! o.so
o.20
0.10
0.20
0.10
20 30 40
Tìme (minutes)

Figure 3.3. The linear response of increasing injection volume on five
chromatogram peaks (other operating conditions as for figure
3.1)(Appendix ll).

3.1 I
80
;60c&E¡oÉ.c.9Eeoo)ô
40 60
Injgct¡on VolumB (Él)
RBt€ntion T¡mo
tr 23.85 . 20.67r 42.38 A 29.15
o 22.03

3.20
Figure 3.4. Detector response at three wavelenglhs; 210 nm, 240 nm, and
280 nm (other operat¡ng conditions as for f igure 3,1 .)

0.4
0.3
o.2
0.1
0
o.4
0.3
o.2
0.1
0
0.4
0.3
0.2
0.1
0
2f0 nm
2,5 3.0 3.5 4.0Tims (x I O1 mjnules)

Figure 3.5. Scan of chromatogram peak (27 minutes) between
200 and 400 nm (A - cy Westar, B - sinapine standard)

.t. ¿.)

3.24
Figure 3.6. Chromatograms of live B. napus cræ Stellar, Regent, Delta,
Westar, Hero and 1 B. rapa cy Tobin (operat¡ng conditions as for
f igure 3.1 )

3.25
I ll Resentìl|lt lilI l|l|Lï,'lu\,t^t,tt''-;*J-
I [ì srerrarItil[iilf[r.-I I fl rourn
L ttll lill l,lltiltìilll ,illJtJU\**iul^-i"-
-
25 30 35 40Minútes
I f] Heroltl
l^illM*I lfl , Derra
t t tlill ltl ill ,il ilrI LtuiulUtm-]ll^^Jt tr-
-
I fl westsr1 It t tl lil tlrilllllII i Ii ]1,^lLlUL'T-it-Ii^^--^-,JL
25 30 35 40Minutes
0.4
g os
0.2
0.1
,^ 0.3ã
0.2
0.1
0.4
o.2
0.1

Cultivar ldent¡fication in Brassica napus L.
Using RP-HPLC of Ethanol Extracts
R.J. Mailer and J. Daun
Canadian Grain Commission, 1404-303 Main Street
Winnipeg, Canada, R3C 3G8
and
R. Scarth
Department of Plant Science, University of Manitoba
Winnipeg, Manitoba, Canada, R3T 2N2
Submitted to
The Journal ol The American Oil Chemists' Society
Contribution No. 934

ABSTRACT
A method has been developed to ident¡fy cultivars ol oilseed rape (Brassica
napus l.), an outcrossing species, using reverse-phase high-perf ormance liquid
chromatography (RP-HPLC) based on the separation of ethanol extractable
seed components. Defatted flour was extracted inlo 70% ethanol in water and
chromatography was carried out using a reverse-phase C18 column. Optimum
results were achieved using water solvent with a gradient to 50% acetonitrile
and peak detection at 210 nm and 240 nm. Trifluoroacetic acid (0.1%) was
added to dissociate proteins. Extraction and chromatographic conditions were
found to be reproducible and significant differences were found in the
chromatograms of 29 cultivars studied. The chromatographic differences
among these cultivars were found to be stable over a range of growing
environments. lt was possible to allocate unknown cultivars to their correct
classes using the HPLC method together with discriminant analysis . This
method has potential for use in characterizing new cultivars for cultivar
registration.
KEY WORDS: Brassica napus, canola, chemotaxonomy,
cultivar identification, HPLC, rapeseed

4.3
INTRODUCTION
Numerous cultivars of oilseed rape (Brassica napusl are released annually from
breeding programs around the world. The ch aracte rizatio n of these cultivars
has become increasingly important for plant breeders, particularly with the
introduction of Plant Variety R¡ghts (PVR) legislation in many countries. A
rapid, accurate method of cultivar identification would allow plant breeders to
monitor the use of their genet¡c material. Seed purity could be verified to
ensure quality standards are mainlained for producers and processors. plant
breeders also could use lhe method to assist in selecting breeding lines with
desirable ch aracte ristics.
Many methods have been investigated for unambiguous identification of
canola cultivars. Phenotypic characteristics including flower colour, plant height
and leaf shape may not show sufficient distinctness to differentiate among
cultivars. Glucosinolate profiles have been used with some success in swede
(8. napus L. var. napobrassica (L.) Peterm.), a related taxon (Adams et al.
1989), Protein patterns derived from gel electrophoresis (PAGE) have been
utilised for cultivar identification in many commercial crops, includin g Brassica
(Ladizinsky and Hymowitz '1 979; Coulthart and Denford 1982; Gupta and
Röbbelen 1986). Although electrophoresis is generally used for predominantly
autogamous (selfing) species, the,technique has been shown to be useful for
predominantly outcrossing specjes (Gilliland 1989), Reverse-phase high-

4.4
performance liquid chromatography (RP-HPLC) of seed proteins has been used
to characterize cultivars of wheat, Triticum aestivum L. (Bietz and Cobb 1985;
Marchylo et al. 1988); oats, Avena sativa L. (Lookhart 1985); soybean , Glycine
max L, (Buehler et al, 1989); and maize, Zea maysL. (Smith 1988). The
application of chromatography for cultivar identification has been discussed at
length by Morgan (1989). This study has investigated the application of Rp-
H PLC to cultivar identification in B. napus based on separation of ethanol
extractable seed components.
EXPEBIMENTAL PROCEDURES
M aterials
Samples oÍ Brass¡ca napus cultivars Global and Westar, selected because of
their distinct pedigrees, were used to develop the HPLC method. The method
was then applied to dif ferentiate among 29 cultivars (8. napus var. oleiÍera,
summer types "annua", unless otherwise indicated) using breeder's seed
samples obtained f rom:
Agriculture Canada Besearch Station, Saskatoon,saskatchewan; Excel, Tribute,
Westar, Trlstar, Profit , Bronowski, Oro, Argentine, Midas.
Department of Plant Science, University of Manitoba, Manitoba., Tower, Regent,
Reston, Pivot, Stellar, Hero.
ICI Seeds, Canada, Winnipeg, Manitobai Hyola-4O (hybrid).

4.5
Pioneer Hybrids, Ontario; Delta, Winfield (8. napus vat. oleifera winter type,
"biennis"), Bounty, Touchdown (8. napusvar. oleifera winter type, "biennis").
Svalöf Seeds Ltd., Ontario; Legend, Vanguard, Celebra, Horizon (8. rapa var.
oleifera, summer type, "annua"), Colt (8. rapa vat. oleifera, summer type,
"annua"), Stallion, Topas, Global, Crystal (8. napus vat. oleifera winter type,
"biennis").
Stability of expression over environments was studied using seed
samples of five cultivars, cv Stellar, Westar, Regent, Delta and Hero, grown in
1991 at five different and diverse sites in Saskatchewan and Manitoba (Table
3.1). Seed samples of turnip rape (8. rapa L. cv Tobin), from two sites,
Dauphin and Waskada, Manitoba, were included to determine the degree of
discrimination between B. rupa and B. napus species. The ability of the
method to identify unknown cultivars was evaluated using a set of five seed
samples ol B. napus cy Westar which were not part of the original data set.
These samples were obtained from tr¡als at additional sites in Saskatchewan
and were labelled for compuler analysis with only their site codes.
Sample preparation and extract¡on
Seed was ground in a Retsch Grinder fitted with a 0.5 mm screen prior to
extraction of oil with a Tecator Soxtec apparatus. The flour was ground again
prior to analysis. Extraction of soluble components from the flour was achieved
using 70% ethanol. Flour (0.04 g) was weighed into 2 ml plastio

4.6
microcentrlfuge tubes, extraction solvent (1.0 m1,70 ./" v/v elhanollwater) added
and the tubes shaken for t hour on a reciprocating shaker. The tubes were
centrifuged on a high speed centrifuge for 5 min. and the clear supernatant
removed for H PLC analysis. Samples were analyzed in duplicate.
Electrophoresis of the eluted peaks from the ethanol extracts did not produce
evidence of any protein, possibly due to insufficient concentrations.
C h ro m atog raphy of e xtracts
The analysis was carried out using a Waters HPLC system including two 510
pumps, a Wisp autosampler, column oven with temperature controi and a gg4
LC programmable UV-Vis Detector. The data system incorporated an IBM AT
compatible computer together with Waters "Maxima" integration software which
controlled the solvent gradient, peak integration and data handling. A Vydac
218IP54 C,r, 5 pM x 30 nm, 0.46 x 25 cm column was used for
chromatography.
Elution solvents were water (Solvent A) and acetonitrile (ACN, Solvent
B), containing 0.1y" vlv trifluoroacetic acid (TFA), added as a dissociating agent
lor protein. The solvent flow rate was 1 ml min'l with a gradient of S minutes at
100% Solvent A, increasìng to 50% Solvent B over 60 min and held for 1O min,
The gradient was lhen returned to 100% Solvent A in 10 min and held to
equilibrate for 10 min. Column temperature was maintained at 40"C, to avoid
diurnal fluctuations and achieve optimum peak resolution (Fig. a.1). lnjection

4.7
volume was 20 pl with larger volumes resulting in progressively broader,
leading peaks. Despite the poor peak shape at higher injection volumes, a
linear regression analysis of peak area vs injection volume, up to 200 pl,
determined on 5 independent peaks, indicated that the peak response was
linear over the range of injection volumes (r'z > O.g5). Chromatograms were
acquired at 2 wavelengths as most detail was obtained at 210 nm but several
individual peaks were more responsive at 240 nm (Fig. 4.2).
Beproducibility of extraction and injection
Repeated injections (n=10) of a single sample were carr¡ed out to test
instrumental error. Similarly, 10 independent extracts of a sample of meal were
made over a period of two weeks to determine laboratory error. Excellent
reproducibility was achieved in both repeated injection of a single extract
(retention time cv = 0.04-0.10, peak area cv = 3.45-7,50, n = 10 peaks) and
repeated extraction ol a single sample over a two week period (retention time
cv = 0.03-0.09, peak area cv = 1,41-7.S0, n = 1O) (Appendix ta and I b).
Statistical Analysis
Chromatograms of five cultivars, from several locations, were integrated with
Water's Maxima software. Peak area percent data of the chromatogram
components acquired at two wavelengths, 210 and 240 nm, were entered into a
spreadsheet to form a data matrix. Five samples of ev Westar, identifled only

4.8
by location code numbers were used as unknowns to test the ability of the
HPLC method to identify samples. These were also integrated and the data
entered into a data matrix (Appendix Ill a and lll b).
Selection of Discdminat¡n g Variables - Ðiscriminant Analysis. Sneath
and Sokal (1973) described discriminant function as "a linear function ,z' of
characters describing OTU's (operational taxonomic units) that weight the
characters in such a way that as many as possible of the OTU,s in one taxon
have high values for'z'and as many as possible of another have low values
such that 'z'serves as a much better discriminant of the two taxa than does any
one character of the two taxa taken separately". SAS Discriminant analysis
(release 6.07, SAS lnstitute lnc. Cary, NC USA) was used to select a reduced
number of peaks from the initial data matrix which provided the greatest
discriminatory power (SAS Proc Stepdisc). Some reduction of the number of
peaks was necessary prior to discriminant analysis as the maximum number of
discriminating variables that may be used in discriminant analysis is two less
than the total number of cases (Klecka 1976). An initial selection was carried
out by visual observation of overlaid chromatograms, deleting peaks which were
clearly variable within the cultivar group.
Variation Within Cultivar Groups - Canonical Analysis. Canonical
discriminant analysis is a multivariate analysis related to principal component
analysis. Given a classification variable and several quant¡tative variables,
canonical discriminant analysis summarizes between-ciass variation and tests

4.9
the hypothesis that correlations are zero in the population, A plot of the
canonical variables can be used to aid visual interpretation of group differences.
Data obtained from the five cultivars obtained from separate sites was analysed
by canonical discriminant analysis to determine the variation in data within each
cultivar group and to provide some information regarding environmental
variability. Data from five unidentified samples were included to determine
variability within the group and among the five known cultivars. The 1st and
2nd canonical variables were plotted (SAS Proc Plot).
Group Discrimination and Samole ldentilication. Discriminatory analysis
was used to test discrimination between the five cultivar groups (SAS Proc
Discrim) to test the ability of the method to identify the unlabelled samples.
Cultivar Similarity - eltrster anallsi.s. Cluster Analysis is a method of
phenetic analysis, appropr¡ate for determining the similar¡ty between samples.
There are several alternat¡ve forms of cluster analysis, including'average
linkage cluster analysis'or unweighted pair group ar¡thmetic average clustering
(UPGMA), developed by Sokal and Michener (1958). Average linkage cluster
analysis is the average distance between pairs of observations one in each
cluster. Average linkage tends to join clusters with small variances and is
slightly biased toward producing clusters with the same variance (SAS Users
Guide: Statistics. Version 5 edit¡on), Alternative methods are Complete Linkage
(distance between clusters is the maximum distance between an observation in
one cluster and an observation in another cluster), and Single Linkage (the

4.1 0
distance between clusters is the minimum distance between observations ìn
one cluster and observations in another). Average linkage cluster analysis
(unweighted pair-group arithmetic average clustering, UPGMA) is the most
frequently used clustering strategy (Sneath and Sokal 1973). The data matrix,
generally composed of peak areas generated by peak integration with
chromatographic software, is converted to a similarity matrix using a simple
matching coefficient. Several commercial software packages are available for
calculating the similarity matrix such as Phylo software (Baertlein et al 1990) in
which relatedness is determined through the calculation of Pearson's product-
moment correlations. The two assumptions of this calculation are that a) no
characteristic is weighted more heavily than any other, and b) only the relative
values of the character¡stics for each item are compared. Cluster analysis and
construction of similarity trees can be achieved using computer software such
as NT-SYS (Rohlf et al 1971) or SAS using the procedure Proc Tree.
A similarity matrix was produced from the HPLC data matrix for the five
cultivars from several sites (Appendix Vl) and Phylo software. Subsequently,
average linkage cluster analysis was then done by the unweighted pair group
method (UPGMA, Appendix Vll a). Addìtional analysis by single linkage and
complete linkage cluster analysis were also compared (Appendix Vll b and c).
Comparison q| Brassica napus and Brassica rapa cultivars. Cluster
analysis of 27 cultivars of B. napus and two cultivars of B. rapa were done to
determine the simiìarity between eultivars. A sample data matrix (Appendix

4.11
Vlll) and similarity matrix (Appendix lX) were created using integrated peak
areas with the same retent¡on t¡mes as those described previously for the five
cultivars from different locations. Average, single and complete linkage cluster
analysis was carried out (Appendix X a, b and c).
RESULTS AND DISCUSSION
Characteilzat¡on of Chromatogram Components
For the 29 samples of breeder's seed analyzed, variability among cultivars
ranged from small differences in peak area for some cult¡vars to large
dlfferences in others, six examples of which are shown in Fig.4.3. lnitial
observation of the chromatograms suggested there was sufficient variation in
the chromatograms to distinguish among the cultivars. Six cultivars selected to
test the stability of expression over environments included five cultivars of B.
napus, two with similar pedigrees, Stellar and Regent, and three with distinct
pedigrees, Delta, Westar and Hero, and one cultivar of B. rapa cv Tobin.
Analysis of seed samples of these cultivars showed good reproduc¡bility of the
major¡ty of components over environments as ¡llustrated by the overlaid
chromatograms of cy Stellar in Fig. 4.4.
Most of the chromatogram peaks eluted between 20 and 4g min, The
baseline between 0 to 20 min. and 43 to 60 min. was sometimes variable. For

4.12
this reason, only peaks between 20 and 43 min. were used in the analysis.
lndividual peak areas were calculated on peaks for each chromatogram
(Appendix lll a and lll b).
Unlike the studies of wheat protein in which wavelengths of 210 nm
(peptide bonds) and 280 nm (aromatic amino acids) are used (Kruger and
Marchylo 1985), many of the components ¡n these extracts had higher
absorbancies at 240 nm. Solvent extracts of the seed meal contained a wide
range of compounds including phenolics, carbohydrates and prote¡ns w¡th
variable absorbance maxima of the individual components. To assist in
character¡zing these compounds, absorption ranges of some peaks were
scanned between 200 and 400 nm using a photo diode array ultra-violet (U.V.)
detector. Based on a comparison of the U.V. absorption pattern and the
retention time of a commercial slandard, the large peak at approximately 27
minutes (Fig, 4.1) was identified as sinapine, a major component of rapeseed.
Several other components with retention times between 20 and 49 minutes
were lentatively identified as phenolic compounds including ferulic acid (r. t. =
28.24 min) and coumaric acid (r.t. = 26.03 min), by comparison with commercial
standards. Addition of the 70% ethanol to the flour in two parts (0.0 ml water
added followed by 0.7 ml ethanol) caused some early eluting peaks, speculated
to be glucosinolates hydrolysed by endogenous myrosinase, to disappear.
ldentification of the majority of chromatographic components is not necessary
for the profile to serve as a fingerprint of the individual cultivar.
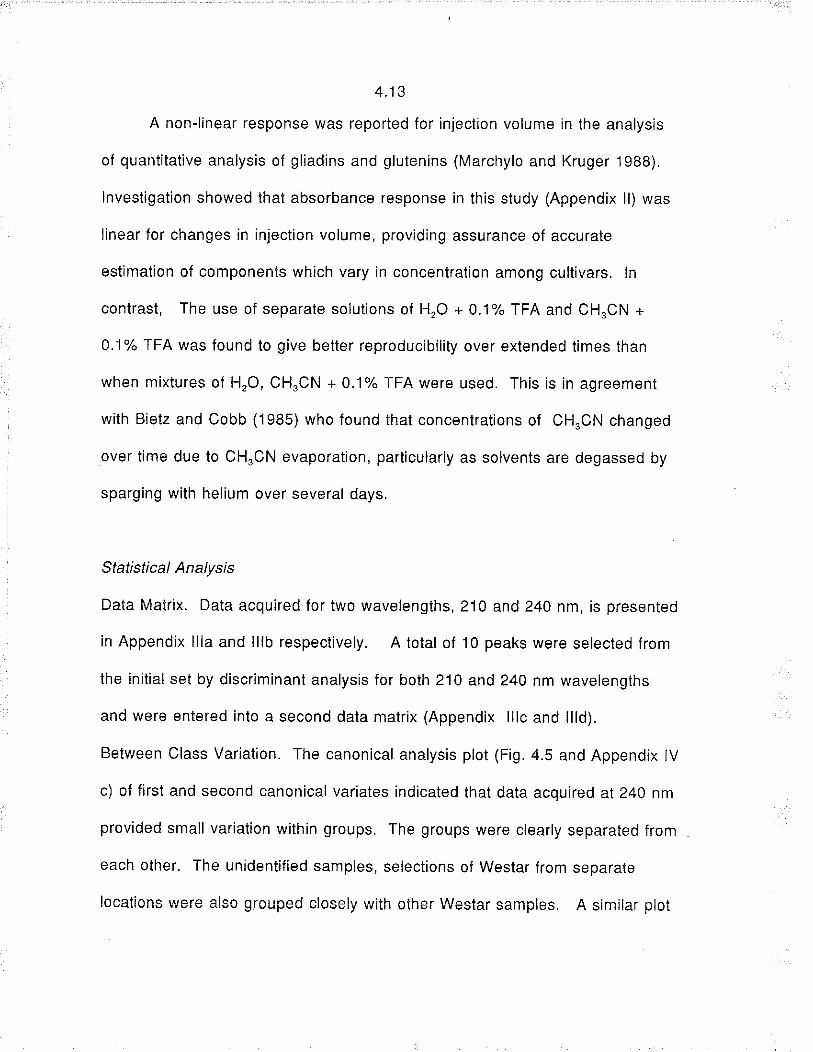
4.13
A non-linear response was reported for injection volume in the analysis
of quantitative analysis of gliadins and glutenins (Marchylo and Kruger 1988).
lnvest¡gation showed that absorbance response in this study (Appendix ll) was
linear for changes in injection volume, providing assurance of accurate
estimation of components which vary in concentration among cultivars. ln
contrast, The use of separate solutions of HrO + 0.1% TFA and CH.CN +
0.1% TFA was found to give better reproducibility over extended times than
when mixtures of HaO, CH.CN + 0.1% TFA were used. This is in agreement
with Bietz and Cobb (1985) who found that concentrations of CH.CN changed
over iime due to CH.CN evaporation, particularly as soivents are degassed by
sparging with helium over several days.
Statistical Analysis
Data Matrix. Data acqulred for two wavelengths, 210 and 240 nm, is presented
in Appendix llla and lllb respectively. A total of 10 peaks were selected from
the initial set by discriminant analysis for bolh 210 and 240 nm wavelengths
and were entered into a second data matrix (Appendix lllc and llld).
Belween Class Variation. The canonical analysis plot (Fig.4,5 and Appendix lV
c) of first and second canonical variates indicated that data acquired at 240 nm
provided small variation within groups. The groups were clearly separated from
each other. The unidentified samples, selections of Westar from separate
locations were also groupcd closely with other Westar samples. A similar plot

4.14
for data acquired at 210 nm was less distinct between groups although cultivars
were still separated into their correct groups. Again, the unidentified samples
were grouped correctly with Westar samples (Appendix lVa and lVb).
Discrimination Between Groups. Discriminant analysis successfully grouped all
of the samples of five cultivars into five distinct groups (Appendix V a ).
Generalized squared distance between groups are given (Appendix V a). Test
data for five unidentified samples were identified as misclassified samples from
their site code numbers SCG (Saskatchewan Canola Growers samples) and
correctly reclassified into the Westar group (Appendix Vb).
Cluster Analysis. Despite the success of discriminant analysis and
canonical analysis to separate cult¡vars into discrete groups, cluster analysis
produced some variablity w¡th the cult¡var groups (Appendix Vll a). The Westar
group was separated into two clusters and one Delta sample clustered closer to
cult¡vars other than Delta samples. Analysis of data by alternative cluster
methods (i.e. single and complete cluster, Appendix Vll b and Vll c) at both 210
and 240 nm wavelengths showed similar inconsistencies in clustering.
Samples of 27 cultivars ol B. napus and 2 cultivars ol B. rapa were also
analysed by cluster analysis. A pairwise corre¡ation matrix was produced
(Appendix lX) and average linkage cluster analysis was carried out to determine
relatedness among cultivars (Appendix Xa). The analysis clustered the B. rapa
cvs colt and Horizon separately from B. napus. ln several cases cultivars from
within the same breeding programs, based on known cultivar pedigrees (Sernyk

4.15
1991), clustered together. For example Delta and Bounty (Pioneer Hybrids)
were similar, as were the two w¡nter types Winfield and Touchdown (Pioneer
Hybrids). Stallion and Crystal (Svalöf Seeds Ltd.) also clustered closely.
Argentine, which does not have canola quality, formed a terminal cluster with
Canadian cultivars Reston, Regent, Pivot (University of Manitoba), Westar and
Oro (Agriculture Canada). Midas, another cultivar which does not have canola
quality, also formed a terminal cluster. The clusters were not always
representative of breeding programs. This may be expected as there is a basic
similarity among the canola cult¡vars, a result of selection for cultivars with
similar quality characteristics e.g. low glucosinolates and low erucic acid
concenlrations in the seed.
The results demonstrated by discriminant and canonical analysis show
that the ch aracte rizat¡on of the ethanol extractable components, measured by
HPLC, can provide a means to differentiate among cullivars. HPLC together
with discriminant analysis were useful tools to identify unknown cultivars.
Discriminant analysis appears to be the most useful method for analyzing HPLC
data for future ch aracte rization of cultivars. Canonical analysis is also useful to
determine the variability between samples
Some improvement in discrimination could be achieved if the
components of interest were extracted from the background of the total ethanol
extractable material. This would require that the components be identified. lf
the majority were free phenolics for example, they could be extracted in

4.16
methanol followed by extraction into diethyl ether by the method of Sosulski et
al (1980). For simplicity, it would appear that the crude extract is sufficient.
A routine method has been described for the analysis of ethanol extracts
of rapeseed meal for cultivar identificat¡on. The results indicate that RP-HPLC
can be used to dilferentiate and thereby identify cultivars of B. napus. This
work provides evidence that discriminant analysis may be used in conjunction
with RP-HPLC for cultivar identification. Unknown samples can be compared to
a previously established data set developed of samples of known cultivars.
Due to differences among columns and H PLC instruments, it is necessary f or
individual laboratories to establish reference standards prior to analysis of
unknowns. To identify a particular cultivar, a range of samples which will
include the unknown cultivar should be part of the reference set. For the
purpose of discriminating a new cultivar from similar existing cult¡vars, the
reference set would include a minimum number of cultivars, such as within a
breeding program, and a minimum number of peaks which provide the best
discrimination among those cultivars.

4.17
FlG, 4.1 HPLC chromatogram of ethanol extract of B. napus cv
Excel, injection volume 20 pl, column temperature 40"C,
flow rate 1 ml min'l, wavelength 210 nm. Peaks A - J have
been used for statistical analysis.

4. tõ
25 30 35Minutes

FlG.4.2 Detector response at two wavelengths; 210 nm and 240 nm
(other operat¡ng conditions as for Fig. 4.1)
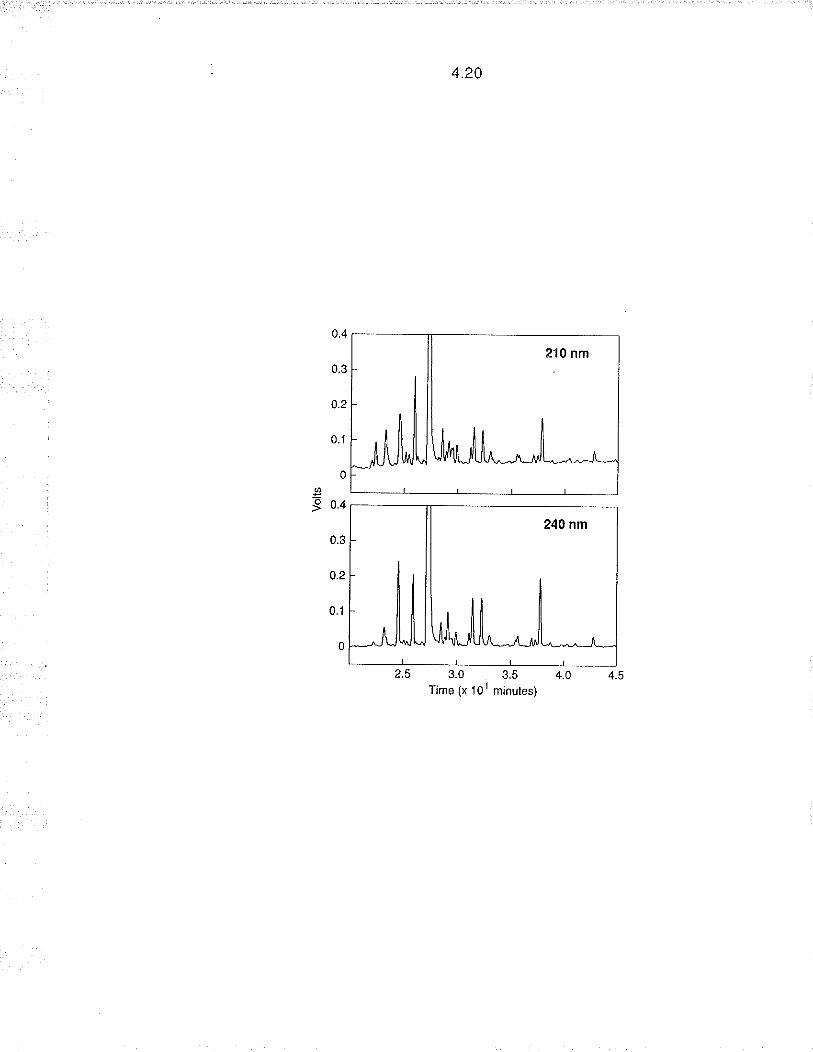
o.4
0.3
0.2
0.1
0
9 o.+
0.3
0.2
0.1
0
4.20
3.0 3.5Tjme (x 101 minules)
2.5

4.21
FlG. 4.3 Chromatograms of five cultivars of B. napus and one
cultivar of B, rapa. Chromatograms have been amplified for
detail. (operating conditions as for Fig. 4.1 )

t----T_l f = -Tl'
ls I lls i|I Jlt itI g 1l --#1-.--,---I -ll
=l-t¡---f-] l;-l'.li l llE .l"gt_.:,lr___Æ1.=
l_-é r-¡5 lÞI € II € 1'ã:-t=ll -l-t---Tl l----l-l'le lll¡ {llS tlle r rvr< srrö
= II Jtt 4 II -ll-l-
'E,ÆlI -1 I -l-a? q ,, q c\¡ Fooodc;ci
sÙo

FtG.4.4 Five overlaid chromatograms of B. napus cv Stellar grown
at 5 different sites: A = The Point, B = Baggot, C = Teulon,
D = Dauphin and E = Roblin (operating conditions as for
Fis. 4.1)

4.24

FtG. 4 5
425
Plot of Canonical Discriminant Analysis (SAS, Appendix lV c.) of
five B. napus and one B. rapa cultivar grown at different sìtes. D
= Delta; H= Hero; S = Siellar; R = Regent; W = Westar based on
10 peaks from Appendix lll d acquired at 240 nm. The symbol X
indicates the value of unidentified samples (SCGA - Westar) used
for testing cultivar identification. Proportion of total variation
accounted for by the two axes CANI = 37.260/o, CAN2 = 28.7 2o/o.

D
DDD
HITH
HE

FlG.4.6 Average linkage cluster analysis of 29 cultivars of oilseedrape based on 10 peak areas acquired at 210 nm fromAppendix lll c.

TribuleTristarTowerSlallionCrystalTopasProf¡lLegendCelebraPivot

Discrimination Among Cultivars of Rapeseed
(Brassica napus L.) Using DNA Polymorphisms Ampl¡fied
From Arb¡trary Primers.
R.J. Mailer, B. Scarth & B. Fristensky
Department of Plant Science, University of Manitoba,
Winnipeg, Manitoba R3T 2N2, CANADA
Submitted to: Theoretical and Applied Genetics
Contribution number 941

5.2
Summary. RAPDs (Randomly Amplified Polymorphic DNA) were used to
discriminate among 23 cultivars of oilseed rape (Brassica napus) selected
from several breeding programs. A set of 100 random sequence 10-mer
primers were tested, of which 70 produced bands and 22 showed evidence
of polymorphism. A selection of six primers produced 23 polymorphic bands
of between 300 to 2200 base pairs in size, sufficient to distinguish among
the cultivars. Analysis of seed of five cultivars obtained from four different
sites showed stability of banding pattern over source of seed, The analysis
was repeated using four different thermocyclers, each of which produced the
same band pattern. Cluster analysis showed that the relationships among
cultivars is closer for those from the same breeding program than for those
from d¡fferent programs. The results of this study show that RAPDs can be
used as a method of identification of oilseed rape cultivars.
Key words: Brassica napus - cultivar identification - RAPDs - rapeseed -
taxonomy

lntroduction
ldentification ol plant cultivars has become increasingly important with the
requirement of Plant Breeders Rights (PBR) to demonstrate Distinctness,
Uniformity and Stability (DUS) (Plant Varieties Journal 1991) for each new
cultivar. Phenology and morphological characterist¡cs may not be
signilicantly distinct and usually require growing plants to full maturity prior
to classification. The need for alternative methods of cultivar discr¡mination
is reflected in the number of techniques developed over recent years. ln a
survey by the lnternational Seed Testing Association (ISTA) (Van den Burg
et al. 1991), the most common rapid tests employed by laboratories were
biochemical and electrophoretic analyses. Electrophoresis, restriction
fragment length polymorphisms (RFLPs), and high-performance liquid-
chromatography (HPLC) were described as emerging technologies, requiring
the development of simple and standardised laboratory protocol before
being adopted as standard tests,
The phenology and morphological characteristics used for cultivar
identìfication include plant growth period (Halligan et al. 1991) and seed
shape (Barker et al. 1992). Electrophoresis of seed proteins has been a
prominent test ¡n cultivar identification in crops such as wheal, Triticum
aestivum L. (Wrigley et al 1982); cotton, Gossyplum spp. (Rao et al. 1990);
and pasture legumes, Trifolium spp. (Gardiner and Forde 1988). ln many

5.4
cases, high-perf ormance liquid-chromatography (HPLC) has replaced
electrophoresis for soybean, Glycine max L. (Buehler et al. 1989); maize,
Zea mays L. (Smith 1 988); rice, Oryza sativa L. (Huebner et al. 1 990); and
wheat (Marchylo et al, 1988). Although most electrophoretic work has been
on predominantly autogamous (selfing) species the technique has also been
shown to be useful for predominantly allogamous (outcrossing) species
(Gilliland 1989).
The interest in cultivar discrimination ol Brassica spp. has resulted in
many specialised tests based on seed or plant composition, such as fatty
acid in oilseed rape (8. napus L.) (White and Law 1991); volaiile hydrolysis
products in swede (Cole and Phelps 1 979); and glucosinolate content of the
vegetable forms e.g. brussels sprouts (8. oleracea L. var gemmifera
Zenker.) (Heaney and Fenwick 1980); and swede (8. napus L. var
napobrassica (1.) Peterm.)(Adams et al. 1989).
Restriction fragment length polymorphisms (RFLPs) has been used
by Song et al. (1988) and Figdore et al. (1988) for the purpose of studying
genome evolution among Brassica species, Although the methodology for
RFLPs is now well established, the technique has several disadvantages
including the time and labour requirements and the need for the use of
radioactive material.
The recent development of the polymerase chain reaction (PCR) to
amplify DNA and the use of randomly amplified polymorphic DNA (RApD,

5.5
Williams et al, I990) or arbitrarily primed PCR (AP-PCR, Welsh and
McClelland 1990) has resulted in a potentially useful tool for cultivar
discrimination. RAPD involves the amplification of DNA segments using
random sequence primers, generally of 10 bases, to find polymorphic
regions within the genome defined by the primer sequence. The products
formed and separated by agarose gel electrophoresis reveal sequence
variation in the form of variable numbers of bands of variable length which
may be characteristic of species and/or cultivars within species. RAPD
require no previous sequence information for fingerprint¡ng of cultivar
genomes.
This study investigates the application of RAPD to the discriminat¡on
of oilseed rape (8. napus) cultivars.
Materials and Methods
Plant Material
Ihe B. napus cultivars Argentine and Bronowski, selected because of their
different backgrounds, were used to optimize the RAPD method and select
suitable primers which exhibit polymorphisms between the two cultivars,
Bronowski is a Polish cult¡var and is the source of the low glucosinolate

5.6
characteristic in all low glucosinolate oilseed rape cultivars. Argentine,
although not a true variety, is a landrace from Argentina which has been
used in the early development of many Canadian oilseed rape cultivars.
The method was then used to investigate the possibility of using
RAPD to differentiate among 23 cultivars ol B. napus. Breeders seed was
obtained for the study from: Pioneer Hibred lnternational and Svalöf Seeds
Ltd., Ontario; Department of Plant Science, University of Manitoba and lCl
Seeds Canada, Manitoba; Agriculture Canada Research Station, Saskatoon,
Saskatchewan and the New South Wales Department of Agriculture,
Australia (Table 5,1). One seed sample of B. rapa cy. Horizon was
included to observe the differences between the two species.
The possibility of variability in seed samples, due to contamination or
outcrossing of seed, interfering with cultivar discrimination was investigated
using seed samples of five cultivars harvested from trials at five diverse
siles in Saskatchewan and Manitoba in 1991 .
Reproducibility of the RAPD analytical procedure was investigated
with repeated analyses of samples using a Techne MW-z thermocycler. To
determine if the method was instrument dependent, samples were also
tested on a range of thermocyclers, incorporating identical operating
conditions but with each instrument's unique method of cooling and/or
sample holder. The inslruments included: Techne Multiwell 2.01 with a 96
well microtitre tray, circulating refrigerated water cooled, heating block;

5.7
Techne PHC-2 1.05 A with 0.5 ml centrifuge tubes, c¡rculating refrigerated
water cooled heating block; Thermolyne TEMP.TRONIC refrigerated block
with 0.5 Nl1l centrifuge tube (no water circulat¡on); and Ericomp Ez-Cycler
with 0.5 ml centrifuge tube, ambient temperature water cooled heating block
Due to the different methods of cooling, the cycling rate varied considerably
among instruments.
Sample preparation
Twenty seeds of each cultivar were grown to two to three leaf stage (2
weeks) in a controlled environment. The true leaves of each cultivar were
excised and placed into separate sealed plastic bags on ice, samples of
each cultivar bulked together. The bags were placed directly into a lreeze
drier and lyophilised for 48 hours. After flattening the bags to remove air,
they were sealed into air tight containers with desiccant and stored at 4"C,
DNA lsolation
DNA was extracted from the lyophilised leaf tissue (B0O mg) using the
method of Kidwell and Osborn (1992). Precipitated DNA was hooked out
using a hooked glass rod, rinsed several times in ethanol (75%)/ammonium
acetate (10 mM) and dried under vacuum. The dried DNA was redissolved

5.8
in Tris/EDTA buffer (TE) (500 pl and centrifuged (13,000 g, 10 min).
Ribonuclease (1.5 pl 10 pg/ml, Sigma Chemicals R4875 Type 1-A)
was added and the solut¡on was incubated at 37"C for 3 hours. DNA was
reprecipitated in 3 M sodium acetate (1/10 vol) and isopropanol (1 vol), held
at -20"C for 2 hours, centrifuged (5,000 g, 20"C, 30 min.) and washed 3
times with 70% ethanol (-20"C). The DNA was dissolved and stored in TE
buffer (1 ml). Concentration was measured using an ultraviolet (UV)
spectrophotometer at 260 nm. To check for fragmentation of the DNA, the
samples were loaded inlo a 1.4o/o agarose gel in 1 x TAE buffer (tris/sodium
acetate/EDTA pH 7.8) and separated electrophoretically.
The DNA was of high molecular weight with l¡ttle fragmentation and
free from RNA as indicated by U,V. spectra and gel electrophoresis (data
not shown).
RAPD Amplification
Techniques for the generation of RAPD markers are well documented
(Rafalski et al 1991). A single primer is used in each reaction. The primer
is generally ten nucleotides long (10 mers), short enough to ensure
adequate numbers of binding sites on the template DNA which will generate
sufficient bands for study. Commercial sets of these 10 mer primers are
now available. A set of 100 10 mer primers were obtained from J. Carlson,

5.9
University of British Columbia. Concentrat¡ons of primer, template and TAQ
(Thermus aquat¡cus DNA polymerase, Promega M1864 ) were optimized to
give maximum band intensity with minimum quantities of polymerase to
conserve costs. Final reaction mixture included 1 x Promega reaction
buffer, 1.5 mM tu'lgClr, 0.2 mM dNTP (deoxyribonucleoside 5' - phosphates),
0.25 pM primer,0.75 units of TAQ polymerase,50 - 100 ng genomic DNA
and made to a final volume of 25 pl with sterilized double distilled water,
Amplification of the DNA was carried out in microtitre plates (Mandel
Scientific) using a Techne MW-2 thermocycler programmed for 1 min at
94"C followed by 45 cycles of 1 min at 94"C (denaturation), 1 min at 37"C
(annealing), and 2 min at 72"C (elongation) and a final stage of 10 min at
72"C. lnitially only 25 cycles were used but extra cycles produced more
intense bands. Although 45 cycles may be excessive, lhere was no
detrimental effect in terms of altered band numbers and as the reaction was
carried out overnight, the time factor was not important.
The RAPD products (15 pl) plus blue mix (3 ¡rL, stop bufÍet/O.5./"
bromophenol blue/glycerol : 200/4001200), were separated by
electrophoresis using 1,4% agarose in 1 x TAE buffer (Thomas C. Osborn,
University of Wisconsin, Madison - personal communication). A 1 kb ladder
(Bethesda Research Laborator¡es, BRL) was included as a size marker, and
the bands detected with ethidium bromide staining [2.5 pl(10 mg / ml)/1 00
mll.

5.10
Selection of Primers
lnitially the entire set of 100 primers were screened usìng the DNA f rom the
cultivars Bronowski and Argentine. The primers which exhibited
polymorphisms among these two cultivars were tested against lhe remaining
cultivars identified in Table 5.1.
Cluster Analysis
Cluster analysis is a method for delermining the sim¡larity among samples.
The form most frequently used is the unweighted pair group arithmet¡c
average clustering (UPGMA; Sneath and Sokal 1973), developed by Sokal
and Michener (1958). Average linkage cluster analysis is the average
distance between pairs of observations, one in each cluster. Alternative
methods are complete linkage (maximum distance between an observation
in one cluster and an observation in another c¡uster), and single linkage
(minimum d¡stance between observations in one cluster and observations in
another),
Fragment sizes of RAPD were estimated from the gel by comparison
with a 1 kb ladder marker. The bands were recorded as present (1) or
absent (0) and assembled into a data matr¡x table . Pairwise similarity
comparisons were calculated from the data matrix according to Nei and Li
(1979) and NEIRAPD software. The similarity index was calculated using

5.11
the equat¡on:
S =2nxv / (n* + n")
in which n, and n.' are the number of fragments in populations X and Y
respectively, whereas nxy ¡s the number ol fragments shared by the two
populations (Nei and Li 1979). Cluster analysis (UPGMA) of the similarity
indices was then carried out, using NT-SYS software (Rohlf et al 1971) .
Besu lts
Primer Selection.
Of the 100 primers (oligonucleotides) tested, 70 primers produced some
product and of these,22 primers showed evidence of polymorphisms. Six
primers were ultimately selected for further evaluation which produced a
total of 43 clear, easily detectable bands, 23 of which were polymorphic
bands (Appendix Xl). Easily detectable, well resolved bands were those
which were reproducible over repeated runs, with sufficient intensity to
determine presence or absence in samples with the same relative band
intensity. The sequences of the primers are shown in Table 5.2. Other
polymorphic primers produced patterns which were either faint and hard to
detect or not reproducible. The total number of bands produced per primer

5.12
varied from 6 to 15 although only one to seven of these were polymorphic
and useable. The size ol bands ranged from 350 to 2200 base pairs (bp),
Appendix Xl ,
C u lti var ld e ntifi catio n.
Examples of polymorphic bands used for discrimination within the sample
set are shown in Fig. 5.1. Comparison of band patterns among 23 B. napus
cultivars using six primers, indicated discrimination of all but the two
cultivars, Legend and Vanguard. There was a difference of two bands
between the two Australian cultivars, Oscar (cultivar 23 on Table 5,1.) and
Yickadee (24), and up to ten band differences among all of the others e,g.
Tower (22) and Oscar (23). B. rapacv. Horizon (13) differed by up to 37 of
the total 43 bands from the other cultivars.
Effect of Variable Seed Source.
Analysis of five cultivars collected from trials at four separate sites produced
similar profiles within each cultivar (Fig.5.2). All cultivars produced band
patterns identical to other samples of the same cultivar when tested with
primer #303. The patterns of three cultivars were similar cy Stellar, Westar
and Regent, whilst the other two cult¡vars Hero and Delta were dist¡nci.
5.1 3
When analyzed with primer #329 (Fig, 5.2), the same three cultivars were
similar and Hero and Delta again had unique bands. With primer #329 one
sample of cy Stellar had a less intense band at 750 bp than the other three
Stellar samples . One sample of cv Hero had a slightly more intense band
then the other Hero samples, also at 750 bp. This variability in bands may
represent genetic heterogeneity of the cultivar, rather than variation in
experimental conditions. Despite these differences, there was sufficient
information using either primer #329, or a combination of primers, to
discriminate among the other cultivars.
lnstrumental Variation.
Four cultivars (three B. napus and one B. rapal were selected which had
distinct polymorphic patterns with primer #329. ldentical band patterns were
obtained for each of the four cultivars using four different thermocyclers,
despite several hours difference in cycling time among the instruments, (Fig.
5.4).
DNA Template Quality
The DNA extracted 'îrom 24 cultivars of oilseed rape, and the five samples
of cultivars from the separate trial sites, were extracted over several days.

5.14
Although concentrations were normalised during dilution, observation of this
DNA on agarose gel showed some variation in the fragmentation of the DNA
among samples. Despite this, the RAPD bands were consistent in their
intensity, indicating that variation in DNA quality was not a critical factor in
the discrimination of the cultivars.
DNA templates were frozen and thawed several times during
evaluation of the range of primers and were observed to degrade
significantly as indicated by streaking when intact DNA was run on agarose
gel. Although the band patterns were consistent throughout the study,
higher levels of DNA template were required to maintain the intensity of the
bands after 1-2 monlhs. The problems of DNA degradation were overcome
by separating the bulked DNA into several conta¡ners prior to freezing and
storing one for current use at 4'C.
Statistical Analysis.
The number of bands and the individual sizes of the bands recorded are
presented as a data matrix in Appendix Xl. Of 43 bands shown, 23 are
polymorphic and 20 are monomorphic excluding sample 13 (Brassica rapa).
Analysis of similarity indices (Nei and Lei 1979), based on the data in
Appendix lX, produced a similarity matrix, Appendix Xll.
Average linkage cluster analysis (Fig 5.3) of the similarity indices,

5.1 5
Appendix Xll, indicates that distance separating cv Horizon'ftom B. napus
types is greater than the distance between all other cultivars. The cluster
further indicales that there is a basic similarity among the B. napus cult¡vars
used in this study, which is to be expected as result of selection for similar
quality f actors.
Discussio n
The use of Argentine and Bronowski to select primers was based on
available pedigree information (Sernyk 1991). These two cult¡vars had
dissimilar backgrounds and were expected to display a high number of
polymorphic markers. This deliberate selection may have introduced some
bias in that every primer used ìn subsequent analysis would have at least
one band different between the two cultivars. This may have contributed to
the distance between these cultivars displayed in the cluster analysis (Fig.
5.3) although, this distance was in agreement with the pedigree information.
Despite the possible bias, some observations could be made
regarding the clustering of particular cultivars, based on pedigree information
(Sernyk 1991). Legend (Andor / SV02215) and Vanguard (Andor // Hermes
/ Bronov¡ski / Gulle) both Swedish cultivars from Svalöf Seed Ltd. had the
same band pattern. Oscar and Yickadee, Australian culiivars, clusiered

5.16
together. Crystal and Stallion (Sweden, Svalöf Seed Ltd.), Global
(Denmark, Svalöf Seed Lfd.) and Delta (Sweden, Pioneer Hibred
lnternational) clustered closely. Argentine and Midas, which are not canola
quality cultivars, had similar patterns, Westar, Excel, Profit (Canada,
Agriculture Canada) and Regent (Canada, University of lr/anitoba) also
clustered together. Clustering of cultivars of similar seed source adds
verification to the RAPD technique.
The RAPD technique discriminated among all of the cult¡vars tested,
with the exception of two, using only 6 primers. There are several hundred
prlmers available commercially which would ensure the ability of the RAPD
technique to differentiate between any two distinct cultivars, as long as the
seed is pure and representative of the original breeders'seed.
The technique for DNA extraction is relatively simple, allowing for the
extraction of at least 12 samples per day. Higher numbers have been
processed in a similar period when a high speed paint shaker (Tai and
Tanksley, 1990) was used to grind plant mater¡al in place of a mortar and
pestle. The quality of the DNA extracted in this study was high and
produced reproducible RAPD products (Appendix Xlll).
The RAPD technique is largely automated requiring little operator
input. Most importantly, data generated by the technique is significantly
easier to interpret than that of other methods such as H PLC analysis.
Although the intensity of some of the bands varied for seed from the

5.17
same cultivar grown at different sites, primers can be selected which
produce bands that are consistent among samples from different sites or
under different cycling conditions. Since there is a large selection of
commercially available primers, and each primer produces several bands, it
is possible to select only those bands which give consistent results, while
variable bands are ignored, The patterns produced by the B. rapa cullivar
were d¡stinctly different from B. napus cult¡vars.
There was some variat¡on in band intensity among instruments,
however there were no differences in the results obtained by the different
instruments, Therefore the RAPD methodology used in this study was
sufficiently robust to be used as a standard technique among laboratories
employing different thermocyclers.
Outcrossing species pose particular problems in cultivar
discrimination as they are heterogenous populations, rather than a single
genotype. There may be selection for a particular subset of the population
under different environmental conditions. This may be the reason for the
inconsistency in intensity of bands in two of the 16 samples compared in
Fig.5.3. The use of other primers makes it possible to discriminate among
cultivars over environments despite these inconsisten cies. Only twenty
plants of each cultivar were bulked together in an attempt to obtain a
characteristic fingerprint of the cultivar, No single plant analysis has been
done to determine the degree of heterogeneity wiih¡n the populations.

5.1 ISampling DNA from a larger number of plants may overcome the variat¡on
observed, particularly in the case of synthetic cultivars. Future studies
should include single plant analysis of each cultivar to determine the number
of plants required to represent the cultivar for backcrossed cultivars,
synthetics and hybrids.
The RAPD technique requires time and effort, considering the period
required to grow the seedlings, extract the DNA and lhe subsequent
analysis. W¡th prudent select¡on of primers, it appears to offer a reliable
method for cultivar identification and to have advantages over many of the
chemotaxonomic methods used for plant identification such as glucosinolate
or falty ac¡d concentration which are susceptible to environmental variation.

5.19
Table 5,1, Cultivars and seed suppliers used for method development (all
cultivars are B. napus var. oleifera, summer types, "annua", unless
otherwise specified). The sample numbers are used elsewhere in the paper
to identify cultivars: l. Agriculture Canadai ll. lCl Seeds, Canada; lll.
Department of Plant Science University of Manitoba; lV. Pioneer Hibred
lnternational; V. Svalöf Seed Ltd. , Ontario; Vl. New South Wales
Department of Agriculture, Australia.
[Y] = B. rapa vN oleiferu 'ãnnua", lzl = B. napus v oleifera "biennis"
Cultivar Source Cu ltivar Source
1. Stellar
2. Westar
3. Hero
4. Regent
5. Delta
6. Excel
7. Midas
8. Tristar
9. Argentìne
10. Bronowski
1 1. Profit
12. Stallion
ilt
I
ilt
ilt
IV
I
I
I
I
Polish
I
13. Horizon [Y]
14. Crystal [Z]
15. Legend
16. Vanguard
17. Global
18, Touchdown [Z]
19. Winfield [Z]
20. Bounty
21 . Hyola-40 (hybrid)
22. fower
23. Oscar
24. Yie kadee
IV
IV
IV
il
ill
VI

5.20
Table 5,2. Primers obtained from University of British Columbia (UBC)
and used for RAPD anaìysis and discriminalion of B. napus.
UBC Primer
Number
Nucleotide
Sequence
302
303
329
341
346
354
CGG CCC ACG T
GCG GGA GAC C
GCG AAC CTC C
CTG GGG CCG T
TAG GCG AAC G
CTA GAG GCC G

a.¿ I
Fig. 5.1 RAPD profile of DNA from 23 cultivars (numbered as in Table
5.1) of oilseed rape using primers #329(a) and #341 (b) (Table
5.2). Only 23 of the 24 cultivars are shown due to the
limitations of the gel box. M = DNA marker

1 2 3 4 5 6 7 8 9 10 11 1213 1415 t6r7 181920212223

Fig. 5.2 RAPD profiles of four samples of each of 5 cultivars of B.
napus harvested from separate trials at diverse sites ¡n
Manitoba and Saskatchewan

Stellff Westar Helo Regent Delta
12347234723472341234

5.25
Fig.5.3 Average linkage cluster analysis of 24 cultivars of B. napus using
RAPD data lrom a 24 x 24 malrix of Nei and Li (1979) similarity
indices and NT-SYS software (Rohlf et al 1971)

_r_t_t_0.400 0.500 0.(i00 0.700 0.800 0.900 1.000
Litellar 0.91
I'lidas 0. 93
ÀrçJenL.ine 0. 90
lìesLàÌ 0. 9?
Excêl 0.95
Regen! 0. 94
ProfiL 0.93
TrisLar 0. 9l
Legend .t.00
Vanguârd 0. 91
[)ei ra 0. 97
slâÌ I ion 0.95
cryslal 0.96
(jloLà1 0. Bq
To{,er 0.8 9
Hy')Ì.r 0. 86
Her( ) 0.89
Bou¡rLy 0. 85
T.'uchdc,ll'rì 0. 89
Oscàr 0.9b
Yi ckadee 0. 83
Br-¡rn,lr.'sLi 0.7 9
l.Ji n field 0.18
H,rri z{1ti
-ì-----_t=-_t_t_t_t0.400 0.500 0.600 0.700 0.800 0.900 1.000

Fig. 5.4
5.27
RAPD profiles generated by 4 thermocyclers: A. Techne MW-2; B.
Techne PHC-2; C. Thermolyne Temp.Tronic; and D. Ericomp Ez-
Cycler, with primer # 329 and 4 cultivars; 1. Midas (8. napus), 2.
Bronowski (8. napus),3. Profit (8. napus), and 4. Horizon (8.
rapa)

A
M1234
B
r234CD
r234 r234

6. GËNENAL DISCUSSION
The aim of this study was to find fingerprints for jndividual cultivars. For
HPLC analysis, the phenotype is displayed as a set of selected ethanol
extractable seed components. RAPD analysis provided a set of DNA fragments
also useful as phenetic markers and characteristic of cultivars.
The majority ol studies of cultivar discrimination have been carried out on
self pollinating species, particularly cereals crops, in which plants within the
population are genetically similar. Few studies have attempted to discriminate
among cultivars (populations) of outcross¡ng species. This research has
investigated two possible methods of discrimination, HPLC and RApD, for
discriminating cultivars ol B. napus, an outcrossing species.
HPLC generated chromatograms which were visually unique among the
cultivars. Discriminant analysis provided evidence that the data obtained from
integration of those chromatograms was sufficiently different among cultivars to
allow them to be discriminated into distinct groups. Furthermore, plots of
canonical discriminate analysis gave additional evidence of lhe success of
HPLC for discrimination by displaying the cultivars as dist¡nct and t¡ght¡y
grouped sets (Fig.4,5). ln addition to discriminating between cultivars,
discriminant analysis was capable of identifying unlabelled samples based on
this data set. Cluster analysis was not successful in clustering cultivars into
discrete groups which would indicate that it is unsu¡table for this application.
Both the RAPD and HPLC methods were found to be useful for

discrimlnating among the cult¡vars tested. The number of markers available by
the two methods allowed selection of components which were reliable and
provided s¡gnificant discriminatory power. The characteristic profi¡es of these
cultivars revealed by HPLC and RAPD analysis were sufficiently distinct to
aliow discrimination among the cultivars tested and subsequent identification of
unknown samples.
H PLC is a rapid method and seed can be extracted and analyzed within
hours. The HPLC, although an expensive instrument to purchase, is common
in most well equipped laboratories. Most HPLC instruments are automated and
require minimum labour, input thereby making HPLC an attractive method
where large numbers of samples are to be handled. Actual operat¡ng costs for
the HPLC are relatively low. The major disadvantage of HPLC is the difficulty
in handling the type of data generated by the method. Over 100 peaks from
each chromatogram were initially integrated a those peaks which provided
maximum discriminatory distance among cult¡vars were selected. The
application of multivariate analysis was then necessary to classify the samples.
Despite these problems, H PLC provides a large number of components f rom
which to select markers between individual cultivars. Selection and analysis of
data would be minimised in a plant breeding program in which a limited number
of cultivars are involved. A set of component peaks would be identified from the
total chromatogram which are characteristic of a set of cultivars,
The HPLC method and discriminant analysis has the potential to be
computerised and automated. The reproducibility of retention times achieved
6.3
for extractions over two weeks would indicate that application of computerized
data handling is possible. Additionally, clear resolution of the major peaks
minimises the chance of erroneous peak identification. Automated and
computerized HPLC techniques such as used by Scanlon et al. (1989) could be
utilised in such a method. The reproducibility shown in overlaid chromatograms
of cv Stellar provides further evidence of the feasibility of automation.
The main advantage of RAPD is that it provides discrete data in the form
of the presence or absence of a RAPD marker. Although there were instances
in this study where a marker was inconsistent in the level of intensity, the |arge
number of markers made it possible to discriminate between samples. The
RAPD method generates a relatively small amount of data in comparison to
HPLC and a single primer may be sufficient to distinguish one cultivar from
another. Although statistical analysis is useful in looking at cultivar
relationships, simple observation of the samples run on a gel will generally
prov¡de evidence of identity. The RAPD technique is inexpensive to set up but
operating costs are high due in large part to the cost of thermally stable
polymerase enzyme. A limitation is the time required to grow seedlings for
extraction of DNA. Further development of the technique may allow extract¡on
of DNA from seeds which will reduce the tìme of analysis.
Both of the clusters produced by the HPLC and RApD data identified the
B. rapa cultivars as distinct out¡iers. The grouping of the B. napus cultìvars was
different in the two analyses. For example cv Excel clustered closely to Westar

6.4
by HPLC but was more distant when analyzed by RAPD. This is not surprising
as the markers used in both HPLC and RAPD represent only a small part of the
cultivars' phenotype and genotype. There was no reason therefore to expect
that the markers from each technique would produce similar clusters. Both the
HPLC and RAPD methods have been shown to be capable of discriminating
among a wide range of B. napus cultivars.

7. SUMMARY AND CONCLUSIONS
The establishment of Plant Breeders Rights requires suitable standardised
techniques for a unique description of each new cult¡var released. These
methods need to meet certain criteria to be useful for breeders. The method
must be able to distinguish individual cultivars. The method should not be
influenced by differences caused by the environment and should be applicable
to seed from a range of sources. The technique must be reproducible in other
laboratories; and should be simple, rapid and economical. This study has
described two techniques which generally meet these criteria.
Outcrossing species pose particular problems in cultivar discrimination as
they are heterogenous populations, The results of the HPLC analysis
presented here show that there is sufficient uniformity within the cultivar, and
sufficient differences among cultivars, that even cjosely related cultivars can be
discriminated. Although the majority of cultivars investigated were B. napus,
the success of HPLC in differentiating between B, rapa cultivars (cv Colt and
Horizon) would indicate that the methods may also be suitable for other
Brassica crops.
Only a small number (100) of the commercially available primers (>700)
were investigated for cultivar discrimination by RApD analysis. This was
sufficient to discriminate between all but two of the cultivars stud¡ed. This

7.2
would indicate that by increasing the number of primers used, the method has
potential to discriminate between any two different cultivars of B. napus. The
method is sufficiently robust that it can be repeated on several different
instruments and therefore would produce similar results in different laboratories.
It is likely that the major requirements for cultivar discrimination such as
described in this study would be used by breeders to discriminate among a
restricted selection ol cultivars. ln particular, it could be applied to the
registrat¡on of a new cult¡var to differentiate it from cultivars of similar pedigree.
ln this study, a wide spectrum of cultivars were utilised including European,
Canadian and Australian cult¡vars as well as species ol B. napus and B. rapa.
It is likely therefore that increased success could be achieved if these methods
were more closely adapted to the variability which occurs within breeding
programs, or even between the limiled number of cultivars grown within a
country at a given time.
Both HPLC and RAPD methods rely on the analysis of a bulked sample
of seed to provide a'fingerprint' which reflects the average population of the
cultivar. Unless components are identified which are unique to particular
cultivars, it is not possible to characterize a blended sample. Variation in seed
samples from different sources may occur due to env¡ronmental influence, seed
contamination and outcrossing. However, the data obtained from both HpLC
and RAPD analysis of samples of five cultivars from different sites jndicates that
lhe cultivars could be discriminated.

7.3
This study has shown that cultivars oÍ B. napus can be readily
discrimjnated using either of two methods. The RAPD method has some
advantages over HPLC in its simplicity and stability across environments. The
HPLC method has the advantage of a large number of components from which
to select discriminating variables. These methods have potential as techniques
for the characterizatio n of cultivars of B. napus and for cultivar registration for
Plant Breeders Rights.

8, RECOMMENDATIONS FOR FURTHER STUDY
Two methods, HPLC and RAPDs, have been optimised and evaluated for the
discrimination of cultivars of B. napus using a wide range of cultivars from
Canada, Sweden and Australia and including B. napus var oleifera summer
"annua" and winter "biennis" types and B. rapa. To incorporate these methods
into a breeding program, the range of cultivars specific to that breeding program
should be analyzed and a data set established. lt is likely that distinct markers
such as individual HPLC peaks or RAPD bands may be identified which are
unique lo particular cultivars, thereby simplifying the analysis. For the purpose
of plant variety registration, these methods are ideal to identify markers for new
cultivars to distinguish them from exist¡ng cultivars.
RAPD analysis, using discrete data (presence or absence of RApD
bands), is more precise than HPLC analysis. The method is also more stable
as there appears to be no environmental influence on the genetic material. To
take maximum advantage of this technique, as many markers as possible
should be identified using all of the available primers, This should result in an
improved ability to discriminate genotypes. Such data could be used in gene
banks to determine the variation within the germplasm gene pool.
The major drawback is the time required to analyze a sample because of
the need to grow seedlings for DNA extraction. Future study should consider
the possibility of extracting DNA from seeds to allow more rapid analysis

8.2
procedures. Although seeds conta¡n large amounts of carbohydrates and
protein which may reduce the DNA quality, it may be possible to extract DNA of
sufficient quality and quantity to carry out RAPD analysis.
The results of these studies indicate application of these techniques go
beyond cultivar discrimination. HPLC fingerprinting is based on the quantitative
variation of several phenolic compounds. Some of these are recognised as
antinutritional compounds such as sinapine, responsible for low feed palatability
oÍ B. napus meal. The HPLC method could be used to screen breeding
material for the reduction of these compounds. lt is likely that additional
markers for RAPD analysis, generated from the several hundred primers
available commercially, may provide markers linked to quality traits, suitable for
screening and selection of breeding material using techniques described in
chapter 2.
For RAPD, no single plant analysis has been done to determine the
degree of heterogeneity within the population. Only twenty plants of each
cultivar were bulked together to obtain a characteristic fingerprint of the cultivar.
The variation observed for seed from different sources may be due to the
sample size being too small, particularly in the case of synthetic cultivars.
Future studies should include single plant analysis of each cultivar to determine
the number of plants required to represent the cultivar for backcrossed cultlvars,
synthetics and hybrids.
Current methods of plant cultìvar description for the purpose of plant
8.3
breeders rights are many and varied. Two techniques, HPLC and RApD
analysis, have been shown to provide accurate and reliable fingerprints of
B. napus cultivars. Such techniques could be used to standardise cultivar
registration and permit comparisons of cultivars from breeding programs
throughout the world. HPLC and RAPD methodologies could be used to create
an international data base for comparison of new cultivars.

9.1
9, REFERENCES
Adams, H,, J.G, Vaughan and G.R. Fenwick, 1985. The limited
chemotaxonomic value of glucosinolates for cultivar identification in
Brassica napus L. var. oleifera (Metzg.). Zeitschrift fur Pflanzenzüchtg.
95:97-102.
Adams, H,, J,G. Vaughan and G.H. Fenwick, 1989. The use of glucosinolates
for cultivar identification in Swede, Brassica napus L var napobrassica(L) Peterm. Journal of the Science of Food and Agriculture. 46t!ig-324.
Allen, 8,W,, P.W. Goodenough, J.S.Lee and P,P,Rutherford, 1986. Evolution
of cauliflower types grown in Great Britian as indicated by the isozyme
composition of the cauliflower curds. Euphytica. 35:25-01.
Anderson, W.R. and D.J. Fairbanks, 1990. Molecular markers: important tools
for plant genetic resource ch aracte rization. Diversity.6(O&4):S1-53.
Appelqvist, L.A., 1972. /n L. A. Appelqvist and R. Ohlson (eds.), Fapeseed;
cultivation, composition, processing and util¡sation, pp. 123-1 73,
Elsevier, Amsterdam.
Appelqvist, L.D., A.K. Kornfeldt and J.E. Wennerholm, 1981. Sterols and
sterol esters in some brassica and slnapls seeds. Phytochemistry.
20i207-210.
Arus, P,, C.R. Shields and T.J. Orton, 198S. Application of isozyme
electrophoresis for purity testing and cultivar identification of F, hybrids ofBrassica oleracea. Euphytica. 34:651 -6b7.

9.2
Baertlein, D.A. B.A, Baertlein and R.G, McDaniel, 1990. PHYLO: A Cluster
analysis program. The Journal of Hereditary 81(1): 87.
Barker, D.4., T.A.Vuori, M.R,Hegedus and D.G.Myers, 1992. The use of ray
parameters for the discrimination of Australian wheat varieties. Plant
Varieties and Seeds. 5:35-45.
Bauer, H. and D, Treutter, 1990. ldentificalion oÍ Pelargonium genotypes by
phenolic f¡ngerpr¡nts ll. Cultivar identification by HPLC analysis of leaf
phenols combined with discriminate analysis. Gartenbauwissenschaft.
55(4)S:187-191 .
Bell, J.M. 1989. Nutritional characteristics and protein uses of oilseed meals,
pp. 192-207. /n G. Röbbelen, R.K. Downey and A. Ashri (eds.), Oil
Crops of The World. McGraw-Hill Pub, Co. N.Y.
Bietz, J.A. and L.A. Cobb, 1985. lmproved procedures for rapid wheat varietal
identification by reversed-phase high-performance liquid chromatography
of gliadin. Cereal Chemistry. 62(5):332-339.
Biles, C,L., R,D. Martyn and H.D, Wilson, 1989. lsozymes and general
proteins from var¡ous watermelon cultivars and tissue types. Hortscience.
24(5):810-812.
Bouchereau, A,, J. Hamelin, L Lamour, M, Renard and F, Larher, i ggl.
Distribution of sinapine and related compounds in seeds of Brasslca and
allied genera. Phytochemistry. 30(6):1873-1881.
Buehler, R.E,, T.T, Van Toai and M,B. McDonald Jr., I989. The optimlsation
of elution and extraction conditions for the separation of soybean seed
proteins using RP-HPLC. Seed Science and Technology, 17:198-204.

9.3
Canada's Canola, 1988. Canola Council of Canada. Winnipeg, Manitoba,
Can ada.
Canvin, D,T,, 1965. The effect of temperature on the oil content and fatty acid
composition of the oils from several oilseed crops. Canadian Journal of
Botany. 43:63-69.
Carlson, J,F,, L,K.Tulsieram, J.C. Glaubitz, V.W. Luk, C, Kauffeldt and F.
Rutledge, 1991. Segregation of random amplified DNA markers in F1
progeny of conifers. Theoretical and Applied Genetics. 83:194-200.
Chen, 8.Y., W.K, Heneen and V. Simonsen, 1989. Comparative and Genetic
studies of isozymes in resynthesized and cultivate d Brassica napus L., B,
campestr¡s L. and B.alboglabra Bailey. Theoretical and Applied Genetics.
77:673-679.
Chevre, 4.M., R. Delourme, F. Eber and P. Arus, 1991. First results of
rapeseed variety identification by isozyme electropho resis. Cruciferae
Newsletter Nos. 14l15:70-71 .
Cole, R.A. and K, Phelps, 1979. Use of canonical variate analysis in the
differentiat¡on of swede cultivars by gas-liquid chromatography of volatile
hydrolysis products. Journal of the Science of Food and Agriculture.
30:669-676.
Coulthart, M, and K.E, Denford, 1982. lsozyme studies in Brassica. L
Electrophoretic techniques for leaf enzymes and comparison of B. napus,
B. campestris and B. oleracea using phosphoglucomutase. Canadian
Journal of Plant Science. 62:621-630.

9.4
Daun, J.K., K.M. Clear and J.T, Mills, 1985. Effect of frost damage on the
quality of Canola (8. napus). Journal of the Amer¡can Oil Chemists
Society. 62(4):7 15-7 19.
Debenham, P.G., 1992. Probing identity: the changing face of DNA
fingerprinting. Trends in Biotechnology. 10:96-102.
Downey, R.K. and G. Röbbelen, 1989. Brasslcâ Species, pp. 339-362. /n c.Röbbelen, R.K. Downey and A. Ashri (eds.), Oll Crops of The Woild.
McGraw-Hill Pub. Co. N.Y.
Edwards, K., C. Johnstone and C, Thompson, (1991). A simple and rapid
method for the preparation of plant genomic DNA for PCR analysis.
Nucleic acids Research, 1 9(6):1349.
Ferreres, F., F.A, Tomàs-Barberàn, M.l. Gil and F, Tomàs.Lorente, 1991.
An H PLC technique for flavonoid analysis in honey. Journal of the
Science of Food and Agriculture. 56:49-56.
Figdore, S,S., W.C. Kennard, K,M, Song, M.K, Slocum and T.C. Osborn,1988. Assessment of the degree of restrict¡on fragment length
polymorphisms in Brassíca. Theoretical and Applied Genetics. 75:833-
840.
Fursa, N,S,, V.l, Litvinenko and V.E. Avetisyan, 1986. Natural compounds of
the family Brass¡caceae as probable chemotaxonomic ch aracteristics.
Report 3. Flavonoids. Rastit. Resur. 22(1):113-130.
Gardiner, S,E,, and M.B. Forde, 1988. ldentification of cultivars and species of
pasture legumes by sodium dodecylsulphate polyacrylamide gel
electrophoresis of seed proteins. Plant Varieties and Seeds. 1 :.1 3-26.

9.5
Gawel, N,J,, R,L. Jarret, and A.P. Whittermore, 1992. Restriction f ragment
length polymorphism (RFLP)-based phylogenic analysis ol Musa.
Theoretical and Applied Genetics. 84:286-290.
Gilliland, T.J,, 1989. Electrophoresis of sexually and vegetatively propagated
cultivars of allogamous species. Plant Varieties and Seeds, 2:15-25.
Gupta, S,K, and G. Böbbelen, 1986. ldentification of rapeseed (Brassica
napus) cult¡vars by electropho resis. Zeitschrift fur Pflanzenzüchtg,
96:363-370.
Guthrie, P.A.l., C.W, Magill, R.A, Frederiksen and G.N. Odvody, 1992
Random amplified polymorphic DNA markers: A system for identifying
and differentiating isolates of Colletotrichum graminicola. phytopathology.
82(8):832-835.
Halligan, E.4., M.B. Forde and l.J. Warrington, 1991. Discrimination of
ryegrasses by heading date under various combinations of vernalization
and daylength: Westerwolds, ltalian and hybrid ryegrass varieties. plant
varieties and Seeds. 4:115-123.
Hansen,4.E., A. Nassuth and l. Altosaar, 1988, Rapid electrophoresis of oat(Avena sativa L.) prolamins from single seeds for cultivar identification.
Cereal Chemistry. 65:153-154.
Harbourne J.8,, 1964. ln'Methods in polyphenol chemistry,(ed. J.B. pridham).
Pergammon Press, Oxf ord.
Havey, M.J. and F.J, Muehlbauer, 1989. Linkages between restr¡ction
fragment length, isozyme, and morphological markers in lentil.
Theoretical and Applied Genetics, 77:J9S-401 .

9.6
Heaney, R.K. and G.R. Fenwick, 1980. The glucosinolate content of Brassica
vegetables. A chemotaxonomic approach to cultivar identification. Journal
of Science of Food and Agriculture.3l:794-801.
Helentjaris, T,, M, Slocum, S.Wright, A.Schaefer and J,Nienhuis, 1986.
Construction of gentic linkage maps in maize and tomato using restriction
fragment length polymorphisms, Theoretical and Applied Genetics.
72:761-769.
Heun, M., A,E, Kennedy, J.A. Anderson, N.L, Lapitan, M.E. Sorrels and
S.D. Tanksley, 1991 . Construction of a restriction fragment length
polymorphism map for barley (Hordeum vulgare). Genome. 34:437-447.
Hillel, J,, T. Schaap, A, Haberfeld, A.J. Jeffreys, Y. Plotzky, A. Cahaner and
U, Lav¡, 1990. DNA fingerprinting applied to gene introgression in
breeding programs. Genetics. 124i783-789.
Hillis. W.E., 1967. Polyphenols in the leaves of eucalyptus: a chemotaxonomic
survey-V. Phytochemistry. 6:845-856,
Horn P,J,, and J.G. Vaughan, 1983. Seed glucosinolates of fourteen wild
B r ass i ca species. P hytochem istry . 22(2) :465- 47 0.
Hoshí, T. and T. Hosoda, 1978. lnterrelation between the genome and
flavonoid composition in the genus Brassica. Japanese Journal of
Breedin g, 28(2)i1 37 -1 42.
Hu, J, and C.E. Quiros, 1991 . ldentifìcation of broccoli and cauliflower
cultivars with RAPD markers. Plant Cell Reports. 10:505-51 1.

9.7
Huebner, F.R., J.A. Bietz, B.D. Webb and B.O. Juliano, 1990. Rice cultivar
identification by high-perf ormance liquid chromatography of endosperm
proteins. Cereal Chemistry. 67(2):129-135.
Hussain,4., H. Ramirez, W, Bushukand W, Roca, 1986. Field bean
(Phaseolus vulgaris L.) cultivar identification by electrophoregrams of
cotyledon storage proteins. Euphytica. 35:729-732.
Keefe, P,D,, 1992. A dedicated wheat grain image analyser. Plant Varieties
and Seeds. 5:27-33.
Kehnedy, L.S. and P.G. Thompson, 1991. ldentification of sweetpotato
cultivars using isozyme analysis. Hortscience. 26(3):300-302.
Kidwell, K.K. and T.C, Osborn, 1992. Simple plant DNA isolation procedures.
/n Beckman JS, Osborn TC (eds) Plant Genomes: Methods and Physical
Mapping. Kluwer Academic Publishers, Netherlands.
Klecka, W,R., 1976. Quantitative Applications in the Social Sciences. pp. 8-1 1.
ln Analysis of Variance, Sage Universily Papers, Series: 07-019, Beverly
Hills and London, Sage Publications.
Kruger, J,E,, and B.A. Marchylo, 1985. Selection of column and operating
conditions for reversed-phase high-perf ormance liquid chromatography of
proteins in Canadian Wheat. Canadian Jouranl of Plant Science.65:285-
298.
Kubelik,4,, 1991. A RAPD map of Neurospora crassa from Rafalski J,4., S.V.
Tingey and J.G.K. Williams, 1991. Biotech News and lnformation.
3(4):645-648,
9.8
Ladizinsky, G, and T. Hymowitz, 1979. Seed protein electrophoresis in
taxonomic and evoluiionary studies. Theoretical and Applied Genetics.
54:145-151.
Landry,8,S., R.V. Kesseli, B. Farrara and R.W. Michelmore, 1987. A genetic
map of lettuce (Lactuca sativa l.) with restriction fragment length
polymorphism, isozyme, disease resistance and morphological markers.
Genet¡cs. 1 16:331 -337.
Landry, 8.S., N. Hubert, T. Etoh, J.J, Harada and S.E. Lincoln., 1991.
A genetic map for Brassica napus based on restriction fragment length
polymorhisms detected with expressed DNA sequences. Genome
34:543-552.
Livneh, O., Y.Nagler, Y.Tal, S,B.Harush, Y.Galni, J.S.Beckman and Lsela,1990. RFLP analysis of a hybrid cultivar of pepper (Capslcum annuum)
and its use in distinguishing between parental lines and in hybrd
identification. Seed Science and Technolog y. I 8:209-21 4.
Lookhart, G.L., 1985. ldentification of oat cultivars by combining
polyacrylamide gel electrophoresis and reversed-phase high-performance
liquid chromatography. Cereal Chemistry. 62:g4S-950.
Mailer, R,J,, 1988. Environmental effects on rapeseed quality with emphasis on
glucosinolate concentration. MSc. Thesis. Australian National University,
Canberra, Australia,
Mailer, R,J., J. Daun and B, Scarth, 1993. Cultivar identification in Brassica
napus L using RP-HPLC of ethanol extracts. Journal of The American
Oil Chemists' Society (in press).

9.9
Ma¡ler, R.J, and N, Wratten, 1985. Comparison and estimatìon of glucosinolate
levels in Australian rapeseed cultivars. Australian Journal of Experimental
Agriculture. 25 :932-938,
Marchylo, 8.4., 1987. Barley cultivar identification by SDS gradient page
analysis of hordein, Canadian Journal of Plant Science. 67:927-944.
Marchylo,8,4., K.A. Handel and V.J, Mell¡sh, 1989. Fast horizontal sodium
dodecyl sulphate gradient polyacrylamide gel electrophoresis for rapid
wheat cultivar identification and analysis of high molecular weight
glutenin subunits. Cereal Chemistry. 66(3):186-192,
Marchylo, 8.4., D.W. Hatcher and J,E, Kruger, 1988. ldentification of wheat
cultivars by reversed-phase high-perf ormance liquid chromatography of
storage proteins. Cereal Chemistry. 65(1 ):28-40.
Marchylo, B.A, and J,E. Kruger, 1985. Assessment of RP-HPLC columns to
separate hordein proteins and identify cultivars of barley and barley malt,
Journal of the American Society of Brewing Chemists.43:29-35.
Marchylo, B.A. and J.E, Kruger, 1988. The effect of injection volume on the
quant¡tative analysis of gliadins and glutenins by RP-HPLC. Cereal
Chemistry. 65:1 92-1 98.
Marchylo, 8.4., J.E. Kruger and D.W, Hatcher, 1990. Effect of environment
on wheat storage proteins as determined by quantitat¡ve reversed-phase
high-performance liquid chromatography. Cereal Chemistry. 67 g) :37 2-'376.

9.10
Mart¡n, G.8., J.G.K, Williams and S.D. Tanksley, 1991. RApD identificatjon of
markers lìnked to Pseudomonas resistance gene in tomato by using
random primers and near isogenic lines. Proceedings of the National
Academy of Sciences, USA, 88:2336-2340.
Martinièllo, P., 1992. Morphological aspects involved in varjetal registration and
the production of certified seed of typical Mediterranean leguminous
forage crops. Plant Variet¡es and Seeds. 5:71-81 .
McDonald, M.B, and D,M. Drake, 1990, An evaluation of a rapid and
automated electrophoresis system for varietal identification of seeds.
Seed Science and Technology. 18:89-96,
Messina, R,, R. Testolin and M. Morgante, 1991. lsozymes for cultivar
identification in kiwifruit. Hortscience. 26(7):899-902.
Michelmore, R,W,, l. Paran and R,V, Kesseli, 1991. ldentification of markers
linked to disease-resistan ce genes by bulked segregant analysis: A rapid
method to detect markers in specific genomic regions by using
segregating populations. Proceedings of the National Academy of
Science, USA. 88:9828-9832.
Morgan, A.G., 1989. Chromatographic applications in cultivar identification.
Plant Varieties and Seeds. 2i35-44.
Mullis, K., 1990. The unusual origin of the polymerase chain reaction. scientificAmerican, vol 262. April. pp 56-65.
Nehra, N.S., K.K. Kartha and C. Stushnoff, 1991. lsozymes as markers foridentification of tissue culture and greenhouse-grown strawberry cultivars.Canadian Journal of Plant Science. Tl:1195-1201 .

9.11
Ne¡, M,, 1987, Molecular Evolutionary Genetics. Columbia University Press,
New York.
Nei, M. and W.H, L¡, 1979. Mathematical model for studying genetic variation
in terms of restriction endonucleases. Proceedings of the Nat¡onal
Academy of Science. USA. 76:5269-5273.
Nicholson, C.H.L,, L,L, Conlan and S.J. Cook, 1985. Cenchrus pasture
species and cultivar identification using morhological and biochemical
techniques. Seed Science and Technology. 13:243-255.
Oard, J.H. and S. Dronavalli, 1992. Rapid isolation of rice and maize DNA for
analysis by random-primer PCR. Plant Molecular Biology Reporter.
10(3):236-241.
Osborne, f .8., 1924, The vegetable proteins. Longman, Green Co. Ltd.
Osborn, T.C., D.C. Alexander and J.F. Fobes, 1987. ldentification of
restriction fragment length polymorhisms linked to genes controlling
soluble solids content in tomato fruit. Theoretical and Applied Genetics.
73:350-356.
Paran, 1,, R. Kesseli and R. Michelmore, 1991. ldentification of restriction
fragment length polymorphism and random amplified polymorhic DNA
markers linked to downey mildew resìstance genes in lettuce, using near
isogenic lines. Genome . 34:1021-1027.
Paterson, 4,H,, E.S. Lander, J.D, Hewitt, S, Peterson, S.E. Lincoln and S,
Tanksley, 1988. Resolution of quantitative traits into Mendelian factors
by using a complete linkage map of restrict¡on fragment length
polymorphisms. Nature. 335:721 -726.

9.12
Plant Varieties Journal, (1991). Agriculture Canada. Plant Breeders Rights
Office, Oltawa, Ontario,
Quiros, C,F,, J, Hu, P, This, A.M. Chevre and M. Delseny, 1991.
Development and chromosomal localization of genome-specific markers
by polymerase chain reaction in Brassica. Theoretical and Applied
Genetics. 82i627-632.
Rafalski, J.4., S.V. Tingey and J,G.K. W¡lliams, 1991. RApD markers - a new
technology for genetic mapping and plant breeding. Biotech News and
lnformation. 3(4):6a5-648.
Rakow, G, and D.L. Woods, 1987. Outcrossing in rape and mustard under
Saskatchewan praire conditions. Canadian Journal of Plant Science 67:
147-151 .
Rao, T.N., Y.S. Nerkar and V.D. Patil, 1990. ldentiflcation of cultivars of
cotton by sodium dodecylsulphate polyacrylamide gel electrophoresis
(SDS-PAGE) of soluble seed proteins. Plant Varieties and Seeds. 3:7-13.
Reeves, J.C, and S.F. Ball, 1991. Preliminary results on the identification of
Pyrenophora species using DNA polymorphisms amplified from arbitrary
primers. Plant Varieties and Seeds. 4:185-189.
Reiter, R.S., J.G.K, Williams, K,A. Feldman, J,A. Fafalski, S.V. Tingey andP,A. Scolnik, 1992. Global and local genome mapping in Arabidopsis
thalia by using recombinant inbred lines and random amplified
polymorphic DNAs. Proceedings of National Academy of Science. USA.
89:1477-1481 .
RFLP Training Course Laboratory Manual, Training course held at Cornell
University and sponsored by the Rockefeller Foundation July, 1989.

9.1 3
Flogers, S.O. and A,J. Bendich, 1988. Extraction of DNA from plant tissue.
Plant Molecular Biology Manual A6:1-10.
Rohlf, F.J., J. Kishpaugh, and D. Kirk, 1971. NT-SYS. Numerical Taxonomy
System of Multivariate statistical Programs. Tech. Rep, State Un¡versity
of New York at Stony Brook, New York.
Saharan, 8.S., C. Samimy and A.S. Malik, 1991, Research note: ldentification
of var¡eties of radish (Raphanus sativus L.) by isozyme phenotypes.
Plant Variet¡es and Seeds, 4:87-88.
Scanlon, M.G., H.D, Sapirstein and W,Bushuk, 1989. Computerized wheat
varietal identificat¡on by high-performance liquid chromatography. Cereal
Chemistry. 66(5):439-443.
Scarth, R,, P,B.E. McVetty, S.R, Rimmer and B,R. Stefansson, 1988. Stellar
low linolenic-high linoleic acid summer rape. Canadian Journal of plant
Science. 68:509-511.
Schüller, C., G. Backes, G. Fishbeck and A. Jahoor, 1992. RFLp markers toidentify the alleles on the Mla locus conferring powdery mildew
resistance in barley. Theoretical and Applied Genetics. 84:3gO-938.
Smith J.S.C,, 1988. ldentification of pedigrees of hybrid maize (Zea mays L.)
cult¡vars by isozyme electrophoresis and reversed-phase high
performance liquid chromatography. Euphytica, 39:1 99-205.
Smith, J.S,C, and O.S, Smith, 1986. Environmental effects on zein
chromatograms of maize inbred lines revealed by reversed-phase high-performance liquid chromatography. Theoretical and Applied Genetics,71i607 -612.

9.14
Smith, J,S.C. and O.S. Smith, 1988. Association among inbred lines of maize
using e le ctropho ret¡c, chromatographic, and pediree data.2. Multivariate
and cluster analysis of data from lowa Stiff Stalk Synthetic derived lines.
Theoretical and Applied Genetics. 76:39-44.
Sneath, P.H. and B,R, Sokal, 1973. Numerical Taxonomy. (ed. D. Kennedy
and R.B. Park). W,H. Freeman and Co,, San Francisco.
Sokal, R,R, and C. D, Michener, 1958. "A statist¡cal method for evaluating
systemat¡c relationships," University of Kansas Science Bulletin, 38,
1409-1438.
Song, K,M., T.C. Osborn and P.H, Williams, 1988. 8/,asslca taxonomy based
on nuclear restr¡ction fragment length polymorphisms (RFLPs) 2.
Theoret¡cal and Applied Genetics. 76:593-600.
Song, K.M., J.Y, Suzuki, M.K. Slocum, P.H. Will¡ams and T.C, Osborne,
1991. A linkage map ol Brassica rapa (syn campestils) based on
restriction fragment length polymorphism loci. Theoretical and Applied
Genetics. 82i296-304.
Sosulski, F,, R, Zadernowski and H. Kozlowska, 1980, Analytical Chemistry
of rapeseed and it's products - a symposium May 5 & 6, Winnipeg,
M an itoba.
Tai, T,H, and S,D, Tanksley, 1990. A rapid and inexpensive method for
isolation of total DNA from dehydrated plant tissue. Plant Molecular
Biology Report. 8:297-303.
U, N,, 1935. Genomic analysis of Brassica with special reference to the
experimental formation ol B. napus and its peculiar mode of fertilizat¡on.
Japanese Journal of Botany. 7:389-452.

9,1 5
Van Der Burg, W.J., and R,A. Van Zwol, 1991. Rapid identification techn¡ques
used in laboratories of the lnternat¡onal Seed Testing Association: a
survey. Seed Science & Technology. 19:687-700.
Waugh, R. and W. Powell, 1992. Using RAPD markers for crop improvement.
Trends in Biotechnology. 10:186-191 .
Welsh, J,, R.J. Honeycutt, M. McOlelland and B.W.S, Sobral, 1991.
Parentage determination in maize hybrids using the arbitrarily primed
polymerase chain reaction (AP-PCR). Theoretical and Applied Genetics.
82:473-476.
Welsh, J. and M, McClelland, 1990. Fingerprinting genomes using pCR with
arb¡trafy primers. Nucleic acids Research. 18:2215-7218.
White, J. and J,R. Law, 1991. Differentiat¡on between variet¡es of oilseed rape(Brassica napus L.) on the basis of the fatty acid composition of the oil.
Plant Varieties and Seeds. 4:125-132.
Williams, J.G., M.K. Hanafey, J.A. Rafalski and S.V. Tingey, 1998. Genetic
analysis using random amplified polymorphic DNA markers. Methods in
Enzymology. 218i704-7 40.
Williams, J,c.K., A.R. Kubelik, K.J. Livak, J.A. Rafalski and S.V.T|ngey,1990. DNA polymorphisms amplified by arbitrary primers are useful asgenetic markers. Nucleic Acids Research. 1B:6581-6535.
W¡lliams, J.G., A.R, Kubelik, J.A. Rafalski and S.V. Tingey, 1991. Geneticanalysis with RAPD markers. lni More Gene Manipulat¡ons ¡n Fung¡.
Orlando, Fl, USA; Academic press.
9.1 6
Will¡ams, J.G., J,A. Bafalski and S,V, Tingey, 1991. Genetic analysis using
RAPD markers.ln: Methods in Enzymology, Orlando, Fl, USA; Academic
Press.
Wrigley C,W, J.C, Autran and W. Bushuk, 1982. ldentification of cereal
varieties by gel electrophoresis of the grain proteins. Page 211 in:
Advances in Cereal Science and Technology. Vol.5. Y. Pomeranz, ed.
Am. Association of Cereal Chemists. St Paul, MN.
Yadava, J.S., J.B. Chowdhury, S.N,Kakar and H.S. Nainawatee, 1979.
Comparative electrophoretic studies of proteins and enzymes of some
Brassica species. Theoretical and Applied Genetics. 54:89-91.
10. APPENDIX
Appendix I a, Repeatibility of HPLC Analysis - Singte Extract of cy Westaranalysed 10 times - Data acquired at 210 nm,
Appendix I b. Repeatibility of HPLC Analysis - Repeated Extraction of cyWestar Analysed 10 times Over Two Weeks - Data acquired at 210 nm.
Appendix ll. Linearity of absorbance - Peak Area and retention times forHPLC analysis of cv Westar injected at six different volumes.
Appendix lll a. HPLC peak area (% of total peaks 210 nm) of five Cultivarsand five unidentified samples from a range of sites,
Appendix lll b. HPLC peak area (% of total peaks 240 nm) of five Cultivarsand five unidentified samples from a range of sites.
Appendix lll c. Areas (% of total peaks 210 nm) and retention times (min.) of10 peaks selected from Appendix lll a. by SAS discriminant analysis forf ive cultivars ol B. napus and one oÍ B. rapa grown at d¡ff erent sites.
Appendix lll d. Areas (% of total peaks 240 nm) and retention times (min.) of10 peaks selected from Appendix lll (b) by SAS discriminant analysis forf ive cultivars ol B, napus and one of B. rupa grown at diff erent sites.
Appendix lV a, Canonical Discriminate Analysis (SAS) of 10 peaks(Appendix lll c.) acquired at 210 nm.
Appendix IV b. Plot of Canonical Discriminate Analysis (SAS) of 10 peaks(Appendix lll c.) acquired at 210 nm.
Appendix lV c. Canonical Discriminate Analysis (SAS) of j0 peaks(Appendix lll d.) acquired at 240 nm.
Appendix V a. Discriminant Analysis (SAS) of 1O HpLC peaks (Appendix lild.) acquired at 240 nm.
Append¡x V b. Discriminant Analysis (SAS) of 10 HpLC peaks (Appendix lild.) acquired at 240 nm (cont.)
10. ii
Appendix Vl. Correlation Matrix of HPLC data (Appendix lll c.) acquired at 210
nm for five Cultivars ol B. napus f rom different sites analysed with Phylo
software (Pearson's product-moment correlat¡on coefficients).
Appendix Vll a. Average Linkage Cluster Analysis of five cultivars of B. napusand one ol B, rapa grown at different sites. Based on 10 peaks
(Appendix lll c.) acquired at 210 nm.
Appendix Vll b. Single Linkage Cluster Analysis of five cultivars ol B. napusand one oÍ B. rapa grown at different sites. Based on 10 peaks
(Appendix lll c.) acquired at 210 nm.
Appendix Vll c. Complete Linkage Cluster Analysisof five cultivars of B. napusand one oÍ B. tapa grown at different sites. Based on 10 peaks
(Appendix lll c.) acquired at 210 nm.
Appendix Vlll. Areas (% of total peaks) and retention times (min.) of 10
peaks for 27 cultivars of B. napus and two ol B. rapa acquired at 210nm.
Append¡x lX. Correlation matrix of HPLC data (Appendix Vlll) acquired at 210
nm on 27 cultivars of B. napus and two ol B. rapa analysed with PHYLO
software, utilising Pearson's product moment correlation coefficients.
Appendix X a, Average Linkage Cluster Analysis ol 27 cult¡vars ot B. napusand two ot B. rapa, Based on 10 peaks (Appendix Vlll) acquired at 210
nm.
Appendix X b. Single Linkage Cluster Analysis of 27 cultivars of B, napus andtwo of B. rapa, Based on 10 peaks (Appendix Vlll) acquired at 210 nm.
Appendix X c, Complete Linkage Cluster Analysis Analysis of 27 cultivars of
B. napus and two ol B. rapa. Based on 10 peaks (Appendix Vlll)acquired at 210 nm,

10. ili
Appendix Xl, Data matrix f or 24 cultivars ot B. napus. Primer are. identifiedwjth UBC (Unìversity of British Columbia) code numbers, Marker size is
in kilobases,
Appendix Xll, Pairwise comparisons of Neis' similarity indices (Nei and Li
1979) determined from data matrix in Appendix Xl, Cultivar identificationas for ïable 5.2.
Appendix Xlll. Ultra-violet scan of DNA extracted from B, napus asdescribed (5.7).

Appendix I a. Repeatibility of HPLC Analysis
Single Extract of cy Westar analysed 10 t¡mes
Data acquired at 21 0 nm .
Peak Area (pvolt sec)
t'êdk N,r. !ìLd l)ev. l',inimufiì I,laximum Range SLd Er¡oÌ (,V
Ti 0.0838738T2 0.096??0?T3 1.125300114 0.1897366T5 0. .1086781T6 A .1A1122t,11 A .1924253TB 0.3169570T9 0.3175709T10 0.0775955
1.4400000 1.69500002.4000000 2.?500000
t3 - 2390000 16.88000005.0980000 5.69?00002.6200000 3.01100002.9080000 t.55000003.1490000 3_6È100006.2840000 7.13500004.3400000 5.3?500001.3340000 1.5?00000
0.2550000 0 .0242123 5.23t 92A10.3500000 0.02?9351 3.7?604913.6410000 0.3248462 ',] .440b9?40.5990000 0.as41122 3.45488600.3910000 0.a313721 3.79363330.6420000 0.a52a5al 5.6845rt9c10.5320000 0.0555484 5.63361030.8510000 0.09r¿9?6 4.708r55?.t.0350000 0.0916748 6.59031760.2360000 a.0223999 5.1008¿2t
I,eàk N,:,. Meàn
Retent¡on Times (min)
SìLd tJev Ninimì.lm tr1¿rx imurì Ranqe i:lf-d E¡r,rr CV
Tl 21.924916',712 25.1805833T:i 25.89C9.tô?14 28.5.i94I6711 2S.i?98333?rr 29.9It9I61Tl tl.1470833TÈ 3.t.4875833T9 32.3Ì05000T.l0 3i.475?500
0 21894 2 21.9000000 21.95800000095580 25.36?0000 25.39200000Ì01036 25.8830000 25.91700000203350 28.4830000 28.55000000I5718 2 29.5580000 29.6I?00000209912 29.8830000 29.96?00000.t57276 31.1250000 l1.r?!000001314 5? 31.4670000 3i.51700000I8AA2r 32.215AA00 32.13300000167935 35.4500000 35.s080000
0.0580000 0.0063203 0.09985990.0250000 0.002?592 0.037658e0.0340000 0.002916? 0.01901030.0670000 0.0058704 0.07130450.0590000 0.00453?4 0.053.t38I0.0840000 0.00b0596 0.0?016?20.0500000 0.0045¿02 0.05049450.0500000 0.001?948 0.041?4900.0580000 0.0053I22 0.05695390.0s80000 0.00184?9 0-04?338t

'Lo .2
Appendix I b. Repeatibility of HPLC Analysis
Repeated Extraction of cy Westar Analysed 10 times Over Two WeeksData acquired at 210 nm.
Peak Area (pvolt sec)
Peàk No. I'iean sìLd tlev l.linìmum l¡axinìum Range SLd Err. .)t CV
T1
't2T3T4T5T6T'',7
TBT9T]
0.ö9ô45454.0868182
11.9320909r.4s036360.4560909
884454595163644943636't 6't 12',7 3
3147213
0. 04 06.t 62 0.63600000.05?6209 3.99800000.1859072 II.61200000.0226595 ] 412 000 0
0.0196390 0.¿2300000.0515526 2.?9000000. ÌI00093 8.7ù50000a -2205463 4 .04300000. 1317 3 54 1.51800000.0458652 2.1r60000
0.75800004.1930000
r2.25300001.48100000-¿8t0000
95600001150000663000091400004820000
0.1220000 0.At224tr2 5.83184700.1950000 0.0t73733 t.40991990.6410000 0.0560531 1.55804390.0690000 0.0068321 1.56233480.0600000 0.0059214 4.30594310.1660000 0.0155437 L18',725120.3500000 0.0331691 1.22892990.6200000 a.a664972 4.9A'71',7440.I960 000 0.019719? '7.45224'740.1660000 0.0138289 1.931:ì8118
Retention Time (min)
Peak No. llean SLd t)êv llinimum tlaxifiìun Range SLd E¡ror C\¡
TI 21.9110000,t2 24.3691213Tl 25.8983616T4 2b.',792454aT5 29.932t45.)TO 3i.!5109091'7 3t.¿650909TB 32.218A9A9T9 33.45.)2't21T.L0 35.6?64545
0.0420000 0.003?465 0.056658t0. 0330000 0. 0030033 0 .a3926270.0340000 0.0035452 0.04540120.0920000 0.0a7321t 0.09063410.0420000 0.0039849 0.04415390.0420000 0.003?88ô 0.040331(i0.0330000 0.0013424 0.03523150 . 05 0 00 00 0 . 0 05 0712 0 .05210 7'1
0.0420000 0.0040921 0.04106060.0340000 t.aa292l3 A.A2',115',14
0.0124258 21. 9000000 21. 94200000.0099608 25.3500000 25.38300000.0117582 25.8830000 25.91?00004.4242832 26.?500000 26.842A0A00.0132I64 29.9080000 29.95000000.0125655 31.1330000 3I.I?500000.0110856 31.4500000 31.48300000.0ì68194 12.2500000 32.3000000a.a!35'721 33.0130000 13.07500000.00968È8 35.65tr0û00 35.6920000
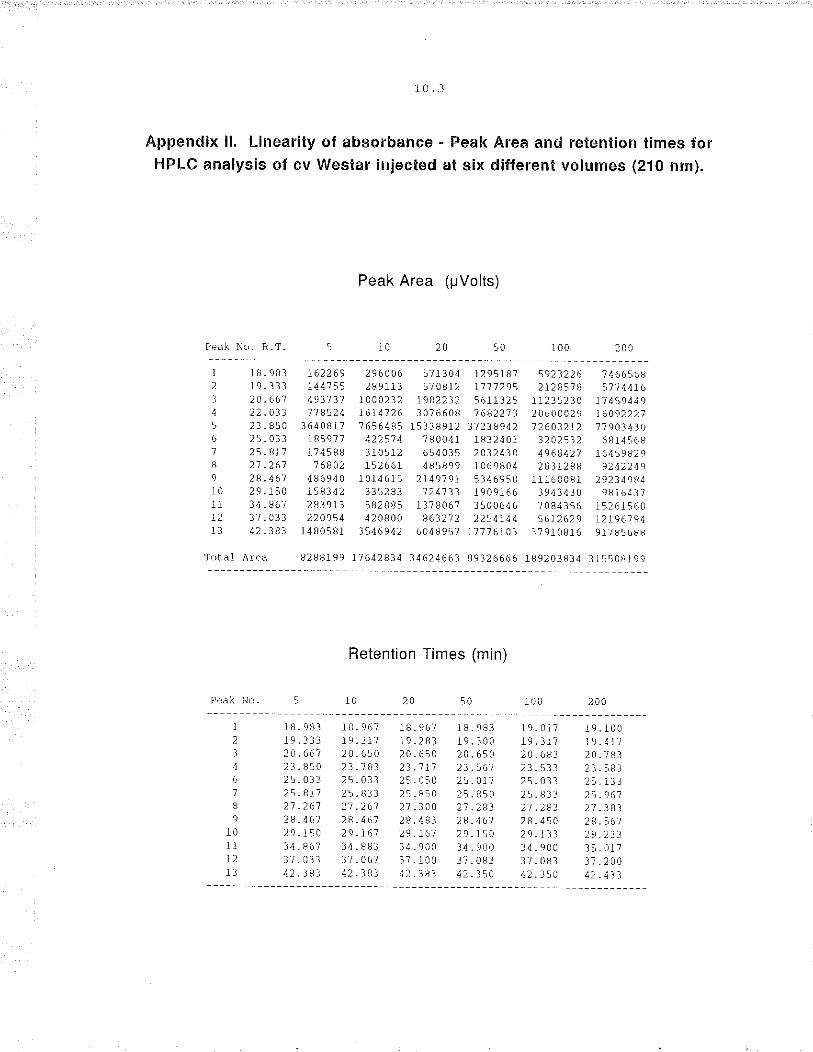
10.3
Append¡x ll. Linearity of absorbance. Peak Area and retention times forHPLe analysis of ev Westar injected at six different volumes (210 nm).
Peak Area (pVolts)
Peak No. R.T. 5 .10 2A 100
18.983 16226919. 313 I4475520. 667 49313122.033 '.|',7 852A23.850 364081?25.033 1859??25.gl',t 17458821 .2tJ',| ',1 68022A.461 486940
0 2 9. 15 0 i58342t 34 .867 2839132 3 7.013 22A9543 ¿2.383 1480581
296006 571304 129518?2 8 91.13 57ABI2 17'.l',7295
taa0232 1982232 56rr325t674726 341660A 1692273I 656485 153389 12 3',7238942
4225',t 4 ?80041 18324011105Ì2 654035 2032430152661 485899 I06980¿
I014ô.15 21¿ 97 91 5346950335281 ?24733 1909166582885 L3?806? 3500646420800 863212 2254r44
1546942 604895? l??76t01
592322t ?¿66568212857 B \'.t',t 44!6
11235234 114s94492460A029 1t 092221'72603212 ',t19A34303202532 6814568496842',1 16459829283.1288 9242249
1116 00 B 1 292149843943430 98r6437?084356 152615605612629 12I9rr',l9A
37910816 9t ?8r,{;ttH
Tc'Lal Àrea 8288199 17642834 34624663 89326666 189203834 315508199
Retention Times (min)
Pe.ìk No. 5 LO r00
101lI2l3
t8.9rllr9.3132A .66721.8502a .4312\.4112',1 .26728.46129.15034.86737.033¿r.3Rl
18.967 18. 96? 18.98319. 317 t 9.2 8l 19.30020.650 20.650 2A.ß5023.',l83 23.'tr',l 23.56125.033 25.050 25.Al',l25.833 25.850 25.85021 .26',7 21 .3A0 21 .28328 .4b1 28 .483 28.4t 1
29 .It)'] 29 .161 29-.15034.883 34.900 14.90017.06? 37.100 3?.0È342.383 42.383 42.3a0
19.0i7 19. Ì0019.317 I9.4.r?24.683 2A.18323.533 23.58325.033 25.i3325.833 2\.9r;',12',1 .283 21 .38328. 4 50 28 .rr.'729. t33 29.23334.900 35.01737.083 31 .2A042.354 42. A31

Append¡x lll a. HPLC peak area (210 nm) of five Cultivars and five un¡dentified samptes from a range of s¡tes.
Pelen!ion'tine
DELTÀ Dauphin -2.11 1-6i1 .laa 2-i23 .tCt -312DELTÀ The Pai .680 -,-A2 -a,16 \.31a -¡:t2 -39aDELTÀ Robli. -121 1-,-7.A .1,t8 1.3r6 ,a-:!a .3?:il-lELTÀ Teulôn -140 1-554 -7.22- I-A1A -¡,::i _41?FELTÀ ¡raskada -311 2.-lA9 _!23 3.iI4 _.lC:r .591REcErìT canora -246 2-426 .i99 3-119 -aai .26AREGElrl' BaggoÈ -2:tS 2 -28 ; .154 f _29i - !r!.¡ .383REGE¡rT P,wood .222 2-A3n .IIa 2-7t)9 ,¡C-i ,lC!rREcEtìT Tisdale -266 2-a1a -\I9 2.A25 .û,3¡ -338l^tEs1'ÀR Dauphin -'tlC 1.89A -t93 2.937 _LiCi -.418ttEsTÀR The Pãs !-2i9 -8€rr -i65 1.991 -!.! -61!r';ÈsTÀn Roblin 1-540 2-1.13 -244 2--935 -aC 1.a21tiEsTÀF Teulon -631 1.856 -CA,I 2.1 ,-2 .¡0.1 .386r^rEs1'ÀF naskada .Aa4 2-711 .109 3-871 .:0 .454HEFa La sâlla C 3-422 -A4\ I-A22 -!.0 .OCCHERo Baggot a 3-416 -141 \.19) .131 .2L6HERo Teulon a 2 .AA3 - 016 1. 50rl .I-t7 -211HERa Dauphin !. 3 - oCB - !.26 1,5t1 - 157 . ¡-n!rÌrERa Roblin -i 3,694 -226 ?,_552, -6:11 _¡¡ôSTELLÀR Point a 2.559 -126 2.621- _559 -!i0CSTELLÀR BaggoL ¡ 2 .813 1- 225 3.178 - 693 - 00sTELt-ÀR TeuÌon a 2-531 .2a1 3-315 -?63 -!!0STELLÀR Portage a 2-259 -256 2-A94 .?52 _0!0STELLÀR Roblin ! 2,185 -1|3 2.6'15 _63! _0CrrΡBIN Dauphin .392 7-I14 -52C 4-9\2 -a0!1 .6û1TâBÌN waskada -1\1 1.4..4 -551 5-146 .7Aa -629
3¿5622.8 23.2 23.ó 21 .r 2¿_5
-918 -A:.1. I.4A! a.229 6-.13!r .2801.99'l - !¡at 1 . l;t0 1- !.s4 5. 843 ,2681.561 -!.!0 1.1?1 1-132 5.?59 .3041-489 _:.¡0 1-149 1.153 5-SA5 .2A,11.200 .lrc¡ 1-l?l 1.288 4-99A -431l-C30 -!a!.f \.399 t-23A 5.¡89 -8082-561 -aia 1-5C9 1.388 S-242 .41A4.665 .!.0C 1-63? 1.rt31 5-519 1-0194.i75 -!i!! 1.133 1,236 4.A23 -1922.666 -!t).. 1.341 t-172 5.129 -4245.696 .0!a!ì a_21A -9A6 4..a2-1 -A1al-586 .!ÛC ).-394 a.3a1 4-643 .61-;1,368 -0!0 1-¡81 1.lrl8 4-A61 .164_894.C04 1-850 1_161 3_989 .933
2-371 .0lt \-112 L.693 5-256 .3621.603 _ 00!r 1 . 658 l. - 610 5.14 ,- -3442.753 -t9A 1-696 a-111 .1.418 -1932-C3| .tl? 1-?1!r 1.?01 4-641 -3221.294 .n1a 1-816 1.990:l-631 .3894.257 .t:)_. 1.345 1.11? 4-421 -3003.100 -00!i 1.48? l.-311 4.695 -4602-252 .iOt I-521 1.3AD 4-581 .4802.880 .C00 1-65'1 1.41A 4,658 -4?11,064 -c00 1.1.11 -891 1.624 -31-93_38? .4!.9 -181 -562 6.396 -4892.22\ .342 -763 -52A 5-213 .541
8 9 :C 1,1
2,i.3 25.t 25.3 25.9
S'GÀ?
S'GÃ1S'GÀ4
- sTct¡E,,BEIID. HURST
lìIÀcÀU
1226.2
i221.8 22.2.19 r -415,5? 1.?¡t5.688 1.?{8. 8.11 1- 6?l.11 1- 2,.6E:qLE
-326 !r-0û1. .65;29-5il -161 .388.118 0,000 -51? 24.161 -i5g -at2..3{3 0,!i¡t .652 2A.646 -aS8 -J35_16? û_c!0 -669 21 -L31 .044 .154-36? !r.C¡! _415 21 .16:l .i51 -4,a2. c!.0 L. - 0!! . ?15 34. 916 -i26 - 4-t 4
-311 Lr.C0C -1 ,14 32-845 .i2,6 _445-000 0-c00 -759 21 .1132 -i22 -4A¡J. !00 f. - 0¡0 - 655 31. n2r -i21. - 411.r53:-0:t.551 r:.5t6 - :31 .t6i.0û! !.-0-ñ0 .442 23-91\ -!23 -1!.¡-504 0.C!0 -821 24-411 .!i3l ,5C?-304 0.00c .519 29-191 ."¡26 -428-000 0-0¡0 -88I 21 -a1a.030 _502-315 .351 -!61 3L-962 .!.00 -541.299 -4!3 -154 33-69C -1121 -472.3tE -442 -239 31-445 -0aC -65?-284 -31A .1A4 12-1'14.!r0Lr -514,4?3 1- 1!l -000 31-1?9.1aa.i92.085 .3?6,138 31.4?5 _a21 -lA1.244 .6C9 -238 I0.133 -¡i!.019-223 -72A -238 3C-L26 -A22 .329-22a .ALA .000 32 - 392 . 00û ,305.169 ,585 -000 12.366 .03? .191.144 0-0!0 -s93 2A-029 _063 .0s3.168 !.000 -642 25-912 .C95 .063
322.8- Ç96
- ur6. !51_ cl9
156723.), 23. ó 24. C 24.5-222 -42 -321 3-t)C5. t1r .¡1? -3\A 2-42_ 2!r9 . ¡ts _I24 2.11.695 .¡!1t .216 2-135-9:ì3 -,:25 -2\5 4 -316
1.819 -61?.:l3l .8841_ 51J _658 -321 -66A1.85i,612 -43? .8!.01- 5611 .5.1I .512 -?981-r53 .615 ,491 -9662,111 . r88 .i3? 1-1a81.968 .?L.J -63.1 1-a221.9 ,11 .'t81 -868 1.1811.9û6,?51 -?5:1.!ì812-¡81 .66? .35.1 1,1311-Á59 .1-1i .:124 .1622-1!1 .81a .5?l 1-!r281.738 .652 _ 665 _8762-441 -.11,6 - 386 .9111- 563 .66,1 -119't-l.931- 631 .51? .496 I.\611_ 5C5 .6!r9 .655 1,0841 - 499 .515 -52A 1-a2i1_556 .6r¡ _499 1_5!3.186 -2A2.6'16 1.041
1 - 518 . 625 .511 -9311-600.5?8 -6.19 1- !081.471 .521 ,656 .980L-I19.4a!.{?! _?3¡
-93,. -546 .199 -1451- !69 .6ll _:11-1 -.iF,1
ic tt L225.3 25.9 26.2f-i99 4.326 -675
.964 4 -964 -5221- !6 5.269 ,188
.i4 4.35L .664,96 5- ¡!1,: . ?88
-329- 1.1 5
-la1.tc9.254-292. 31¡.459-2AA.3?5-,:83.232.2\ 3
.325
-227-145.165.?38- 818-t92.!r8!l. o0l.551,?85.646
i326. 3
c
- .105
-233.881
15 16 17 18 19 20 21 22 2326.8 2;.2 2:-.9 28.2 28.5 28.9 29.i 29.4 29.s.523 33,?03 0 .086 1-851 -691 .563 _gls 1.121-646 29.41.2 C -411 1.958 -68! -8Sl .9 I-a32-6L4 32.659 -264 -353 1.918 ,56 -158 1.û9? 1-18?.642 31.52',ì ! .082 1-61? .5,.A -(,29 ,62,1 .Êr¡-508 33-4!.3 :. .098 1.?a?.655.r88 .161 -911

Appendix lll a- HPLC peak area (210 nm) cont.
2,'i 25 26 2: 2.8 29 3A :t: 32 33 31 35 36 3129.9 34.4 3A.8 31.i 31.5 32.C 32.3 32.6 32.: 31.1 33.3 33.8 34.3 34
.581 .150 .16¿ 1.52r ¿.9t3 .029 1.3LÉ .226 _115 -753 .524
.1â1 -300 -19Á 1,.295 3.893 .n2a 1.Clt -341 .0C0 .660 -411-645 .200 .203 1.366 ¿ _577, .A11 t.1)2 .261 .132 .111 .SA8-621 .212 .221- 1.3t5 5..139 .a26 7.391 .233 .2t9 .18J .59)-616.316.101 1.15â l-321 .015 1.úA .255.1i5 _7J0 -sâ9
1-213 .204 -173 1-051 2.335 _0C0 2.16t.000 -133 1.070 -.1611.296 .3AA .27,1 1.2A3 2.)-a2 .AC] )-_!20 .AAA .200 1-t4i -,\111-101 -400 .303 L.252 2.F.6A .16A 2-3C5 .000 .13'l .9Aa -68'l1_126 -130 .235 .933 2.1lC _I2T 2-21â .000 .1.39 .91¿ _6061-.25L .22C _1,23 1.A25 5.9a6 .L93 1.910 _000 .146 -680 -500I-\32 -1?-C .229 .A,12,4.A't6 .\1A 1_66t .CCA.162 -81,1 -3¿01.305 ..150 .1A1 I.162 3.9n2 .),55 1.911 _CAA -266 .919 .6411.2¿2 .264 -21I .A15 5_595 -236 1.955 -000 .183 -896 -5?91 ,096 . 320 .321 .',|91 3.05J _ 152 I . 355 - 000 -22) .8,t6 .5¿1-353.000.000 1.630 4.327.1â1 1_08¡.210.000 .5¿3 .101-222 .ACA -000 1.199 4.A95 .1,29 .992 .1,12 .000 -2?6 .,110- 515 _ 000 _ 000 1.459 .t .I16 .192 ) .2J't .22¿ . C00 -,l,ll . 502-211 .AAC.000 1-Lî€9 3.3¿2 .A96 1-01.1 .166 -tr] .292 .219-376 .000 .2't 4 1".213 3.€,59 .1-tt 1.10t .116 -0c0 ..l]9 _190-790 _000 .040 .919 2-5c,'ì -216 .636 .1¿1 .000 _6-t3 .611
1_085 .0C0 _25L I.21¿ 3-110 -t06 .6tA _29A.0C0 -713 -9581.0â2 -000 .281 1_2.3A 3-115 .336 ./3A .252 -000 -753 .8521.0?7 -000 .215 1.22A 2.9n .23a .)I2 .203 -aA\ --tÐ .631-665.000,c00 -91,t 3.176 _00t 1.602 .7a1 -jco .17Ê, .123-596.000.761 ,353 5.y -253 .16.l .226 -nCA l-162 -000-684 .122 .73,\ .116 4-316 .315 .41.7 .269 -a00 l-964 .000
24 25 26 2i 28 29 3t 31 32 33 3429_9 3A.4 3A.8 31.i 3i.5 32.A 32.3 32.6 32-. 33.i 33.3
-2C1 -11 .162, .3I9 3.t2i -10.1 2-06 0 .13 _97 -.tj.211 -26 .1J6 1.061 3.r3.1 _11 1,?6 0 .11 -39 .12.279 .151 .t9¿ 7.2I1 2-€33 .05 1.66 0 -11 1.21 0
.991 .2ê. .254 1.1ô5 2.tlj -ô3ô 1.-17 ¡ .1 .91 0
.00â -0,t2 C -751 3-l1l .Cl| 2.1I C .09J .91? -,1C1
,5 00 .114 -213.387 - 118 - 268.595 - 116 - 258-Á,59 .194 .336- 550 .115 ,300. ¿02 .069 _ 105.567 .310 _ 175- 710 .110 .168-62I .260 .132.452.230.rA1.43',l.250.210.765 .400 -180.541 -260 -117- 468 .2?0 .109-110 .058 .120.149.L22.161- 42-6 .233 -132-266. .130 -094- 166 .319 -151.5.11 - 051 .185.37¿ - 1lB -290. t A-t .I,10 .260.511 - 081 .190.615.137.2CA.21d - 1ô9 -509.292.116.54Ã
i5 36 3r33.8 34.3 34.7
38 39 4C .ii 12 ¿3 14 15J5.2 35.6 36.1 36.9 3..3 3... 38.3 38.:
- 41? .1.171 - 315.532 1.536 .290..15,1 3-920 .ll1. a6't ¿.231 .254-329 2.54) .A22.158 1_ {00 _ 251.2)-4 1.¿1t .'162-294 1.¿0t .261"- 195 1.160 -216,139 1- 170 .195.11.2 2.03A .197.150 1.160 _311.261 I.11-t .I1't.22'r 1.A'i .I52- 1¿7 1.530 -330-135 1-314 .ll?-155 1.361 -239- 110 1.l0â - 230- 181 1..1I C -613.116 1.5¿1 .260-202 1.t42 .1A4.224 r.243 .2CI.r52 1-311 .1I1.175 1_65,t .ll1.634 1-112 .000.611 1.295 -000
38 39 ¿035.2 35_6 36.1
.501 .165 1.3r5 .3ta .1..2
.493 -171 \.¿10 .141 .t 5t-157 -196 \.250 .391 .6,1\.5),t .252 2-010 .130 .891.113 .211 -600 .160 -¡72.165 _362 2.003 .30a -269-604 -380 1.â60 -12.1 -391-'193 .546 2 .123 - 510 . l¿8.,160 .120 2_,170 .,100 .112_576 .456 2.461 .16¡ -310_531. .621 3. 6.10 .57C ..125.5I2 .520 2. 00"1 . 510 - l2.t.509 -166 3.070 -160 -371-334 .251 _753 -360 .2,1â-924 .226 1_765 .269 ,3.11.923 .259 1..171 .ll0 -115-85.t .265 I.T3A .2.19 .329.819 _214 t.t2I .264 .1Å2.831 -203 .30,1 .325 -169-516 .136 2.051 -166 .¿19,113 .159 1.462 -301 -173.¿63 .11L 1-362 .106 -201.¿87,131 1. .6 41 .3A1 .211.636 .21A 1_43â -.t97 -,16ê.112 .126 _735 -23,1 .331.641 .2C4 .56A .¿61 .125
4i 12 43 44 153ó.9 3:.3 37.r 38.3 38.'
46¿û.2
-583 -1_ì9 .2¡l-51¿ .111 .)-5a.61¿ .131 .23(_661 .2,1¿ .?,52.519 .L52 .),a9.651 .111 .il¡i-63r _1.r2 .262-667 -15,1 .32,1.7 ()1 .1Al .2tt-133 .13t .2i1.5¿9 .12',7 .3a9.151 .1.16 .)- 11
-6t1 .1r1 _)26,112 -000 .0-i2.6t1 .0a0 .2-t 6
-775 -000 -333.6,t3 .0c0 .27.1
-d21 .¡00 .151.676 .A12 .359-166 -C00 .211-l1d .0c0 -195.s36 .naa .292-621 .A6A .362_ 181 _ 000 .0.J1-.1,t5 .240 .150
¿6 47 ,t8
40_2 40.8 ¿:.".
I252)
)J
.18 -03 .Lt
.11 .12 .11
.21 .A9 .A9-22 -11 .2L
35IIll
6l
14 -59 .21I-t .6Ì .3623 .1I .),676 .5 .262L -7ê . J9
't .326 .l511 .2ô
ll .J
32
2917,
-t2
-62.55.6),
1.11t-n5
1112r,.2
l -q
.ta
l:
L2

Append¡x lll b. HPLC peak area (240 nm) of five Cultivars and five un¡dent¡fied samples from a range of sites.
PEÀK Ìio. 12,3 4 5 6.I9iC li i2 i3:4:.5 i6 i: igPeLen.io' 'fi:rle 2i.8 22.2 22.5 23.2 24.5 25.0 25.3 25.9 26.2 26.6 2r.3 28.5 28.9 29.,1 29.9 30.3 li.i 3i.5
'r';ESTÀR Da¡rphin .22? .359'r';EsTÀR Pas .66i -293'/IESTÀR Robl in ,186 - 314tiEsTÀR Têu I on - 121 .422'¡;ESTÀR t;askada .!)C .412FEGE¡rT canora .129 - lllREGEIi¡T Ì.r bat .I18 .421REGENT P. wôôd -163 .386REGEÌ'IT Tisdale .119 .424DELTÀ Þauphin .132 ,358DELTÀ Pas .326 .175ÞELTÀ Roblin - 167 - 3!9DÊl,TÀ TeuÌon .1?8 - 358DELTÀ ¡¡askâda!i - 0!iq .6lCHERc Lasallo .,-115 - 274HERO BâggôÈ - C.l4 ,213HERa Teulon -C32 .250HERo Dauphin.l¡1 - 312HERo Roblin ,1.16 - 38CSTELLÀR PoinÈ . ! lC .515STÊLLÀR Bagqot . 0,::i - 521ìSTELLÀR Teulôn . !:t!. .19CSTELLÀR Portage - 1,32 .44iSTELLÀR RobÌin -l;3 -297
- !91 t-619 4-û84 .6!4.14 5 1.3?5 1!-!.15 .542.1C1 \-;6,1 6-311 .6!r3.499 1- 6L4 4.991 -5¡?- !!40 2.186 1.55? - 7!ìl.,16f 1. ?,:4 4 -2SC -596. Lr6l 1- 96!a 4. !.11 - 68?- 095 1- 5?4 ?. 811 - ?95-!.85 1.544 6-296 -651-0!r0 1.4?5 \-2|1 .823.0!ì0 1.05¡ 3.556 -642-159 r-265 2_188 -802.08f. 1-3?3 2-2a3 .635. a¡¡ 1,?6q \.2,A4 -8a,a. an0 - 65rl 2.23a -61"I-40! -746 1.266 ,533- !,10 -54:1 1,?lt .453.0c0 .57? I-661 .52 .1
.056 .76? -622 -571
.û56 -956 5-agl -446
SCGÀ
SCGÀ
SCGÀ
scêÀscG"i
.624 4 -41! - 43A,61¡ {-1?1 .551.62C 4-649 -51¡.540 4.1?? -410.56? 4-0C8 .3?0
- 635 4.698 -28!.800 4-8?9 .566.650 4 -L24 .41a.56? 5-842 .350.52? 5-633 .380.553 5.126 -19!.s17 5. A31 - 42¡:. 620 5.154 ,38!..4 84 2.936 .250.439 2 -489 .210425 2 -283 .11aq36 2-415 -180493 2 .562 -7.1e378 2-811 .14838? 3-157 .1?0303 2.581 _128454 3-14!r -17025! 3.13? -18¡
u. st one .24+ ,349?r. bend .1r 9 .4q2R hurst -1!:! .6¡1lliacãm - 1:9 ,466R.daÌe -12.: -351
856 1.29? 3-461 ..183
.4.11 42-459 1-45A 2.12i !-2Ii -9A-.- 3?t 34.159 1- 2¡8 1- 13! -961 .9A5- 424 42.413 1.581 1-3I!: 1.19:: 1.!r!3.421 42-234 1.211 1.43!i \-i2l -941.56¡ 48.814 a-529 \.IIi 1-15!1 -8,rt8-41!r 49.182 1-389 1-46C 1.1:ì:. .9¡1.41!r 49-689 1-333 1.250 1-14li -91.!1-410 4A.A6A 1.435 1-66¡ 1-36! 1..:96- 45¡ 45.433 1.348 1- 5?!. 1.19C 1. !r36-424 43.4\2 \.224 -92a 1.!ìr!. -331,11!i 38.345 1-128 -90:a .890 ,333-41,1 41-421 1- 284 1-!ì3¡ .9.1¡ ..14?- 1!.¡ 40.482 1-!19 1.!ì50 .95¡ .4!i4.45n 48-321 1-261 1.18¡ \-A3i -321.164 29-118 -659 .61¡ -681 -t99.2C¡ 3C - 690 .129 -66a .71a .11:-16f.29.319 .575 -6?.1 -517 -125.t1t 29.\12 .668 -71!r .65¡ ,126.212 29.386 -5?8 -550 .84û _ -:6?-221 34.4..9 .59? 1-03t .6?0 .526-29r.36.621 -694 -69t) .64-i .548.262 29 -9 ,aC -5't\ -69a ,5?¡ - 456.281 36-146 -669 .8¡¡ .64!r -581.2!:ì 36.3:1t -669 -.16r. .saa -621
i22 - 959 1.91? .198t19 1-1:8 3-232 -531
.¡2¡ 1,û!¡ 3.529 _361
at1!.9 3
1s.14L9!:6 s
6681. 8942-151r-{61L .562
4-s!.¡
4 - 5.1?
3.2456. ;26
52 8
{8955n339462
539 3-11! .322 -1t5 46-4 \.?,13513 4-65? .51.1 -59J 4l-16t 1.555570 4.8!:i _.t81 -:l{? 4?.281 1,5.113!8 3.49.:1-1?6 .545 13-9I.- I-229188 {-!.99 -)52 -2Ag 45.3A2 1.259
.31C .912 9.661-3?¡ .686 ¡5.428
- 11¡ - 939 6.8,tj
.1,ia -5s2 5 -23j
.18! -814 l-163
.16 0 .99I 3 .1a1
.330 1-0{!.3.891-39! .??5 .1.!i91- i5!. 1.111 ?-833,21!r 1.18! 6,138.250 1.1? 9 6-995.26-ì 1.199 8,611.15t -9?2.1-?63.422 -;96 .1.66A- 42¡ . 699 .t .1 i8- i21 .622, 3 -AA5-¡l! .584 l-1las.¡¡t -616 3-3r8-431 - 623 2 -91t)
- 493 - 8.11 -A61 -152 -699-5.13 .1.463 a-i41 -21L't-:16.514 -.194 1-¡83 .1ir 1-1.12.164 1.426 -ALs .2)2 A-2.ia-l3A I.266 .881 -138 .¡582
:'56 ,556 3.!r?1':.11 .?23 3.5.11L!i¡ .611 l_93.t
8l I:a l6231:15

Appendix lll b. HPLC peak area (240 nm) cont.
19 2A 21 22 23 24 25 26 2j 28 29 30)2.3 32.8 33.8 34..! 3,!.6 34.8 35.2 35.ì 36.1 36.9 3ì.3 3-).8
2-9422.3952-9852 -4432 .9423 .3623-4813-.4!01.3181 ,9141.5612.1022.C26t --r32
.96',7
I . 01t1 .14:a
.994- 907.?10. 61o.5ll
7 .122
! -471 .232\ -!6C .24\1. r]3!r - 2,¡!t.314 .2341- 98!. . û9,1
1- 36C - 1131.380 ,1511.5û1. .3q4r-46A .2141- 10!. .1501- 04û - 1061- ASA - 211
. a2c - t62-34C .C86- 360 . !r8?-35C - 469- 319 . C64.120 . û81.680 - 144- 11C - 199- 42i . 491.61ì0 , C96. aa9 .2c9
! -72I .2A)! -256 .211\ -214 .221.925 .2) 5
1- 121 .111
.!i99 .118 -130
.1:15 -1?1 -201- i92 -ttc .\46.085 .136 .124. a2i .09i -t4e_i62 _¡50 .081- -i84 . !.54 - û84
,1196 -11? .106.1¡3 .:ì40 .129.123 .0C0 -1?1.112 .¡a! -1?6-165 .:ra0 -263- !32 . i15 . n52. !.12 -.:55 - :00,!5¡ -C59 .r.Co.031 -¡48 -!r00.!l{ ,û{9 -!a!0.,-i39 . û19 . !r00.u21 .412 -00c. !'11 - 026 - !a00
. !i¡û - 054 . !i00
. ca!. - 083 0. !.0û
. L.rr¡ .12q 0 Lroal
-\49 \.4\1 .222.16 9 1.852 - 1?!1
-a84 r -213 .223.219 r.356 .tA1- 119 1.C33 -11¡.1,1,1, r.231 -232-167 1.26A .32A-21C 1 .3 .12 -216-165 I-311 -21.4-345 5 -916 -241.503 ;.244 .259.421 5 -442 -29p- 423 6 -1,24 -2t^a-22a 3.39'| .1t7. a1a - 851.ì - 252,46¡ -680 -210-ü64 .81!r .112-166 - ;40 -2C2- 459 .61A .213-¡80 1.10t -118.!.61 .88C -038- | ,12 - BLC ..139
-t! t L.2EC .265039
163a2f11 ,ì
252249
- s9s .4a1 3 -821.514 .591 6-238.543 - 454 3.637.537 - 43C 4 -942-3't1 .145 \-2t9.4?1 .101 3-155.596 .295 2.919- 491 .4 85 3-?91.508 - 396 4-1.?4.490 - DA2 t.9AA- 569 .154 2-450.5!r9 -166 1- 95¡.601 - 186 3.099-428 -LAl .7 69- 640 .122 1_ ;53.5?0 -10!. 1- 3??-sor .\t2, 1- 196
.559 .136 1- 648
.5r2 - 490 .652-348 - AA2 2 -211A
.311 .074 1,884
.243 -061 1-33A
.393 -090 2.080-549 -Lts a.612
31 32 33 34 35 3638.1 38.. 39.7 40.3 4A.6 11.i
09{ .15?!81 - 144ûÌ3 - !.917)6 .265!.5 6 , 114
-tla .4 .12 .101 ,911.158 .5?!i -211 .333,134 ,366 .156 .499-r29 .5tS -1A2 .4a9- 1C6 .156 .145 -236. ¡8.1 .368 _126 -348- 34! -426 .121 .368- 42i -451, .199 ,5{a. l9:1 .458 -186 -4S-¡.2211 -995 - 00! . 144-2Ai \. a19 . û14 _ 317- 29i .491 -¡58 _4?3,3M.150 - !r?,: .41r.-19¡ -611 -!.0! .263- a9t .2.13 .14,- -28t).081 .211 -!.34 -28!- 452 -306 .i46 -2.2A- aa9 .2t5 .tl6 -210.044 - 412 .t23 .310,20¡ .150 .048 -290.\aa .232 - !.38 .250.13,: .2:r8 _ !00 .180- 184 - 315 -125 -220-267 - 4\; .C35 -2¡0
-13?.116- 115- 115- 11S
211 a -34), -246 -544L82 I -22A .212 -565\42 A.241 .239 .5 ;3148 1.!93 -163 -516145 1-?15 -t6A -559
!t 2
!r55!.?1!'S 3
!a!!i2a!.31169!i 51i1 ,"
Lc6t21\42.458
!rC!C!!iraCC
!c!¡0cl0c000:'0 0
'!¡0c0!c
3-
- 24i .451 .661.133 -r1?8 -635.264 -.t51 -615-221 -a53 .653-:168 .:r1-l . 315.223 - a\5 . ,42!-211 .i43 . ..l1-299 . i69 .6,-1- 214 - 462 -6a5,18t . !: !1:: -858.214 . t2\ -426.233 _:ì16 -?55.218 - i29 .923-115 -a!!1 .360.166 .429 .152.1?? -!ì16 .113-14! .!431 .117.129 -437 .341- 155 . !1!r': .21:1-232 .i2A - 194,1?1 ,¡18 .334-a21 . i17 .2A1.\42 . i2) -f8)-.188 -:.31 -4r;'
3842.8
.179 2.738-312 2.1A2-269 1.7 66.34 t 2_495,4 25 5- 096
-135 .5,:2 -f99 .4A2 -n62,11? ,013 .326 -152 -213.c93 .)11 .1\A -3I9 -17,2.ai6 .291 -1?.1 -254 .055.111 _5?l -14A .322 -a]f
3 51.
!.5 5
1,,16
291249
.521-554,:rll
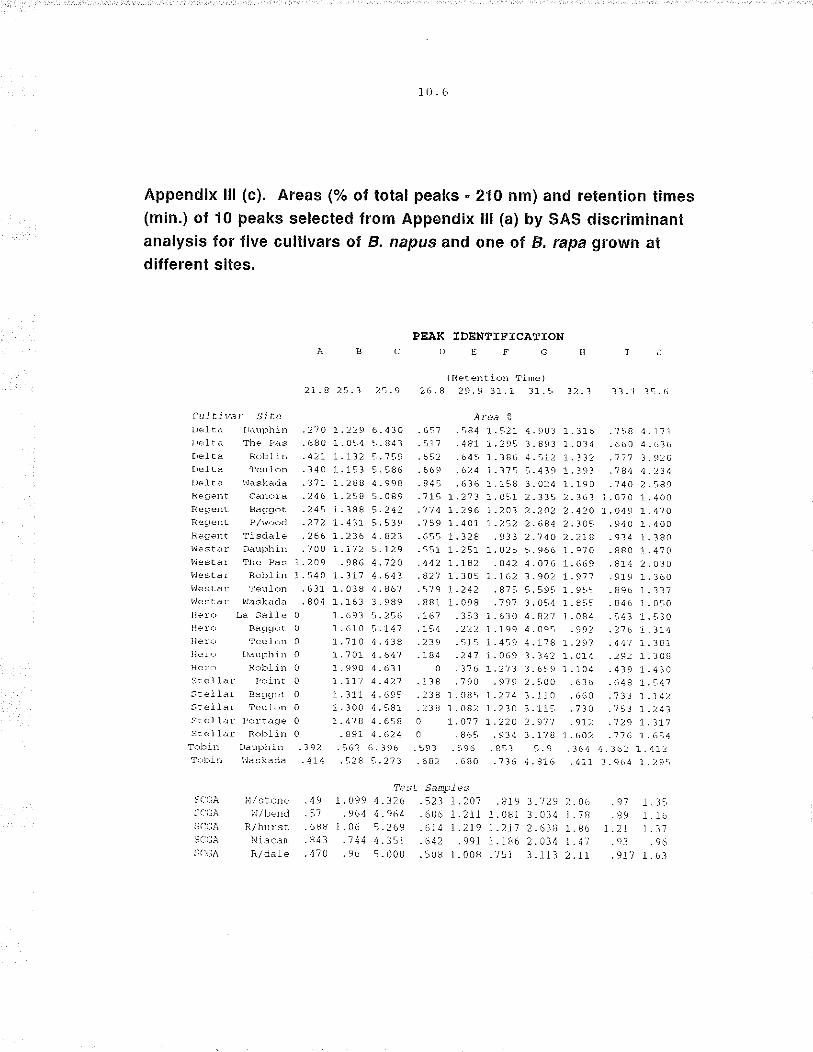
10.6
Appendix lll (c). Areas (o/o of total peaks.210 nm) and retention times(m¡n.) of 10 peaks selected from Appendix lll (a) by SAS d¡scriminantanalysis for five cultivars ot B, napus and one oÍ B, rapa grown atdifferent sites,
PEÀI( IDENÎIFTCÀEIONCDEFGH
21 .A 25.3 25.9
CLr l ti v.rt Si¿e
( ReC erlt ion Time)26.4 29.9 31.1 31.5 32.1 33.1 3i,.6
rrdut)ììiD .2?0 A.229 t5.43A 65? .584 1.521 4.903 1.116 -7..8 4.171The P¿¡s .680 1.054 5.8¿3 t1? .481 1.295 1.893 1.034 .660 4.636RÒl)liìr .421. 1.132 5.?59 652 .645 I.3Ah 4-ta2 t-332 .111 3.92ATeuÌ.ù .340 1-151 t.qA6 669 .624 1.375 5.439 1.393 -784 4-234
l,Jaskadå .3?1 1-284 4-9ga 845 .636 1.158 3.024 1.190 .740 2.189caììord .246 1.258 5.089 715 I.273 1.051 2.335 2.363 1.0?0 1.400Bâçjgor .245 \.3AA a.242 '174 7-296 t-2A3 2.2A2 2.42A 1.049 1.47AP /\ro.'d .272 1.431 S.539 759 1.401 \.252 2-684 2.305 .940 1.400
Ti sdaÌ e .266 r.23t3 4.823 655 1.328 .933 2.740 2.218 .934 1.380551, L.25:. 1.025 5.966 1.970 .880 1.4?O442 1.1a2 .A42 4.0'.76 1.669 .814 2.030
. 82? 1. 305 1-It;2 3 .9A2 1 . 977 - 919 1 - l(r0
.479 1.242 .875 5.59t 1.955 -896 1-31?
.88r. 1.098 .797 3.014 1.855 .846 1.0t0
.167 .353 1.630 4.82? 1.084 .543 1.510
.7\4 .222 i.199 4.091 .992 .21tr -i.714
.239 .515 1.459 4.178 L-29',7 .441 1.3A1784 .24't 1.0{i9 3.342 1.014 .292 1.308
o .316 1.2',13 1.659 1.104 .419 1.430138 .790 .979 2.t00 .636 .648 1.54?238 1.C85 1.214 3.!7A .660 .7t3 1.142
.238 1.082 1.230 3.115 .73A .7a3 1.2430 1.077 1.22A 2.911 -912 -729 1.it10 .865 .934 3.178 1.rt12 .]',tt) 1.1,,4...c)3 .t,96 .811 1.q .to4 4.1ùt 1.4:.
682 .680 .?36 4.816 .411 1.964 1.29!
Daul)hin ,700 a.a72 5.129Tlìe Pas 1 . 209 .986 4.12ARol)]iD 1.540 1-3a11 4.643TeuÌon .631 1.038 4.867
l,laskacla .804 1.163 3.989La Sà]]e 0 1.693 5.2t6
Bâg(,:'t 0 1.610 5.14?Ter'.t,rn 0 1.7 7A 4.43A
þ¿1uFh.in 0 \-7At 4.t 41Roblin 0 1.990 4.631Póirìt 0 7-!l'7 4.42'l
Baggot 0 1.311 4.695Teul,rrì 0 1.300 4.181
?es¿.Samplesiì(rrÀ M/stl)ne .49 I.099 4.326 .a23 I.2A1 .819 3.?29lìcliÀ l,J/bend .57 .964 ¿.964 .606 1.2.t1 i.081 3.034iìcr-iÀ R/hrìrst .6Ë8 1.06 !.269 .6!4 1.2I9 I.2fi 2.63tj:ì(11À Niacan .843 .?4¿ 4.151 .642 .991 .1.186 2.014rìc-\:iÀ R/dâle .470 .96 5.000 .508 I.008.?51 3.I.i3
0ô .97 1.3t?r .!9 t.Ì686 I.2t 1.1?41 .93 ..16
11 .917 t.63

Appendix lll (d). Areas (% of total peaks 240 nm) and retention times(min.) of 10 peaks selected from Append¡x lll (b) by SAS discriminantanalysis for live cultivars ol B, napus and one oÍ B, rapa grown atd ifferent sites.
ÞEÀ¡( IDENEIFICÀTTONÀBCI)EFCHIJ
(ReÈeDrìon Time )
25.9 28.5 29.9 31.5 32.3 32.A 35.7 37.3 3'1 .A 3A.7
('r-l ti v.r I SiË¡ll,lest¿ ! r)aut)hinl¡Jesca ! Pasl,les Èa r R,lbIi.nqesrar TeulonVresla ¡ l,Jaskaci¿¡
Re9e¡1! C arì.)raN/lra!
DauÞhin
B¿'ggot
tr¿uÞhinR,:,b1in
4.t'l 7.21,0 .98! 6.43 2-4A 1-\64.65 1.580 1.000 6.85 2.98 1.414.14 1.27A .941 9.03 2.A4 7.344.01 1.530 .A4A...24 2.94 1.084.08 1.390 .901 3.1ri t.3ó 1.364.70 1.r10 .900 3.1 1.48 1.384.88 1.440 1.100 1.89 3.40 1.!O1.1: 1.314.1.040 4.09 l.l2 1.4Ò
À¡ea e"
4.47 1.4t 0 .989 9.67 2.94 !.47 \ .42 .40',7 3.A385 .591 6.24zt .4c-,4 3.6436 .430 4.94a3 .18\ 1-222l .301 3-1t27 .294 2.98 .42r)j'7 .1A.,3.19 - 41,1
31 .396 4.07 .4585.44 7.220 .133 7.83 1.91 1.10 .r.92 .AA2 1.91 .99!5.63 1.130 .333 (i.44 1.5? 1.04 '7.24 .1t4 2.4a 7.02A5.13 a.2AA .447 ',t -OA 2.aA l.Ot 5.48 .166 1.95 -89?5.04 1.020 .404 8.61 2.03 !.22 6.12 .186 3.10 1.1r,05.15 1.260 .327 4.7A 7.73 .82 t.40 .101 .?6 .6312.94 .(t59 .099 4.67 .96? .34 .A.. .722 !.1c-, .2.132.89 .',129 .110 4.1.1 1.02 .36 .68.100 1.38 .2112.28 .tt5 .125 3.88 1.14 .35 .81 .112 1.80 .3062.42 .ö6A .126 3.7 .994 .32 ,7A .1,3b 7. t'.-, .2'7\2.56 .578 .067 3.38 .907 .32 -rj7 .090 .65 .¿122.81 .:97 .\2t) 2.91 .7t .68 1.10 .A82 '2.27 .3a,A3.36 .694 .a,48 3.AA .r.7 .77 .A8 .A14 r.8A .2722.aa .177 .456 1.07 .t33 .42 .81 .067 1.t4 -2083.14 .669 .581 1.54 1.02 .60 1.24 .O9o 2.08 .3153.14 .669 .627 3.93 2.04 .889 1.28 .111 1.61 .41,1
?est,5-amples3.71 1.21 .807 5.66 3.16 .28 1.34 .319 2.7A ..-,Ð24.6ô 1.55 1.05 4.85 2.A2 .217 7.23 .312 2.1A .0334.AA 1.14 1.08 4.08 3.LL .224 L.2A .2r>9 1..71 .37!3 .49 a.23 .A75 3 -24 2 .2,,4.1A t.2t .8A1 4.74 3.?.1
4',12
,'1036650!3 56
Sa¡jÀ M/sloneSrl(iÀ llll)en.lsrl(ìÀ R/hu Isr

10.8
Appendix lV (a). Canonical Diseriminate Analysis (SAS) of i0 peaks(Appendix lV c.) acquired at 210 nm.
29 cù6ervat i(ìDs
5
5
4
5
2
5
5
28 t'F Tc)raI23 úF lti llÌln classes5 OF BeÈueen classes
Clags ¡,evel IEtorßat'loD
cv
!)H
R
sTtlx
l,le.i ghÈ Pì:oìrort ioìì
5-0000 0.161-2905.0000 0.1612904.0000 0-t29a325.0000 0.1612902.0000 0.0645165.0000 0.1612905.0000 0.161290
CaDoDlcal Discr1Eì:ldaDÈ À.balysLE palñ{ìse Squa¡êal DlståDces BêlneêÞ c¡ouÞE
2_.1D (ilj) = (x - X )'cov lx x )
ilil
squared DlstaDce t'o cv
F¡,rrñ {.\¡ Þ H R s
r, 0 432.a832i 2a7 .tL04I 262.91i11Ê 132.Ð4321 a '742.3A193 361.54467R 2t?.11041 't42.3A?93 A 1,73.76..123s 2tr2.9ti44 361.a446't 173.'t6723 o
T 2615 3733 2atA 2626i,r 244.36699 !656.64256 r31 .',77187 244.191A..x 238.1tr274 641-ò4582 At.ao221 !2t.oo1a2
26ta 244 -36h99 27A.7 621a3?ll 656.6425(t b+t.64.-,a22."!8 131 .',11187 41.AA2272626 244 .797 8' 72t, .001A2
0 2 313 22t t2313 0 53. 90598226a 53. 90598 0

r0.9
Appendix lV (b). Plot of Canonical Discriminate Analysis (Can1 . Cafiz,SAS) of 10 peaks (Appendix lll c.) acqu¡red ai 21O ûrn.Proportion of total variation accounted for by the twoaxes GANl = 64.610/" GAN2 = 2Ù.58o/o.
CAN2
10
RRRx
x v¡til.¡x1\I-l
x
ssDSÞÞl)
NoTE: 4 obs hidden

10.10
Appendix lV (c). Canonical Discriminate Analysis (SAS) of 10 peaks(Appendix lll d.) acquired at 240 nm.
29,)bservari,rns 28 DF Torâl10 Varial)les 23 tJF r,¡iÈhiD classes(t (lasses 5 t)F Beteeen C_Iasse6
ClâEs IJevêl lbfoñÉtlôD
CV !'requency r,reighc prôÞorrio¡r
o 5 5.0000H 5 5.0000R 4 4.0000s 5 5.0000n 5 5.0000x 5 5.0000
L7 2 414712 47 4
13793177 24147 7 2At4!'12414
Squa¡êal DlstaDcê tô CV
Fr!trm aV O H R S r¡,, X
cåDoÞl,cal Dlsc¡LbiDa¡b À¡alysls palrnlsê squa!€dt Dtstalces Bêt.wêêD GrouÞs
2 _ -1 _l) {.i j) = (X - x )'L()v tx - x )
ijij
0 171.06623 328-71914 t68.07352 2A8.29978 322.8468.7171.06ô21 0 106.8491(t 1t9.992A2 2L2.tta443 234.A299t328.7\9.,4 306.84916 A 787.24268 66.6\15A 281,.39484308.073t2 15S.99282 1,8'7.2426A A 20'1 .9221a 2A2.24948208.29978 2L2.ha443 t b.61,',7.,0 2a1 .92248 A 162.C21!r-¿322.846A7 23A.A299tJ 2a1 .394a4 282.2494A !62.62462 o
l¡H
R
5I,J
x
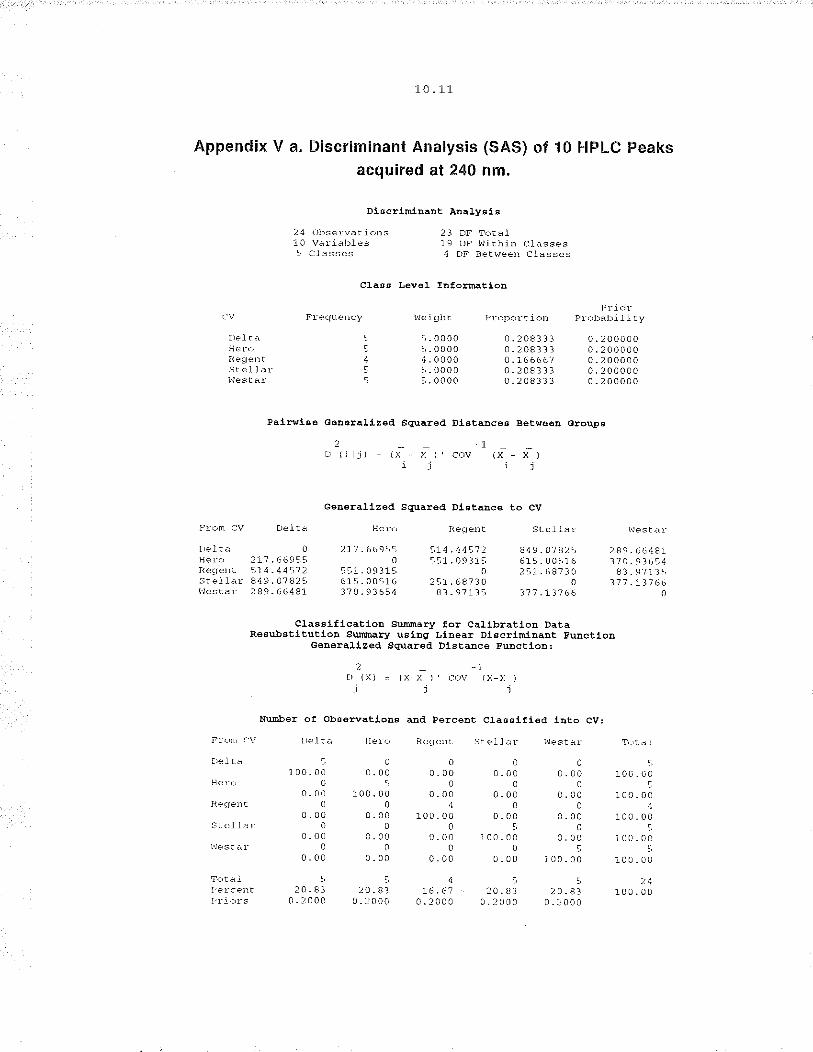
10.11
Appendix V a. Discriminant Analysis (SAS) of 10 HPLC Peaksacquired at 240 nm.
Dlscrlll:LDa¡¡t À¡alysts
24 clbservâtions 23 DF Tôral19 DF r,Jirhin cla6ses4 DF Bet!¡een Classes
class lr€vêl rDfôrmâÈloD
r: v Fljequet)cy
!)el ca tHero 5Regent 4Sle-llar tl"Je s La ! 5
Fì-on arv Oelta Hero
r)el tâ 0 21?.66955HeÌo 217.66955 0Re!¡enr 514.44572 551.0911tsreI.Ia¡849.0?825 615.00!1óHesrar 289.ö6481 370.93654
Priôr'P¡óPôrl i,)n Pr ct)abi1ity
0.208333 0.2000000.208333 0.2000000.166667 0.2000000.208333 0.2000000.208333 0.200000
tJe.i ghÈ
5.00001.00004.00001.00005.0000
Þaln¡lsê €ÊDê¡aLlze¿t gguarêat DIEÈaDces Bels¡êêD Groups
2 _ _ -1 _ _Þ (ilj) = (x-X)' cov (x-X )ij,j
GêEerallzeal gqua¡eal DIsCa¡cê !o CV
Regenr steLlar'
514.44112 849.01Azt551.09115 615.00516
0 251.68730251.68730 083.9?135 377.a3166
289.ri6481170.9365483.9?135
j71.13lbtr0
C1asslflcatlo¡¡ Surdnary for Callb¡aEloD DataRêsu¡sÈlt,ut,loD sl¡¡¡¡nary urlDg Llbêar DldctlmiDaDt FuDcLloD
G6Dêral1zecl SquareCl DlÊt'aDce FuDcEloD:
2-7-Þ (x) = (x-x ), t]lv (x-x )
jjj
Nu¡ib€r of Obsêwal1oBs aDal Þerc€bt Classlflêd lÀÈo cv:
FIC'm ( V Lle.Lta He!,r RegeIr Srel.Iar
t)e.Itå 5 0 O 0100.00 0.00 0.00 0.00
Heru05000. 00 100. 00 0. 00 0. 00
ResrenÈ00400. 00 0. 00 100. 00 0. 00
Sle.llef 0 0 0 50.00 0.00 c.00 100.00
Hestar00000.00 0.00 0.00 0.oo
T,rraìt54,,PercerlÈ 20.81 20.83 16.67 20.83Fri.rr-s 0.2000 0.2000 O.ZOO0 0_2000
lie sta r- T,)tal
0!0. 00 100. 00
050.00 100. 0 0
040.00 10 0. 00
0tc.00 10 0. 00
55100.00 100.00
a 242 0.81 100. 0 0
0-2000

10.12
Appendix V b. Discriminant Analysis (SAS) of l0 HPLO Peaksacquired at 240 nm.
Classification Results for Test Data
Classification Results using Linear Discr¡minant Function
GêÀê¡aLlzed squarêat D1BEa.ûcê Fu¡cts1oD:2-!
o (x) = (x-x )' 'rc)v (x-x )
Post'ello¡ Þ¡oba.bllIÈy ot Mêbbêrehlp 1¡ eacb CV:
22Pr(jlx) = exÞ(-.5 D (X)) / suti exP{-.5 Þ (x) )jkk
PoaEerlor ProbâÞllley of ìtenibershlÞ 1Þ CV:
LOC From C1åsslilêdCV lDtO CV DEI, HER REG SîE WES
l,l/stoDe sccÀ Wesra¡ . 0.0000 O.OOOO O.OOOO O,OOOO 1.OOOOlllbeDël sccÀ l{€sta¡ r 0.0000 O,OOOO o.ooOO O,OOOO 1-OOOOR/bu¡st SCsÀ Wegrar ¡ 0.0000 0.0000 O.O0OO O.OOOO X.,OOOONlacaln sccÀ ltesra¡ r O , OOOO O - OOOO O. OOOO O. OOOO t. OOOOR/da1e accÀ 1{e6ba¡ . 0 .0000 O. OOOO O. OOOo O. OOOO 1. O0O0
Nu¡dbet of Obsêrvatl,oDs aDd Þerce¡IE Classi,fl€¿t lDt.o CV:
F]j,:ìrÌ r:V !re.IÈ¿¡ Her,r Rege)1r Sre]la! llest¿ir T,)t¿.1s.cÀ 0 0 0 0 5 50.00 0.00 0.00 0.00 1o0.oo 1o0.ooTùråÌooooil
PeIceDi 0. 00 0. 00 0 - 00 0.00 100. 0O 100. O0

Appendix V!. Correlat¡on Matr¡x of FIPLC data (210 nm) for 5 Cultivars of B. napusfrom 5 sitesanalysed w¡th Phylo software (Pearson's product-moment correlation coefficients).
.932-999 .961-966 .9."5 .9tt.930 .951 _)15 .912.611 . /4A .3|9 -151 .693-606 .751 -796 .?14 _363-33¿ .171 .324 .7',7l .901.651 - 7ô1 . 6.1.1 - 8111 .909-â54 .162 .657 .379 .33â.928 .311 .929 .92^ .92\.ô51 ./19 ,352 _3¿0 _6?1- 651 .753 . 3S0 . 311 ,611.3.19 .16Å .6rl .â25 .883-911 .ê36 - 91C .910 - 916-922 .A41 .9I3 .9A2 -940.905 .619 .A91 .9A0 -90'l.924 .452 .910 .A9A .9ÄA-ttt .331 .taj .36'7 .92â- i36 - 894 _t2) .A90 .9-t3.696 .825 . ô65 .656 - 932.]41 .331 .â91 .31A .t36.952 .33 t .Ai2 .34t .936. 9l.t .6?5 .93A .901 .952.756 -633 .153 .153 .151.132, ...5A .12',7 .121 .131
101112131t15161'l187t2027222324252,6
.99â
.99 6 .9 ,a 'l
.9)2 .9Ê3 .9tÅ
.'tt2, .161 .31,8
.853 .â15 -876
.31¿ .',¿52 .396_80û .76ô ,32,j.912 .)I3 .9¿5
.371 .659 .901-8.10 .625 -3?1.869 ,331 -916.461 .355 .392.91t .9L2 .938.619 .69C -928.941 .392 .929.916 _90' .9.1C.91.1 - 931 - 95t.€t6 .666 .'Ì i].6i ê .6J7 _ 683
.861-9A t .95t.916 .959 .911-861 .9)9 .958-965 .9¿d .955.360 .946 .933-909 .935 -9,10.384 .946 .926
-900 .903 .915-911 .855 -919-92t .391 .91s-930 .9tt .921- 910 .36.1 . 917-911 .913 .959.7 _1.1 _ 822 .3¡5-11I .1i) .'71ì
1¡
_ 960- 931 .949.929 .9ÅA .921..9¿1 .929 .9¿I.925 .94t .924.926 .90n .931.912 -30C .915.89-1 -351 .907.,al4 .3a9 .921-916 .396 .926-910 ,3â0 .923-931 .t13 .955
. /55 .1tê .1\3
_ 991.99 7
.983
.981, 916_ 960.t61
-9'16
.741
.996 .9A3
.993 .9A9-951 .923.910 .952,.913 .951.969 .951.956 - t46
-'t65 .1)1
24 25 2a
.996- 965 .951.969 -963 .985.912 .966 . 987 _ 999.914 .91I _969 .995.956 .9Ä9 _ 963 . 956.1tI .',761 .800 .621.736 .73,1 .115 .195
. )t6- 965 .910.62J .1)ê. .3i5. .1i7 .1e ,. _760 - iiô

1A .74
Appendix Vll (a). Average Linkage Cluster Analysis of five cultivars of B.napus and one of B. rapa gtown at different sites, Based on 10 peaks
(210 nm) shown in Appendix I (a).
1.6 rI
I XXXXXXXXXXXXXXXXXXXXXXXXXXXXXXXXXXXXXXXXXXXXXXXXXXXI XXXXXXXXXXXXXXXXXXXXXXXXXXXXXXXXXXXXXXXXXXXXXXX XXXI XXXXXXXXXXXXXXXXXXXXXXXXXXXXXXXXXXXXXXXXXXXXXXX XX}
1. 4 +XXXXXXXXXXXXXXXXXXXXXXXXXXXXXXXXXXXXXXXXXXXXXXX XXxI XXXXXXXXXXXXXXXXXXXXXXXXXXXXXXXXXXXXXXXXXXXXXXX XXXI }iXXXXXXXXXXXXXXXXXXXXXXXXXXXXXXXXXXXXXXXXXXXXXX XXXXXXXXXXXXXXXXXXXXXXXXXXXX¡XXXXXXXXXXXXXXXXXXXXX XXX
1 XXXXXXXXXXXXXXXXXXXXXXXXXXXXXXXXXXXXXXXXXXXXXXX XXX1. 2 +XXXXXXXXXXXXXXXXXXXXXXXXXXXXXXXXXXXXXXXXXXXXXXX XXX
I XXXXXXX XXXXXXXXXXXXXXXXXXXXXXXXXXXXXXXXXXXXXXX XXXI XXXXXXX XXXXXXXXXXXXXXXXXXXXXXXXXXXXXXXXXXXXXXX XXXI XXXXXXX XXXXXXXXXXXXXXXXXXXXXXXXXXXXXXXXXXXXXXX XXXI XXXXXXX XXXXXXXXXXXXXXXXXXXXXXXXXXXXXXXXXXXXXXX XXX
1 +XXXXXXX XXXXXXXXXXXXXXXXXXXXXXXXXXXXXXXXXXXXXXX XXXIXXXXXXX XXXXXXXXXXXXXXXXXXXXXXXXXXXXXXXXXXX XXX XXXI XXXXXXX XXXXXXXXXXXXXXXXXXXXXXXXXXXXXXXXXXX XXX XXXXXXXXXX XXXXXXXXXXXXXXXXXXXXXXXXXXXXXXXXXXX XXX XXX
lXXXXXXX XXXXXXXXXXXXXXXXXXXXXXXXXXXXXXXXXXX XXX XXX0.8 +XXXXXXX XXXXXXXXXXXXXXXXXXXXXXXXXXXXXXXXXXX XXX XXx
IXXXXXXX XXXXXXXXXXXXXXXXXXXXXXXXXXXXXXXXXXX XXX XXXIXXXXXXX XXXXXXXXXXXXXXXXXXXXXXXXXXXXXXXXXXX XXX XXXIXXXXXXX XXXXXXXXXXXXXXXXXXXXX XXXXXXXXXXXXX XXX XXXIXXXXXXX XXXXXXXXXXXXXXXXXXXXX XXXXXXXXXXXXX XXX XXX
0.6 +XXXXXXX XXXXXXXXXXXXXXXXXXXXX XXXXXXX XXXXX XXX XXXIXXXXXXX XXXXXXXXXXXXXXXXXXX XXXXXXX XXXXX XXX XXXXXXXXXX XXXXXXXXX XXXXXXXXX XXXXXXX XXXXX XXX XXXXXXXXXX XXXXXXXXX XXXXXXXXX XXXXXXX XXX XXXXXXXX XXXXXXXXX XXXXXXXXX XXXXXXX XXX XXX
0.4 +XXXXX XXXXXXX XXXXXXXXX XXXXXXX XXX xXXIXXXXX XXXXXXX XXXXXXX XXXXXXX XXX XXXIXXXXX XXXXXXX XXXXXXX XXXXXXX XXX|XXX XXXXXXX XXXXXXX XXXXXXX XXXI . xxx xxxxx xxxxxxx xxx
A.2 +. XXX XXXXX XXXXX XXX. XXXXX XXX XXXt.
t.t.
0 +.l)ELT
ot)LLTT
HH
RRoo
XXXXX XXXXXXXXX
HHEERRoo
RTOEBU
SSSI'TTTTEELLLL
RR
RREECC;EEN 1.1
EETT
t'1
(i
T0BIi\-
I,J
U
TPRI,]IJTIAOAÀESIìBSUU
BCP
xN l)
R hÌ l{ l,l i,l !l T
I'ULTIVAREEEEEEETTTTTERRRRRT
f)
U
oB
LBT PI{EAÀ
U
TPEOUR

10 _ 15
Appendix Vll (b). Single Linkage Cluster Analysis of five cultivarsol B, napus and one ot B, rapa grown at different s¡tes, Based on10 peaks (210 nm) shown in Appendix lll (a).
1.4 +
] XXXXXXXXXXXXXXXXXXXXXXXXXXXXXXXXXXXXXXXXXXXXXXXXXXX] XXXXXXXXXXXXXXXXXXXXXXXXXXXXXXXXXXXXXXXXXXXXXXX XXXI XXXXXXXXXXXXXXXXXXXXXXXXXXXXXXXXXXXXXXXXXXXXXXX XXX+XXXXXXXXXXXXXXXXXXXXXXXXXXXXXXXX)IXXXXXXXXXXXXXX xXxI XXXXXXXXXXXXXXXXXXXXXXXXXXXXXXXXXXXXXXXXXXXXXXX XXXI XXXXXXXXXXXXXXXXXXXXXXXXXXXXXXXXXXXXXXXXXXXXXXX XXXI XXXXXXXXXXXXXXXXXXXXXXXXXXXXXXXXXXXXXXXXXXXXXXX XXXI XXXXXXXXXXXXXXXXXXXXXXXXXXXXXXXXXXXXXXXXXXXXXXX XXXXXXXXXXXXXXXXXXXXXXXXXXXXXXXXXXXXXXXXXXXXXXXXXX XXXXXXXXXXXXXXXXXXXXXXXXXXXXXXXXXXXXXXXXXXXXXXXXXX XXX
XXXXXXXXXXXXXXXXXXXXXXXXXXXXXXXXXXXXXXXXXXXXXX XXXXXXXXXXXXXXXXXXXXXXXXXXXXXXXXXXXXXXXXXXXXXXXXXX XXX
0.6
0.4
0.8
t.t.
XXXXXXXXXXXXXXXXXXXXXXXXXXXXXXXXXXXXXXXXXXXXXX XXXXXXXXXXXXXXXXXXXXXXXXXXXXXXXXXXXXXXXXXXXXXXXXX XXXXXXXXX XXXXXXXXXXXXXXXXXXXXXXXXXXXXXXXXXXXXXXX XXXXXXXXX XXXXXXXXXXXXXXXXXXXXXXXXXXXXXXXXXXXXXXX XXXXXXXXX XXXXXXXXXXXXXXXXXXXXXXXXXXXXXXXXXXXXXXX XXXXXXXXX XXXXXXXXXXXXXXXXXXXXXXXXXXXXXXXXX¡XXXXX XXXXXXXXX XXXXXXXXXXXXXXXXXXXXXXXXXXXXXXXXXXX XXX XXXXXXXXX XXXXXXXXXXXXXXXXXXXXXXXXXXXXXXXXXXX XXXXXXXXX XXXXXXXXXXXXXXXXXXXXXXXXXXXXXXXXX XXXXXXXXX XXXXXXXXXXXXXXXXXXXXXXXXXXXXX XXX XXXXXXXXX XXXXXXXXXXXXXXXXXXXXXXXXXXXXX XXX XXXXXXXXX XXXXXXXXXXXXXXXXXXX XXXXXXX XXX XXXXXX XXXXXXXXX XXXXXXXXX XXXXXXX XXX XXXXX XXXXXXXXX XXXXXXX XXXXXXX XXX
XXXXX XXXXX XXXXXXX XXXXXX XXXXX XXXXXXX XXXXXX XXXXX XXXXXXX XXX
XXXXX XXXXXX XXX
0 +.r) or)Dt)H
LLLLRTTTTC
HHEERRoo
EO
TIÀNR
TTTiìRRRRI,JI,JIITEEEEEEEE C (.i {.1 (:j !l i:ì sLEEEETTTLNNNNÀÀÀÀEEEERRRRTTTT
('ULTI\¡ÀR
S]TERTPþ]
BUSS
LBiìc
LL
R
TEU
OEÀB U (l
RB','PTPRI.JOTDI.J0ÀÀÀIÀoÀÀEÀÀBXNDiì!]Bi]UUU:ì
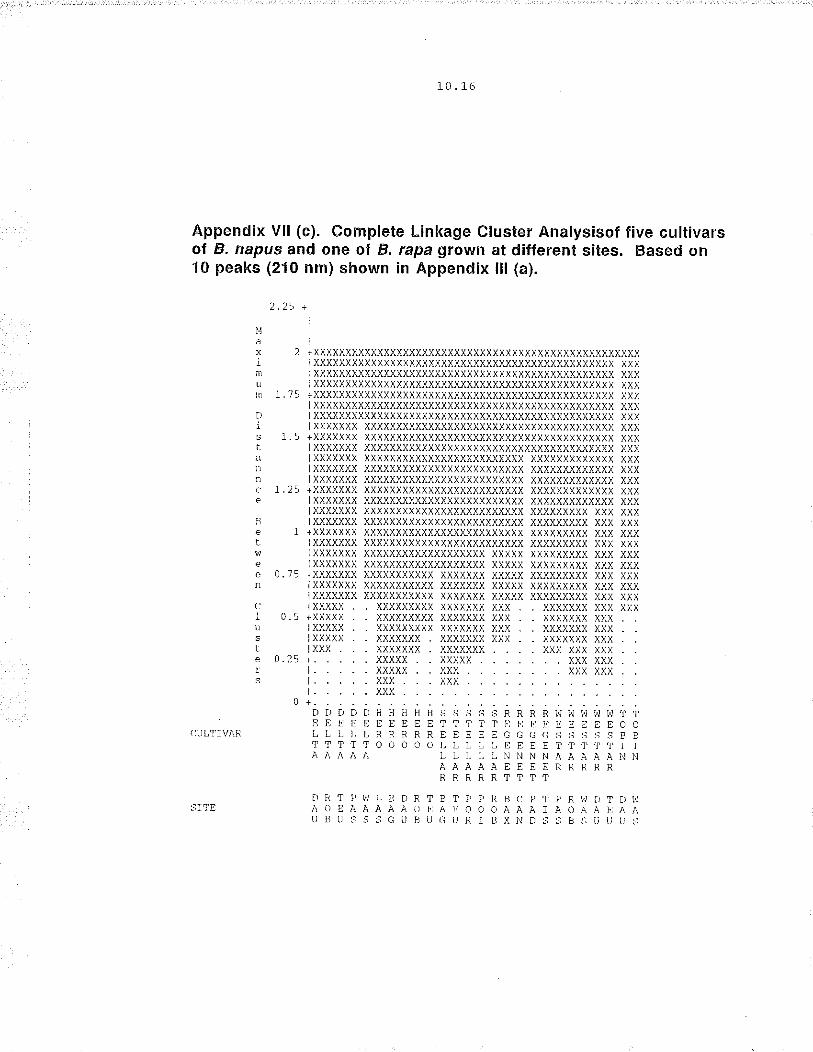
10.16
Appendix Vll (c). Complete Linkage Cluster Analysisof five cultivarsol B, napus and one ol B. rapa grown at different sites. Based on10 peaks (210 nm) shown in Appendix lll (a).
Il
ximum
2 +xXXXXXXXXXXXXxXxxXXXXXXXXXXXXXXxXXXXXXXXXXXXXXXXXxx] XXXXXXXXXXXXXXXXXXXXXXXXXXXXXXXXXXXXXXXXXXXXXXX XXXI XXXXXXXXXXXXXXXXXXXXX}iXXXXXXXXXXXXXXXXXXXXXXXXX XXXi XXXXXXXXXXXXXXXXXXXXXXXXXXXXXXJüXXXXXXXXXXXXXXX XXX
1. ?5 +XXXXXXXXXXXXXXXXXXXXXXXXXXXXXXXXXXXXXXXXXXXXXXX XXXI XXXXXXXXXXXXXXXXXXXXXXXXXXXXXXXXXXXXXXXXXXXXXXN XXXI XXXXXXXXXXXXXXXXXXXXXXXXXXXXXXXXXXXXXXXXXXXXXXX XXXI XXXXXXX XXXXXXXXXXXXXXXXXXXXXXXXXXXXXXXXXXXXXXX XXX
1.5 +xxxXXXX XXXXXXXXXXXXXXXXXXXXXXXXXXXXXXXXXXXXXxx xxXI XXXXXXX XXXXXXXXXXXXXXXXXXXXXXXXXXXXXXXXXXXXXXX XXXXXXXXXX XXXXXXXXXXXXXXXXXXXXXXXXX XXXXXXXXXXXXX XXXXXXXXXX XXXXXXXXXXXXXXXXXXXXXXXXX XXXXXXXXXXXXX XXX
] XXXXXXX XXXXXXXXXXXXXXXXXXXXXXXXX XXXXXXXXXXXXX XXX1.25 +XXXXXXX xXXXXXXXXXXXXXXXXXXXXXXXX XXXXxXXXXXXXX XXX
I XXXXXXX XXXXXXXXXXXXXXXXXXXXXXXXX XXXXXXXXXXXXX XXXIXXXXXXX XXXXXXXXXXXXXXXXXXXXXXXXX XXXXXXXXX XXX XXXIXXXXXXX XXXXXXXXXXXXXXXXXXXXXXXXX XXXXXXXXX XXX XXX
1 +XXXXXxx XXXXXXXXXXXXXXXXXXXXXXXXX xXXXXXXXX XXX xXXIXXXXXXX XXXXXXXXXXXXXXXXXXXXXXXXX XXXXXXXXX XXX XXXIXXXXXXX XXXXXXXXXXXXXXXXXXX XXXXX XXXXXXXXX XXX XXXIXXXXXXX XXXXXXXXXXXXXXXXXXX XXXXX XXXXXXXXX XXX XXX
0.75 +XXXXXXX XXXXXXXXXXX XXXXXXX XXXXX XXXXXXXXX xxx XXx]XXXXXXX XXXXXXXXXXX XXXXXXX XXXXX XXXXXXXXX XXX XXXlXXXXXXX XXXXXXXXXXX XXXXXXX XXXXX XXXXXXXXX XXX XXX1XXXXX XXXXXXXXX XXXXXXX XXX XXXXXXX XXX XXX
0.5 +XXXXX XXXXXXXXX XXXXXXX XXX XXXXXXX XXXIXXXXX XXXXXXXXX XXXXXXX XXX XXXXXXX XXXIXXXXX XXXXXXX XXXXXXX XXX XXXXXXX XXXIXXX XXXXXXX
0.24 + .l.t.l.
0 +.DDDLI
. xxx
XXXXXXXXXXXX
XXX XXX XXX. XXX XXX. XXX XXX
1'1 ::::::::..:EEE(ULTIVÀR L L LlTTÀÀÀ
DHEELRTO
I.J L
slì
HHEERRoo
EELLLL
RR
SRTEECLELNÀERT
TTT
ÀEai tl
R R I,J I,I I,J I.J I,J T TEEEEEEEOOCGSI]SSSBBE E TTTTTI ]NNÀÀÀÀÀNNEERRRRRTTPTt,Rl,Jl)Tt)1,ìÀIÀOÀÄEÀÀDiì li B lìu u t) iì
t)RTÀoEUBU
DRÀ0UB(-l
RBoÀBX
PoI N

10 . J.'1
Appendix Vlll. Areas (% of total peaks) and retention times (min.) of 1O
peaks for 27 cultivars ol B. napus and two ol B. rapa (210 nm).
PEAK IDENTIFICATION(trEF(l
2r.94 25.36
l\r.LtivarÀrlJentinê 3.279 3.864B,)unLy 2.12È 5 .1t]9Bù,rì.,e'sk i I 233 A .443. e-Ie)rrå 1.379 ?.889a,:)Ìi .929 3.5I0l rysral 3.919 8.29(jtje.Ira 1-575 1.62IExceÌ 2.549 0.099(:;loba.I I.8.10 8.653Her.o 1.8Ì6 12.305Hc'r.i zr:,n 1.021 3.525Hyc,Ìd I.699 5. 121
Le!¡end 2.642 6.1AAl4idas 3.091 1 .2'7'loù,:' 4.281 6.2I4I'iv,:)l 3.29'ì 9.I17Pr,)fit 1.188 6.4?9Rêqenl. 3. 523 8.331Resl,:jn 2 -183 B.2BA
!t.âlli,:,n 2.527 (,. 53Ilìt el laÌ- 1.888 9.814T,:)l:,as 1.8!9 5. b20
ToLìchd,:)!\¡lì L3AA 1.812T,r,\r'er I.788 6-809Tlilnrle I.2Ab I .241Tfi sla ì 2.293 t;.ofiV.ìngLìa¡d .l . 977 t. lI¿l,Jesl.a r 3.0C4 5.78?l'Ji nf ielci 2.392 3-t9b
1Rè¿er¿io/r fime)25.94 2h .81 29 .92 31. 15
Àr ea {e. )
29-?83 8.89I 10.?65 {1.603
3I.002 1.328 3.312 9.39938.284 i.A4a 3.4"t9 r1 .63225 .6A2 4 .155 4 .011 7 .26836.?94 4.641 4.998 5.54537.989 r.845 4-800 4.',Ì6510.607 .t.415 2.138 ?.89331.3 4I 1.35t 6.840 8.0164 2.710 1.559 3.551 3.10i36.244 3.915 2.2A2 ?.0133?.617 4.?88 6.099 6.16934 .'ì12 2.A1 4 2.A2"t 1 .3\230.605 3.275 2.698 8-69944.022 1 .9',17 A .A63 9. ¿ 81
2 9. 54I 5.340 8.006 6.43130 .21A 2.3tr3 9.031 5.55?30.102 1.712 6.50? 1.A1829.699 5.630 8.793 6.24328.öBA 2.4 71 1A.211 6.98331 .A41 2 .293 \.544 4.29338.002 5.580 8.581 9.18432 .412 1.'756 3.828 I.04',t38.29i Ì.580 1.948 7.(,5036.658 3.75¿ 6.542 t.3Aj3 6. 095 1.848 2.500 8.66934.484 1 .4.t 7 7.391 6-29332.321 I.904 2.599 t1.44429 .457 3.983 ',l.64'1 6.51032.8b9 I.6Iq 1.584 7.6i3
31.46 32,28 33.01 35.66
11.363 l4.808 5.3A1 a.29',1
18.246 1 .413 .t.620 19.?6213.36Ì 9.680 0.000 16.0432r.321 14.549 3 .3\4 1.'l2A34.574 .(t61 2.41t 5.11'14
18.545 r0.??0 2.702 6.76¡l20.557 .r. 018 i.6.i.L 2..¡.1b412.A24 13 ,188 4.634 t3.95016.86 8 13.',129 1.800 6.22018..[43 6.522 1.211 4.ö0229..150 2. t45 3.051 6.43215.154 12.889 .000 18.23219. 912 .16. 089 2 .126 ',1 .24414.642 16. B 14 2.StB 2.91412.059 1,4.A2A 8.b22 !.4081l . 413 1A.2',13 8.738 ?.88111 .'751 i5.3t5 5.405 8.45112 .495 12.458 1.',t04 t.I2I16.11¿ 14.683 6.149 l.¡8120-661 10.',712 1.489 8.09514.481 6.008 3 .692 6.?6118.436 16.46t 3.199 9.32223 .912 I0. 528 . 000 9. 85È
17.105 1I.102 5.A24 4.8?lI?.450 12.221 5.394 1.28420.!15 10.976 6.05Ì 4.90922-585 13 .4 t1 4.9t1 6.65315.216 11 .109 9.32t 4.6ôe24.184 12.21b l.8qb 1t.9t0

Append¡x !X. Correlation matrix of HPLC data (210 nm) on 27 cultivars ot B. napus and two ofB. rapa analysed with PHYLO software (Pearson's product moment correlation coefficients).
1
3
4561I9
10111?.
1l1415161113192A2L22232,4?.526212Ê29
1113792A212223212526212829
I2l.l 5...1A¿- ô3,1 .953
-715 -817 _770 .363.692 .611 - 'i 16 . 93 3 - 875-595 -9â1 .A9A .163 .116 .'t't9.813 .924 .) t2 .â5¿ .113 .929.91-/ . All .914 .92I .622 .993.196 -A75 .863 .A11 .6€,1 -965_16.1 .3,t9 _ 6tû _ 39.1 .992 .911.8t"1 .9 69 . )l9 . â12 .161 .9\\_310 .656 .6)2 .985 _ô,16 -952-910 -190 _39{ -i05 .1\1 .956,965 - ?15 . â55 - 357 .1¿E .941.391 .319 . â32 - 351 .8A3 _962.904 .362 . 9a1 - 956 .831 - 959.951 .153 .659 .663 .118 .95't.923 .13,1 _316 ,9C6 .79â .912-39't .892 .92a .918 - 901 .995.912 .34',7 .923 .831 - 85{ - 953.691 - ôâ4 .92A .96ô .321 -961-345 .929 .911 .965 .920 .912,93.t .332 .ir3 .9I1 .866 .98?.661 .319 .933 . t31 .65I .919.399 .335 .616 .938 _902 .919.650 - 365 . â62 - 96û .9A2 .956.939 .15¿ , ô16 . 399 .8A1 .i.12.êa2, .93¿ .ttl .969 .9A8 .931
.353
.t4) .910
.l 11 .a3¿ .946
.199 .798 .8? l -896-923 .91s - 913 - 335 . 311-15( .906 .919 .A91 .A16.663 .91t .910 .9I9 .873. 6ll - 911 - 962 .856 . 313-123 .i31 .966 .A93 .36A.115 .911 .962 .865 .A11.639 .946 -9?¿ -391 .3,t0.615 .679 .94-r .862 .843_311 .931 -963 .946 ,939-751 .908 .91t .922 .91,2.'t99 .95A .965 .319 .ô64.364 .921. -952 .93A .916.137- .92I .936 .931 .91€,_ 7ô6 - 943 .919 .932 .896_7t3 -904 .96Ê, .919 .933.7âl - 691 .9¿2 .8)9 .92¿.613 .39€, .951 - 854 . 851.68)- .9A5 .975 .A7.. .925
22 23 ?,Ã 25 2,616 L1 13 19 2A- 945.916 .9,t).948 -961 .983.95L .9É.ti ,'lc4 _938-9¡l .899 .9{6 .397 -950-924 .992 .92,t .919 .966.9AS .959 .3-.1 -699 .985.912 .96Å .96{ .96J _ 983.955 _911 .95,1 .938 .91¿.9é5 .912 .96A .t',1a .9e1_9C4 .915 .9C5 .93A .965.)\6 .t6a .9tt .i15 .933-ô63 -951 .3J,ì -365 -9sâ
10 11 '| ). 13
2\
.37 3 .t51
.âlt .9it .959
.867 . 435 .9tt .96A
.916 .t13 .945 - 945
.63 6 -90d .95,t .99I
.306 - 930 .936 .9\9
.923 .956 .936 .929
.414 .416 .91-3 .92,4-9¿0 .)90 .95€ .9)?-.937 .91), .923 .A8¿.632 .9,t8 .9Ê.2 ..J11.91-9 .91a .975 .9¿9- 361 .950 .937 .95A. ââ8 - 938 .913 - 901-628 -934 .950 .9A3-931 -969 .838 .6.t6
.691
.926-917.9J5,945_892- 90ô- 669
9tI955 - 956916 .912 .983954 .9..2 -9êâ .974913 .9ãL .955 .915)"11 .915 - 971 .958t61 _ )69 .916 .9J6
9'Ì 3
9?3 .9¿¡,16 .97â ,ôô1

10.1f)
Append¡x X a. Average Linkage Cluster Analysis of 27 cultivars ofB, napus and 2 of B. rapa based on peak areas of 10 peaks shownin Append¡x ll (a).
i.1 +
I
I
I
I XXXXXXXXXXXXXXXXXXXXXXXXXXXXXXXXXXXXXXXXXXXXXXXXXXXXXXXXXI XXXXXXXXXXXXXXXXXXXXXXXXXXXXXXXXXXXXXXXXXXXXXXXXX XXXXXXX
1. 2 +XXXXXXXXXXXXXXXXXXXXXXXXXXXXXXXXXXXXXXXXXXXXXXXXX XXXXXXXXXXXXXXXXXXXXXXXXXXXXXXXXXXXXXXXXXXXXXXXXXXXXXXXX XXXXXXX
] XXXXXXXXXXXXXXXXXXXXXXXXXXXXXXXXXXXXXXXXXXXXX XXX XXXXXXXI XXXXXXXXXXXXXXXXXXXXXXXXXXXXXXXXXXXXXXXXXXXXX XXX XXXXXXXI XXXXXXXXXXXXXXXXXXXXXXXXXXXXXXXXXXXXXXXXXXXXX XXX XXXXXXXI XXXXXXXXXXXXXXXXXXXXXXXXXXXXXXXXXXXXXXXXXXXXX XXX XXXXXXXI +XXXXXXXXXXXXXXXXXXXXXXXXXXXXXXXXXXXXXXXXXXXXx XxX XXXXXXXI XXXXXXXXXXXXXXXXXXXXXXXXXXXXX XXXXXXXXXXXXXXX XXX XXXXXXXI XXXXXXXXXXXXXXXXXXXXXXXXXXXXX XXXXXXXXXXXXXXX XXX XXXXXXXI XXXXXXXXXXXXXXXXXXXXXXXXXXXXX XXXXXXXXXXXXXXX XXX XXXXXI XXXXXXXXXXXXXXXXXXXXXXXXXXXXX XXXXXXXXXXXXXXX XXX XXXXXXXXXXXXXXXXXXXXXXXXXXXXXXXXXX XXXXXXXXXXXXX XXX XXXXX0.8 +XXXXXXXXXXXXXXXXXXX;XXXXXXXXX XXXXXXXXxxxxX XXX XXXXX
]XXXXXXXXXXXXXXXXXXXXXXXXXXXXX XXXXXXXXXXX XXX XXXXXi XXXXXXXXXXXXXXXXXXXXX XXXXXXX XXXXXXXXXXX XXX XXXXXI XXXXXXXXXXXXXXXXXXXXX XXXXXXX XXXXXXXXXXX XXX XXXXXI XXXXXXXXXXXXXXXXXXX XXXXXXX XXXXXXX XXX XXX XXXXXIXXXXXXXXXXX XXXXXXX XXXXXXX XXXXX XXX XXX XXXXX
0.6 +XXXXXXXXXXX XXXXXXX XXXXXXX XXXXX XXX XXX XXXXXXXXXXXXXXXX XXXXXXX XXXXX XXXXX XXX XXX XXXXXXXXXXXXXX XXXXX XXXXX XXXXX XXX XXX XXX
]XXX XXXXXXX XXXXX XXX XXXXX XXX XXX XXXIXXX XXXXXXX XXXXX XXX XXX XXX XXX XXXIXXX XXXXXXX XXXXX XXX XXX XXX XXX
0. 4 + . XXXXXXX XXX XXX XXX xxxCI
st.
r
. XXXXX XXX
. XXXXX XXX
. XXX XXX
. xxx. xxx
OPri
L
}'I H CI HB
d¡Ì rLracrtinI ZL
n
ii,i.crr-t-o.IoslcbaL I ha sai dl
n
or¡xeerrrjiclq,:,esl)eeeí¡Lu Ibni
ai Idt.TL
ìn
TTTECLPh' HO
r, IIr_

14.20
Appendix X b. Single Linkage Cluster Analysis of 27 cultivars of B.napus and 2 of B, rapa based on peak areas of 10 peaks shown inAppendix Vll (a),
0.li +
l
] XXXXXXXXXXXXXXXXXXXXXXXXXXXXXXXXXXXXXXXXXXXXXXXXXXXXXXXXX] XXXXXXXXXXXXXXXXXXXXXXXXXXXXXXXXXXXXXXXXXXXXX XXX XXXXXXXI XXXXXXXXXXXXX)IXXXXXXXXXXXXXXXXXXXXXXXXXXXXXXX XXX XXXXX
0. ? +XXXXXXXXXXXXXXXXXXXXXXXXXXXXXXXXXXXXXXXXXXXXX XXx XxxXXI XXXXXXXXXXXXXXXXXXXXXXXXXXXXXXXXXXXXXXXXXXXXX XXX XXXXXIXXXXXXXXXXXXXXXXXXXXXXXXXXXXXXXXXXXXXXXXXXX XXX XXXXXIXXXXXXXXXXXXXXXXXXXXXXXXXXXXXXXXXXXXXXXXXXX XXX XXXXXIXXXXXXXXXXXXXXXXXXXXXXXXXXXXXXXXXXXXXXXXXXX XXX XXXXX0.6 +XXXXXXXXXXXXXXXXXXXXXXXXXXXXXXXXXXXXxXXXXXX XXx XXXXXIXXXXXXXXXXXXXXXXXXXXXXXXXXXXXXXXXXXXXXXXXXX XXX XXXXXIXXXXXXXXXXXXXXXXXXXXXXXXXXXXXXXXXXXXX XXX XXXXXXXXI XXXXXXXXXXXXXXXXXXXXXXXXXXXXXXXXX XXX XXX XXXXXXXXXXXXXXXXXXXXXXXXXXXXXXXXXX XXX XXX XXX0.5 +XXXXXXXXXXX XXXXXXXXXXXXXXXXX XXX XXX XXX
in
LI
l)ii
I XXXXXXXXXXX XXXXXXXXXXXXXXXXXI XXXXXXXXXXX XXXXXXXXXXXXXXXXXIXXXXXXXXXXX XXXXXXXXXXX XXXI. XXXXXXXXX XXX XXX XXX
0.4 +- XXXXXXX XXX XXXI. XXXXXXX XXX XXX. XXXXXXX XXX XXX. XXXXXXX XXX
]. XXXXXXX XXX
. XXX
. XXX. xxx
0.3 XXX XXX
t.Lt.
ÀoPRl,i
c¡ov!ls
n tnaL Lrill
sî T E
ì
LP
cc,efnidL
T ,ri.I c,
I
HCHBrI l uot i n
zLn
BL'
Ht)
olIr.le
1rt'

1.0 .2L
Appendix X c. Complete Linkage Cluster Analysis Analysis of 27cultivars ol B, napus and 2 of B, rapa based on peak areas of 10peaks shown in Appendix Vll (a)
M
axinì
u
] XXXXXXXXXXXXXXXXXXXXXXXXXXXXXXXXXXXXXXXXXXXXXXXXXXXXXXXXX2 +xXXXXXXXXxXXXXxXXXXXXXXXXXxXxXxXXXXXXXXXXXxXxXXxX XXXXXXx
1 XXXXXXXXXXXXXXXXXXXXXXXXXXXXXXXXXXXXXXXXXXXXXXXXX XXXXXXXI XXXXXXXXXXXXXXXXXXXXXXXXXXXXXXXXXXXXXXXXXXXXXXXXX XXXXXXXI XXXXXXXXXXXXXXXXXXXXXXXXXXXXXXXXXXXXXXXXXXXXXXXXX XXXXXXXI XXXXXXXXXXXXXXXXXXXXXXXXXXXXXXXXXXXXXXXXXXXXXXXXX XXXXXXXI XXXXXXXXXXXXXXXXXXXXXXXXXXXXXXXXXXXXXXXXXXXXXXXXX XXXXXXXI XXXXXXXXXXXXXXXXXXXXXXXXXXXXXXXXXXXXXXXXXXXXX XXX XXXXXXXI XXXXXXXXXXXXXXXXXXXXXXXXXXXXXXXXXXXXXXXXXXXXX XXX XXXXXXX
.I.5 +XXXXXXXXXXXXXXXXXXXXXXXXXXXXXXXXXXXXXXXXXXXXX XXX XXXXXxXXXXXXXXXXXXXXXXXXXXXXXXXXXX XXXXXXXXXXXXXXXXX XXX XXXXXXXXXXXXXXXXXXXXXXXXXXXXXXXXXX XXXXXXXXXXXXXXXXX XXX XXXXXXX
] XXXXXXXXXXXXXXXXXXXXXXXXXXX XXXXXXXXXXXXXXXXX XXX XXXXXXXI XXXXXXXXXXXXXXXXXXXXXXXXXXX XXXXXXXXXXXXXXXXX XXX XXXXXXXIXXXXXXXXXXXXXXXXXXXXXXXXXXX XXXXXXXXX XXXXXXX XXX XXXXXXXIXXXXXXXXXXXXXXXXXXXXXXXXXXX XXXXXXXXX XXXXXXX XXX XXXXXIXXXXXXXXXXXXXXXXXXXXXXXXXXX XXXXXXXXX XXXXXXX XXX XXXXX
1 +XXXXXXXXXXXXXXXXXXXXX XXXXX XXXXXxxXx XXXXXXX xxx XXXXXI XXXXXXXXXXXXXXXXXXXXX XXXXX XXXXXXX XXXXXXX XXX XXXXXI XXXXXXXXXXXXXXXXXXXXX XXXXX XXXXXXX XXXXXXX XXX XXXXXIXXXXXXXXXXX XXXXXXXXX XXXXX XXXXX XXXXXXX XXX XXXXX
B
L
cIus
I
IXXXXXXXXXXX XXXXXXX XXXXX XXXXX XXX XXX XXX XXXXXXXX XXXXXXX XXXXXXX XXXXX XXXXX XXX XXX XXX XXXXXXXX XXXXXXX XXXXXXX XXXXX XXXXX XXX XXX XXX XXXXXX XXXXXXX XXXXX XXXXX XXX XXX XXX XXX XXX
0.5 +XXX XXXXXXX XXXXX XXX XXX XXX XXX XXXIXXX XXXXXI. XXXXXl XXXt.I.t.L.
xxx xxx xxxXXX XXXXXX
TLIN
OPri.
L
14HCHB
d¡.i ruaoLins zL
n
;.1 ;c, I r.¡
u oÞcl)ahasdl-
T
I
TECLPI,]rx e e ¿' iiclgonbeeeffu.I bn i it rd t eea.I
d
H
v
I

14.22
Appendix Xl. Data matr¡x of RAPD data for 24 cultivars ol B. napus.Primer are ident¡fied with UBC (University of Br¡tish Columbia) codenumbers. Marker size is in kilobases.
CUfJTIVÀR
(Lìlirvars I 2
l,r'.imer l{ar ket'lUBl l l]ìizê
302 2.22.01.11.0a .'1
l0l
l2 9
1a
2.rl.gi.5.1.41.3I..t0.70.(;
'l¿(; 2.0r.1.1 .5r.00.80.6
1.61.3r.20.90.80.70.60.4
cultlvârs ISrêllar 1, l,Jestat 2, He¡,:, 3, RegenL 1, l)eÌLa 5, ExceÌ 6, Midas ?, TrisLa¡ g,Àrgenline 9, Brc¡norvski 10, ProfiL 1.1, SLa.I.lion 12, Horìzon I3, CrysLal 1¿,Leqend 15, Vanguàr'd 16, {.jlÒlraÌ I7, Tc)rìchdúkn 18, tiinfield t9, Bc,u;t.y 20,Hy,i.I,r 2I, Tútet 22, Osc,ìr- 23, Yickddee 24.
c r0 II 12tl 14 15 1ô 11 1A 192A21 2223 24
0l0
.L
1
010
l.I.l.t.1.1.0.0.
I.1.1.1.0.0.0.
00I100
0I0
00.L
000I0
00000011.1100000000lrl000
00000000.1 111lltl00000000.L.ll10000
001011000000.i10t

Append¡x Xll. Pairwise comparisons of Neis' similar¡ty indices (Nei and Li 1979) determined from
data matrix in Table 2. Cultivar ¡dentif¡cat¡on as for Table 2.
CULTIVAR
I21 0-0002 0.92 9 0,0r0,ì 0 - 352 0. 391
¿ 4.9I2 A.9¿95 0_ a9l 0- 900
4 t.69-l A.9617 0_909 0-94?I 0.â9t 0_911
9 A .9n9 A.91210 0.6,16 0. 315
1r 4.9t2 a.9Å912 C -931 A.)3313 0-3â3 0_490
1Ã A .949 0.91215 0.697 0-93316 0 - 3.i? 0. 931
I'7 D .9A9 0.9I216 0-663 0.86â19 0.769 0,8152A 4.35',7 0.A6227 0.352 0.9212)" A.iA9 0.91223 !.9A9 C.912
0.0000 _ 377 0. _¡00
0.662 0-913 0.0û00.6É2 t. 951 0. 903
0_ 371 0_ 697 C- 3â1
0.691 0,919 0.9 31
0,340 0. 397 0 _ 915
0-6.t"1 !1_âlÉ i.3570-8?7 i-933 C_916
0.362 i,951 4.9680,511 C. 520 C - 510
0.949 n _931 t.9¿9c_ 362 0.913 ¡.935a .aê,2 a .i13 i.9350.371 û_397.¡-9.1',0 - 321 0 - 652 11. 600
0-769 0.600:_7â60.493 0-ô1t c.900t.452 t.tt6 t.6i2
0- c000.915 0- 000
0. 900 0 - 877 0.000c- 481 0.929 0-9120. â21 0-?92 0.615!-951 0-397 C_i150.915 c-915 0.90¡¡.549 0.458 0-,1i00.331 0-693 0.9J?0-935 0-481 0.9670-935 0-881 0.9674.331 4.693 4.9120 - 33.4 0.865 0-ô104.736 L192 i .315
t.92,1 0. 903 4.339¡. i15 !. 857 a - 377
a- ô61 .J - 929 C, ât2t - 6¿? 0. â91 11. å07
0. 000
a .'7 t2 0.a000.897 0.373 0-0000-915 0-â57 0.9180.,t17 0_169 0.1600,393 0_310 0.86:0.915 0-736 0_ 918
0.915 0.?35 0- 916
0.691 0.330 0.6€20.403 0. 357 0.8150.?55 0.160 c_?6¡c.342 0- 315 0. 681
i.671 0-61t 0.936c-â57 0_630 0-9_ì1.
0.657 0.630 ¡. ô62
0- 000
0.510 0-0000 - 919 0.500 0. c000.903 0-510 0.915 0
0.903 0-510 0.9150- 949 0-500 0-96.j0. 316 0-455 0.8.1.6
0.786 0,489 0-830c.367 0.44 9 0- 6?7
0.892 0-481 0.819c.915 0-453 0.8570-115 0-15I 0-393c_3â1 û.458 0_857
.000
.00ô
. 915
.800
.661
.692
â47
61,1
0_000
0. 91s 0- 000
0- 800 0.816 0,0000-786 0.830 0-ô57 0-0000-367 0-8?7 0.?92 0_776 0-0000.892 0,839 0.828 0.814 0,657 0-0000-631 0.â57 A.169 A.1t-Ì 0.3C7 0_6?1 0.0001-6.tr 0.6rì 0.å85 0.?9j ).å?-- '-671 .-o-l t.t:!0.614 0,857 0.665 0.â3C 0-ô,.t2 i.6r1 1.1À6 A.i6à

L0 .24
Appendix Xlll. Ultra.violet scan ol DNA extracted 'trom B, napusas described (5.7),
0.1595ffi=z.ao+
ffi = o.szo
ffi=t.soz
-0.0081
Wavelength (nm)
Abs