MASTER OF ARTS - MSpace
185
ETHNIC IDENTITY RETENTION: A Cross Generational Analysis of Malayalees in Toronto by Leeno Luke Karumanchery A Thesis Submitted to the Faculty of Graduate Studies in Partial Fulfillment of the Requirements for the Degree of MASTER OF ARTS Department of Sociology University of Manitoba Winnipeg, Manitoba June, 1996
-
Upload
khangminh22 -
Category
Documents
-
view
2 -
download
0
Transcript of MASTER OF ARTS - MSpace

ETHNIC IDENTITY RETENTION:
A Cross Generational Analysis of Malayalees in Toronto
by
Leeno Luke Karumanchery
A Thesis
Submitted to the Faculty of Graduate Studies
in Partial Fulfillment of the Requirements
for the Degree of
MASTER OF ARTS
Department of Sociology
University of Manitoba
Winnipeg, Manitoba
June, 1996

The author has granted anirrevocable non-exclusive licenceallowing the National Library ofCanada to reproduce, loan,distribute or sell copies ofhis/her thesis by any means andin any form or format, makingthis thesis available to interestedpersons.
The author retains ownership ofthe copyright in his/her thesis.Neither the thesis nor substantialextracts from it may be printed orotherwise reproduced withouthis/her permission.
l*l NationalLibrary
Acquisitions andBibliographic Services Branch
395 Wellington StreetOttawa, OntarioK1A ON4
Bibliothèque nationaledu Canada
Direction des acquisitions etdes services bibliographiques
395, rue WellingtonOttawa (Ontario)K1A ON4
ISBN 0-612-t6175-7
L'auteur a accordé une licenceirrévocable et non exclus¡vepermettant à la Bibliothèquenationale du Canada dereproduire, prêter, distribuer ouvendre des copies de sa thèsede quelque manière et sousquelque forme que ce soit pourmettre des exemplaires de cettethèse à la disposition desperson nes intéressées.
L'auteur conserve la propriété dudroit d'auteur qu¡ protège sathèse. Ni la thèse ni des extraitssubstantiels de celle-ci nedoivent être imprimés ouautrement reproduits sans sonautorisation.
Your líle Volrc éférence
Ou lile Notre rélércnce
C"anadä

SUUECÍ IE¡.M
Nlorn€
DissÉtlolíon Ahslracls Inlema!îonol ond ¡Vosf¡¡rs Ahslræts Intemcl!íonol crre orrorçed by brood, çnerol s,bi"¿ coleqories.Pleose sele<r lhe one urb¡ect which n,osl neorly describes the content of your disseîofio; o. th"i¡i E;t";t#¿;-rËti;fourdigit code ¡n the spoces provided.
:: ¡JL I !^oGl : Elhlric z,.cl (iìCr,¡L : I p it=
SubieA CoÞgories
lHE HUIJTANTTIES AND SOCI,ÂI. SCIENCES
r4-rtill LndISUUECT CODE
(01.l1lnuNt(Ånofls ÁHD It{I ARßA¡chi¡ar¡¡e ...... ...............,........ O7nA¡l Hisþrv......- .,......................0577Gn¡no ........-........................... O9OODsrp ............-..-...................... 0378ñ¡e A¡t .........035/lnb¡r¡rotbn Scietre................... 0723Jovmolism ................................ O39tl¡trqtr S<tm .........................0399À{æ Co*mu¡ù:díorg............... 0708Mu¡k...,...-.--.......................... 0¿l 3Spe¡<+¡ Co¡mrúcotíon ............. 0459TÍr.dú..-.......-................-....... O¿ó5
Highr ..,.................................. 07¿5Hi3þr',ol ........0520tlome-Eçremb .....-... -...........-OÐ Ilndudrlol .........0521Longu€go onJ [¡tcoture .... ........O?gt'{<*úsrñcia ......................,...... OæOÀl$¡c ....................................... 0522Flr;lq+t¡v o1............................ 0998PhF¡cdl..:................................. OSæ
THE SCIENCES AND81otoctGt sctrHcsAa¡rtulþre-Gqldql .-...043
AgrÞrþfiy -......................... 0æ5Aìiimd Cíbure onJ
Þ),cþbs'/ .....0525¡€9q-€ ....-............................. 0535l(oargroüs ..._.-.0527Scieñce ...-.....O71¿S€r'¿cr ................................ 0533Socid Scíeirs ...............-.......053¿9æi+sy of ............................. o3¿oSp*r-ol ..................................-. 0529Tõrqdrç Troírúng ...............-.--. 053OIæt¡¡e'loc./ ..,,...................,..-... 071 OTe¡b a¡d,ç{æurm.ñb ............ O28aVocoti:rp1......... ..................,. -,O747I.ÂNGUÂGT, UITRATURT ÄHDUHGUI'ilGLoom
ëdÉrol ............ ..................0679An€'srf ............................... 0æ9!¡-læ:¡ irtic¡ ........................... 0290,¡\ ad.r?r ......,....................,.. 0291titæhn
Asion .................................. 0305Conod¡on {b¡clbh} ..............0352Condio (Fn¡ìc+rl..........-...0355EnE¡¡å ............................... 0593Gsmodc ...........................031 ¡!olin.Am*ico .................... 03I 2M¡¿dle Eocorn .................... 031 5Rorrrce ............................ 03l 3Sl#c od Ed Europeo¡r.....031d
ENGINEERINGc€de.y ...--.OS7Oç*hs/,........... .......................or72çæpt¡Þic¡............................... 0373l+/d;o¡Þg/ ................................ o3ssltu¡rp¡ogr/............................... O¿ì IFdlæboaqrÌy ............................. 03¿5Polææliy ............................ 0¿2ófoþrioþgy............................. 0¿l Irol€4orogy............................ 09U5¡'olyfìoþgy .....U27PhF¡td ö€srçlìy ..................0¡¿eP+¡F¡cd Oceã.Eigrp¡ìy............. O¿l 5
HTÂI,TH AND TIIVIROHÀîTIITAIsq$csEwi¡orynmld Scicrcs .......,.....07ó8FlælthScigts
PHII.OSOPHY, RTI,IGIOH ÁJIDIHt0t0cYÞþ€ptr......... .......................oÁnRC¿dd
ësrrol .............................. 03t gBÉlkd Sþdc .................... OS2l9.".gy ..r-.....--................. 031 9llrgoe/ qr _..,._.................... 03æ
_ tãrlë.phyor ......................0322lhæ¡ogy .....-..O¿ó9
socÂt sctH(sA¡nsicsr. Studs ...................... O3ZlA¡IfuÊoo¡od
Aråff9%sy ....................... O32lÇulturof ............. ............ -....0î26ttry!.<ot ..............................0327
Bui¡ffË,r A&nirúdrcr;onGeff¡l ..................,..._...... 03l oAccoonting .,........,.......-.-...OÐ 2EÕr¡ng .................... --. _...O77Ofáûtqgsr¡û|...............-......O¿S¡llvlck¡ä¡rg ........................_. 033{t
Cqrodor¡ Stùdc ...........--...-.O3SsEcorpaúc¡
Gsûd ..-.................._......oS01Agrier1rurol..........,.............. OSO3C.o¡rvnscrBu¡i¡rcss ............. 0505F¡¡æ¡r¡ ................,,............ 05OSlli¡bry -......................-....., OsOpgúor .......................-........ 05¡ 0
- . !hsry....-.......-..........-......osl Iro¡t(þft ......,..............__.-........ o35gçæ$phy.......................-...... 03óó
.......... -........... a35l
c;ånrd ..-..................-..... Og8
.._.0ó2ó-.ú?-.0q38-.oéÉil
....__.0ó28
...__.0óæ.-.0ó30
Hql Paåolo<rv ................... O¿80Pla,, PhF¡'oËéy .................. OSI zRmce Mff qqî ql ............0777
^.,Woõd Tr<Ànðogy ............... 07Åó
óffiGËû€l .............................. o3oóAnoonry ........-................--.O2f7B¡'rCdù¡i<s ""'..................-.03Ogþ,9"y -.............................. 03oe(¡at .........._._...................... 0fl9Ecobgy ..............................À?29Ènþmo¡ogy........................ 0353Gsetic¡ :.:.......................... O3ó9Unro.|ogr ........................... 0793Mcrobi.o¡ogy ...................-.0¿l 0iüo¡æulú .........-................ 0307Nq.rro:cicrr¡ ..,,....,..........-. 03t 7çke€lìpgrç¡ìy.................... O,{l óFh)Ero¡osy .......................... 04t3Rci{dioñ'............................ os2 IV¿,sr'notf Scjetlc t ......... -..... O77 I
^. pgr .... _..................._...oo 2
rcÞaTyatc¡'cáffid .....o7u¡/.dco¡ .....O7&
$RTH SOEII(E
Sp*lì PqÀobgy.............-. O.¿óO
.. ¡oF€oþgy-....................._...0383ItÞme Eqþrnrcs ........,......,...... 038ó
P|{YS!GI SotilcsÀ¡n Scie¡xsCfier¡stv
c-ì¿ql ....-......................... o¿85Asrí@lþral ........ ................. 07 19Año}ytics| ........................... O¿8óB¡rdraú¡¡ry ...........-.......... 0¿¿17l¡o€6ic ..:......................... O.dSSNu<Ld .............................. 0Z3Sqs€rú<...........-................. 0¡9oPf¡a¡moccudcol.....-............. O¿91phn¡.ot ....................-........ o¿9¡Polrffi ..-.......................... O¡9SRdi¡d;on ......-..........--.....- O75¿
Mdrsr¡dio .....................-.-...O/OsPhE¡õ'Get-ql .-.o@s
Gsì-ol ...........................-. 05óóAu¿;obo|, ............-..........-. 03OOClìcædfrÐr/ .....-.........,,.. 09F2Derrí¡try ....:.:...................... 05ó7Educotiån ........................-. 0350ljæcid r''tsro,q€first¡ ..........07 69Hurñcr Dq'ebãmd ........... O75Sl¡nmt¡lo¡ocy,..'..................... 0ç82À1¡Jcim Ëird Surqery ...-.....05óJl'1srd H.dA ....I...i......-...OZZ
PsY(Hq,OGYGqs€|........................-...---. oó21B'e¡ìêrþrs¡ ..-.........................-. 038¿O¡¡úcsj..............-................--. Oó22Dcr¡bp.Érol .......................... Oó2OÞpcnmrlol ..............,....._.._. 0ó23ln¿u{ri:l ..-.-.æ2ÁL¡rænoliv...........................--. Oó25rhr¡oþscd ........................._. 0ç89t¡ftfiÊb6bs¡,........................-. o3¡eFÐdÞrî*ìc¡ ..................._*_,0€2Sáio¡..................................--. o45i
Nude€r ....................--...... 0ól OOplic¡ ...........................--. 0752Roddbn .............-.....-...... oZ5óSo¡il Sld. ...........-...-........Oól ¡
Sldü¡ic¡ .....................;...-........ O{dtADС€d S<iemæ1€É'd ryd'cìlcl -..-.-..-...-. 03/óþ.rpulc S<¡erE --...----....., 0ç84
_ DwebpqtÕú .....:........-_. OTOO
_ thæ{f qnC rrt thod¡ __...__.03¡¡I rgtsporlolþa .............._.-...__.0709Urbqn arÈ Regixrol Plomiæ ._.0ç99Won¡cr'¡ $r¡dc ...............:.._.ó¿fi
Phn¡ìocy ..:-......
ö)?'cd thgraptPhdnrocy ...........,............-. 092Pfry¡¡col floroplr .................0382Pu6[c Heolth .].1................-. 093Rodobcy .......... ............-...0g IRescotñ;¡ .-.......-.... -........... Og 5
8¡)gædnnü$n/...................-.... O¿25<;æarcri*ry .--.........-..-._.-.--099ó
Nuni¡¡q ....................-.....-. 05ó9Nutritii¡ ............................. O9O

THE UNIVERSITY OF MT{.NITOBA
FACULTY OF GRá.DUATE STUDIES
COPYRIGHT PERIVtrSSION
ETENIC IDENTITY RETENTION:
A CROSS GENER.ATIONAI ANALYSIS OF MALAYÂLEES IN TORONTO
BY
LEENO TTTKE KARI]HANCEERY
A ThesisÆracticum submitted to the Facutty of Graduate Studies of the Universir-v- of ùIanitoba in partialfulfillment of the requirements for the degree of
UASTER OF ARTS
Leeno tuke Karumanchery @ 1996
Permission has beeu granted to the LIBRARY oF THE UNIVERSITY oF llfANIToBA to tend or seu copiesof this thesis/practicum, to the N.LTIoN.{L LIBRARY oF cÀ\AD.{ to microfilm this thesis/practicum and
to lend or sell copies of the film, and to UNI\TERSITY NIICROFILùÍS INC. to publish an abstract of thisthesis/p racticurn..
This reproduction orcopv of this thesis has been made available by authority of the copvright orvnersolelr.for the purpose of private study and reseârch, and may only be reproduced ana copieå as permitted bv
copyright laws or with express written authorization from the copyrigtrt oryner.
I
ABSTRACT
The realities of generational decline in ethnicity, contradict the cunent
Canadian notions of nearly automatic immigrant success in ethnic identity
maintenance. In discussing sociocultural scenarios in Multicultural Canad4 the
identity of future post-1965 immigrant generations remain uncertain at best. In this
Toronto study of the Malayalee ethnic group, the impact of immigration on ethnic
identity maintenance was explored, and generational patterns of ethnic identity varied
markedly. Two main aspects of identity were looked at in this research. The
subjective aspects of ethnicity in relation to Malayalee feelings and attitudes, and
objective ethnic identity with respect to Malayalee behaviour were examined.
A cross generational analysis indicated that fîrst generation Malayalees display
consistently higher levels of both subjective and objective ethnic identity than their
children. Similar disparities were found to exist with respect to religious affiliation.
Marthomites tend to score higher on ethnic identity than do Roman Catholic
Malayalees' Neither gender nor duration of stay, were deciding factors in maintenance
of ethnic identity, however, they should not be discounted in future research.
Overall, second generation Malayalees do tend to display lower levels of both
subjective and objective ethnic identity than their parents, and these patterns of identity
decline cannot be overlooked. It is clear that as the second generation moves away
from their traditional Malayalee culture and heritage, future generations will
increasingly develop their sense of Nomos and community, from outgroup Canadian

ii
culture and institutions. Further research is needed in order to more fully explore the
influence of assimilation a¡rd sociocultural change on ethnic identity. A larger sample
size, and a more inclusive study, will allow for a clea¡er understa¡rding of Malayalee
identity, and generational shift in Canada.

iii
ACKNOWLEDGMENTS
I extend my most sincere gratitude to everyone that assisted in the successfulcompletion of this study. To my family and friends at home who endured two years ofneglect, and to my Winnipeg family, particularly Wendy, Jen and John, thank you forhelping me remember why I was there, in those moments when I wanted to forget.
To my thesis advisor Dr. Leo Driedger, thanks for the time, patience andguidance you devoted to this research. Without your advice a¡rd constantencouragement, this work could not have reached fruition. You have been a truementor, and over the past two years, you have helped me take some important stepstowards mastering the keyboard.
For your valuable suggestions a¡rd statistical expertise, thank you Dr. ShivaHalli. Without your input and guidance, I would still be using Pearson R coefficientsto examine non-interval variables. Also, I would like to thank Dr. Dan Chekki foryour assistance and helpful suggestions.
I would like to extend a special thank you to Heather Tredree, for yourencouragement, support, forbearance and love...I went towards scltool witlt heavyloolrs, and relurn as a schoolboyfrom my books.
This work is dedicated to the two guiding influences of my life. To myfather, whose passion for education and discovery gave me a desire to learn aboutthe world, and to my mother, whose boundless love and conviction gives me thestrength to reach for that goal.

lv
TABLE OF CONTENTS
ACKNOWLEDGMENTS .........
LIST OF TABLES
LIST OF FIGURES .............
CHAPTER ONE
INTRODUCTION
Statement of the Problem ....
THEORETICAL FRAME AND OzuENTATION
The Conceptual Frame .....
Theories of Ethnic Change and Persistence
A Conformity-Pluralist Model
Riesman's Ideal Ethnic Types
The Tradition-Directed Ethnic
The Inner-Directed Ethnic
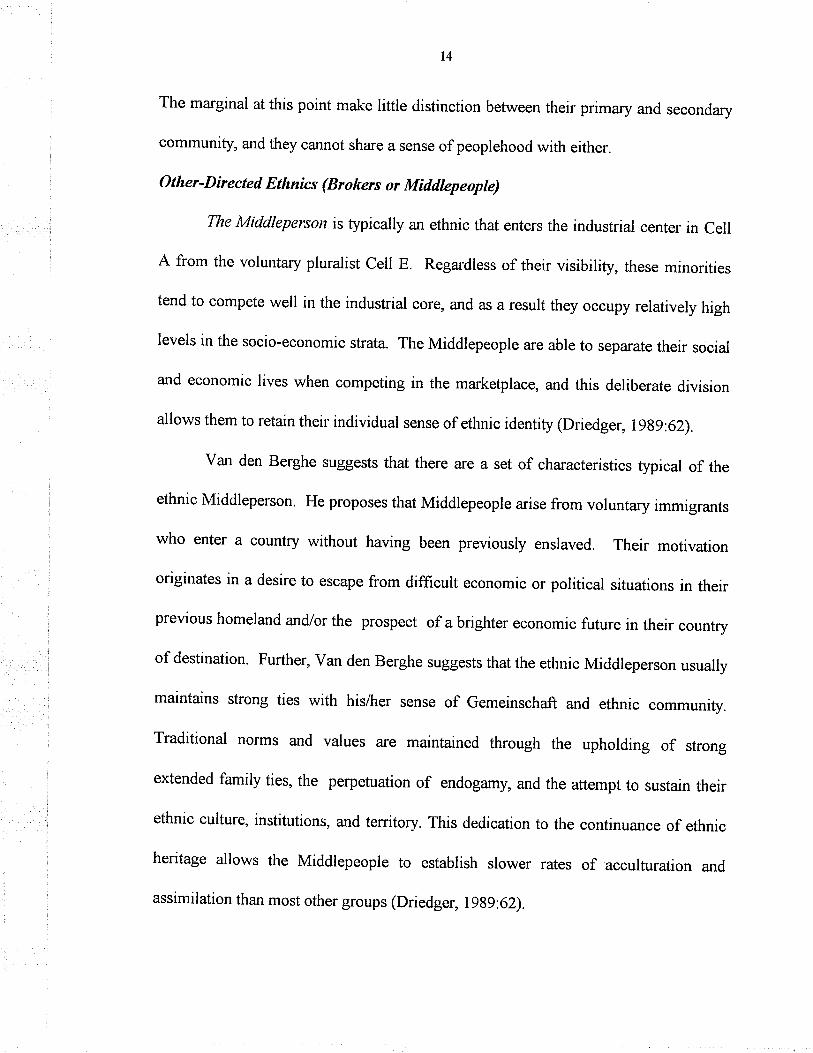
Other-Directed Ethnics (Brokers and Middlepeople)
Dashefsþ's Theoretical Orientation
The Sociocultural Framework
The Interactionist Framework
CHAPTER TWO
LITERATURE REVIEW
Ethnic Identity
Factors of Ethnic Identification
Identification with Tenitory
Institutional Identifi cation
Cultural Identification ....
Identification with Historical Symbols
Page
i
iii
vii
ix
I
I
J
3
3
6
10
t0
l2
t4
16
I7
2l
23
23
29
30
3l
JJ
JJ
34Charismatic Leadership and Identifi cation

Identifi cation with ldeology
Identity Maintenance and the Sacred Canopy
35
36
39
39
45
45
46
46
47
48
5l
5t
53
59
59
60
60
62
62
65
68
69
69
70
7t
CHAPTER THREE
THE MALAYALEE GROUP .
The History of Christianity in India
The Mar Thoma Church
The Roman Catholic Church in India
The Syro-Malabar Rite
The Syro-Malankara Rite
Immigration
The Malayalee Sacred Canopy
The Roman Catholic Canopy
The Mar Thoma Canopy
CHAPTER FOUR
RESEARCH METHODOLOGY
Dependent Variables
Sample........
Population
Instrument
Hypotheses
Subjective Ethnic ldentity
Objective Ethnic Identity
Independent Variables
Statistical Techniques
Test of Proportions
ANOVA and MCA
CHAPTER FIVE
ANALYSIS OF DATA 73

vl
Independent Variables and Factors of Identity
Religious Affirliation
Subjective Identity Factors
Objective Identity Factors
Interpretations
73
77
77
82
9t
92
92
95
97
Gender
Subj ective Identity Factors
Obj ective Identity Factors
lnterpretations
Generation
Subjective ldentity Factors
103
103
113
124
t26
Objective Identity Factors
Interpretations .................
Duration of Stay
120
t22
122
129
r29
132
137
138
140
144
S ubj ective Identity Factors
Objective Identity Factors
Interpretations
CHAPTER SIX
Summary ........
SUMMARY AND CONCLUSIONS
Conclusions
Suggestions for Future Research
Policy Implications
BIBLIOGRAPHY
APPENDIX A
APPENDIX C
APPENDIX D
149
159
166

TABLE 3.I
TABLE 3,2
TABLE 3.3
TABLE 5.I
TABLE 5.2
TABLE 5.3
TABLE 5.4
TABLE 5.5
TABLE 5.6
TABLE 5.7
TABLE 5.8
TABLE 5.9
TABLE 5.IO
TABLE 5.II
TABLE 5.12
TABLE 5.13
vll
LIST OF'TABLES
Page
The Major Religions of lndia 44
Christians in India ... 44
Christians in Kerala ................... 44
Independent Variables by Ethnic Identity Factors 74
The Association Between Religious Affiliationand Subjective Ethnic Identity 76
The Association Between Religious Affiliation andSubjective Ethnic Identity when controlring for Generation 7g
The Association Between Religious Affiliation andSubjective Ethnic Identity When Controlling for Gender .. . g0
The Association Between Religious Affiliation andObjective Ethnic ldentity E3
The Association Between Religious Affiliation andObjective Ethnic ldentity When Controlling for Generation ................ g6
The Association Between Religious Affiliation andObjective Ethnic Identþ When Controlling for Gender 89
The Association Between Gender and SubjectiveEthnic Identiry 94
The Association Behveen Gender and SubjectiveEthnic ldentity When Controlling for Religious Affiliation 96
The Association Between Gender and SubjectiveEthnic Identity When Controlling for Generation ............................... 96
The Association Between Gender and ObjectiveEthnic ldentity gg
The Association Between Gender and ObjectiveEthnic Identity When Controlling for Generation............... l0l
The Association Between Gender and ObjectiveEthnic ldentity When Controlling for Religious Affiliation l0Z

vlll
TABLE 5.14
TABLE 5.15
TABLE 5.16
TABLE 5.17
TABLE 5.18
TABLE 5.I9
TABLE 5.20
TABLE 5.2I
TABLE 5,22
TABLE 5.23
The Association Between Generation and SubjectiveEthnic Identity
The Association Between Generation and SubjectiveEthnic Identity When Controlling for Religious Affiliation
The Association Between Generation and Subjective
The Association Between Generation and ObjectiveEthnic Identity When Controlling for Gender
The Association Between Duration of Stay and SubjectiveEthnic Identity
t03
r07
ll0Ethnic Identity When Controlling for Gender
The Association Between Generation and ObjectiveEthnic Identity
The Association Between Generation and ObjectiveEthnic Identity When Controlling for Religious Affrliation
rt2
ll5
118
12t
t23
t2s
127
The Association Between Duration of Stay andEthnic ldentity When Controlling for Generation
Subjective
The Association Between Duration of Stay and ObjectiveEthnic ldentity
The Association Between Duration of Stay and ObjectiveEthnic Identity When Controlling for Generation .............

lx
LIST OF F'IGURES
Page
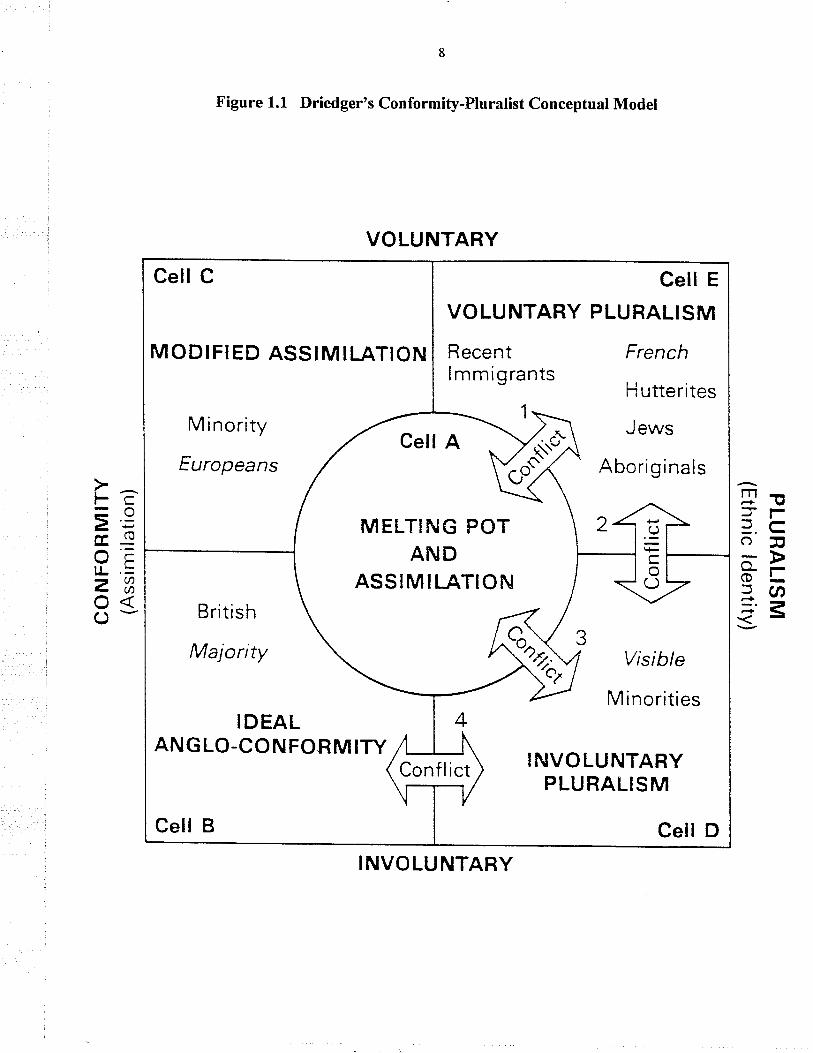
FIGURE 1.1 Driedger's conformity-plurarist conceptual Model g
FIGURE 1.2 Dashefsþ's Theoretical orientation in the socialPsychology of Ethnicity 16
FIGURE 3.1 chronological History of christianity in India 43

CIIAPTER I
TNTRODUCTION
Statement of the Problem
The purpose of this study is to examine the ethnic identity retention of a visible
minority group in Toronto. This research will provide a context for understanding the
role of 'race' in ethnic identity retention among visible minorities, and specifically
among South Asians. My focus will be the Malayalee community in Toronto, how
they perceive themselves as members of the South Asian diaspor4 and how their
ethnic identity changes from generation to generation.
In examining ethnic identity retention patterns among Malayalee Canadians I
will: a) measure the degree of positive ethnic identity ma¡rifested in both objective and
subjective terms, b) determine the associations and relationships between religious
affiliation, gender, generation, and duration of stay in Ca¡rada with respect to
Malayalee identity retention, and c) address Malayalee behavior and attitudes with
reference to their ethnic group, and compare the consistency between the objective and
subjective aspects of Malayalee identity.
Previous research suggests that positive subjective ethnic identity will greatly
contribute to the maintena¡rce of ingroup loyalty and cohesion (Borhek, IgTl; Barth,
1969; Gans, 1979; Isajiw, 1974; Mccall, and simmons, 196g; Mackie and
Brinkerhoff, 1984). However, a review of the literature indicates that other

2
sociological and psychological factors are also associated with ethnic identity
retention. These factors play an integral part in the maintenance of ethnic group
boundaries (Driedger, 1987,1989; Edwards and Dourcette, l9g7; Gans, lg7g, 1994;
Isajiw, 1974, 1990; Nahirney and Fishman, 1965). The question that arises then is
whether subjective ethnic identity retention alone is a suffrcient condition for the
continuance of ethnic group solidarity, or whether objective ethnic identity retention is
necessary for the perpetuation of ethnic group cohesion. This issue is of particular
importance with reference to second generation Malayalees in Canada as their levels
of objective ethnic identity decline.
The association between overt behavior and subjective attitudes is of
paramount importance. Religious affrliation, gender, generation, and duration of stay
in Canada are the four independent va¡iables used in this study. Indicators of the
dependent va¡iable (ethnic identity retention) are measured to describe the degree of
consistency between both its subjective and objective aspects. This study attempts to
determine some of the possible types of ethnic identity patterns that emerge among
second generation Malayalees, and consequently, whether those patterns will lead to
continued solidarity among Malayalee-Canadians or whether this community is
destined to disperse and lose cohesion in the generations to come.

J
THEORETICAL F'RAME AND ORIENTATION
The Conceptual Frame
Various theories have been developed to analyze and explain processes of
ethnic change and persistence. The six main theories are presented by Driedger
(1989) as: 1) assimilation,2) arnalgamation, 3) modified assimilation, 4) modified
pluralism, 5) pluralism and 6) ethnic conflict.
Tlteories of Ethnic Change and persistence
Each theory presents a useful perspective to the analysis of ethnic identity and
change. The assimilationist model advocated by Robert Park is interested in the
pervasive forces of industrialization. This model assumes that all ethnic groups will
assimilate to the dominant culture (via conflict and competition, or by way of
accommodation). However, it overlooks un-meltable immigrants (ie. Asians,
Africans, South-Asia¡rs, etc.) who can not follow the same routes towards fusion as
European immigrants. As a deterministic macro theory, the assimilationist model can
explain some of the general facets of ethnic modification and shift experienced by
certain groups, but it fails to consider many other dimensions of cultural and ethnic
change (Driedger, I 989:38).
Amalgamation is the second theoretical approach to the study of ethnic identity
loss' In Canad4 the British represent the largest group and so amalgamation in the
Canadian context refers to Anglo-conformity. Like assimilationist theory, this
approach tends to be deterministic. It assumes that the temptation to join the majority

4
group will be too much for a minority group to resist, and that eventually, minorities
will disappear into the majority. Similar to assimilationist theory, this approach tends
to ignore issues of race and ethnic diversity. In contrast, the approaches taken by
Gordon and GlazerilMoynihan take these issues of ethnic variation into consideration.
Gordon approached the study of ethnic adjustment with the understanding that
assimilation could not be looked at as a single social process. He saw assimilation as a
number of sub-processes classified as the cultural and structural variables of
assimilation: cultural, structural, marital, identificational, attitudinal, behavioural, and
civic (Driedger, 1989:42). Each of these sub-processes reflect a particular stage in the
assimilation process. Unlike the aforementioned theoretical approaches, Gordon,s
modified-assimilation process views ethnicity in multi-leveled terms. Ethnicity to
Gordon is dependent upon the various factors that influence change or adaptation
within the individual and his/her ethnic group (Gordon, 1970:64). However, the
modified approach to assimilation, while complex and multidimensional, is still
oriented towards assimi I ation and amalgamation.
Glazer and Moynihan, in their study of New York ethnic adjustment patterns,
determined that some ethnic groups (ie. Jews, Blacks), depended upon religion,
historical origins and cultural pattems to retain their ethnic identities. This theory of
modified-pluralism, takes into account processes of change and assimilation while at
the same time allowing for degrees of pluralism (Driedger, 1989:44). They contend
that while an ethnic group might assimilate in several objective aspects of their
ethnicity, subjective aspects of their identity could still be nurtured for generations. In

5
this respect, given the right circumstances, the modified-pluralist model leaves open
the possibility of ethnic identity retention in some new forms of ethnic identity. The
ethnic mosaic theory goes a step beyond Glazer and Moynihan's model in that an
alternative to assimilation and ethnic change is possible in ethnic solidarity.
Advocates of the multicultural pluralist model would suggest that there a¡e
alternatives to losing identity within the larger core group of a society. particularly in
Canada where a federal policy of multiculturalism has been adopted, many groups
have the resources necessary to retain their ethnic identities, cultures and sense of
ethnic Gemeinschaft. As noted by Driedger (1989), multicultural pluralism tends to
focus on the idea that within a democratic and free society, all people should have the
freedom to choose a distinct quality of life (Driedger, 1989:47). This model comes into
conflict with assimilationist models that assume ethnic minorities must be neatly
tucked into a version of majority conformity.
Conflict theorists also disagree with the idea that conflict is a temporary
phenomenon that exists in-between contact and fusion. Conflict theorists tend to
accentuate the importance of individuality and ethnic persistence. Various conflict
theorists will posit the significance of class struggles and racial stratification as fueling
factors behind such social conflict, so the end result may be resistance to change and a
retention of ethnic pride and heritage. Examples of such communities c¿ur be drawn
from North American native communities, and smaller groups like the Amish
Hutterites in Canad4 but the great majority of Canadian ethnic groups cannot be
or
fit

6
into this narrow mold. Like the assimilation model on the opposite end of this linea¡
spectrum, such ideal models are rare in reality.
A Conformitv - Pluralist Model
With reference to these six theories, my task is to determine which model
best suits the Malayalee community's present and future situations. To this end, I will
be using Driedger's Conformity-Pluralist model to develop my conceptual frame My
brief summary of the linea¡ model shows that we need multi-dimensional approaches
to social research. The conformity-pluralist model is multi-dimensional and will aid in
understanding how and where the Malayalee community fits into the Canadian mosaic.
Figure l.l illustrates that as visible minorities, members of the Malayalee community
in Canada fit into either Cell D or Cell E. Placement of the Malayalee community
within these two cells will be justified as I briefly re-introduce the six theories of
ethnic change and persistence with reference to the Driedger model.
Wsevolod Isajiw suggested that the center of Canadian society was a
marketplace where all groups had to come together and meet in order to make a living.
This marketplace is represented in Cell A, the melting pot where the pervasive
influence of industrialization brings all groups together in order to compete in the
economic arena (Driedger, I 989:50-52).
Cell B symbolizes the largest a¡rd most powerful group's influence over the
whole. In Canada" this cell refers to Anglo-conformity, and like all ethnic groups, the
dominant majority will seek to preserve and perpetuate its own culture, traditions,
language and institutions etc. (Driedger, 1989:53). This cell seeks to influence all the

7
of the others, including Cell A. With the power that accompanies majority status the
majority group in Cell B are often able to force conformity on minorities. It
is important to note that this forced conformity does not come by way of 'overt'
repression or subjugation, rather, the movement of minorities towards Anglo-
Conformity arises through the influence of Canada's ideological and cultural
institutions. 'If you can change the way people think, coercion becomes unnecessary.,
Cell C houses the older more northerly European groups. These are groups that
tend to have lived in Canada for several generations. With reference to Gordon's
seven indicators of assimilation, members of these groups tend to lose many of their
structural and cultural group characteristics. As Caucasians adopting the English
language, they voluntarily conform to the assimilationist goal in Cell A and take pa¡k's
path of least resistance. Their similarities to the British majority allow them a great
deal of access to, and success in the industrial cell.
Cell D is an intermediary process where individuals and groups remain
pluralist involuntarily due to race. This cell has the greatest potential for conflict as its
members are stuck befween wanting to retain ethnicity and culture and wanting to
compete in the economic fray in Cell A. Quite often, visible minorities in Cell D
(particularly second generation) will conform in all facets of Gordonrs structural and
cultural indicators to fînd that they are still marginalized and unable to freely enter and
compete in Cell A. Cell E represents ideal pluralism where groups seek to retain their
ethnic heritage without amalgamating into the larger whole. These are traditionalists
in many ways, they insist on opting against Anglo-conformity and seek to remain
8
Figure 1.1. Driedger's Conformity-Pluralist Conceptual Model
gtc)Ð-Þol-lcn=e
FEÞ';t¡OFtr .=z8oO.-
MODIFIED ASSIMILATION
M inority
Europeans
VOLUNTARY
Recentlmmigrants
Cell E
PLURALISM
French
H utterites
J ews
Aborig ina ls
Cell A
MELTING POTAND
ASSIMII..ATION
.9EoO
British
Majority
IDEALANGLO.CONFORMITY
Visible
M inorities
INVOLUNTARYPLURALISM
Conf lict
VOLUNTARY
INVO LU NTARY

9
distinct and separate from the majority group. Recent Malayalee immigrants would
most likely fit into the Cell E category (Driedger,l989:54-57). Interestingly, Driedger
has placed Cell E (Voluntary Pluralism) beside Cell C (Modified Assimilation)
anticipating the possibility of movement from cell E to cell c.
There is often severe conflict between Cells E and A as children are assimilated
and acculturated toward the mainstream. As generations remain in Canada for many
ethnic groups the shift towards amalgamation is almost inevitable. For visible
minority groups in Cell E, the shift to Cell C is not so simple. However, while racial
features may block the passage of most visible minorities to Cell C, this factor may be
less of a barrier to Malayalee assimilation tha¡r it is to the assimilation of other visible
ethnic groups.
The essential difference between South Asians and most other visible minority
groups is the traditional categorization of South Asians within the Caucasoid Racial
group. Understandably, Hooton's three racial subgroups, (Caucasoid, Mongaloid,
and Negroid), are used less often as racial lines are crossed more and more (Driedger,
1989'.297). However, as skin colour remains the single most prominent difference
between South Asian and White Canadians (facial features are simila¡), a shift to Cell
C and modified assimilation for future Malayalee-Canadians may not be arrested ifexogamy between the two groups becomes a norm. For this reason, if endogamy and
other identity variables are not stressed within the Malayalee community, future
generations (if intermarriage between Anglo-Canadian and Malayalee becomes a

l0
norm), will find themselves either marginalized without an ethnic group or they will
ease increasingly into Cell C a¡rd modified assimilation.
Riesman's Ideal Ethnic Tvpes
David Riesman developed three ideal ethnic types that could be seen to
function in and throughout cells A, D, and E: 1) tradition-directed ethnics, 2) inner-
directed ethnics (the margirn[), and 3) those that are other-directed (Brokers or
Middlepeople). Each ideal type can be used to characterize ethnic groups in general,
but perhaps their most useful application can be found in an analysis of the va¡iations
and contrasting types within individual ethnic groups. Similar to the cells in
Driedger's conformity pluralist model, these types are not static, rather, ethnics have
been noted to evolve and move throughout the types. These images are to be used as
prototypes and ideal models of ethnicity. The degree to which they are reflected in a
society will vary dependent on each specific individual or group, but the variations will
tend to be grounded in one or more of these three fundamental themes.
The Traditio n-D irected Ethníc
The tradition-directed ethnic represents the great majority of those who
immigrate from nations with limited levels of industrialization as well as rural people
from industrialized countries. They derive their historical understandings of
peoplehood and sense of we-ness from their ethnicity and heritage. The tradition-
directed ethnic or group tends to be a relatively static type of social order whose people

ll
are disposed towa¡ds existing social relations that are for
culture, custom and caste (Driedger, l9g9:59).
them, dictated by matters of
For the tradition-directed ethnic, a dichotomy is drawn between their sense of
ethnicity and the larger society. Ferdinand Tonnies' distinction between Gemeinschaft
(primary community) and Gesellschaft (association or secondary community) cla¡ifies
the importance of peoplehood and the significance of community in relation to
feelings of belonging. Therefore, we pose the question: within what domain or
gatev'ay of existence do people declare their nomos (an ordering of experience into a
meaningful order)?
Is human nature divided into the primordial and the epiphenomenal, and if so,what role is played by history in the formation of human nature?...The primaryor the primordial would seem to signifu a connection or a relationship that is atonce more real, more valuable, more lasting (if not permanent) than thesecondary, which somehow connotes a "fallenness" into artificiality,inauthenticity, and the transience of historical duration. (Radhak¡ishnan, t 99 l :3)
The concept of Gemeinschaft, as naturally occurring human collectivity, seems to
authenticate ethnicity and ethnic heritage in terms of the primordial. As noted by
Radhakrishnan, the permanence of ethnicity is not in question, rather, its value and
fundamental connection between self and community is what binds the tradition-
directed ethnic to their heritage.
Forces of industrialization and socialization may exert pressures upon the
tradition-directed ethnic. As they become conscious of their traditional state amidst
other non-traditional forms of existence, a great deal of inner turmoil and self-
evaluation may develop. Howeveç ethnic tradition and dedication to ethnicity is of

t2
primary importance to the tradition-directed ethnic. While out-group influence is
rarely avoidable, this type of social order is often reluctant to change, and is most
commonly found in the pluralist Cell E of Driedger's Conformity Pluralist Model
(Driedger, I 989:59-60).
The Inner-Dírected Ethnic : The marginal
Cell D of the Conformity-Pluralist model houses many ethnics whose
characteristics a¡e consistent with those of the inner-directed ethnic type. Many of
these people are typical of what Park defined as the mørginal man. In this social
order we find individuals that a¡e in a relatively constant state of crisis and self-
examination, further, this marginality tends to become a permanent personality
characteristic (Driedger, I 989:6 I ).
It is suggested that the ntarginal person is a racial hybrid, (ordinarily a person
of mixed blood, similar to the Mulatto in the United States), whose marginality
originates in his/her biological existence between two worlds. However, marginality is
not unique to those of mixed racial heritage. The marginal canbe understood as both
a racial and cultural hybrid. They live between worlds, as they aspire to, but are
excluded from full membership within the desired societies.
It is in the mind of the nnrginal man that the turmoil which new culturalcontacts occasion, manifests itself in the most obvious forms. It is in the mindof the nmrginal man - where the changes and fusions of culture are going on -that we can best study the processes of civilization and of progress.
(Park, 1950:356).
Race plays an important role in the marginalization of ethnic and racial
minorities in Canada. Traditionally, many racial minorities are consigned to the

13
periphery of industrial power and opportunities. Due to their visibility, many of these
minorities find it difficult to compete for jobs within Cell A, and as a result, they are
noted to occupy the lower levels of the socio-economic order. For many minorities,
socialization and assimilation towards Anglo-conformity appears to be a realistic route
through which socio-economic acceptance and status may be attained. However, the
dynamics that exist within Cell D only serve to support marginalization as their
visibility continues to act as a barrier to full participation and acceptance in society.
Park notes that in many circumstances, marginality can be traced to
immigration and the cultural upheavals that occur when home ties, traditional rural
values and norms are broken. He further postulates that industrialization, and the
urbanization of ethnics often cause schisms between old kinship groups, schisms that
replace social relations of culture and custom with social organizations based on
rational interests (Driedger, 1939:61). Once the dichotomy between their sense of
ethnicity and the larger society is severed, the individual may consequently lose their
sense of nomos. It is from this inability to find order and stability that the marginal
become caught between worlds.
These marginalized people of the socio-economic periphery, struggle to
succeed in what is a veritable catch-Z2 situation. In order to gain acceptance in the
marketplace (Cell A), they adapt to mainstream culture and unravel the ties with their
ethnic heritage. However, the industrial center is only partially open to them, and by
virtue of their visibility, they are consigned to predetermined levels of social access.
t4
The marginal at this point make little distinction between their primary and secondary
community, and they cannot sha¡e a sense of peoplehood with either.
O t h er- D ir ec ted E th nics ( B r o ker s o r M id dlep e op le)
The Middleperson is typically an ethnic that enters the industrial center in Cell
A from the voluntary pluralist Cell E. Regardless of their visibility, these minorities
tend to compete well in the industrial core, and as a result they occupy relatively high
levels in the socio-economic strata. The Middlepeople are able to separate their social
and economic lives when competing in the marketplace, and this deliberate division
allows them to retain their individual sense of ethnic identity (Driedger, 19g9:62).
Van den Berghe suggests that there are a set of characteristics typical of the
ethnic Middleperson. He proposes that Middlepeople arise from voluntary immigrants
who enter a country without having been previously enslaved. Their motivation
originates in a desire to escape from diffrcult economic or political situations in their
previous homeland and/or the prospect of a brighter economic future in their country
of destination. Further, Vatr den Berghe suggests that the ethnic Middleperson usually
maintains strong ties with hisiher sense of Gemeinschaft and ethnic community.
Traditional norms and values are maintained through the upholding of strong
extended family ties, the perpetuation of endogamy, and the attempt to sustain their
ethnic culture, institutions, and territory. This dedication to the continuance of ethnic
heritage allows the Middlepeople to establish slower rates of acculturation and
assimilation tha¡r most other groups (Driedger, 19g9:62).

l5
Van den Berghe classified the Middlepeople as an urban petty bourgeoisie
social class, far from wealthy, but of a higher socio-economic status than the majority
of the population' While they are often recognizable by their distinctive religions or
visibility, these ethnics manage to succeed economically where marginalized ethnics
fail' The socio-economic success of this group may reside not only in their drive for
economic success, but in their ability to function well in both primary (ingroup), and
secondary (out-group) communities.
The unity of nearness and remoteness involved in every human relation isorganized, in the phenomenon of the stranger, in a way which may be mostbriefly formulated by saying that in the relationship to him, distance means thathe, who is close by, is far, and strangeness means that he, who also is far, isactually near. (Simmel, I 950:402).
Simmel's Slranger is a concept similar to that of the Middleperson in that
he/she is able to exist a¡rd function effectively between worlds. The Stranger, or
Middleperson, gains stability by retaining a grounding and identification with ethnicity.
Simmel feels that this type of ethnic could maintain a separate identity by retaining
ethnic values and norms even while physically performing economic functions within
the out-group's industrial sphere. The Middleperson is socially and psychologically
motivated by the norms and networks of hisiher reference group, and it is this
connection that affords this ethnic type such a strong sense of nomos.
With Driedger's Conformity-Pluralist model in mind, this study will seek to
determine which ethnic type and Cell best reflects the future of Malayalee-Canadian
ethnic identity in the greater Toronto area. Malayalee immigrants with short durations
of stay will almost certainly fit into Cell E as voluntarily pluralist and traditional-

l6
directed ethnics. However, first generation Malayalees living in Canada for extended
periods will likely find themselves in Cell E as the typical example of the Ethnic
Middleperson, or they may exist in Cell D as the Marginalized. Second generation
Malayalee-Ca¡radians presently exist in a grey area where their level and type of
ethnicity is uncertain at best. Are second generation Malayalee-Canadians voluntarily
pluralist, do they tend to be marginalized and torn between Canadian culture and their
ethnic heritage, or are they an ethnic group whose unique characteristics have yet to be
classified? Since levels of ethnic identity, and the va¡ious forms of ethnicity, are
invariably linked to both macro and micro sociological influences, both ontologies
will be employed in researching the reality of second generation ethnicity.
Dashefsky's Theoretical Orientation
Dashefsþ outlines several theoretical frameworks that may be used to
operationalize and conceptualize the study of ethnicity and ethnic identity. Due to the
Methodology
Ontology Macro-
Micro-
I
Sociology
Sociocultural
Interactionist
I
Psychology
Group DynamicistPsychoanalyticBehaviorist
Figure 1.2 Dashefsky's Theoretical Orientation in the Social Psychology of Ethnicity
t7
emergence of these frameworks from sociology and psychology, they are classified
along two axes, their ontology (theory of rearity), and their methodology.
Ontologically, the emphases of the theoretical orientations are placed on
whether individual behavior is best understood in its relation to the larger society
(macro) or apart from it (micro) (Driedger, 1987:173). The methodological a:<is is
derived from the framework's reliance on sociological or psychological methods.
For the purpose of this study we rely on sociological survey research
methodology, and so the two ontological approaches within the psychological
framework will not be used. However, both the micro and macro sociological
ontologies will be used to develop my theoretical framework. Either approach used
individually would leave gaps of understanding in an analysis of the Malayalee-
Canadian community, therefore this research will incorporate components of both
designs.
The Sociocultural Framework
The sociocultural (macro) framework conceptualizes the world in terms of
social and cultural systems. The major assumptions within this frame are twofold.
First' it assumes that an individual's behavior occurs within the context of the larger
society's on-going social and cultural systems. Secondly, it presumes that social
systems define associations between individuals, and that cultural systems define the
mutual expectations that people share (Driedger, 1987:I74). Concepts of social and
cultural boundaries are often intertwined, but they are in many ways distinct, and these
differences should be noted.

18
In looking at cultural systems, it should be apparent that our everyday
interactions, and the development of our identities are determined to a great extent by
the cultural patterns that we leam during processes of socialization. Culture dictates
what acts will win us prestige, what table manners to use when eating in public or
what gestures and words to use when meeting someone for the first time
(McCall,1966'.23). These types of cultural criterion however, are not static, they shift
from one culture to another. For example, if we ranked all the possible methods of
displaying masculine friendship from A-2, we would find that various societies would
employ only a few of each, and that many possibilities would not even be recognized
as alternatives, (ie. one society might employ A-E, while another used D-e). case in
point, it is common practice for young men in Kerala to hold ha¡rds with male friends
when walking, this display of masculine friendship is certainly not the Canadian norïn.
Each culture holds within itself prefemed norms of belief and conduct, and
these norms a¡e used as a template to be imitated and emulated. Norms determine for
society what is acceptable, unacceptable a¡rd even unthinkable. However, in complex
societies this issue is often complicated by the existence of subcultures that deviate
from the norm. As noted by McCall and Simmons, subcultures may be treated as
miniature cultures within themselves, but issues of insulation and 'partial culture, pose
serious problems. With respect to ethnic minority groups, insulation from the pressures
and influence of the surrounding society is difficult, and as 'partial cultures', derived
from a larger core, they may not have suffrcient support to grow and prosper
independent of the mother culture (McCall, 1966:25).

l9
It is important to note that individuals tend to fînd the greatest connection with
their culture of origin. Even when internal differentiation and subcultural divergence
occur, the effects of one's first cultural socialization are deep and difficult to overcome.
With respect to ethnic groups in Canad4 unless the influence of the ethnic culture
permeates the individuals initial experiences of socialization, the greater Canadian
cultural systems are more than likely to overcome the influence of the subculture. So
membership in specific subcultures or minority groups will expand one's range of
alternatives with respect to what is considered acceptable behavior, but generally, the
cultural bounda¡ies of the core society can only be transcended partially and with great
diffi culty (McCall, T966:25).
With respect to social boundaries, as noted by McCall and Simmons (1966),
each individual has a number of positions in the social structure of a society, and the
importance of these positions can be demonstrated in the fact that aside from the
personal characteristics of the individual, one's social position will determine to a great
extent who, where, why and in what way we will carry out our social interactions. For
example, the great majority of newly arriving immigrants to Canada will not be able to
claim politicians or captains of industry among their acquaintances. Our set of social
positions determine the shape of our world, they define for us the size and extent of
our personal sphere with respect to where we may move freely and where we may
stray (ie. there are greater social constraints placed upon a garage mechanic than there
are upon a mechanical engineer), (McCall, 1966,26).

20
An important feature of social boundaries is that they are bi-directional. These
boundaries not only keep individuals and groups within their specific social spheres,
but they also keep others out. More or less ascribed status's such as age, gender, race,
region of origin, a¡rd achieved status's such as religion all help to determine the
similarly positioned individuals and subgroups from which we will draw our friends,
acquaintances, spouses a¡rd even our enemies. Similarly, these boundaries will also
establish who we cannot, should not or must not associate with. Even in a society
cha¡acterized by high mobility rates, most individuals will not stray too far from the
paths that their particular social positions engender (Mccall, 1966:27).
It is important to note that most boundaries are differentially permeable
dependent upon one's point of origin relative to the sphere. For example, it is easier
for the upper-class to impinge on lower-class territories tha¡r it is for lower-class
individuals to encroach on upper-class territories. Whenever there is a po\¡ier
differential relevant to the interaction, the more favored group will have a greater
ability to penetrate barriers. The minority group will have less freedom to cross
barriers, and their penetrations into the dominant sphere will tend to be fleeting and
superficial (McCall, 1966:28). As we have noted, the social boundaries that constrain
us limit not only who we are able to interact with, but also what we can do in a given
society. Our socially stratified positions influence not only our privileges, but our life
chances as well. The social order of a society establishes with great authority, the
possibilities of interaction within its culture.

2l
The I nteractio nist Frsmework
The Interactionist framework views identity in relation to the mediating
symbols in social associations, it is a subjectivist sociology that concerns itself with the
actor's conception of reality. Rose (1962), tried to establish some of the main
assumptions of the interactionist approach:
1) people live in a symbolic world,2) humans are stimulated and stimulate others through symbols,3) humans learn expected behavior through symbolic communications,4) the meanings and values of symbols often occur in complex clusters,5) the human ability to think permits one to assess their course of action
(Driedger,l9S7:17 5).
This ontological scheme emphasizes social process rather than social structure.
In fact, Fred Mathews describes Symbolic Interactionism as a process model of
culhrre, rather than apattern ntodel of culture. He suggests that historical, cultural, and
social features of specific groups must be taken into consideration in any analysis of
race and ethnicity (Lal, I 995 : 423). Driedger ( I 989), notes that the sharing of symbols,
values and meanings is very important with respect to ethnic identity retention and
ingroup identifîcation. It is through the acquisition of culture that people are oriented
to a pattern of symbolic meaning. Religious institutions, newspapers, and ethnic
schools can all symbolically engender a sense of ethnic identification (Driedger,
1989:140).
Communication, in the form of language, socialization and education, transmits
group experience into the subjective world of meanings and values.
From the actors point of view, the world consists of social objects - that is,anything that the actor ca¡r name. An object can be a physical thing such as a

22
snooker table, apizz4 or a person. An object can also be a concept such asjustice or equality, or it can be an emotion such as love or fear. The meaning ofan object is conferred on it on the basis of the ways in which people areprepared to act towa¡d the object. This in turn reflects past socialization a¡rdsocial interaction. Old meanings may be reinforced or emergent meaningsmay arise on the basis of current and future interaction or on the basis ofimagination. (Lal, 1995 :423)
The sociocultural and interactionist frameworks are not meant to be isolated
from each other by nature of their ontological differences. Rather, they should be seen
as a collective device through which the alternative assumptions of each method are
heuristically separated (Driedger, 1987.I74). There are areas of knowledge with
reference to identity that can only be approached through the use of both ontological
methods. Therefore, this study will attempt to use components of both sociological
approaches in order to develop a complete and comprehensive theoretical frame.
This research will investigate the inter-relation between sociocultural systems
and symbolic Interactionism as they apply to ethnic identity and ethnicity within the
Malayalee-Canadian community, and specifically among those of the second
generation. With the use of this theoretical guide, I will examine Malayalee ethnicity,
and trends of ethnic identity retention and/or decline within the conceptual frame of
Driedger's conformity-pluralist model. In this cross-generational study, we will focus
on four main concerns:
1) Patterns of ethnic identity retention within Toronto's Malayalee community.2) The classification of second generation Malayalee-Canadian ethnicity wit-h
reference to Riesman's three ideal ethnic types.3) The movement of Malayalee youth towa¡ds forms of symbolic ethnicity,
and their subsequent place within Driedger's Conformity-Pluralist Model.4) whether a dichotomy can be drawn between subjective and objective
ethnic identity.

23
CHAPTER II
LITERATURE REVIEW
Research into ethnic identity among visible minorities (particularly South
Asians) in Canada has been limited. While numerous articles and texts focusing on
the visible minority experience have dealt with issues of racism, discrimination and
feelings of 'otherness', the concept of identity for these groups has rarely been
considered. This area seems particularly important given that existing research into
ethnic identity retention has dealt almost exclusively with Canadians of European
origin. The unique racial and cultural qualities of Malayalees would suggest that their
rates and levels of identity retention or decline may not follow the same paths of
European groups studied previously.
Ethnic Identitv
Fredrik Barth attempted to define ethnicity in terms of the socially relevant
factors of group membership. In this respect, he suggests that it is the ethnic boundary
that defines the group and not the cultural factors that enclose it (Barth,1969:14-15).
Therefore, as ethnics are assimilated or acculturated into a core group, cultural features
that signal the boundaries may change. However, while the cultural characteristics and
organizational forms of an ethnic group may evolve, so long as there is a continuing
dichotomy between members and outsiders, the nature of that ethnic continuity ca¡r be
distinguished and the changing cultural form may be investigated (Isajiw, 1975:l l5).

24
Ethnic identity is allegiance to a group - large or small, socially dominant orsubordinate - with which one has ancestral links. There is no necessity for acontinuation, over generations, of the same socialization or cultural patterns, butsome sense of a group boundary must persist. This can be sustained by sharedobjective characteristics (language, religion, etc.), or by more subjectivecontributions to a sense of "groupness", or by some combination of both.
(Edwards, 1985:10).
This definition implies that beyond a continued sense of group belonging that
may be sustained through symbols, there are no visible (objective) components
necessary for the continuance of identity (Edwards, 1987:57). Within the framework
of this definition, the features of ethnicity that are taken into account are based on the
characteristics and beliefs that the group members themselves feel are of importance
(Isajiw, 1974ll5). Barth's definition is particularly applicable to the Malayalee ethnic
group, as a community in flux.
This definition of ethnicity differs from others in that it specifically allows for
the interpretation of "ethnicity in transition". This unstable stage of ethnicity that
Bhabha calls the 'beyond', refers to the marginalized people of the second, third and
subsequent generations living in both cultures but belonging in neither.
The beyond is neither a new horizon, nor a leaving behind of the past...Beginnings and endings may be the sustaining myths of the middle years...wefind ourselves in the moment of transit where space and time.rorrio producecomplex figures of difference and identity, past and present, inside and-outside, inclusion and exclusion (Bhabha, I994:l).
The Malayalee youth in Canada are in the midst of such a transformation, a shift that
could leave them marginalized and receptive to forces of assimilation and
acculturation. As mentioned earlier, first generation Malayalee immigrants tend to fall
into Cells D and E of the conceptual model dependent on their durations of stay, while

25
second, third and future generations will likely fînd themselves in Cell D and possibly
Cell C. The question that remains is whether there is a place for ethnicity and ethnic
identity in the psyche of the marginalized.
In this age of diaspor4 rigid definitions of ethnicity and culture cannot
encompass the transitory, evolutionary nature of human inter-relations. With reference
to ethnicity, both objective and subjective definitions are necessary. The objective
approach may adequately deal with the structural nature of ethnicity while the
subjective approach will encompass the ethereal qualities not so easily grasped. In
Canad4 a nation where there are many immigrant generations, issues of ethnicity and
claims to ethnic heritage are often placed in question. It is often assumed that ethnic
group boundaries and ethnics in general will be consumed by the larger society, this
conclusion however is unjustifred (Isajiw, 1974:l2I).
There is a great deal of evidence that suggests ethnic identity persistence in
Canada extends far beyond cultural assimilation. Furthermore, it has also been
postulated that the persistence of ethnic identity is not necessarily related to the
persistence of traditional ethnic culture (Isajiw, 1974:l2l). Isajiw suggests that
identity maintenance over generations may be attributed to a form of ethnic re-
discovery, or in other words, the development of a symbolic relation to the culture of
one's ancestors. Isajiw proposes that items from a cultural past such as folk art, music
and even literature can develop into symbols of ethnic identity (Isajiw, 1974.121).
Interestingly, this symbolic re-discovery is not without direction since there
seems to be a process of selection as to which elements of the cultural past are kept

26
and which are discarded or disregarded. This selection process appears to dispense
with some of the excess baggage of ethnic tradition while retaining those items that
correspond to immediate or future needs in the context of the society as a whole
(Isajiw, 1974.121). This picking and choosing of ethnic symbols may result in new
hybrid cultural forms, and it may support ethnic identification to a degree, but is it a
realistic basis for the retention of ethnic identity?
Gans (1979), in his resea¡ch into identity and ethnic salience suggested that in
the United States, this ethnic re-discovery or revival was no more than a minimization
of ethnic culture and a fall back to an ethnicity of last resort (Edwards, 1987:54). This
form of ethnic identity retention is seen by Smolicz (1979) as a type of residual
ethnicity, an ethnicity that obscures the fact that ethnic heritage and culture are being
degenerated and attacked by forces of acculturation and assimilation. However, as
noted by Isajiw and Edwards, this type of Symbolic Ethnicity, in its non-obtrusive
private nature, may come to anchor ethnicity for future generations as it can be
maintained indefrnitely without cost to the individual (Edwards, l9g7:54).
It should be noted at this point that in using Driedger's conformity-pluralist
model for my conceptual frame, this study will deal with levels of ethnic identity
retention, not levels of assimilation. Whether or not Malayalee youth are moving
towa¡ds Cell D or C, a decline in levels of Malayalee ethnic identity ca¡rnot be
interpreted to measure levels of assimilation on its own because retention of some
forms of ethnicity, and assimilation into the larger society can take place concurrently
(Isajiw, 1990:35).

27
As previously discussed, within the framework of this study, the retention of
ethnic identity from generation to generation does not necessarily imply the retention
of all objective and subjective aspects of ethnicity in similar degrees or patterns. As
noted by Isajiw, different components of ethnicity will influence the development of
various forms and levels of ethnic identity. For example, high levels of objective
ethnic identity, accompanied by low levels of subjective components could lead to
forms of ritualistic ethnic identity. By contrast, high positive levels of subjective
ethnicity and feelings of ingroup obligation, accompanied by low levels of objective
ethnic identity would be classified as a form of ideological ethnic identity, (Isajiw,
1990:37).
This study will attempt to determine some of the prospective types of ethnic
identity patterns that emerge from the statistical dat4 (ie. ritualistic identity, ideological
identity, etc.)' As ethnic identity is an amalgamation of several components, various
factors (ie. factors of identification and ethnocentrism) will be employed to assist in
explaining the realities of identity maintenance within the Malayalee community in
Canada. In our discussion of ethnicity and ethnic identity, structural and cultural
identity maintenance a¡ise as fundamental measures of ingroup cohesion. Since ethnic
identity is directly effected by levels of ethnocentrism, dimensions of ethnocentrism,
both behavioural and attitudinal, are used as indicators to measure emerging patterns
of ethnicity and ethnic identity.
Ethnocentrism was defined by Sumner as:

28
'..the view of things in which one's own group is the center of everything, andall others are scaled with reference to it...Each group nourishes its own prideand vanity, boasts itself superior, exhalts its own divinities and looks withcontempt on outsiders. (Swartz, 1961.75)
Adorno agreed with this definition and further, suggested that ethnocentrism is based
on persu¿lsive and rigid ingroup/out-group boundaries. At its extremes, ethnocentrism
promotes stereotyped negative imagery and hostile attitudes towards out-groups while
encouraging stereotyped positive imagery and submissive attitudes towards ingroups.
This perspective does more than draw a dichotomy between ingroup and out-group, it
promotes an active hierarchical and authoritarian view of interaction where ingroups
are seen to be rightly dominant and inherently virtuous (Adorno, 1950:150)
These extremes of ethnocentric attitude and behavior will greatly influence
the degree and nature of ethnic identity retention. However, studies by Rothman
(1960, 1962) and Swa¡tz (1961) suggest that this rigid definition of ethnocentrism
cannot be applied to all ethnic groups. While Certain groups (ie. Aboriginals,
Hutterites) will remain in Cell E as voluntarily pluralist, the great majority of minority
groups in Canada will show varying levels of ethnocentric behavior and attitudes.
Studies have shown that out-group values and practice c¿ur be held
simultaneously along with positive ingroup loyalty (Peters, l97I:3). However, this
type of mixing and matching of ethnocultural attitudes and behaviors will inevitably
have some detrimental effect on ethnocentrism and eventually, ingroup cohesion will
begin to deteriorate. Just as ethnocentrism helps to maintain the stability of ingroup
culture, the intrusion of out-group influences within ethnic group boundaries must

29
destabilize that cohesion to some degree. Identification with ethnicity and culture is of
vital importance if positive levels of ethnocentrism are to reinforced.
As second generation Malayalees mature within Canadian society, it is
reasonable to assume that a great deal of their ethnic identity will develop based on
Canadian ethnic and cultural norms. Whether second generation Malayalees perceive
themselves to be Canadian or Malayalee is of paramount interest here. If second
generation Malayalees show lower levels of ethnocentrism than those of the first
generation, that decline may be the result of a reduction in their Malayalee ethnic
identity, or it may be the result of positive Canadian ethnocentrism? Second
generation Malayalees are surely marginalized between two worlds, but the uncertainty
of which world they identifu as ingroup clearly leaves room for new interpretations on
the question of generational decline, retention, and resurgence.
All people have a selÊimage or self-identification, a way of locating themselves
socially. The image may consist of personality attributes, status characteristics or any
number of qualities held by the individual. Self-image can also include identification
with various groups; the interest here is in ethnic groups. If a person is of Malayalee
ancestry, for example, to what extent does that person feel Malayalee? Dependent
upon salience in the overall self-image of identification between in and out-group,
ethnic identifrcation will vary in intensity (Reitz, l9g0:109).

30
Levels of ethnic identity retention and patterns of ethnicity that develop among
minority groups can be understood in terms of their relationships with various ethnic
identification factors. With reference to the two sociological ontologies used in this
research, three sociocultural forms of identification (tenitory, institutions, and culture),
and three interactionist forms of identification (history, ideology and leadership) will
be addressed' Each set of macro and micro forms of identification are interwoven, and
they serve to strengthen and reinforce each other. In the macro sociocultural interplay,
teritory acts as a crucible in which ethnic institutions are constructed, and where
ethnic culture is sustained. In the micro symbolic-interactionist frame, historical
symbols and ideologies are seen as the means through which leaders can establish a
sense of ethnic GemeinschaJì (Driedger, 1989:143-47). These theoretical perspectives
constitute a structural-symbolic continuum, within which the foundations of identity
maintenance are encapsulated (Driedger, l9g9: 143).
IdentiJication with ø Territory
Previous research suggests that the concentration of ethnic group members
within a particular territory is fundamental to the maintenance of ethnic culture
(Driedger, 1989; Isajiw, 1974; Devos, Ig75). Ethnic territory becomes a crucible in
which out-group influences are kept to a minimum and ingroup activities are
encouraged. As ingroup formations of Home Territory afford a relative freedom of
behaviour and a sense of intimacy to the members of the ethnic community, this type
of control over communal space becomes central to the survival of ethnic culture
(McNall, 197 4'.1 34-l 3 5).

3l
French Provincial control in Quebec, and the Hutterite's rural enclavic
communities are good examples of ethnic dominance within territorial boundaries.
These communities are characterized by boundary maintenance and controlled
systemic interactions with out-groups. While most minority groups are unable to
maintain this type of exclusive control over a territory, the proliferation of ethnic block
settlements (particularly in the West), would suggest that it is a model to which many
groups aspire (Driedger, I 989: 143).
A honte teruitory can effectively encapsulate ethnic groups within needed social
and cultural boundaries. If high levels of segregation from out-group communities are
achieved, processes of ingroup socialization may impel conformity to ethnic norïns
with very few exceptions. However, for most ethnic communities (living in close
proximity to, or alnong, out-group communities) a continuous oscillation between
openness and closedness is necessary if a sense of ethnic community is to be upheld.
This type of fluctuating community system allows for the intake of wanted or needed
information and interactions, while guarding against intrusive and unwanted
influences (Driedger, 1939:220'223). Ethnic territories, whether segregated, partially
penetrable, or open, are an essential component of ethnic identification.
I ns titutio nø I I dentfrc utio n
Having examined the 'push' from outside the ethnic community, we can nowexamine the 'pull' from within it. In many ethnic communities, organizationsspring up shortly after the first wave of immigrants arrive. The iniìial aim ofsuch organizations is often to help immigrants adapt to the new society. But asthe immigrant group grows larger, ethnic enterprises and professional servicescan be better supported by markets within the group. (Reiì2, l9g0:215).

32
Previous research suggests that ethnic integration into mainstream society will
largely depend on the forces of attraction (positive and negative) that stem from the
ability of ethnic communities to hold members within their socio-cultural bounda¡ies.
Breton (1964) argued that the diversity of organizations within the infrastructure of an
ethnic community was more important than any particular type of organization. He
used the term instilulional completeness in reference to a community's ability to
generate institutional and organizational options (ie. economic, social, religious,
political), that would allow its members to exist, function and grow within the relative
confines of group boundaries. (Driedger, l9g9:L44).
In institutionally complete societies, ethnics are able to live within the confines
of their group boundaries indefinitely. The greater the range and diversity of needs
that an ethnic community can meet, the more time its members will spend within the
community, and consequently, the more connection and identification the individual is
apt to have with his/her ethnicity and heritage. Institutional completeness is not an
infallible method of preventing entropy and ethnic identity decline, but integration of
ethnics into their own communities will reinforce solidarity. A strong sense of
institutional identification can help to establish linkages within the community.
Sometimes these connections last for only limited periods, but they can also persist
over lifetimes and even generations. Whether their effects result in short or long term
cohesion, ethnic institutions work to create networks and informal contacts that
increase the salience of ethnicity within their communities (Reitz, l9g0:219).

JJ
Cultur al I de ntific atio n
Previous research suggests that people need to have a firm sense of
identification with their ethnic heritage and culture if they are to establish a secure
sense of self and nomos. As aforementioned, ethnics derive their historical
understandings of peoplehood and sense of we-ness from their ethnicity and heritage.
Driedger (1975) found several cultural factors that tend to differentiate levels of
objective and subjective ethnic identity (parochial education, ethnic language use,
ethnic religion, endogamy, choice of friends, a¡rd voluntary organizations). (Driedger,
1989:145).
Ethnics that are either uninterested or unable to maintain ingroup relationships
and cultural retention, tend to assign low priority levels to these factors. Conversely,
those with higher levels of cultural retention will tend to relate with one or more of
these factors' A strong sense of identification with ethnic culture will tend to intensifr
feelings of Gemeinschaft and ethnic community.
Identification w,ith Historical Sy mb ols
Driedger (1989) suggests that knowledge of historical origins and a pride
in heritage are essential if urban ethnics are to retain a sense of purpose and direction.
Without this type of historical understanding, it becomes decidedly diffrcult for ethnics
to perpetuate their culture. Historical symbols can create a sense of belonging, a sense
of tradition, and a sense of continuify that is worth perpetuating (Driedger, l9g9:146).
Research suggests that Historical ldentification can either work positively as a
rallying point for an ethnic group, or it can function negatively. For example, in a

34
study by Driedger (1976) Ukrainians, Poles and Germans in Canada are inclined to
deny their ethnicity, while Jewish and French Students showed positive levels of
ethnic identity. Jews have rallied around the tragedy of the Holocaust, and used its
memory to effectively bind the members of their ingroup together, (Driedger,
1989:146). As with the hardships experienced by the Jewish people in World War II,
historical tragedies and burdens a¡e often extremely effective in establishing historical
identifrcations, and ingroup bonding.
For those individuals that display low levels of ethnic identity (ie. the
marginalized), a connection with a historical past may advocate a resurrection of pride
in ethnic heritage (Hebdige, 1991.37). A symbolic identification with ingroup history
allows ethnics access to a living record of their people, and further, it can instill a
desire to contribute to the continuation of that record. Through historical symbols,
ethnics make a connection with their past, and this can act as a vital factor in
developing a sense of personal and sha¡ed identity (Hebdige, lggl,3l-9).
C hark matic Leaders hip ønd ldentiftcation
Charismatic Leadership is an important factor in any social movement.
Individuals with a sense of purpose and mission are often able to motivate a people
beyond their normal expectations a¡rd boundaries. Just as Martin Luther King Jr. in
the American Civil Rights movement, and Mahatma Ghandi in India's non-violent
struggle for independence, Charismatic Leaders can create a cohesive loyalty to both
themselves and ingroup. By meshing ideology, social issues and symbolic links to the

35
past, lrue leaders can develop a collective sense of mission and purpose among their
people (Driedger, 1989 :l 47).
I de ntific atio n with I deologt
Political and religious ideologies can act as a focal point around which ethnics
rally. While institutional and cultural values are treated as means to an end, ideologies
are often seen as part of a greater purpose to be perpetuated indefinitely, a goal beyond
the banality of everyday structures (Driedger, 1989:146-7). For the Malayalee
community, political ideologies have done little to sustain ingroup connection and
solidarity, however, religious ideology and identification with a sacred past, supports
and emphasizes the importance of maintaining their ethnic culture. This section will
focus on religious ideologies and identification with the sacred.
Religion is the varied, symbolic expression o[, and appropriate response to, thatwhich people deliberately affirm as being of unrestriðted value forìhem.
(Hall, 1978:16)
The unrestricted value of religion is reflected in commitment to a religious
ideology. As noted by Driedger (1989), True believers will often see religion as more
important than economic and political power, and they will tend to sort their priorities
and order their reality around this focus. As social cohesion and other forms of ethnic
group solidarity are often traced to religious origins, sociologists have been interested
in how belief in the sacred acts as a mechanism through which ethnic groups stave off
anomie and alienation (Durkheim, 1912; Nisbet, 1974;Driedger, l9g9).
Religion, as a form of social behaviour, distinguishes various groups from one
another by custom and through action, not just by doctrine and belief. Religion, along

36
with race and language, acts as a unifring principle, helping to defrne a sense of
ingroup identity according to the nuances of their ethnic group norms (Hall,l978 .Zl7).
O'Dea suggested that religion sacrilizes the norms and values of an established society
by maintaining the dominance of group goals over individual wishes (Driedger,
1989:199). Hans Mol defined sacralization as a process rather than a state:
the process by which man has preeminently safeguarded and reinforced thiscomplex of orderly interpretations of reality, rules and legitimations...It is a sortof brake applied to unchecked infinite adaptations in symbolic systems...for theemotional security of personality and the integration of tribe or community...Itsafeguards identity, a system of meaning, or a definition of reality; and itmodifies, obstructs, or legitimates change (Driedger, l9g9:199).
This defrnition suggests that the sacred. must be seen as more than religion.
Sacralizatlor¡ involves a process whereby religious or secular symbols are set apart
from the profane, and are so cloaked with tradition and ritual, that they become
functionally sacred. In this respect, specific symbols, noÍns and values are set apart
and preserved as significa¡rt aspects of life (ie. ethnicity) that should endure (Driedger,
1989:199). As suggested by Mol, changes in ethnic group cohesion and group
solidarity may be obstructed, modifred or legitimated dependent upon one's
understanding of, and identifîcation with, the sacred.
Ethnocentrism and factors of ethnic identification have been discussed in terms
of their relationship to ethnic identity retention. Both components are influential in the
maintenance of ethnic identity, but neither function as a base for the creation of that

37
identity. Berger's concept of the Sacred Canopy, establishes a foundation for the
development of ethnic identity and identification by bridging the gap between the
macro and micro realities of ethnicity.
Theoretically, the sacred cqnopy is merely a large blanket held up by a series of
long stakes attached to its four corners. The canopy is a symbolic shield used to
protect those under its roof from the influences of the outside world, and the stakes are
important in that they give the canopy balance and strength (ie. with fewer or weaker
stakes, the stability of the canopy decreases. Interestingly, if the stability of the
structure does not falter, the stakes in the canopy can be replaced or substituted by new
a¡rd better ones. While its components are adjustable, and while the canopy itself is
mobile, the purpose of the canopy remains the same, to create for its people a sense
meaning and understanding of the world (Driedger, r9g9.202).
There a¡e four main stakes that support the canopy : l) religion or ideology;
2) ethnic community; 3) ethnic culture; and 4) land or territory in which the group
resides. All four fundamental components exist as part of a symbiotic r'elationship,
each individually and collectively supporting the community and shielding against
meaninglessness and anomie. The land acts as a crucible in which ethnic culture and
community develop. Religious and ideological foundations develop from within these
circumstances, and then in return, shape the community and culture (Driedger, l9g9:
202). The sacred canopy plays an integral part in ethnic Nomos-building and
maintenance; it provides structure and support in the early stages of ethnocultural

38
development, and it ca¡r sustain a meaningful and stable construct of reality when
circum stances require its reconstruction, transferal, or transformation.

39
CIIAPTER III
THE MALAYALEE GROUP
The term South Asian refers to people whose origins lie in the Indian sub-
continent, sri Lank4 Pakistan, Bangladesh, and Nepal (Das Gupt4 1994:59).
Malayalees are a group of South Asians originating in India's southern State of Kerala.
In many ways, migrant Malayalees in Ca¡rada seem to occupy a grey area between
established definitions of ethnicity. In order to best understand the fundamental
differences between this community and other similar South Asian groups, we will
address both its historical origins, a¡rd its present state of cultural renewal/decline.
This chapter is organized in two main parts: Section one will detail the historical and
the traditionally accepted origins of Christianity in India; and section two will outline
the unique natures of the two religious groups of interest in this study.
The Historv of Christianitv in India
Our identity is intimately connected not only with the culture in which we growup, but also with our religious affrliation. We received our faith through aparticular church: the Syro-Malabar Church...our liturgy, spirituality, churchstructure and discipline make us different from other churches.
(Mundadan, 1995:10)
The unique history of Christianity in Southern India is what separates the
Christian Malayalee community from other similar churches. Contrary to general
belief, the Christian church in India did not originate in the l6th century with St.

40
Francis Xavier and the Portuguese missionaries. The Christians of Kerala trace their
origins to the Apostolate of St.Thomas in 52 A.D. (Mundadan, 1995:21). In fact,
Portuguese documents of the 16th and 17th century can be found to refer to the
traditions of the St.Thomas Christians, and even further, they often note pilgrimages to
the tomb of St.Thomas in Mylapore. Whether or not the Apostolic origin of the
St.Thomas Christians is in fact a historical reality, it is the collective faith and symbolic
identification that Malayalees have with their ancient, continuous and strong tradition,
that binds religion into their sense of identity (Mundadan, 1995:22).
The 4th century A.D. marked a turning point for the St.Thomas Christians as
their church came under the influence of the East Syrian Church of persia. The
accounts of how this shift occurred are varied, but the end result \¡ias approximately
eleven centuries of Persian influence. During this time the St.Thomas Christians lived
in two worlds, one based on the political and sociocultural influences of their Indian
homeland, and the other was the ecclesiastical world of the East-Syrian Church
(Mundadan, 1995:25).
After the arrival of Vasco da Gama in 1498, the St.Thomas Christians began to
feel the influence of the Portuguese missionaries and the Christianity of the West. At
first, the Portuguese accepted the Indian Christian's claim to apostolic origin, this
however did not prevent their slow takeover of the church in India. By blocking the
arrival of Persian bishops to Indi4 the Portuguese set in motion a series of initiatives
that would bring the St. Thomas Christians under the Latin rule (Mundadan, 1995.26).

41
In order to bring the St. Thomas Christians under the jurisdiction of the Roman
Catholic Church, the Portuguese brought forth evidence of Nestorian heresyl within
the Syriac liturgical texts. The Portuguese convened the Synod of Diampef in l5gg,
at which point, this issue was used as motive to sever ties with the Syrian church. As a
result, the Church of St.Thomas became a colonial Portuguese church, and both their
liturgy and ecclesiastical lives were Latinized, (Mundadan , 1995.26). For more than
1600 years the St.Thomas Christians were a single faith community, and this was
reflected in their degree of ethnic solidarity and cohesion. However, the portuguese
overthrow produced divisions within the community, divisions that culminated in what
is known as the coona¡r cross oath of 1653 (Mundadan, 1995:27-2s).
The significance of the Coonan Cross Oath is that it signaled the first great split
in the one ancient Christian Church of India. A great number of St.Thomas Christians
demonstrated in protest against the Latin rule by rejecting the foreign missionaries and
Portuguese authority. At the church of our Lady of Ltfe at Mattanchery, The
Archdeacon Thomas Pa¡ambil led a group of priests and lay people in an oath that they
would no longer be subject to the Portuguese rule. According to tradition, the
crowd shared in the oath by holding onto a rope tied to a cross in the churchyard, and
I Nestorianism is the Doctrine tlnt there are two separate persons in Cluist; one divine, and t¡e otherItuman' Mary is understood to have given birth only to tlie human person in Christ, therefore, she is notconsidered to be the Bearer of God. The term Nesrorian comes from Nestorius, the patriarch åfConstantinople (428)' Its supporters in Syria and Persia eventually established the Nestorian Chu¡ch(Mandadan,l995:63).
2 The Synod of Diamper (Udayamperur Soonahados): A church council of senior clergy and ofücials thatgatltered at Diamper in order to discuss the situation involving the Nestorian heresy oiihe st. ThomasClrristians (Mandadan, I 99 5 :26).

42
that the sheer weight of numbers upon the rope, caused the cross to bend, thus,
the oath is known as the coonan (Bent) cross oath (Mundadan, 1995:2g). The
origins of the Marthomite, Jacobite and Roman Catholic Churches in India ca¡r be
traced to this event (Mundadan,1995:28).
There have been a large number of schisms in what was the one great
Church of India. The three major religious populations in Kerala now are Hindu,
Christia¡r and Muslim, (50o/o Hindu, 30% Christian, and 20% Muslim). However, the
large number of Catholic (Eastern and Latin) Rites, and the existence of non-Catholic
(ie. Marthomites and Jacobites) St.Thomas Christians, can be extremely confusing.
Tables 3.1 and 3.2 and 3.3 attempt to visually summarize and clarif, the major
religions of Indi4 and the status of christians in that order.
After the Coonan Cross Oath, as the community of St. Thomas Christians
separated, two main churches arose. The first rejected the Portuguese influence
and entered into communion with the West-Syrian Jacobite Church of Antioch, the
other continued to recognize the prelates appointed by Rome and remained Latin
Catholic. Further branching occurred in the lgth century when Anglican influences
split the Jacobite Church, giving birth to the Mar Thoma Church ( St. Thomas Church)
(Mundadan, 1995:28).
The main differences between the three groups lie in an acceptance of the
Papacy and in Nestorianism. The Roman Catholics accept both the pope as the
head of the church, and Mary as the mother of God; the Jacobites accept Mary as the

43
Figure 3.1 Chronological History of Christianity in India *
52 A¡rival of St. Thomas the Apostle at Cranganore
72The martyrdom of St. Thomas nearMylapore
1498 The arrival of Vasco da Gama at Koclú
1599 Ïte S1.nod of Diamper
1653 The Coonan Cross Oath
1800's, AnglicanInfluence separatesthe Marthomitesfrom the JacobiteChurch
Church secures fullcommurion with theAnglican Church.
Ii
ST. THOMAS CHRISTIANS
ROMAN CATHOLICS
LATIN CATHOLICCHURCH
SYRO-MALABARCHI.JRCH
SYRO-MALANKARACHURCH
1962 Malayalam translationof the Qurbana
I
I
I
rl¡
* This cluonology is based on the traditional recoiA

Table 3.1
44
THE MAJOR RELIGIONS OF I¡IDIA T
RELIGION
HinduMuslimChristiansikhBuddhistJainOther ReligionsReligion not stated
ADIIERENTS
s49 779 48175 512 43916 165 44713 078 146
4 719 7963 2060382766 285
60 2t7
PERCENT
82.64
tl.342.431.96
0.710.480.420.01
* Source: Indian Census of I 98 L(\4undadan, I995:80).
The l99l census data on religious communities are not yet available
Table 3.2 CHRISTIANS IN II\DIA T
RELIGION
CatholicsLatin RiteEastem Rite
ProtestantsOrthodox
lJacobites & others)Total
ADITERENTS
l0 000 0004 000 000
10 000 000
3 000 00027 000 000
TOTALS
l4 000 000
l0 000 0003 000 000
27 000 000
t These are approximate lìgures. The tsgl census ,ho*"d *16' I million are Christians. The population of I¡dia in mid-I994 was 896.6 million. There are aboutlT millionChristians in India today (lr4undadan, I 995 :
g0).
Table 3.3 CIIRISTIANS IN KERALA 'RELIGION ADFIERENTS TOTALS
CATHOLICS 5 2OO OOO
Syro-Malabar 3 000 000Syro-Malankara 500 000Latin I 700 000
OTT{ER CHRISTIANS 27ß OOOSyrian Orthodox I 100 000Jacobite Synan Orthodox I 000 000Independent Jacobites 9 000Marthomites 500 000St. Thomas Evangelical
& Others l0 000Nestorian Church of the East 100 000Chu¡ch of South India (C.S.I.)
& Other Protestanrs 700 000 700 000TOTAL 8 619 000
* The exact figures ore not ouuiluble. Ther" i

45
Bearer of God, but they do not accept the Pope as the head of their church; and the
Marthomites accept neither the Pope as head of their church, nor do they accept Mary
as the Holy Mother.
The Mar Thoma Church
Some 2000 years after the Coonan Cross Oath, a split in the Jacobite Church
saw the emergence of the Mar Thoma Church of India. Marthomites are St.Thomas
Christians, but they differ from the other main churches in India. As previously
mentioned, the Marthomites are one of the Eastern churches that do not recognize the
Pope as the successor of Peter, and as a result they are not in communion with the
church of Rome. The Mar Thoma theology reflects the Anglican influence that
initiated their split from the Jacobites, but their distinctly Indian heritage and culture
are reflected in their liturgy and their ecclesiastical lives (Mundadan ,1995:28).
The Roman Catholic Church in Indis
With the aforementioned Synod of Diamper, the long-standing relationship
between the St.Thomas Christians and the East-Syrian Church of Persia was severed.
As a result of the Portuguese action, all of the St. Thomas Christians came under the
Latin rule in 1599. The Roman Catholic Church in India presently houses three Major
divisions; the Latin, Syro-Malabar, and Syro-Malankara Rites3. Those Keralites that
remain Roman Catholic today, have a unique connection and tradition with the history
of Roman Catholicism in Indi4 and it is this diversity that we wish to explore.
3 Rite: A heritage made up of liturgy, theology, spirituality and discipline - a heritage that is defferentiatedby the culture and circumstances ofthe history oipeoples-and is expiessed by each ihurch suijuris(autonomous) in its own lìlanner of living faith (Mundadan,t995:16).

46
TIrc Latin Catholic Rite
The Latin Rite consists of a portion of the Kerala Christians who remained
under the Portuguese iirfluence after the Coonan Cross Oath. These Latin Catholics
have seen very little change to the structure of their church since the creation of the
Syro-Malabar Church in 1887. In fact, the only other significa¡rt development in the
history of the Latin Rite in India occuned in 1962 when a transition in liturgy was
undertaken. This change translated the Latin Catholic religious services (eurbana)
from the accepted Latin-syriac to Malayalam (Mundadan, 1995:45-54).
Tlrc Syro-Malabar Rite
As previously suggested, The Syro-Malabar and Latin Rites did not develop at
the same time. Rather, the Syro-Malabar Church arose from within the Latin Catholic
Rite two centuries a-fter the Coonan Cross Oath. Divisions within the Latin Catholics
began to form in the aftermath of the Oath in 1653, as a great number of St. Thomas
Christians (within the Latin Rite) rejected the Latin rule. They listed grievances
against foreign missionaries and Latinization of their liturgy and ecclesiastical lives.
The situation worsened until two major occurrences demanded an acceptable response
from Rome (Mundadan, 1995:30).
The first major development occurred in 1787 when representatives from g4
churches gathered at Angamaly and drew up a document in protest of the Latin rule.
At this assembly, the congregation made demands for the empowerïnent of native
bishops, and they put forth a list of grievances, sighting the sins of commission and
omission inflicted upon their St. Thomas community by the foreign authority

47
(Mundadan, 1995:30). This protest in itself did not influence Rome to take the
complaints of these St. Thomas Christians seriously, and real change did not occur
until almost a century later.
Two Chaldean Catholic bishops, Thomas Rokkos and Elias Melus, were sent
by the Chaldean patriarch to seek converts among the St. Thomas Christians. Neither
Rokkos in 1861, nor Melus in 1874, are accepted by the Latin Hierarchy, in fact,
Rokkos was excommunicated by the Carmelite vicar Apostolic of Varapuzha upon his
arrival' This blatant abuse of power by the Latin vicar, and the insult to their native
bishops, furthered the schism that was forming in the Latin Church. Due to the
seriousness of these developments, Rome had to take action. Delegates were sent to
India to study the situation, and this eventually led to the creation of the Syro-Malabar
church from within the Latin catholic Rite (Mundadan, 1995:31).
In 1887, the Syro-Malabar Church was created. The first part of the new title
'Syro' was chosen for two reasons: 1) the church's liturgical language was Syriac; Z) it
was an appropriate title due to their historical connection with the East-Syrian Church.
The title of Malabar was chosen in reference to the area known today as Keral4 the
original home of St. Thomas Christians on the Southwest coast of India (Mundadan,
1995:33).
The Syro-Ma lankara Rite
The Syro-Malankara Rite finds its connection to the Roman Catholic Church by
way of the Jacobite church of India. Followers of Fr. P.T. Varghese split from the
Syrian Orthodox Jacobites (Methran Kakshi) in 1919, and became Catholics in 1932.

48
When this section of the Malankara Jacobite Church joined the Catholic Church, they
were allowed to retain both their name (Malankara) and the Antiochene Rites. The
Term Syro-Malankara is in part, derived from their Jacobite heritage in Kerala, but
unlike the Syro-Malabar Rite, Syro, in Syro-Malankar4 refers to their West Syrian
connection (Mundadan, I 995.65).
According to research conducted by Mangalam, the majority of Malayalee
immigrants to Canada are Christian. More specifrcally, the majority of this Canadian
population is affiliated with either the Catholic, Jacobite or Marthomite religion, (some
smaller groups are Pentecostal, C.S.I. Hindu and Seventh Day Adventist)
(Karumanchery, 1992:47). This study will focus on both the Roman Catholic and
Marthomite communities in the GTA. The Jacobite and Hindu Malayalee groups are
also of interest to this research but unfortunately their sample populations are too small
to analyze adequately. The next sections address the immigration and development of
Malayalee culture in Canad4 and the transformation of Malayalee sacred canopies, in
relation to these two distinct religious groups.
Immigration
The state of Kerala is approximately the size of Nova Scotia" and contains a
population of about 27 million, similar to that of Canada. Mangalam (1985), suggests
that Kerala's agricultural base and limited level of industrialization, prove unable to
adequately sustain a population of this size. This level of population density, rising

49
unemployment levels and resulting scarcity of resources (ie, food, fuel etc.), were
significant pushfactors influencing Malayalee emigration (Karumanchery, I992:4g).
As Malayalees immigrated to Canada in search of better lives, healthier living
conditions and improved economic opportunities, their immigration patterns would
seem to parallel those of other South Asian immigrant groups, but significant
differences become apparent upon closer analysis. As in the 1920's a¡rd 1930's, the
majority of South Asian women in Canada enter as family members of migrant South
Asian men. This is fairly typical of most South Asian women, who find it virtually
impossible to be accepted as independent immigrants, (Das Gupta 1994:62). This
trend of step-by-step familial immigration is reflected in Malayalee migration
patterns, however within the Malayalee community, it is not uncommon for female
family members to be the initial immigrant. While male family members tend to
immigrate first, a study by Karumanchery Qggz), suggests that a large percentage of
female Malayalees immigrate before their husbands. Similar research conducted by
Mangalam (1985) also found that Malayalee immigration patterns do not necessarily
reflect generally accepted South Asian models.
Malayalees of both gender tend to attain moderately high levels of education. In
the Malayalee community, females that immigrate before their male family members,
tend to hold higher levels of education and training. Thus, opportunity, employability
and economic factors tend to guide immigration patterns within the Malayalee
community, more than traditional gender roles. In this sense, the Malayalee
patriarchal family structure appears dissimilar from that of other South Asian groups.

50
In 1962, the Canadian government began to phase out discriminatory features
in its immigration policy, (Gov. of ca¡rada., 1974:27). The new immigration
regulations served to remove racial discrimination as a major feature in its policy, and
except for the fact that European immigrants were able to sponsor a wider range of
relatives than non-Europeans, the new regulations were a tremendous step forwards in
official policy (Hawkins, 1972:125). ln 1967,fwo of the most important events in the
history of Canadian immigration occurred. First, regulations were put in place,
introducing non-discriminatory elements into immigration law (Gov. of Can.,l9 74:33),
and the Canadian Manpower and Immigration Council Act was passed, marking the
government's dedication to non-discriminatory policy (Hawkins, 1972:167). The
majority of Malayalees surveyed in the present research immigrated to Ca¡rada in the
late 1960's and early 1970's shortly after Ca¡radian immigration policy was made more
inclusive and open to Asians and other non-European groups.
With the changes to Canadian immigration policy in the early 1970's, the South
Asian population has increased to well over 400,000 (Census Canad4 l99l). South
Asians in Canada are not identified by ghettos and pools of unemployment; rather,
their education levels are much higher compared to other immigrant groups and they
tend to find employment quickly. This is particularly true of the Malayalee community
in the Greater Toronto Area (GTA) (Karumanchery, 1992:46).
It was estimated by Mangalam in 1985 that approximately 600 Malayalee
families lived in the GTA (Mangalam, 1985). However, in a more recent study by
Karumanchery (1992), it was estimated that in 1990, 1260 Malayalee families are

51
residing in the same area (Malayalee Samajam, 1990). This increase of over 100
percent in a five year period, would suggest that the Malayalee community in Toronto,
is growing through both natural increase and immigration (Karumanchery, I 992:47).
The Malavalee Sacred Canopy
The Malayalee sacred canopy is in the process of a massive transformation.
While their ideological and community components have been transplanted with some
degree of success, their cultural and territorial components have undergone extensive
changes. The Malayalee canopy has been transformed from a traditional South Asian
extended family community, into an urban ethnic group without territorial connection.
As religious ideologies and identifrcations provide important ingroup motivation and
inspiration, variations within the Malayalee canopy are differentiated according to
religious affiliation.
Tlte Romqn Catholic Canopy
The Sacred Canopy of Roman Catholic Malayalees is supported by an unstable
set of stakes. As a foundation for the development of ethnic Nomos and community,
the Catholic Canopy has failed to maintain a sufficient shield against forces of
assimilation and anomie. In fact, degrees of ethnic cohesion and ingroup solidarity
among second generation Catholic Malayalees, reflect the precarious nature of their
ethnic identity and identifi cation.
As discussed previously, religion plays a very important role in Malayalee

52
ethnic identification. For Roman Catholics, the importance of their Apostolic origins,
and their historical ties to the one great church of Indi4 have functioned in the past, as
a strong ideological connection that bound their community together. However, the
influence of the Latin rule, and the ongoing connection with Rome, serve to diffuse
their sense of belonging and community.
Catholic Malayalees, whether Latin, Syro-Malanka¡a or Syro-Malabar Rite, are
not defined by their ethnicity. Rather, they are defrned in relation to the larger
community of Roman Catholics that place their (non-Indian) religious center in Rome.
This is reflected in the very title of their religious affiliation. The titles, Hindu,
Buddhist and Moslem, to name a few, reflect an ethnicity, they identify a culture and a
history. Roman Catholic Malayalees must add the postscript - Malayalee - in order to
give ethnic identity to their religious denomination. Catholic Malayalees that display
high levels of church attendance, do not necessarily strengthen their levels of ethnic
identification. Religious practice, as a form of social behaviour, distinguishes various
groups from one another by way of custom and action. However, as the great majority
of Catholic Malayalees frequently attend non-Malayalee (mainstream) religious
services (Table 5.5), religion ceÍNes to act as a unifring principle for them.
Previous research suggests that identification with ethnic heritage and culture
are crucial if a strong ethnic identity is to be developed. Interestingly, The Roman
Catholic community appears to assign low priority to factors of cultural identity: ethnic
language proficiency is not actively encouraged; ethnic institutions are relatively non-
existent, and endogamy does not appear to be the norm for the second generation.

53
While cultural traditions such as ethnic cooking and dress seem to be upheld by the
first generation, the second generation seems to have embraced Canadian culture.
The Roman Catholic Malayalee community in the greater Toronto area is
tied together by the thinnest of strands. They are a community without leaders,
without structure and without solidarity. Short of the ethnic friendship ties held by the
first generation, the community displays very little cohesion. This relative, non-
conrmunity situation, is reflected in their lack of ethnic institutions and their dispersal
throughout the GTA. Unlike many ethnic groups in Toronto that seek to establish
some form of ethttic home tetitory, Malayalees are spread out across the GTA, and
are brought together only though religious functions or ingroup friendships.
Tlrc Mar Thoma Canopy
The Sacred Canopy of the Mar Thoma Church is supported by a relatively
stable set of stakes. The Marthomite canopy has managed to maintain a certain
amount of protection against the forces of assimilation, and as a result maintenance of
ethnic cohesion and solida¡ity within the community have extended beyond the first
generation and into the second.
Religion is of fundamental importance to the Marthomite community. As
aforementioned, Roman Catholic Malayalees have used their Apostolic origins to bind
their community together in the past, in contrast, the Marthomite community continue
to do so even today. From their historical secession from the Latin rule, to the
formation and expansion of their own church, Marthomites have bound the fabric of
their identities to their religion. They are defined by their religion and their religious

54
belief system. Any solidarity or identity maintenance within the Marthomite
communify is inexorably tied to the ethnic heritage reflected and entwined in their
religious origins. Marthomites display very high levels of church attendance, and as
their religion is specifically an Indian religion, such high levels of religious
participation act to strengthen their levels of ethnic identification. Religious practice
within the Mar Thoma church, is distinct, in custom and action, from other Christian
churches in Canada.
Since 1983, the Mar Thoma Church has been in full communion with the
Anglican Church. However, this connection has not had the same efflects on
Marthomites as the connection to the Roman Catholic Church has had on the Roman
Catholic Malayalees. The Marthomites have managed to retain a great degree of their
religious heritage. In fact, in July 1987, the Mar Thoma Church of Toronto opened its
own church building. This private place of worship allows for a great degree of
cohesiveness and ethnic boundary maintenance among Marthomites. This place of
worship acts as a crucible, an ingroup territory that provides Marthomites a place
where strong primary social networks and ethnic heritage may be reinforced.
With respect to the cultural stake in the Marthomite Canopy, cultural
maintenance is relative to thât of Roman Catholic Malayalees. Other than their
dedication and commitment to religion, Marthomites tend to reflect the same level of
cultural barriers to assimilation as Catholics. However, the strong sense of
identification with their religious community transfers into a broader sense of

55
Gemeinschaft with respect to their ethnic community, which are in fact, one and the
s¿une.
Marthomites in the greater Toronto area are a cohesive ethnic group.
However, while their religious identification works to maintain a sense of ethnic pride
and identity, forces of assimilation still penetrate the Marthomite canopy.
Marthomites, like Roman Catholic Malayalees, must deal with influences beyond the
scope of religious affiliation. While their church does act as a form of ethnic territory,
the relative dispersion of community members throughout the GTA effects the quality
of protection afforded them by their sacred canopy. With respect to non-religious
identity factors, second generation identity decline among Marthomites parallels the
decline seen among second generation Catholics. Consequently, the Marthomite
canopy may not be as stable as it seems.
There are aspects of Malayalee culture in Canada that extend beyond religious
borders' While Marthomites and Catholic Malayalees display different religious and
territorial identifications, the deterioration of their cultural identification has
progressed along similar paths. The cultural stakes in both canopies are seriously
splintered and in need of minor modifications. In the transferal and transformation of
the Malayalee canopies, the cultural stakes have weakened in their ability to sustain
and support Malayalee ethnicity. Since the beginning of Malayalee immigration to
Canada and settlement in the GTA, cultural features of Malayalee ethnicity and
identity have been declining. Of the identity indicators noted in this research, the most
drastic declines have been in areas of ethnic language, and endogamy.

56
Ethnic language use has not been structurally supported by the Malayalee
community. The generational decline in Malayalee ability to use their ethnic language
may be due in part to a lack of parochial or ethnic language education. However, it is
likely that similar rates of decline would occur naturally as the second generation are
compelled to assimilate a¡rd acculturate to Canadian norïns. A study by Klassen
(1969) indicates that in spite of persistent efforts to maintain ethnic language use
among second generation ethnics, such programs tend only to reach a minority of the
youth (Peters, I 971 : 19).
Second generation Malayalees who employ English as their first language, tend
to have strong ability to understand Malayalam, but weak abilities to speak, read and
write in their ethnic language. Cummins suggested that this type of bilingual pattern
among ethnic children is indicative of the their sense of marginalization. It is also
common for Malayalee households to have two first languages. Children will in
almost all cases speak to parents in English and parents will tend to respond in
Malayalam or a combination of Malayalam a¡rd English (Karumanchery, I 992,76).
Previous research suggests that the preservation and continued use of an ethnic
mother tongue is one of the most important, if not the most important component of
ethnic identity retention (Driedger, 1989:180). The linguistic accommodation
experienced by first generation Malayalees, ffid the second generation's decline or
inability to use Malayalam reflects a \¡/ane in Language continuity. The degree to
which this shift effects ethnic identity retention must be looked at in conjunction with
similar shifts in ethnic religion and other diverse ethnic customs.

57
Attitudes towards endogamy and arranged marriages have shifted a great deal
within the Malayalee community in Canada. Arranged Marriage has traditionally been
an important instrument used in the Malayalee community to both sustain their sense
of peoplehood and to maintain their ethnic and social boundaries. Malayalee parents
commonly search out partners for their children on the basis of religion, race, ethnicity
and social class.
Traditionally, Malayalee arranged marriages have been employed in order to
match people from compatible family types, and similar social strata. For instance,
marriages would rarely be arranged between people of the sarne race, religion and
ethnicity if the social classes are too divergent. Similarly, in the Christian Malayalee
community, arranged marriages between Christia¡rs and members of out-group
religions would be rare.
Contrary to popular opinion, arranged marriages within the Malayalee
community are neither forced nor coerced. It has always been considered to be the
parent's duty to find and select appropriate suitors for their children, but it is the
ultimate choice of the child as to who he/she will marry. Since dating is not the norm
within Kerala's Christian Malayalee community, arranged marriages continue to be
employed in India today, however, this is not the general practice among migrant
Malayalee Christians in Canada.
The degree to which endogamy is practiced within an ethnic group is a strong
indicator of the extent to which the members of that group are bound by their ethnic
heritage and ethnocultural networks (Peters, l97l:20). First generation Malayalees in

58
the GTA tend to display very high positive attitudes towards endogamy and arranged
marriage, but these attitudes are not shared by those of the second generation. The
primary social and cultural networks of second generation Malayalees tend to originate
within Canadian culture and ethnicity.
As noted in our discussion of the Marthomite and Catholic sacred canopies,
without an ingroup territory or strong ingroup networks, the demographic realities of
Malayalee dispersal in the GTA suggest that endogamy and the tradition of arranged
marriage among Canadian Malayalees is due to decline. Malayalees in the GTA are a
rapidly growing group whose ethnic language and endogamous traditions are
declining, and since Malayalee religious and racial characteristics a¡e not wholly
incompatible with those of the Canadian majority, the extent to which the Malayalee
community is an ethnic group in the process of change and decline is uncertain. Our
major research will focus on religion and the ethnic identity retention of second
generation Malayalees in the Greater Toronto Area.

59
CHAPTER IV
RESEARCH METHODOLOGY
In using the Conformity-Pluralist model as my conceptual frame, both
sociocultural and interactionist theoretical approaches are used to describe and
understand patterns of ethnic identity retention within the Toronto Malayalee
community. Both ontological approaches are used in defrning the characteristics and
motives of the sample population.
Population
The population consists of all individuals of Malayalee heritage living in the
Greater Toronto Are4 with the following qualifications: 1) either their presence in the
GTA was recorded in the files of the Malayalee Samajarn, or they can be reached
through a search of Samajam records as a result of familial or social connections (eg.
a¡r individual may not be listed in the Malayalee Samajam records, but may be living in
the home of one who is); and 2) all participants must be at least 15 years of age. The
Malayalee Samajam predicted in 1990 that there were approximately 1260 Malayalee
families living in the GTA. Unfortunately, due to a lack of census data collected with
specific reference to those of Malayalee heritage, we cannot be more specific. We can
however deduce from previous growth trends that in the last five years, this number
has at the very least doubled.

60
Sample
This sample of Malayalee cases (N :334) was collected specifically for this
research during the 1995-96 academic session. The participants were contacted
through the use of the Malayalee Telephone Directory as recorded by the Toronto
Malayalee Samajam Community Group. A total of 550 surveys were distributed and
343 were returned. Nine of the returned surveys were rejected due to inadequate
completion, this left a total sample of 334. Each participant was contacted initially by
phone, and upon giving consent to take part in the research, surveys were distributed to
the participants at home or at a more convenient agreed upon locale. There was a
62.3Yo return rate. While this was a fairly high rate of retum, it is reasonable to believe
that retums might have been higher if the questionnaire had not been so long, and had
the questions not been so personal.
According to the statistics from Karumanchery's 1990 study, T260 Malayalee
families reside in the Greater Toronto A¡eq (Malayalee Samajam, 1990). There was
an increase of over \00yo in the five years between the Mangalam and Karumanchery
studies. Assuming that a similar increase has taken place over the last frve years since
the Karumanchery study, the 1/ for this study would include approximat ely 60/o of the
Malayalee population in Toronto.
Instrument
The instrument for this study was an eight part, structured questionnaire.
The majority of the questionnaire was based on a survey design used by the Ethnic

6l
Identity Research Team during their 1970-71 study of University of Manitoba students
(Driedger, l97l). This questionnaire was designed to compare first and second
generation Malayalee attitudes and behaviors in order to see if their levels of ethnic
identity are comparable.
The questionnaire was distributed to all participating Malayalees in the Greater
Toronto Area. The Malayalee Samajam Telephone Directory was used to find
participants, and c¿Nes were chosen based on selection through a ra¡rdom numbers
table. Once contacted, each potential participant was assured that participation in the
survey was both voluntary and confidential. The survey was distributed with an
attached cover letter that explained the basic premise of the research, and it included
within each section, a brief introductory statement explaining how to complete each
section.
There are eight specific sections to the questionnaire, each
methodology and each focusing on relevant aspects of ethnic identity,
be outlined as follows:
using a specific
the sections may
PART 1) A Personal Inventory Section: It was here that we obtain all pertinentpersonal information with reference to the participant's family history and vitalstatistics. All independent variables used in the study are found in this section.
PART2) A 31 Question Likert Scale: This section \¡/¿rs based on a five point LikertScale, and it focuses on the dependent indicators of subjective eth;ic identityretention - Attitudes towards l) Parochial Education, 2) Ethnic Language Use,3) Ethnic Religion, 4) Endogamy, 5) Ingroup Friends, 6) Ethnic Oryanizations,7) Ethnic Territory, and 8) Ethnic Media and publications.
PART 3) Personal Inventory Section: Section three also tries to determine specificfacts about each participants feelings towards his\her ethnic heritage and

62
traditions. This section was designed to determine the degree to which theparticipant has undergone structural assimilation.
PART 4) A l5-Item Worschel Scale: Section four measures the general attitudes andaspirations of participants with respect to their ethnicity and the experience ofbeing a visible minority in Canada.
PART 5) A 23-Item Cultural Rating Scale: In section five, the participant respondswith respect to his/her attitudes about the Malayalee culture.
PART 6) A 23-Item Cultural Rating Scale: In section six, the participant respondswith respect to his/her attitudes about the canadia¡r culture.
PART 7) A S-Item Ethnic salience Scale: Section seven consists of a set ofmeasures to determine the nature of a participants subjective ethnic identity.
PART 8) A Questionnaire evaluation page: In this section, participants are able tocomment on their feelings about the study and the survey.
The data are drawn from sections I, II, and III of the survey (Appendix B).
Dependent Variables
Subjective Ethnic ldentity
Subjective ethnic identity can be defîned as the way in which an individual
views hisÆrer ethnic heritage, and the holding of positive attitudes toward the value of
that ethnicity. In this study subjective ethnic identity w¿ìs me¿ßured separately by six
indicators: parochial education, ethnic language, ethnic religion, endogamy, ingroup
friendships and ethnic organizations. Each indicator was operationally expressed in
terms of attitudes. Therefore, the dependent variables used with reference to
Malayalee subjective ethnic identity are all measured by attitudes toward the six
indicators.

63
All of the six indicators are measured on a frve point Likert-type scale
(Appendix B, Part II,) using attitudes towards their ingroup ethnicity, culture and
traditions. We analyzed the thirty-one Likert questions to determine if they met the
required assumptions for the statistical tests to be used in this research. The questions
that satisfred all the statistical assumptions were then chosen and composite attitudinal
scores were generated for each indicator of subjective ethnic identity. All of the scales
used to measure Malayalee attitudes were measured by three separate indicators
together in one composite scale.
VAR200 Parochial Education: The attitudinal scale measured how Malayalees
felt about parochial education with reference to their ability to help perpetuate ethnic
culture. Operationally, attitudes towards parochial education were measured on a 15
point scale, l-5,6-10 and 1l-15 indicating low, medium and high subjective ethnic
identity respectively (Appendix B, Part II, questions 2,3 and 4).
VAR201 Ethnic Language. The attitudinal scale measured how Malayalees felt
about their ethnic language in reference to their ability to help perpetuate ethnic
culture, language use outside of ingroup situations, and the importance of continued
ethnic language use. Attitudes towards Malayalam were defined in terms of the total
scores achieved on three of the Likert-type questions (Appendix B, Part II, questions
6,7 and 9). They were measured on a 15 point scale, 1-5, 6-10 and l1-15 indicating
low, medium and high subjective ethnic identity respectively.
VAR202 Ethnic Religion: The attitudinal scale measured how Malayalees felt
about their ethnic religion in terms of its symbolic, cultural and personal importance.

64
Religion is of fundamental importance to ingroup cohesion, and positive attitudes
towards ethnic religion can serve to strengthen group bonds even when other factors
suggest that ethnic identity is declining. Operationally, attitudes towards ethnic religion
were measured on a 15 point scale, 1-5, 6-10 and l1-15 indicating low, medium and
high subjective identity respectively (Appendix B, Part II, questions 12,13 and l4).
VAR203 Ethnic Endogamy: The attitudinal scale measured how Malayalees
felt about endogamy with reference to the following factors: the importance placed on
ethnicity when dating; the acceptability of out-group marriage; and the importance of
ingroup marriage for the preservation of ethnic culture and heritage. Operationally,
attitudes towards endogamy\¡/ere me¿Nured on a 15 point scale, l-5,6-10 and ll-15
indicating low, medium and high subjective ethnic identity respectively (Appendix B,
Part II, questions 16,17 & l B).
VAR204 Ingroup Friends: The attitudinal scale measured how Malayalees felt
about close ingroup friendships with reference to the following. the importance placed
on ingroup friendship; the value placed on the presence of ingroup friends; and the
preference for time spent with ingroup rather than out-group members. Operationally,
attitudes towards ingroup friendships were measured on a l5 point scale, l-5,6-10
and 1l-15 indicating low, medium and high subjective ethnic identity respectively
(Appendix B, Part II, questions 19,20 and22).
VAR205 Ethnic Organizations: The attitudinal scale measured how
Malayalees felt about their ethnic organizations in reference to the following factors:
the importance of involvement in such organizations; the benefit of being involved in

65
the affairs of one's own ethnic group and the narrowness of such organizations.
Attitudes towards Malayalam were defined in terms of the total scores achieved on
three of the Likert-type questions (Appendix B, Part II, questions 23,24 and 25). They
were measured on a 15 point scale, l-5, 6-10 and l1-15 indicating low, medium and
high subj ective ethnic identity respectively.
Objective Ethnic ldentity
Objective ethnic identity can be defined as the involvement and dedication that
individuals show towards their ethnicity and ethnic group. This was operationally
different from subjective indicators of ethnic identity in that behaviour was measured
rather than attitudes. This study measured objective ethnic identity by five indicators:
language proficiency in Malayalam; active participation in ethnic religion;
endogamous behavior and expectations related to ingroup marriage, active
participation and support of ethnic organizations; and ingroup friendships. Each
indicator was operationally expressed in terms of objective behavior. Some of the five
indicators were measured on a Likert-type scale (Appendix B, PartIII) and the others
were dichotomous variables. All of the variables used were tested to assure that they
meet the various statistical assumptions necessary for this study. The questions that
satisfied all the statistical assumptions were used to generate composite behavioural
scores for each indicator of objective ethnic identity. All of the scales used to analyze
Malayalee ethnocentric behavior were measured by separate indicators together in a
composite scale.

66
VAR2I0 Language Profîciency in Malayalam: This indicator was defined as
fluency in Malayalam, the ability to understand, read, write and speak in Malayalam.
Participants were grouped into one of three categories. They were measured on a 12
point scale, 1-4 indicating inability, 5-8 suggesting limited ability and 9-lZ indicating a
strong ability to use Malayalam. The composite measure was constructed from
responses to question 5 in Part III of the questionnaire.
VAR2l l Active Participation in Ethnic Religion: This indicator was defined as
dedication to and attendance at Malayalee church services. Participants \¡/ere grouped
into one of three categories. They were measured on a 12 point scale, 1-4 indicating
infrequent attendance, 5-8 suggesting moderate attendance and 9-12 indicating a
frequent attendance at ethnic church services. The composite measure v/¿rs
constructed from responses to question 20 ín Part III of the questionnaire. These
questions measure dedication to ethnic group religion and attendance at ethnic
religious services respectively.
Y AR2l2 Active Participation in Ethnic Organizations: This indicator was
defined as activity level in Malayalee ethnic organizations. Participants were grouped
into one of three categories. They were measured on a 12 point scale, 1-4 indicating
very inactive levels, 5-8 suggesting moderate activity levels and 9-12 indicating very
active participation in ethnic group organizations. The composite measure w¿Ìs
constructed from responses to question 23 in part III of the questionnaire.
VAR213 Endogamous Behavior: This indicator reflects dedication to the
tradition of endogamy and arranged marriage. Participants were grouped into one of

67
three categories. They were measured on a 6 point scale, l-3 reflecting low levels of
endogamous behavior, 4-5 suggesting moderate endogamous behavior and 6
indicating high endogatnous behavior. The composite measure was constructed from
responses to questions 79,83 and 84 in Pa¡t III of the questionnaire.
VAR6l Ingroup Friendships: This indicator was defrned as voluntary
involvement of Malayalees with members of their ethnic group. Operationally, this
indicator was measured by the number of the five closest friends that belonged to the
Malayalee community. Participants were grouped into one of six categories. They
were measured on a 3l point scale, 1-6 indicate that all five closest friends were
Malayalee, 7-l2verifythat4 of 5 closestfriendswereMalayalee, l3-18 denotethat3
out of 5, 19-24 indicate that 2 out of 5, 25-30 denote that only one of 5 were
Malayalee, and a score of 31 indicates that none of the respondents five closest friends
were Malayalee. The composite measure was constructed from responses to question
8 in Part III of the questionnaire.
Independent Variables
Four independent variables were used including gender, duration of stay in
Canad4 religious affiliation and generation of participant.
VAR4 Gender of Participant: Operationally, the gender of the respondent was
determined by his/her response to question 3 in part I of the questionnaire.
VART Duration of Stay: Operationally, duration of stay was determined by the
participant's response to question 7 in Part I of the questionnaire. The respondents

68
were grouped into categories dependent on their length of stay in Canada. Those
respondents whose duration of stay was (less than a year to 10 years), (11 to 25 years)
and (26 to 51 years) were respectively grouped into categories short, medium and long
duration of stay. Smaller groupings for the extreme cases of duration (ie. 0-5 and 40-
50 years) may have been more appropriate for the study. However, the limited sample
size, and the low numbers of participants at those extremes, made it statistically
difficult to work with such groupings.
VAR5 Religious AfFrliation: Religious affrliation was defrned as being
affrliated with any religious denomination. Operationally, religious affrliation was
determined by the participant's response to question 4 in Part I of the questionnaire.
For the purposes of this study four specifîc religious groups were to be studied, but
unfortunately, due to problems of sample size, we could study only the Roman
Catholic and Marthomite Malayalees. Religion has traditionally been a very strong
mechanism in the maintena¡rce of ethnic identity, and it will be of great interest to
determine the extent to which levels of ethnic identity will vary between these groups.
VAR176 Generation of Respondent: Operationally, the generation of the
respondent was determined upon reflection of hisiher age, and length of stay in
Canada. Respondents who were born outside of Canada but immigrated within their
frrst 5 years of life were considered to be second generation Malayalees. Since 15
years of age was the minimum requirement for inclusion in this research, the five year
stipulation would still allow for the great majority of their formative years to have been
spent in Canada.

69
Statistical Techiques
There were several statistical procedures used in the course of this study. The
type of tests and techniques employed were determined by the nominal and ordinal
nature of the independent and dependent variables. The test of proportions was used
in order to determine whether attitudinal indicator variables in the study behave as
interval level (Appendix A). Those dependent variables that were found to be suitable
were then used with reference to the independent variables in both ANOVA and MCA
operations.
Test of Proportions
Before conducting any type of ANOVA or MCA analysis of the attitudinal
measures used in this study, it was necessary to determine whether or not they behave
as interval level data. Most of the dependent variables in sections II through VI of the
survey were measured on Likert or other types of attitudinal scales, and most of those
items were measured on an ordinal level. In order to determine the extent to which
these variables approximate interval level measurement, a Spearman's rho correlation
was calculated against a Pea¡son's correlation for each of the dependent variables
against two independent interval level variables (age and duration of stay).
Spearman's rho is a statistical method for analyzing ordinal level variables, and
Spearman's corelation is a similar method used with reference to interval level data.
If a Spearman's rho and a Pearson's r were calculated for the same dependent variable,
and the difference between the two was found to be insignificant, then it follows that
the variable behaved as interval data. Simply subtracting the Spearman from the

70
Pearson is not sufficient to determine the level of signifrcant difference between the
two correlations. The test of proportions was used for this purpose.
The Z score in the test of proportions (Appendix A), determines whether there
was a significant level of difference between the two calculations. If the Z score was
below 2 for the dependent variable against both age and duration of stay, then it was
determined to act as interval data. If the Z score was below zero against only one of
the two independent variables, then that variable was cautiously accepted to act as
interval, these variables merit careful scrutiny. The variables that have Z scores above
2 against both independent variables were not used in analysis, as they cannot be
employed as interval leveldata.
ANOVA and MCA
ANOVA, an acronym for Analysis of Variance is a statistical technique used to
compare more than two group means. ANOVA is a simple extension of the T-test,
and like the T-test, it requires that the dependent va¡iables used in analysis were of
interval level measurement while allowing for any level of measurement with
reference to the independent variables. The ANOVA technique tests the null
hypothesis by determining if division of respondents based on their responses to the
independent variable will explain any va¡iance in the dependent variable (Dometrius,
1992:241-45).
The ANOVA technique is limited in its ability to develop relationships and
correlations, this problem was handled through the use of the Multiple Classification
Analysis. MCA is a powerful extension of ANOVA that allows for the establishment

7t
of both associations and relationships betrrueen variables. The MCA technique was
used in examining the interrelationships between several independent variables and an
interval level dependent variable. The MCA provides ETA and Beta coefficients as
well as Multiple R and R squared analyses which were used.
Hvpotheses
The following hypotheses were developed based on a review of all the relevant
literature with respect to ethnic identity retention and the Malayalee community in the
Greater Toronto Area. The first four hypotheses deal with the dependent variable,
subjective identity retention, as it was measured by the seven aforementioned ethnic
identity factors and the independent variables, gender, religion, generation, and
Duration of stay in Canada. The next four hypotheses deal with the dependent variable
objective ethnic identity retention as it was measured by the objective identity
indicators, and the same four independent variables.
FryPOTHESIS 1 Marthomite religious affîliation will be associated with higherpositive attitudes towards parochial education, ethnic language use, ethnicreligion, endogamy, ingroup friends, and participation in ingrouporganizations than Roman catholic religious affiliation.
HYPOTHESIS 2 Females and males will tend to be associated with similarpositive attitudes towards parochial education, ethnic language use, ethnicreligion, endogamy, ingroup friends, and participation in ingrouporganizations.
HYPOTHESIS 3 First generation respondents will score higher on positiveattitudes towards parochial education, ethnic language use, ethnic religion,endogamy, in-group friends, and participation in ingroup organizations thansecond generation respondents.

72
HYPOTHESIS 4 There will be a high negative association between duration ofstay in Canada and positive attitudes towards parochial education, ethniclanguage use, ethnic religion, endogamy, ingroup friends, and participation iningroup organizations.
HYPOTHESIS 5 With respect to: ability to use Malayalam, higher dedication andparticipation in ethnic religious services, levels of ingroup dating, numbers ofingroup friendships and participation in ingroup organizations, Marthomitereligious affrliation will be associated with higher positive levels of objectiveethnic identity than Roman Catholic Affrliation.
HYPOTHESIS 6 With respect to: ability to use Malayalam, higher dedication a¡rdparticipation in ethnic religious services, levels of ingroup dating, numbers ofingroup friendships and participation in ingroup organizations, females willtend to show higher levels of objective ethnic identity than males.
IIYPOTI{ESIS 7 With respect to: ability to use Malayalam, higher dedication andparticipation in ethnic religious services, levels of ingroup dating, numbers ofingroup friendships and participation in ingroup organizations, first generationMalayalees will tend to be associated with higher levels of objective ethnicidentity than second generation Malayalees.
HYPOTHESIS 8 With respect to: ability to use Malayalam, higher dedication andparticipation in ethnic religious services, levels of ingroup dating, numbers ofingroup friendships and participation in ingroup organizations, there will be ahigh negative association between duration of stay and levels of objectiveethnic identity.

73
CIIAPTER V
ANALYSIS OF DATA
An overview of the interactions between independent variables (generation,
religious affiliation, duration of stay, and gender), and dependent variables (parochial
education, ingroup language, ingroup religion, endogamy, ingroup friends and ingroup
organizations), suggests that a dichotomy can be drawn between attitudes and
behaviors as they relate to the six factors of ethnic identity (Table 5.1).
Considerable va¡iations exist in relation to the six identity factors and the
independent variable, religious affrliation. Marthomites consistently ranked much
higher than Roman Catholics in every behavioural category, and with the exception of
attitudes towards ingroup language and organizations, Marthomite attitudinal scores
ranked higher as well. The data suggest that there is a great deal of disparity
between Behaviour and attitude. Marthomite behaviour ranked higher than attitude in
relation to all of the factors, and Roman Catholics display similar tendencies in relation
to 3 of the six identity factors. Data in Table 5.1 tend to support the notion that
Religious affiliation is an important factor in increased levels of objective ethnic
identity. Furthermore, the data suggest that Marthomites tend to display higher levels
of both objective and subjective ethnic identity than Roman Catholics.

TABLE 5.1 INDEPENDENT VARIABLES (GENERATION, RELIGIOUS AI'FILIATION, DURATION OF STAY AIID GENDER) BYETENIC IDENTITY FACTORS
INDEPENDENTVARIABLE
RELIGIONRoman CatholicMarthomite
GENDERMaIeFemale
GENERATONlst Generation2nd Generation
DTJRATiONOF STAYShort (0-10)Medium (ll-25)Long (26-51)
GROUP¡/
TDENTTTY FACTORS (PERCENTAGES - HrcH POSTTTVE)
PAROCHIAL INGROUP INGROUPEDUCATION LANGUAGE RELIGION ENDOGAMY
Behaviour AJtitudes Behaviour Aftitudes Behaviour Anitudes Behaviour AÍitudes
208 (62.3yù6e (20.7%)
ts4 (46.1%)180 (53.e%)
203 (60.8%)r3r (3e.2%)
38 (t1.4%)230 (68.8%)64 (te.2%)
N/A 37.6 80.3 42.4
N/A 38.7 84.6 39.1
N/AN/A
32.236.5
N/A 38.4 96.5N/A 28.9 s0.0
N/A 4t.7 97.3
N/A 33.5 74.2N/A 3s.6 87.3
79.3 44.780.0 39.9
334
12.6 30.793.8 56.7
42.64l.t
33.8 40.3
29.0 35.2
INGROUPFRIENDS
Behaviour Attitudes
5t.440.540.6
44.2 27.4 44.1 31.'7
60.8 36.1 5s.0 34.8
36.9 46.2
23.3 24.4
49.1 32.t 49.2 34.050.0 29.6 41.6 30.9
27.833.622.6
INGROUPORGANTZATIONS
Behaviour Attitudes
52.635.335.9
75.5 46.7 65.913.5 9.2 12.3
70.0 44.4 63.942.5 25.0 41.862.5 41.8 43.9
20.4 33.387.1 23.2 d
41.5
18.6
35.131.434.9
35.8 30.132.4 28.1
36.4 4.212.3 2r.5
35.1 23.736.3 29.724.2 29.0

75
Substantial variations exist in relation to Generation and the six identity factors.
First generation Malayalees ranked considerably higher than second generation
Malayalees in every category. Attitudinal scores are comparable for several of the
factors, but behavioural scores, (with the exception of participation in religious
sewices), are completely divergent. Data in Table 5.1 suggest that second generation
Malayalees display considerably lower levels of ethnic identity retention than the first
generation.
With respect to the independent variable gender, in most cases, attitudinal
scores are consistent with those of behaviour. Disparities between attitude a¡rd
behaviour are found for both males and females in relation to the factors of endogamy
and ingroup language. However, these incongruities are likely due to generational
influence within the categories of gender, rather than the influence of gender alone.
Data in Table 5.1 do not tend to support the theory that females will display higher
levels of identity maintena¡rce tha¡r males. Considerable variations are present among
the six identity factors in relation to duration of stay. With only one attitudinal
exception, scores for short duration of stay a¡e consistently higher than the scores for
long duration of stay.
While the data in Table 5.1 does not present any overwhelming support for the
assimilationist theory that ethnic identity declines with time, some evidence does point
to a related conclusion. Second generation Malayalees do indeed appear to retain
some ethnic identifications, but which features are kept and which features a¡e

76
TABLE 5.2 THE ASSOCIATION BETWEEN RELIGIOUS AFFILIATION A¡ID SUBJECTIVEETHNIC IDENTITY
RELIGION LOW MED HIGH TOTAL ETA%%%N
PAROCHI,ÀL EDUCATION
CATHOLIC 2.0 60.4 37.6
MARTHOMITE 6.5 54.8 38.7 62 0.02
ETHNIC LANGUAGE
CATHOLIC 4.9 52.7 42.4 20s
MARTHOMITE 1.4 59.4 39.1 69 0.03
ETHNIC RELIGION
CATI{OLIC 5.9 63.4 30.7 zos
MARTHOMITE t.5 41.8 56.7 67 0.25
ENDOGAMY
CATHOLIC 18.3 54.3 27.4 tgl
MARTHOMITE 9.8 54.1 36.1 61 0.12
INGROTJP FRIENDS
CATHOLTC 7.3 61.0 31.7 20s
MARTHOMITE 7.2 58.0 34.8 69 0.03
ETHNIC ORGANIZATIONS
CATHOLIC 1.4 65.2 33.3 207
197
MARTHOMITE O.O 76.8 23.2 69 0.04

77
dropped seem to be. influenced by a desire to lose their 'more Indian'
behaviors and traits. This selection process may lead to a minimization of ethnicity,
favouring non-obtrusive, symbolic relationships with their heritage.
Relieious Affrliation
Subjeclive ldentity Factors
In hypothesis one, we state that Malayalee-Canadians affiliated with the Mar
Thoma Church will tend to be associated with higher levels of subjective ethnic
identity than those affiliated with the Roman Catholic Church. Data in Table 5.2 show
the relationships between religious affrliation and the indicators of subjective ethnic
identity for Marthomite and Roma¡r Catholic Malayalees in the GTA. Roman Catholic
and Marthomite Malayalees tended to indicate similar levels of subjective ethnic
identity. Table 5.2 suggests that the majority of both religious groups possess mid-
range levels of subjective ethnic identity with a tendency towards high ethnic identity.
The differences between the two groups as stated in hypotheses one, are not
fully supported by the data. The lack of notable disparity between group scores may,
in part, be attributed to the subjective nature of the attitudinal responses. The
hypothesis is based on the concept that Marthomites being no more or less religious
than Roman Catholics, would nevertheless, show higher levels of positive subjective
ethnic identity due to the more mainstream nature of the Roman Catholic religion in
Canada. We expect that Roman Catholics would show lower levels of ethnocentrism
and ethnic identity because of their ability to cross over to mainstream churches and

't8
TABLE 5.3 TIIE ASSOCIATION BETWEEN RELIGIOUS AFFILIATION AND STJBIECTTVEETHNIC IDENTITY WHEN CONTROLLING FOR GEI\TERATION
ROMÄNCATHOLIC M^A.RTHOMITE
GENER,{TION LOW MED HIGH TOTAL LOW MED HIGH TOTAL ETA%yo%¡/%%%¡/
PAROCHIAL EDUCATION
FIRST 2.8 52.8 44.4 18 6] 53.3 40.0 45 0.06
SECOND 1.r 69.7 29.2 89 5.9 58.8 35.3 17 0.00
ETHNIC LANGUAGE
FIRST 5.2 52.2 42.6 l 15 2.r 55.3 42.6 47 0.02
SECOND 4.4 53.3 42.2 90 0.0 68.2 31.8 22 0.04
ETHNIC RELIGION
FIRST 2.6 56.9 40.5 116 2.2 35.6 62.2 45 O.lE
SECOND l0. r 7r.9 18.0 89 0.0 54.5 45.5 22 0.27
ENDOGAMY
FIRST 3.7 5 r.4 44.9 r07 2.6 46.2 51.3 39 0.06
SECOND 35.6 57.8 6.7 90 22.7 68.2 9.1 22 0.10
INGROI.]P FRIENDS
FIRST 0.9 57.8 4r.4 116 4.3 53.2 42.6 47 0.01
SECOND 1s.7 65.2 r9.l 89 13.6 68.2 r8.2 22 0.00
ETHNIC ORGANIZATIONS
FIRST 0.9 59.8 3g.3 lr7 0.0 68. l 3 l .9 47 0.05
SECOND 2.2 72.2 25.6 90 0.0 95.5 4.5 22 0.16

'79
organizations more easily than Marthomites. This hypothesis did not take into
account the degree to which attitudes a¡e influenced by heritage, tradition and
symbolism. The data imply that regardless of objective ethnic identity levels, both
groups hold moderately high subjective ethnic identity.
The only statistically signifîcant difference between Catholic and
Marthomite attitudes, is in relation to their religious affrliations. The strength of the
Marthomite sacred canopy surely has a significant influence upon the interaction with
this specific ethnic identity factor. The results from our ANOVA I test (Appendix C),
suggest that the religious attitudinal me¿ms for Roman Catholics and Marthomites are
not equal. Further, with an ETA of 0.25 (showing a low correlation but a small
relationship), the cross tabulation in Table 5.2 suggests that in comparing the two
religious groups, Marthomites tend to show slightly higher levels of positive attitudes
towards their ethnic religion.
Further interactions between religious affiliation and our two independent
variables (generation and gender) were analyzed. In controlling for gender and
generation against religious afflrliation, the data suggest that further statistically
significant differences exist betr¡reen these two religious groups. While in most cases
attitudinal levels are quite consistent, correlation coeffrcients indicate other differences
between religious groups with respect to their attitudes towards ethnic religion.
An ETA of 0.27, (showing a low correlation, but a small relationship) in Table
5.3, indicates that second generation Marthomites display higher positive attitudes
towards their ethnic religion than do second generation Roman Catholics. High

80
TABLE 5.4 THE ASSOCIATION BETWEEN RELIGIOUS AFFILIATION ANDSUBJECTIVE ETENIC IDENTITY WHEN CONTROLLING FOR GENDER
GENDER
ROMAN CATIIOLIC
LOW MED HIGH TOTAL%%%N
MARTHOMITE
LOW MED HIGH TOTAL ETA%%%¡/
MALE
FEMALE
MAIE
FEMALE
MALE
FEMALE
MALE
FEMALE
MALE
FEMALE
MALE
FEMALE
53.4 40.9
51.7 44.O
PAROCHIAL EDUCATION
3.6 59.9 36.9 84
0.9 6t.6 37.5 ltz
ETHNIC LA¡IGUAGE
34
28
5.9
7.t
35
34
2.9
0.0
88
116
34
JJ
88
116
29
32
82
I14
0.03
0.05
35
34
34.3
35.3
89
u5
3580.0
73.5
0.0
0.0 38.2 61.8
3.0 45.5 51.5
58.8
50.0
45.7
73.5
0.0 62.1
18.8 46.9
2.9 62.9
I I.8 52.9
35.3
42.9
5I.4
26.5
37.9
34.4
0.03
0.00
0.10
0.10
0.30
0.16
0.14
0.08
0. l3
0.02
5.7
4.3
ETHNIC RELIGION
6.8 63.6 29.5
5.2 63.8 31.0
ENDOGAIVIY
9.8 61.0 29.3
24.6 50.0 25.4
TNGROUP FRIENDS
l.l 62.9 36.0
t2.2 60.0 27.8
ETHNIC ORGANIZATIONS
1.1 62.9 36.0 89
t.7 67.5 30.8 tL7
20.0
26.50.0 34

81
positive attitudes towards ingroup religion are shown by 45.5% of second
generation Marthomites, but only 19Yo of second generation Roman Catholics hold
similar attitudes. Interestingly, with respect to positive religious attitudes, first and
second generation Marthomites display comparable scores, but first generation Roman
Catholics show considerably higher scores than second generation Catholics (Table
5.3). These results indicate different patterns of religious identity maintenance and
decline.
Further variations in relation to religious affiliation are displayed in Tabl e 5.4.
An ETA of 0'30, (showing a low correlation, but a small relationship) suggests that
Marthomite males display higher positive attitudes towards their ethnic religion than
Roman Catholic males. Almost two-thirds (61.5%) of Marthomite males displayed
high positive attitudes towards ingroup religion, only 29.5o/o of Roman Catholic
males show similar attitude levels. Tables 2 through 4 indicate that the statistically
significant associations between religious affrliation, and the six factors of subjective
ethnic identity, are limited to attiludes toward ethnic religion. The Beta coeffrcient of
0.22 in MCA 3 (Appendix D), indicates that when controlling for the other three
independent va¡iables, the correlation between religious affiliation and attitudes
towards ingroup religion shows a slight decline. However, an adjusted Beta of 0.22 is
still significant enough to suggest a low correlation and small relationship.
Our MCA 3 test also resulted in a Multiple R of 0.392, we suggest that there is
a moderate correlation between positive attitudes towards ingroup religion a¡rd the
four independent variables. This number also suggests that amoderate portion of the

82
total variance in attitudes can be associated with the varia¡rce in the independent
variables (particularly religious affrliation and generation). The Multiple R Squared
coeffrcient, suggests that l5.4Yo of the variance in attitudes towards religion can be
explained by the variance in the four independent variables.
Objective ldentity Factors
Hypothesis five states that Malayalee-Canadians affrliated with the Mar
Thoma Church will be associated with higher levels of objective ethnic identity than
those affiliated with the Roman Catholic Church. Data in Table 5.5 show that Roman
Catholic and Marthomite Malayalees display very dissimila¡ levels of objective ethnic
identity with reference to participation in and dedication to ethnic religion a¡rd ethnic
organizations. Marthomites show high levels of objective ethnic identity, while
Roman Catholics tend towards moderate levels of objective identity in relation to
participation in religious services and ethnic organizations.
The differences between the two groups as stated in hypothesis five, are
partially supported by the data. The hypothesis is based on the theoretical assumption,
that due to the religious center and strong sacred canopy of the Mar Thoma
community, Marthomites would display higher levels of positive objective ethnic
identity than Catholics. Most ethnic organizations (with exception of the Malayalee
Samajam) in the Malayalee community tend to be religion centered, and as a result,
association with, and participation in these types of organizations are greatly
influenced by dedication to ingroup religion. Differences in Marthomite and Roman
catholic dedication to ingroup religion are reflected in this way.

83
TABLE 5.5 THE ASSOCIATION BETWEEN RELIGIOUS AFFILIATION AND INDICATORSOF OBJECTIVE ETHNIC IDENTITY
RELIGION LOW MED HIGH TOTAL ETA%%%¡/
ETHNIC LAI{GUAGE PROF'ICMNCY
CATHOLIC 7.1 12.6 80.3 198
MARTHOMITE 6.2 9.2 84.6 65 0.13
PARTICIPATION IN ETHNIC RELIGIOUS SERVICES
CATHOLIC 37.4 50.0 t2.6 206
MARTHOMITE 0.0 6.2 93.8 65 0.72
PARTICIPATION IN ETHNIC ORGANIZATIONS
CATHOLIC 5.8 73.8 20.4 206
MARTHOMITE 0.0 I2.g 87.1 62 0.63
ENDOGAMOUS BEHAVIOR
CATHOLIC 6.7 4g.t 44.2 tsl
MARTHOMITE 2.0 37.3 60.8 51 0.17
CHOICE OF INGROT]P FRIENDS
CATHOLIC MARTHOMITE TOTAL ETA%
O MALAYALEE FRIENDS 18.6
I MALAYALEE FRIEND 14.4
2 MALAYALEE FRIENDS I3.3
3 MALAYALEE FRIENDS 9.6j
: 4 MALAYALEE FzuENDS II.7
5 MALAYALEE FRIENDS 32.4
%
3.30
|.7
13.3
16.7
10.0
45.0
r52
N
37 0.01
34
28
28
88
212TOTAL ¡/ 60

84
The results from ANOVA VIII (Appendix C), suggest that Marthomites are
considerably more active than Roman Catholics in their ethnic religious services.
With a high ETA of 0.72 shown in Table 5.5, we see that Marthomites show
significantly higher levels of positive religious ethnocentric behaviour. As previously
suggested, these results may be partly attributed to the structural assimilation of
Roman Catholics into Canadian society, (displayed in their large-scale entrance into
mainstream Roman Catholic churches), and to the cohesive tradition of the
Marthomite religious group. Whatever the intervening variables may be, the results
show that 93.8o/o of Marthomites in the sample score high levels of ethnocentric
behaviour in contrast to only 12.6% of Catholic Malayalees. This contrast in
religiosity is one of our strongest fîndings.
In analyzing the data in Table 5.5, the expected association between
participation in ethnic organizations and religious affiliation a-re also strongly
supported. The results from ANOVA IX (Appendix C), indicate that the mea¡rs for
Roman Catholics and Marthomites are dissimilar in relation to their participation in
ethnic organizations. Further, the MCA analysis produced a high ETA of 0.63,
indicating a moderate correlation and a substantial relationship. Table 5.5 suggests that
in comparing the two religious groups, Marthomites show significantly higher levels of
ethnocentrism than Roman Catholics with respect to their ethnic religion.
Comparing religious affiliation and controlling for gender and generation, we
see that there are significant differences between Marthomites and Catholics.
Marthomite objective identity levels are high for all of the identity factors, the

85
strongest being participation in ethnic religious services and organizations.
Conversely, Roman Catholics display moderately high objective identity levels, with
distinct declines with respect to participation in ethnic religious services and
organizations.
In controlling for generation, Table 5.6 shows several high ETA scores
involving religious affiliation and the five objective identity factors. First generation
Marthomites display significantly higher scores than fîrst generation Catholics in two
of five objective identity factors, and second generation Marthomites also rank higher
than second generation Catholics in three of the five indicators.
An ETA of 0.63, (suggesting a moderate correlation, and a marked
relationship) in Table 5.6, indicates that first generation Marthomites are considerably
more involved and active in their religious services tha¡r first generation Roman
Catholics. Most first generation Marthomites (95.5%) participate in religious services,
while the same is the case for only l7.2o/o of frrst generation Roman Catholic
Malayalees. With an ETA of 0.66, relationship), data in Table 5.6 also indicate
that second generation Marthomites (95.5%) display considerably higher levels of
religious participation than second generation Roman Catholics (6.7%). These results
indicate that Marthomites have signifrcantly higher religious identification and
maintenance than Catholics.
Two substantial coefücients were also calculated in relation to religious
affiliation and participation in Malayalee organizations. An ETA of 0.61, (suggesting
a moderate correlation, and a marked relationship), in Table 5.6, indicates that first

86
TABLE 5.6 TIIE ASSOCIATION BETWEEN RELIGIOUS AF'FILIATION A¡ID OBJECTIVE ETH¡TICIDENTITY WHEN CONTROLLING FOR GE¡I"ERATION
GENERATION
ROMAN CATHOLIC
LOW MED HIGH TOTAL%%%N
MARTHOMITE
LOW MEDo/o %
HIGH TOTAL%N
ETA
ETHNIC LANGUAGE PROFICIENCY
FIRST
SECOND
FIRST
SECOND
FIRST
SECOND
FIRST
SECOND
0.0 1.7 98.3
t7.3 28.4 54.3
33.6 49.t 17 .2
42.2 51.1 6.7
5.2 75.7 19.1
6.6 7t.4 22.0
2.1 4.3 93.6
t6.7 22.2 6 t.l
0.0 4.5 95.5
9.5 90.s
116
90 0.0
l 15 0.0
0.0
117
8l
47
18
44
21
41
2l
33
l8
0.14
0.03
0.63
0.66
0.61
0.46
0.15
0.06
PARTICIPATION IN ETHMC RELIGIOUS SERVICES
PARTICIPATION IN ETTINIC ORGANIZATIONS
ENDOGAMOUS BETIAYIOR
0.0 26.4 73.6
r4.l 74.4 I1.5
CHOICE OF INGROT]P FRIENDS
0.0
5.6
9l
87
78
9.8 90.2
19.0 8 I .0
12.1 87.9
83.3 I I .l
O MALAYALEE FRIENDS 4.7
I MALAYALEE FRIEND 3.7
2 MALAYALEE FRIENDS 10.3
3 MALAYALEE FRIENDS IO.3
4 MALAYALEE FRIENDS 16.8
5 MALAYALEE FRIENDS 54.2
TOTAL N IO7
ETA O.O2
FIRSTGENERATION
ROMANCATTIOLIC MARTHOIVIITE
0.0
7.3
9.8
t7.l
7.3
58.5
4t
SECOND GENERATON
ROMANC^ATHOLIC MARTHOMITE
37.0 10.5
28/ 2r.1
17.3 2r.r
8.6 15.8
4.9 15.8
3.7 15.8
8t 19
0.32

87
generation Marthomites are considerably more involved and active in Malayalee
organizations than are frrst generation Roman Catholics. Only l9.lo/o of first
generation Roman Catholics show high levels of participation in ethnic organizations,
while 90.2% of frrst generation Marthomites do.
The ETA of 0.46 Table 5.6 indicates that second generation Marthomites are
considerably more active in Malayalee organizations than second generation Roman
Catholics; 2.0o/o of second generation Catholics show high levels of participation in
Malayalee organizations, in comparison to 81.0% of second generation Marthomites.
Most Malayalee organizations are religion centered, therefore, a considerable amount
of the variation between groups, can be tied to factors of religious
commitment and identification.
Hypothesis five is partially supported by the data in relation to religious
affrliation and choice of Malayalee friends. An ETA of 0.32, denotes that second
generation Marthomites tend to reflect higher ingroup choice than Catholics. The
data in Table 5.6 show that moderately-high levels of ingroup choice are displayed by
47.4% of second generation Marthomites, but only 17.2o/o of second generation
Catholics show similar levels. In all cases in Table 5.6, we see that Marthomite
religious affrliation is associated with signifrcantly higher levels of religious
identification and identity maintenance, than Roman Catholics. In controlling for
gender, we see several high ETA scores in Table 5.7 involving religious affrliation and
the five objective identity factors. Both male and female Marthomites display
significantly higher scores than male and female Catholics in two of five objective

88
identity factors. These ETA scores in Table 5.6 show the contrasting levels of
Marthomite and Catholic religious identification.
The data in Table 5.7, (ETA of 0.68), show that male Marthomites are
considerably more involved and active in their religious services than male Roman
Catholics. High levels of participation in religious services are displayed by 94.3o/o of
male Marthomites, in contrast to only I2.4% of male Catholics. We also see that
female Marthomites (93.3o/o) are much more involved in their religion than female
Roman Catholics (12.1%).
Two substantial coeffrcients were also calculated in relation to religious
affrliation and participation in Malayalee organizations. An ETA of 0.61, (suggesting
a moderate correlation, and a marked relationship), in Table 5.7, indicates that male
Marthomites are considerably more involved and active in Malayalee organizations
than a¡e male Roman Catholics. Only I9.5Yo of male Roman Catholics display high
levels of participation in Malayalee organizations, in contrast, 90.3% of male
Marthomites display similar levels. With an ETA of 051, (indicating a farr
correlation, and moderate relationship), Data in Table 5.7 indicates that female
Marthomites are also considerably more active Malayalee organizations than
female Roman Catholics. Only 22.3Yo of female Catholics display high levels of
participation in Malayalee organizations, 83.9% of female Marthomites show similar
behaviour.
Tables 5.5 through 5.7 indicate that the statistically significant associations
between religious affiliation, and the five factors of objective ethnic identity, tend to

89
TABLE 5.7 THE ASSOCIATION BETWEEN RELIGIOUS AFFILIATION AND OB.IECTIVE ETIINICIDENTITY WHEN CONTROLLING FOR GENDER
GENDtr,R
ROMAN C.A,TTIOLIC
LOW MED HIGHo/o o/o o/o
TOTAL
MARTHOMITE
LOW MEDo/o o/o
TOTAL ETAÀI
HIGHo/o
ETIINIC LANGUAGE PROFICIENCY
3.6 16.7 79.8lvfALE
FEMALE
lvlALE
FEMALE
MALE
FEMALE
MALE'
FEMALE
O MALAYALEE FRIENDS
1 MALAYALEE FzuEND
2 MALAYALEE FRIENDS
3 MALAYALEE FRIENDS
4 MALAYALEE FRIENDS
5 MALAYALEE FRIENDS
TOTAL N
ETA
80.6
84
ll3
0.01
0.05
0.68
0.62
0.19
0.t2
3.1
81.83.0
PARTICIPATION IN ETIINIC RELIGIOUS SERVICES
34.8 52.8 t2.4 89 0.0
0.039.7
PARTICIPATION IN ETHNIC ORGA¡IIZATIONS
4.6 75.9 19.5 87 0.0
6.8 72.9
30l16
0.0
6.7
36.4
37.9
94.3
93.3
63.6
58.6
0.61
0.5 t3l
90.3
l6.l0.0il8
ENDOGAMOUS BEHAVIOR
2.9 54.4 42.6 68
CIIOICE OF INGROUP FRIBNDS
),,
45.49.2
MALE
ROMANCATHOLIC
o/o
20.3
15.2
8.9
5.1
8.9
4 1.8
79
0.14
MARTHOMITEo/o
0.0
12.9
t2.9
22.6
9.7
4t.9
31
FEMALE
ROMANCATHOLIC
o/o
17.6
13.9
t6.7
13.0
13.9
25.0
108
0.rE
MARTHOMITEo/o
6.9
10.3
13.8
10.3
I0.3
48.3
29

90
focus around religious dedication. Degree of religious commitment and participation,
influences participation in Malayalee religious organizations, which in turn, reflects
upon ingroup cohesion and choice. Tables 5.5 through 5.7 reflect that Marthomite
religious affiliation is associated with higher degrees of religious dedication
and commitment than Roman catholic.
There are three pertinent Beta coeffîcients for the association between religious
affiliation and the objective factors of ethnic identity. The Beta coefficient of 0.71 in
MCA 8 (Appendix D), indicates that when controlling for the other three independent
variables, there is still a strong correlation between religious affrliation and
participation in Malayalee religious services. A Multiple R coefficient of 0322 for
this interaction ca¡r be interpreted to suggest that there is a strong correlation between
ethnocentric religious behaviour and the four independent variables. This number
also suggests that a large portion of the total variance in behaviour can be associated
with the variance in the independent variables (with particular emphasis on religious
affrliation). The Multiple R Squared coefficient indicates 52.1% of the variance in
ethnocentric religious behaviour can be associated with the variance in the four
independent variables.
The Beta coefficient of 0.62 in MCA 9 (Appendix D), indicates that when
controlling for the other three independent variables, there is still a moderately high
correlation between religious affrliation and participation in Malayalee organizations.
We can interpret the Multiple R coefficient of 0.629 to suggest that there is a
moderately high correlation between participation in ethnic organizations. and the four

9l
independent variables. Furthermore, the R also suggests that a large portion of the
total variance in behaviour can be associated with the va¡iance in the independent
variables (with particular emphasis on religious affiliation). The Multiple R Squared
coefficient indicates 395% of the variance in ethnocentric religious behaviour can be
associated with the variance in the four independent variables.
While the ETA of 0.32 in Table 5.6 indicates a low correlation and a small
relationship between religious affrliation and ingroup choice, the Beta coefficient of
0.04 in MCA I I (Appendix D), indicates that when controlling for the other three
independent variables, the correlation between religious affrliation and ingroup choice
declines. The Multiple R coeffîcient of 0.263 reflects that only a very small
relationship exists between ingroup choice and the four independent variables. The
Multiple R Squared coefficient indicates that only 6.90/o of the variance in ingroup
choice of friends can be associated with the variance in the four independent variables.
htterpretaliotts
Religious affrliation plays a substantial role in our understanding of ethnicity
and ethnic identity retention/maintenance. Behavioural a¡rd attitudinal variations
concerning parochial education, religion, ethnic organizations, and choice of ingroup
friends, can best be understood in the context of their relationships with religious
affiliation. Marthomites tend to display consistently high levels of ethnic identity, and
are set apart from Roman Catholic Malayalees by the strength of their sacred canopy,
and their strong sense of religious cohesion. The Marthomite community score higher
than Roman Catholic Malayalees in several objective identity factors; They display
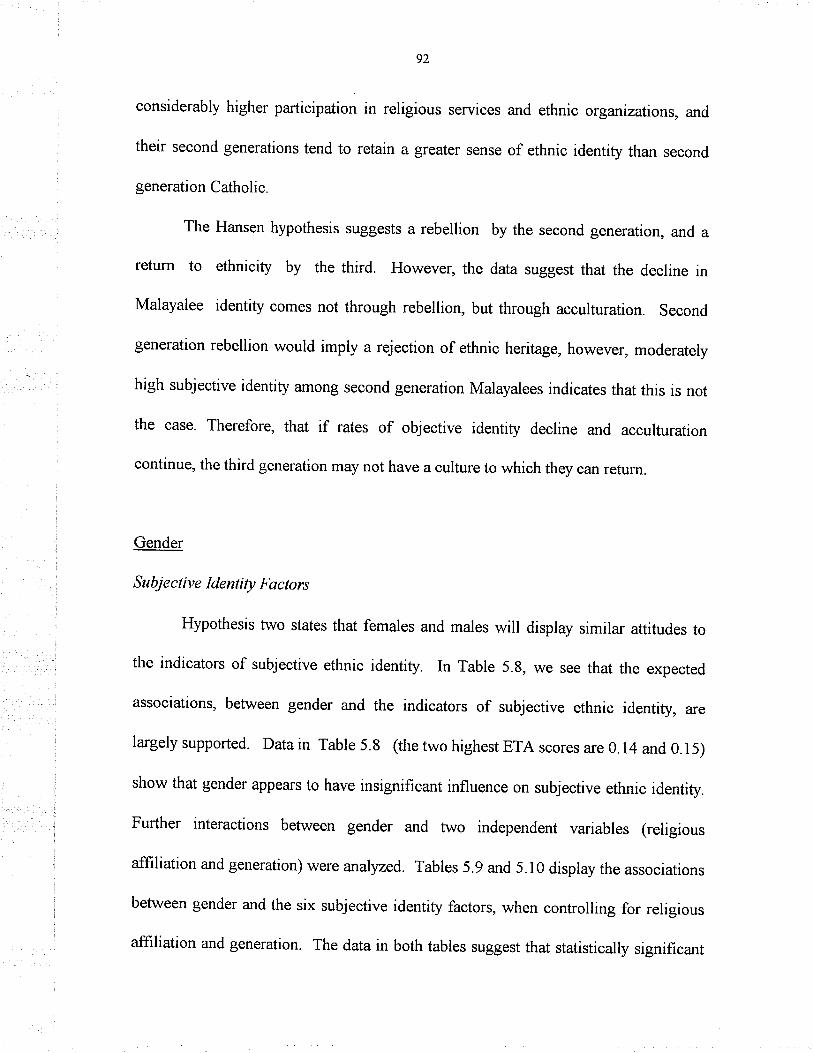
92
considerably higher participation in religious services and ethnic organizations, and
their second generations tend to retain a greater sense of ethnic identity than second
generation Catholic.
The Hansen hypothesis suggests a rebellion by the second generation, and a
return to ethnicity by the third. However, the data suggest that the decline in
Malayalee identity comes not through rebellion, but through acculturation. Second
generation rebellion would imply a rejection of ethnic heritage, however, moderately
high subjective identity among second generation Malayalees indicates that this is not
the case. Therefore, that if rates of objective identity decline and acculturation
continue, the third generation may not have a culture to which they can return.
Gender
Subjective ldentity Factors
Hypothesis two states that females and males will display similar attitudes to
the indicators of subjective ethnic identity. In Table 5.8, we see that the expected
associations, between gender a¡rd the indicators of subjective ethnic identity, are
largely supported. Data in Table 5.8 (the two highest ETA scores are 0.14 and 0.15)
show that gender appears to have insignifrcant influence on subjective ethnic identity.
Further interactions between gender and two independent variables (religious
affrliation and generation) were analyzed. Tables 5.9 and 5.10 display the associations
between gender and the six subjective identity factors, when controlling for religious
affiliation and generation. The data in both tables suggest that statistically significant

93
differences concerning gender and subjective ethnic identity factors, are few and
generally slight in nature.
In Table 5.9, high positive attitudes towards Malayalam are displayed by 5l.4yo
of Marthomite males, and only 26.5% of Marthomite females display simila¡ attitudes.
An ETA of 0.21 indicates that a low correlation and a small relationship exists in
relation to this interaction. While the statistical coeffîcient suggests a small
correlation, it should be noted that there do not appear to be any definite patterns
emerging with reference to these variables. This incongruity may be attributed, in part,
to the subjective nature of the attitudinal responses.
Data in Table 5.10 show the associations between gender and the six subjective
identity factors, when controlling for generation. The only statistically significant
coefficient concerns the interaction between gender and attitudes towards endogamy.
An ETA of 0.24 indicates that a low correlation and a small relationship exists
between second generation females and males, in relation to their endogamous
attitudes. The data denotes that high positive attitudes are held by 10.0% of second
generation males, only slightly higher than the 5.60/o of second generation females
that hold similar attitudes. This statistic contradicts the assertions made in Hypothesis
one. However, a possible explanation may be found with reference to the Hansen
Hypothesis and a backlash effect, resulting in the extreme movement of second
generation females against rigid cultural traditions of endogamy.
The Beta coefficient of 0.01 in MCA 2 (Appendix D), indicates that when
controlling for the other three independent variables, the correlation between gender

94
TABLE 5.8 THE ASSOCIATION BETWEEN GENDERAND INDICATORS OX'SUBJECTTVEETHNIC IDENTITY
GENDER LOW MED HIGH TOTAL ETA%%%N
MALE
FEMALE
MALE
FEMALE
MALE
FEMALE
MALE
FEMALE
MALE
FEMALE
MALE
FEMALE
PAROCHIAL EDUCATION
4.2 59.3 36.5
2.1 59.3 38.6
ETHNIC LANGUAGE
4.9 51.2 43.9
3.3 56.7 40.0
ETHNIC RELIGION
4.9 56.6 38.5
4.7 59.7 35.6
ENDOGAMY
7.2 61.3 31.5
23.3 49.3 27.4
INGROTIP F'RIENDS
1.6 62.9 35.5
l2.I 58.4 29.5
ETHNIC ORGANIZATIONS
0.6 67.7 31.5
1.3 68.9 29.8
118
140 0.03
r23
150 0.02
t22
r49 0.02
124
t49 0.14
ut
146 0.15
124
l5l 0.02
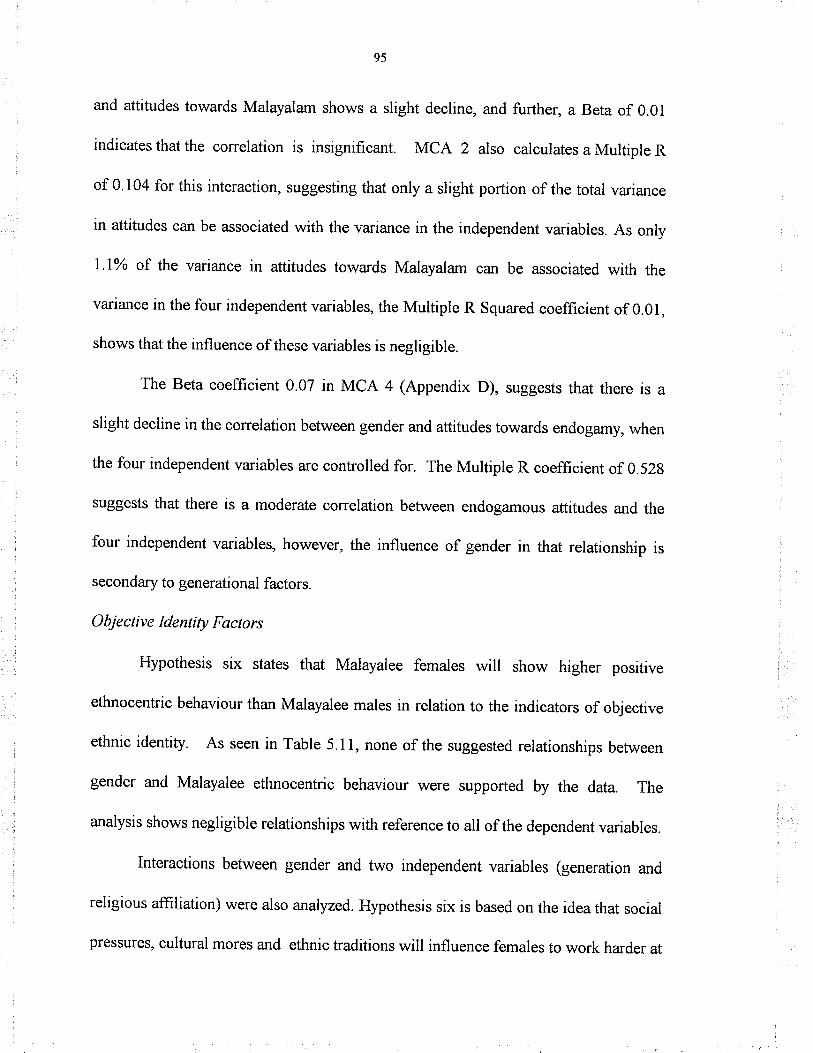
95
and attitudes towards Malayalam shows a slight decline, and further, a Beta of 0.01
indicates that the correlation is insignifîcant. MCA 2 also calculates a Multiple R
of 0'104 for this interaction, suggesting that only a slight portion of the total variance
in attitudes can be associated with the variance in the independent variables. As only
l.IYo of the variance in attitudes towards Malayalam ca¡r be associated with the
variance in the four independent variables, the Multiple R Squared coefficient of 0.01,
shows that the influence of these variables is negligible.
The Beta coefficient 0.07 in MCA 4 (Appendix D), suggests that there is a
slight decline in the correlation between gender and attitudes towards endogamy, when
the four independent va¡iables are controlled for. The Multiple R coefficient of 0.52g
suggests that there is a moderate correlation between endogamous attitudes and the
four independent variables, however, the influence of gender in that relationship is
secondary to generational factors.
Objeclive ldentity Factors
Hypothesis six states that Malayalee females will show higher positive
ethnocentric behaviour than Malayalee males in relation to the indicators of objective
ethnic identity. As seen in Table 5.11, none of the suggested relationships between
gender and Malayalee ethnocentric behaviour were supported by the data. The
analysis shows negligible relationships with reference to all of the dependent variables.
Interactions between gender and ¡wo independent variables (generation and
religious affrliation) were also analyzed. Hypothesis six is based on the idea that social
pressures, cultural mores and ethnic traditions will influence females to work harder at

96
TABLE 5.9 THE ASSOCIATION BET\ryEEN GENDERAND SUBJECTIVE ETHNICIDENTITY WHEN CONTROLLING F'OR RELIGIOUS AFFILIATION
MALE FEMALE
RELIGION LOW MED HIGH TOTAL LOW MED HiGH TOTAL ETAo/oo/o%¡/o/o%%N
PAROCHIAL EDUCATION
CATHOLIC 3.6 59.5 36.9 84
MARTI-IOMTE 5.9 58.8 35.3 34
ETIINIC LANGUAGE
CATHOLIC 5.7 53.4 40.9 88
MARTHOMTE 2.9 4s.7 51.4 35
ETHNIC RELIGION
CATHOLIC 6.8 63.6 29.5 88
MARTI{OMTE 0.0 38.2 61.8 34
ETIINIC ORGANIZATIONS
CATHOLIC l.l 62.9 36.0 89
MARTHOMITE 0.0 80.0 20.0 35
0.9 6 t .6 37 .5 112 0.03
7.1 50.0 42.9 28 0.05
4.3 51.7 44.0 116 0.03
0.0 73.5 26.s 34 0.21
5.2 63.8 31.0 I 16 0.02
3.0 45.5 51.5 33 0.12
1.7 67.5 30.8 tt7 0.05
0.0 73.5 26.s 34 0.07
ENDOGAMY
cArloLIC 9.8 61.0 29.3 82 24.6 50.0 25.4 tt4 0.t3
MARTI{OMITE 0.0 62.1 37.9 29 18.8 46.9 34.4 32 0.t7
INGROUP FRIENDS
CATHOLIC 1.1 62.9 36.0 89 12.2 60.0 27.8 115 0.16
MARTI{OMTE 2.9 62.9 34.2 35 I1.8 52.9 35.3 34 0.06

97
ethnic identity maintenance than males, however, hypothesis six is not supported by
the data. This concept is particularly significant with reference to second generation
females, as they are expected to pass on cultural traditions and resist forces of
assimilation. With respect to objective ethnic identity retention, second generation
females do consistently rank higher than second generation males. For each
indicator, high levels of ethnocentric behaviour are displayed by larger percentages of
females than males, but those differences were not statistically significant. Similarly, In
controlling for religious affrliation (Table 5.13), ETA coeffrcients ranging from 0.00 to
0.09 show that while males and females show comparable rankings in relation to every
indicator, any correlations are insignificant.
Inlerpretation
Research into South Asian gender disparities indicate that hiera¡chies of sex
and age are still prevalent in the home. Buchignani and Indra (1985), indicate that
women are expected to p¿tss on cultural traditions and nurture their South Asian
heritage in the new land. In this respect, women are often prevented from cutting their
hair, or dressing tn Canqdian clothing. These types of rigid constraints, are held in
place to ensure the reproduction of Indian culture, in what is sometimes a hostile
environment. (Buchignani & Indr4 1985:158). Research suggests that Westemization
is often seen as a threat to gender relations in the home, as Western women are often
portrayed as being promiscuous, and of low morality. These types of cultural
constraints are placed upon men as well, but women (particularly young women) are
the main recipients (Das Gupr4 1994:64).
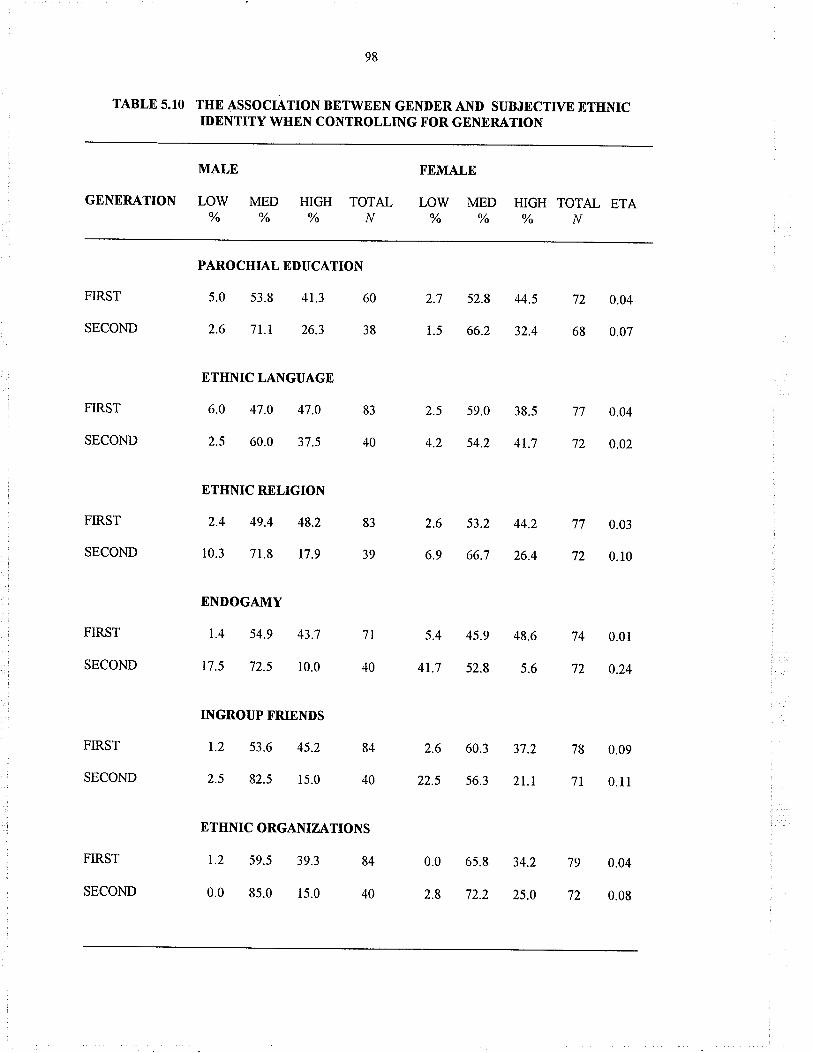
98
TABLE 5.TO THE ASSOCIATION BETWEEN GENDER AND SUBJECTIVE ETHNICIDENTITY WHEN CONTROLLING FOR GENERATION
MALE F'EMALE
GENERATION LOW MED HIGH TOTAL LOW MED HIGH TOTAL ETA%%%¡/%y"%N
PAROCHIAL EDUCATION
FIRST 5.0 53.8 4t.3 60 2.7 52.8 44.5 72 0.04
sEcoND 2.6 7l.t 26.3 38 1.5 66.2 32.4 68 0.07
ETHNIC LANGUAGE
FIRST 6.0 47.0 47.0 83 2.5 59.0 38.5 77 0.04
SECOND 2.5 60.0 37.5 40 4.2 54.2 4t.7 72 0.02
ETHNIC RELIGION
FIRST 2.4 49.4 48.2 83 2.6 53.2 44.2 77 0.03
sEcoND 10.3 71.8 17.9 39 6.9 66.7 26.4 72 0.10
ENDOGAIVIY
FIRST t.4 54.9 43.7 7t 5.4 45.9 48.6 74 0.01
SECOND t7.5 72.5 10.0 40 4t.7 52.8 5.6 72 0.24
INGROUP F'RIENDS
FIRST 1.2 53.6 45.2 84 2.6 60.3 37.2 78 0.09
sEcoND 2.5 82.5 15.0 40 22.5 56.3 zr.t 7t 0. t I
ETHNIC ORGANIZATIONS
FIRST 1.2 59.5 39.3 84 0.0 65.8 34.2 79 0.04
SECOND 0.0 85.0 15.0 40 2.8 72.2 25.0 72 0.08

99
TABLE 5.11 THE ASSOCIATION BETWEEN GENDERAND INDICATORS OFOBJECTTVE ETHNIC IDENTITY
GENDER LOW MED HIGH TOTAL ETA%%%¡/
ETHNIC LANGUAGE PROF'ICIENCY
MALE s.2 31.9 62.s 116
FEMALE 10.3 35.6 54.I 146 0.1I
PARTICIPATION IN ETHNIC RELIGIOUS SERVICES
MALE 2s.0 39.s 35.5 124
FEMALE 31.5 39J 28.8 146 0.08
PARTICIPATION IN ETHNIC ORGANIZATIONS
MALE 3.4 58.5 38.1 118
FEMALE 5.4 61.1 33.6 t4g 0.06
ENDOGAMOUS BEHAVIOR
MALE 2.2 s0.0 47.8 90
FEMALE 7.9 43.7 48.4 126 0.04
CITOICE OF' INGROIJP FRIENDS
O MALAYALEE FRIENDS
I MALAYALEE FRIEND
2 MALAYALEE FzuENDS
3 MALAYALEE FRIENDS
4 MALAYALEE FzuENDS
5 MALAYALEE FRIENDS
MALE FEMALE TOTAL ETA%%N
14.5 15.3 37 0.07
14.5 l3.l 34
10.0 16.1 33
10.0 t2.4 28
9.1 t3.l 28
41.8 29.9 87
110 t37 247TOTAL N

100
These findings, while likely accurate in relation to the South Asian community
in general, cannot, and do not reflect the reality of gender relations in the Malayalee
community. While female, and particularly young females, undoubtedly feel some
pressures to resist Westernization, the oppressive cultural features noted by
Buchignani are not a determining factor in the Malayalee household with respect to
ethnic identity. Malayalee females are encouraged to pursue higher education as are
young Malayalee males, and they tend to compete both academically and economically
with other Malayalees, and with the Canadian population in general. While issues of
sexism and gender disparity must be addressed as aspects of Malayalee culture, these
factors appear to have little influence with respect to ethnic identity. In most cases,
male and female Malayalees, both first and second generation, show similar levels of
both subjective and objective ethnic identity.
Hypotheses two and six were developed under the premise, that cultural
pressures to resist Westemization would be directed at young females more so than
young males. While this may be true, the Malayalee family's hybrid form (between
Canadian and India¡r culture), leaves greater room for women to acculturate to
Western norms. First generation Malayalees have undergone a certain amount of
assimilation themselves, as a result, cultural pressures upon second generation females
have lessened considerably. Regardless of any intervening variables, ultimately, the
data in this resea¡ch indicate that gender is not an influential factor with respect to
Malayalee identity retention.

101
TABLE 5.12 THE ASSOCIATION BETWEEN GENDERAND OBJECTTVE ETHNICIDENTITY WHEN CONTROLLING T'OR GENERATION
MALE
GENERATION LOW%
MED HIGH%Y"
TOTALN
FEMALE
LOW MED HIGH TOTAL ETA%%%¡/
FIRST
SECOND
FIRST
SECOND
FIRST
SECOND
FIRST
SECOND
O MALAYALEE FRIENDS
I MALAYALEE FRIEND
2 MALAYALEE FRIENDS
3 MALAYALEE FRIENDS
4 MALAYALEE FRIENDS
5 MALAYALEE FzuENDS
TOTAL ¡g
ETA
PARTICIPATION IN ETHNIC ORGA¡IIZATIONS
19.0 38.1 42.9 84
37.5 42.5 20.0 40
2.5 57.0 40.5 79
5.1 6t.s 33.3 39
ENDOGAMOUS BEHAVIOR
0.0 29.8 70.2 s7
6.1 84.8 9.1 33
CHOICE OF INGROUP FRMNDS
ETHNIC LANGUAGE PROFICIENCY
I .2 I 1.9 86.9 84 0.0 5. I
15.6 84.4 0.0 32 22.4 71.6
PARTICIPATION IN ETHNIC RELIGIOUS SERVICES
79 0.15
67 0.01
75 0.14
71 0.06
30.7 36.0
32.4 43.7
5.3 60.5
5.5 61.6
0.0 15.9
15.9 71.4
94.9
6.0
JJ.J
23.9
34.2
32.9
76 0.08
73 0.01
63 0.I7
63 0.06
84. I
12.7
FIRST GENERATION
MALE F'EMALE
SECOND GENERATION
MÄLE F'EMALEVo
29.9
20.9
t9.4
11.9
10.4
'1.5
67
o/o
5.2
3.9
7.8
tr.7
13.0
58.4
77
0.30
o/o
t.4
5.7
t2.9
12.9
15.7
51.4
70
Vo
36.4
39.4
15.2
6.1
0.0
3.0
33
0.23

102
TABLE 5.13 TIIE ASSOCIATION BETWEEN GENDERAND OBJECTTVE ETHNICIDENTITY WHEN CONTROLLING FOR RELIGIOUS AFFILIATION
RELIGIONMALELOW MED%Yr
HIGH TOTAL%N
FEMALELOW MED HIGH TOTAL ETA%VoYr¡l
ETHNIC LANGUAGE PROFICIENCY
CATI{OLrC 3.6 16.7 79.8 84 9.7 9.7 80.6
MARTHOMITE 9.4 3.1 87.5 32 3.0 t5.2 81.8
PARTICIPATION IN ETHNIC RELIGIOUS SERVICES
39.7 48.3 tz.l
0.0 6.7 93.3
6.8 72.9
0.0 16.1
116 0.03
30 0.01
0.04
0.00
97 0.02
29 0.07
o/o
6.9
10.3
13.8
10.3
10.3
48.3
29
ll3
JJ
CATHOLIC 34.8 52.8 t2.4 89
MARTHOMITE O.O 5.7 94.3 35
CATHOLIC 4.6 75.9 l9.s 87
MARTHOMITE O.O 9.7 90.3 3I
ENDOGAMOUS BEHAVIOR
CATHOLIC 3.0 s4.4 42.6 68
MARTI{OMITE 0.0 36.4 63.6 22
CHOICE OF INGROTJP FRIENDS
PARTICIPATION IN ETHNIC ORGANIZATIONS
20.3 ll8 0.01
83.9 31 0.09
9.3 45.4
3.4 37.9
45.4
s8.6
FEMALE
O MALAYALEE FRIENDS
1 MALAYALEE FRIEND
2 MALAYALEE FzuENDS
3 MALAYALEE FRIENDS
4 MALAYALEE FRIENDS
5 MALAYALEE FRIENDS
ROMAN CATI{OLIC
MALE FEMALE
MARTHOMITE
MALE
o/o
0.0
12.9
12.9
22.6
9.7
4r.9
31
0.00
Vo
20.3
t5.2
8.9
5.1
8.9
41.8
o/o
17.6
13.9
16.7
13.0
r3.9
25.0
108TOTAL ¡T 79
ETA 0.06

103
Generation
Subjective ldentity Factors
Hypothesis three states that first generation Malayalees will show higher
positive attitudes toward subjective ethnic identity than second generation Malayalees.
As seen in Table 5.14, three of the suggested relationships between generation and
Malayalee attitudes were supported by the data. First generation Malayalees scored
higher than second generation Malayalees on ethnic religion, endogamy, and choice of
ingroup friends.
The results from ANOVA III (Appendix C), suggest that first and second
generation Malayalees hold different attitudes towa¡ds ingroup religion. With an ETA
of 0.25, the cross-tabulation in Table 5 14 suggests that in comparing the two
generations, first generation Malayalees tend to display higher positive attitudes
towards their ingroup religion. As previously suggested, this decline may be partially
attributed to the instability of the Malayalee Sacred Canopy. Whatever the intervening
may be, the data in Table 5.14 show that46.6Yo of fîrst generation Malayalees hold
high positive attitudes towards ethnic religion, in contrast to only 23.4% of the second
generation.
The data in Table 5.14 strongly supporrs hypothesis three. ANovA IV
(Appendix C), indicates that the means for first and second generation are not equal in
relation to endogamy, and first generation attitudes towards endogamy are
considerably higher than those of the second generation. An ETA coefücient of 0.52
indicates that a moderate correlation and a substantial relationship exist in relation to
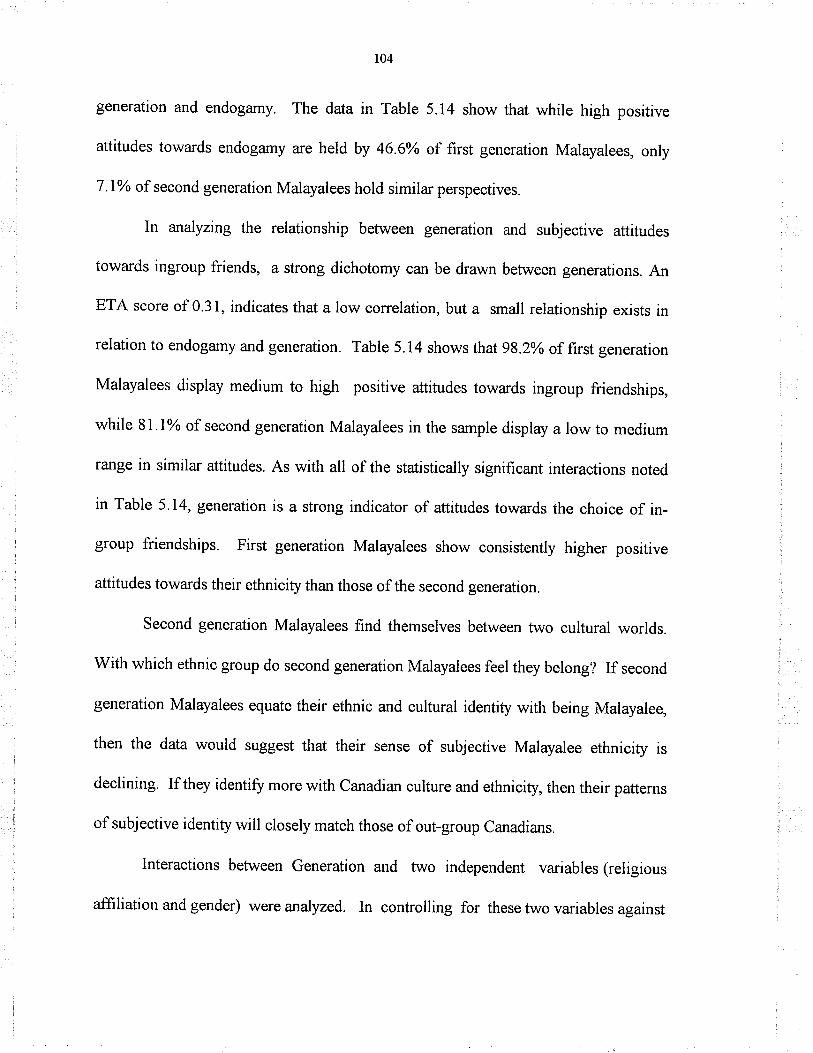
104
generation and endogamy. The data in Table 5.14 show that while high positive
attitudes towards endogamy are held by 46.6% of first generation Malayalees, only
7 .l% of second generation Malayalees hold similar perspectives.
In analyzing the relationship between generation and subjective attitudes
towards ingroup friends, a strong dichotomy can be drawn between generations. An
ETA score of 0.31, indicates that a low correlation, but a small relationship exists in
relation to endogamy and generation. Table 5.14 shows that 98.2o/o of first generation
Malayalees display medium to high positive attitudes towards ingroup friendships,
while 81.1% of second generation Malayalees in the sample display a low to medium
range in similar attitudes. As with all of the statistically significant interactions noted
in Table 5.14, generation is a strong indicator of attitudes towards the choice of in-
group friendships. First generation Malayalees show consistently higher positive
attitudes towards their ethnicity than those of the second generation.
Second generation Malayalees find themselves between two cultural worlds.
With which ethnic group do second generation Malayalees feel they belong? If second
generation Malayalees equate their ethnic and cultural identity with being Malayalee,
then the data would suggest that their sense of subjective Malayalee ethnicity is
declining. If they identifu more with Canadian culture a¡rd ethnicity, then their patterns
of subjective identity will closely match those of out-group Canadians.
Interactions between Generation and two independent variables (religious
affiliation and gender) were analyzed. In controlling for these two variables against

105
TABLE 5.14 TEE ASSOCIATION BETWEEN GENERATION A¡{D INDICATORS OFSUBJECTTVE ETHNIC IDENTITY
GENERATION LOW MED HIGH TOTAL ETA%%%N
PAROCHIAL EDUCATION
FIRST 3.9 s2.9 43.1 153
sEcoND 1.9 67.9 30.2 106 0.10
ETHNIC LANGUAGE
FIRST 4.3 53.I 42.6 162
sEcoND 3.6 56.3 40.2 tI2 O.ls
ETHNIC RELIGION
FIRST 2.5 50.9 46.6 161
sEcoND 8.1 68.5 23.4 111 0.2s
ENDOGAIVIY
FIRST 3.4 50.0 46.6 t46
SECOND 33.0 59.8 7.t rtz 0.52
INGROUP FRIENDS
FIRST 1.8 56.4 41.7 163
sEcoND 15.3 65.8 18.9 I l1 0.31
ETHNIC ORGANIZATIONS
FIRST 0.6 62.2 37.2 164
SECOND 1.8 76.8 2t.4 rLz 0.17

106
generation, the data indicate that a number of statistically significant variances exist.
In controlling for religious afflrliation, ETA scores ranged from 0.l2 to 0.52 for
attitudes towards ethnic religion, endogamy, ingroup friends and ethnic organizations.
Hypothesis three is partially supported in relation to ethnic religion. Data in
Table 5.15 display an ETA of 0.27 for ethnic religion. This coefficient (indicating a
low correlation, but a small relationship), suggests that second generation Roman
Catholics hold lower positive attitudes towards their ethnic religion than the first
generation. Of first generation Catholics, 40.5o/o display high positive attitudes towa¡ds
ingroup religion, and only 18.0% of the second generation reflect similar attitudes.
Table 5.15 displays two substantial coeffrcients in relation to endogamy. An
ETA of 0.52, indicates that there is a considerable disparity between Roman Catholic
generations. Of frrst generation Catholics, 44.9% hold high positive attitudes towards
endogamy, and only 6.7Yo of the second generation feel the s¿une. Further, with
an ETA of 0.47, data in Table 5.15 suggest that for endogamy, second generation
Marthomites also display considerably lower scores than frrst generation
Marthomites. Of first generation Marthomites, 51.3% hold high positive attitudes
towards endogamy, second generation Marthomites are considerably lower with only
9.1% holding similar attitudes.
For the interactions involving ingroup friends, hypothesis three is supported by
two significant coefficients. An ETA of 0.26 in Table 5.15, indicates that for
attitudes towards ingroup friendships, second generation Marthomites display lower

107
TABLE 5.15 THE ASSOCIATION BETWEEN GENERATION AND SUBJECTIVE ETHNICIDENTITY WHEN CONTROLLING FOR RELIGIOUS A-F'F'ILIATION
RELIGION
FIRST GENERATION
LOW MED I]iGH
SECOND GEIYERATION
LOW MED HIGH ETATOTALNo/o
TOTAL¡/
PAROCHIAL EDUCATION
2.8 52.8 44.4 108CATI]OLIC
MARTHOMTE 6.7 53.3 4O.O
ETHNIC LANGUAGE
CATHOLIC 5.2 52.2 42.6
MARTI]OMITE 2.1 55.3 42.6
ETHNIC RELIGION
2.6 56.9 40.5CATHOLIC
MARTI{OMITE 2.2 35.6
ENDOGAMY
3.7 51.4
62.2
CATHOLIC
MARTHOMITE
44.9
CATHOLIC
2.6 46.2 51.3
INGROTJP F'RIENDS
0.9 57.8 41.4
MARTHOMTE 4.3 53.2 42.6
ETHI\{IC ORGA}TIZATIONS
CATHOLIC 0.9 59.8 39.3
MARTHOMTE O.O 68.1 3I.9
Ll 69.7 29.2 89
175.9 58.8 35.3
53.3 42.2
68.2 31.8
10. I 71.9 18.0
0.0 54.5 45.5
22.7
65.2
68.2
72.2
95.5
25.6
4.5
45
0.13
0.02
0.27
0.12
0.52
0.47
0.32
0.26
0. l5
0.30
0.004.4
0.0
115
47 22 0.07
89
22
57.835.6
l16
45
107
39
)')
22
t9.I
18.2
t5.7
13.6
))
0.0
il6
47
17
47
6.7
229.1

108
scores than first generation Marthomites. Of first generation Marthomites, 42.6Yo
hold high positive attitudes towards ingroup friends, second generation Marthomites
are considerably lower with only 18.2% holding similar attitudes. Furthermore, with
an ETA of 0.32, data in Table 5.15 show that for ingroup friends, second generation
Catholics also display considerably lower scores than the first generation. Of first
generation Catholics, 41.4% hold high positive attitudes towards ingroup friendships,
but only 19.lyo of second generation catholics hold similar views.
For the interactions involving ethnic organizations, hypothesis three is only
partially supported by * ETA of 0.30. The data in Table 5.15 indicate that for
attitudes towards ingroup organizations, second generation Marthomites display lower
scores than first generation Marthomites. While 3I.9% of first generation
Marthomites hold high positive attitudes towa¡ds ethnic organizations, second
generation Marthomites are considerably lower with only 4.5yo holding similar
attitudes.
In controlling for gender, Table 5.16 displays several significant ETA
coefficients (ranging from 0.23 to 0.56) for attitudes towards ethnic religion,
endogamy, ingroup friends and ethnic organizations. The data indicate that second
generation males and females score consistently lower than first generations. These
results clarifr the data in Table 5.14, by showing that the generational decline noted in
the aforementioned table, is not skewed by any large gender differences.
Hypothesis seven is partially supported in relation to ethnic religion. Data in
Table 5.16 show an ETA of 0.31 for ethnic religion. This suggests that second

109
generation males hold lower positive attitudes towards their ethnic religion than the
first generation males. Of first generation males, 48.zYo display high positive attitudes
towards ingroup religion, and only 17.9yo of the second generation reflect similar
attitudes.
Table 5.16 displays two substantial coeffîcients in relation to endogamy. An
ETA of 0.42 indicates that there is a considerable disparity between male generations.
Of First generation males, 43.70/o hold high positive attitudes towards endogamy, and
only 10.0% of the second generation feel the same. Furthermore, with an ETA of
0'56, data in Table 5.16 suggest that for endogamy, second generation females display
considerably lower scores than first generation females. Of first generation females,
48.6Yo hold high positive attitudes towards endogamy, while the scores for
second generation females are considerably lower with only 5.6% holding similar
attitudes.
For the interactions involving ingroup friends, hypothesis seven is supported by
two significant coefficients. In Table 5.16, an ETA of 0.29 shows that for attitudes
towards ingroup friendships, second generation Females display lower scores than first
generation females. While 37.2% of first generation females hold high positive
attitudes towards ingroup friendships, only 2I.I% of second generation hold similar
attitudes. Furthermore, with an ETA of 0.29,data in Table 5.16 show that for ingroup
friends, second generation males also display considerably lower scores than the first
generation. Of first generation males, 45.2% hold high positive attitudes towards
ingroup friendships, and only 15.O% of second generation males hold similar views.

110
TABLE 5.16 THE ASSOCIATION BETWEEN GENERATION AND SUBJECTIVE ETENICIDENTITY WHEN CONTROLLING FOR GENDER
F'IRST GENERATION SECOND GENERATION
GENDER LOW MED HIGH TOTAL LOW MED HIGH TOTAL ETA% o/o o/o ¡/ o/o % % ¡/
PAROCHIAL EDUCATION
MALE 5.0 53.8 4r.3 80 2.6 7r.r 26.3 38 0.r 1
, FEMALE 2.8 52.8 44.4 72 1.5 66.2 32.4 68 0.10
ETHNIC LANGUAGE
MALE 6.0 47.O 47.0 83 2.5 60.0 37.5 40 0.05
FEMALE 2.6 59.0 38.4 78 4.2 54.2 41.7 72 0.01
ETHNIC RELIGTON
MALE 2.4 49.4 48.2 83 10.3 71.8 17.g 39 0.31
FEMALE 2.6 s3.2 44.2 77 6.9 66.7 26.4 72 0.r9
ENDOGAMY
MALE 1.4 54.9 43.7 7t 17.5 72.5 10.0 40 0.42
r FEMALE 5.4 45.9 48.6 74 4r.7 52.8 5.6 72 0.56t,
INGROT]P FRIENDS
'1 MALE r.2 53.6 45.2 84 2.5 82.5 15.0 40 0.2g
FEMALE 2.6 60.3 37.2 78 22.5 s6.3 21.1 71 o.zs
ETHNIC ORGANTZATIONS;.
' MALE t.2 59.5 39.3 84 0.0 85.0 15.0 40 0.23
FEMALE 0.0 65.8 34.2 7s 2.8 72.2 2s.0 72 0.r2

tll
For the interactions involving ethnic organizations, hypothesis seven is
only partially supported by an ETA of 0.23. The data in Table 5.16 indicate that for
attitudes towards ingroup organizations, second generation males display slightly
lower scores than first generation males. Of first generation males, 39.3yo hold high
positive attitudes towards ethnic organizations, only 15.Oo/o of second generation hold
similar attitudes.
There are four pertinent Beta coefficients for the association between
generation and the factors of subjective ethnic identity. Three indicate slight to low
correlations, only the Beta concerning endogamy, suggests a moderate to substantial
relationship. The Beta coeffrcients of 0.30 in MCA 3, 0.37 in MCA 5 and 0.25 in
MCA 6 (Appendix D), all indicate that when controlling for all independent variables,
a low correlation exists between ethnic religion, ingroup friends, ethnic organizations
and generation. Similarly, the Multiple R coeffrcients of 0.392 in MCA 3, 0.355 in
MCA 5, and 0.260 in MCA 6, all further the assertion that a small proportion of the
variance in these subjective indicators can be associated with the variance in the four
independent variables.
The Beta coefficient of 0.47 in MCA 4 (Appendix D), indicates that when
controlling for the other three independent variables, a moderately high relationship
continues to exist between generation and attitudes towards endogamy. Further, we
can interpret the Multiple R coefficient of 0.528 to suggest that there is a moderately
high correlation for the same interaction. The Multiple R Squared coefficient indicates
that27.9o/o of the variance in attitudes towards endogamy can be associated with the

tt2
TABLE 5.17 THE ASSOCIATION BETWEEN GENERATION A¡ID INDICATORS OF'OBJECTIVE ETHNIC II}ENTITY
GENERATION LOW MED HIGH TOTAL ETA%o/o%¡/
ETHNIC LAìIGUAGE PROFICIENCY
FIRST 0.6 8.5 90.9 t64
SECOND Z0.Z iS.B 4.0 sg 0.81
PARTICIPATION IN ETHNIC RELIGIOUS SERVICES
FIRST 24.4 36.9 38.8 160
SECOND 34.2 43.2 ZZ.s lll 0.17
PARTICIPATION IN ETHNIC ORGANIZATIONS
FIRST 3.8 s8.3 37.8 156
SECOND 5.4 61.6 33.0 tIz 0.06
ENDOGAIVIOUS BEHAVIOR
FIRST 0.0 22.5 77.5 r20
SECOND Iz.S 76.0 ll.5 s6 0.65
CEOICE OF INGROUP FRIENDS
GENERATION 1 GENERATION 2 TOTAL ETA%%¡/
O MALAYALEE FRIENDS
I MALAYALEE FRIEND
2 MALAYALEE FRIENDS
3 MALAYALEE FRIENDS
4 MALAYALEE FRIENDS
5 MALAYALEE FRIENDS
3.4
4.7
l0.l
12.2
14.2
55.4
148
32.0
27.0
18.0
10.0
7.0
6.0
100
37 0.64
34
33
28
28
88
248TOTAL /V
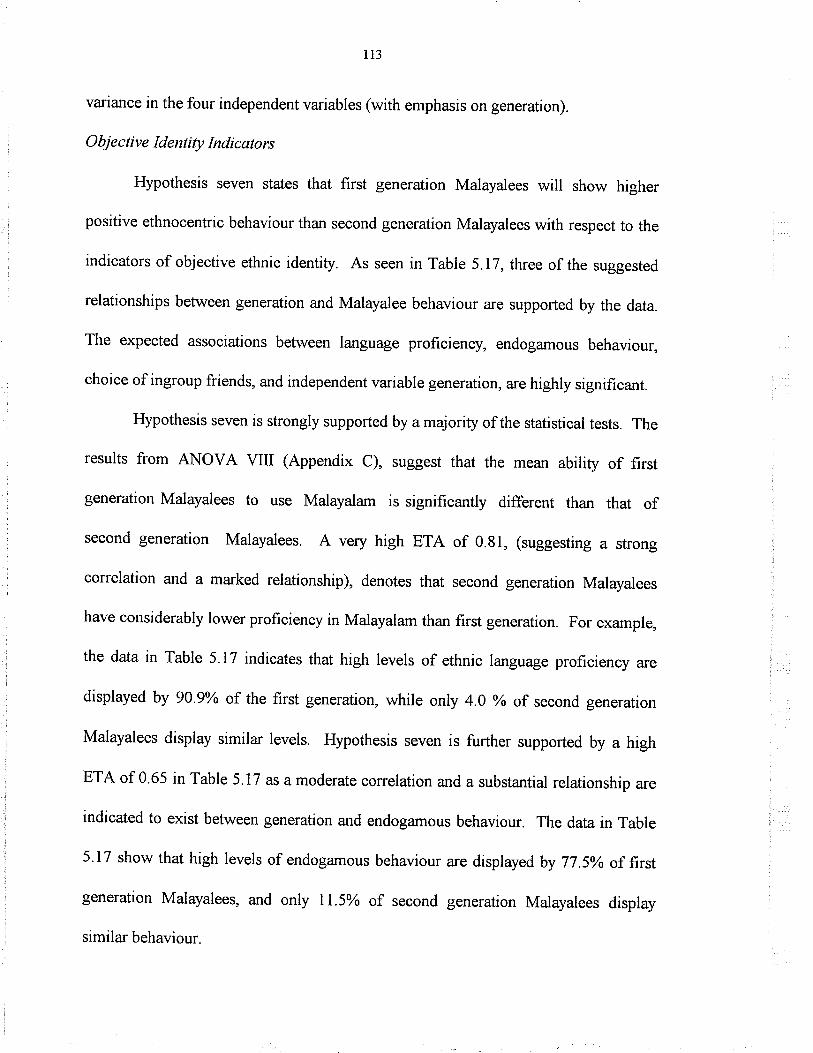
ll3
variance in the four independent variables (with emphasis on generation).
Objective Identity Indicators
Hypothesis seven states that first generation Malayalees will show higher
positive ethnocentric behaviour than second generation Malayalees with respect to the
indicators of objective ethnic identity. As seen in Table 5.17, three of the suggested
relationships between generation and Malayalee behaviour are supported by the data.
The expected associations between language proficiency, endogamous behaviour,
choice of ingroup friends, and independent variable generation, are highly significant.
Hypothesis seven is strongly supported by a majority of the statistical tests. The
results from ANOVA VIII (Appendix C), suggest that the mean ability of first
generation Malayalees to use Malayalam is significantly different than that of
second generation Malayalees. A very high ETA of 0.g1, (suggesting a strong
correlation and a marked relationship), denotes that second generation Malayalees
have considerably lower proficiency in Malayalam than first generation. For example,
the data in Table 5.17 indicates that high levels of ethnic language proficiency are
displayed by 90.9% of the first generation, while only 4.0 % of second generation
Malayalees display similar levels. Hypothesis seven is further supported by a high
ETA of 0 65 in Table 5.17 as a moderate correlation and a substantial relationship are
indicated to exist between generation and endogÉunous behaviour. The data in Table
5.17 show that high levels of endogamous behaviour are displayed by 77.5% of first
generation Malayalees, and only I l.5o/o of second generation Malayalees display
similar behaviour.

114
A substantial coefficient is calculated in relation to generation and choice of in-
group friends. An ETA of 0.64 in Table 5.17, indicates that first generation Malayalees
are considerably more disposed to ingroup friendships than are second generation
Malayalees. This indicator measures what percentage of an individuals five closest
friends are drawn from within the Malayalee community. The data in Table 5.17
indicates that 55.4Yo of fîrst generation Malayalees list other Malayalees as their five
closest friends, only 6.00/o of second generation Malayalees make the same assertion.
In controlling for religious affiliation, Table 5.18 displays several high ETA
coeffrcients for the cross-tabulations involving generation and the five objective
identity factors. Once again, the suggested relationship between generation and
Malayalee behaviour is supported by the dat4 as associations between language
proficiency, endogamous behaviour, choice of ingroup friends, and generation
produced highly significant coefficients. However, while only the interactions
involving the three aforementioned indicators proved to be statistically significant, first
generation Malayalees consistently ranked higher than second generation Malayalees
in all categories. Six strong coefficients were calculated in relation to generation and
behaviour when controlling for religious afflrliation.
Two substantial coefficients were calculated in relation to generation and
ethnic language proficiency when controlling for religious affiliation. ETA
coefficients of 0 38 and 0.51, (suggesting moderate correlations, and marked
relationships) were calculated for Marthomites and Catholics respectively. Data in
Table 5.18, indicate that fîrst generation Marthomites are considerably more proficient

Ir5
TABLE 5.18 THE ASSOCIATION BET\ilEEN GENERATION AND OBJECTIVE ETHNICIDENTITY WHEN CONTROLLING FOR RELIGIOUS AFFILIATION
RELIGION
FIRST GENERATION
LOW MED HIGH%%%
SECOND GENERATION
LOW MED HIGH TOTAL ETA%%%¡/
TOTAL¡/
ETIINIC LANGUAGE PROFICMNCY
CATHOLIC 0.0 1.7 98.3 t17
MARTHOMITE 2.T 4.2 93.6 47
CATHOLIC 33.6 49.1 17.2 116
MARTHOMITE O.O 4.5 95.5 44
CATHOLIC 5.2 75.5 l9.l 115
MARTTIOMITE O.O 9.8 90.2 4I
ENDOGA]VIOUS BEHAVIOR
CATI{OLIC 0.0 26.4 73.6 87
MARTHOMITE 0.0 tz.t 87.9 33
PARTICIPATION IN ETHNIC RELIGIOUS SERVICES
17.3 28.4 54.3 8l
16.7 22.2 61. t 18
42.2 5l.l 6.7 90
0.0 9.5 90.5 2r
6.6 71.4 22.0 9l
0.0 19.0 81.0 2t
l4.l 74.4 I 1.5 78
5.6 83.3 11.1 18
Vo
0.0
7.3
9.8
l7.t'1.3
58.5
4l
0.43
PARTICIPATION IN ETHNIC ORGANIZATIONS
0.51
0.38
0.14
0.09
0.01
0. l3
0.62
0.74
CHOICE OF INGROUP T'RIENDS
ROMAN CATHOLIC MARTHOMITE
FIRST GEN SECOND GEN FIRST GEN SECOND GENVo
O MALAYALEE FRIENDS 4.7
I MALAYALEE FzuEND 3.7
2 MALAYALEE FRIENDS IO.3
3 MALAYALEE FzuENDS IO.3
4 MALAYALEE FzuENDS 16.8
5 MALAYALEE FzuENDS 54.2
TOTAL A/ r07
o/o
37.0
28.4
17.3
8.6
4.9
3.7
8l
o/o
10.5
2t.t
2I.T
15.8
15.8
15.8
l9ETA 0.68

ll6
in Malayalam than second generation Marthomites. High levels of ethnic language
proficiency are displayed by 93.6% of first generation Marthomites, in contrast, 6l.l%o
of second generation Marthomites display simila¡ levels. In relation to the Roman
Catholic Malayalee community, data in Table 5.18 indicate that gB.3% of first
generation Malayalees display high language proficiency, and only 54.3% of the
second generation are as proficient.
Two strong coeffrcients were also calculated in relation to generation and
endogamous behaviour when controlling for religious affiliation. An ETA of 0.62 in
Table 5.18, indicates that first generation Roman Catholics are considerably more
endogamous tha¡r second generation Roma¡r Catholics. Statistics suggest that 73.6Vo of
first generation Catholics display high levels of endogamy, while only 11.5% of the
second generation display simila¡ results. Analogously, an ETA of 0.74 suggests that
first generation Marthomites are considerably more endogamous than the second
generation. Of the first generation, 87.9yo show high endogamous behaviour, in
contrast to only 1I.l% of the second generation, in this respect, rates and degrees of
generational decline appeff to be similar in both groups.
Two coefficients are also calculated in relation to generation and choice of
ingroup friends. ETA coefficients of 0.68 and 0.43 were calculated for Catholics and
Marthomites respectively. The data in Table 5.18 indicate that S4.Z% of first
generation Roman Catholics list other Malayalees as their five closest friends, in
contrast to only 3.7Yo of second generation Roman Catholics that do the same. An
analysis of the Marthomite community yields similar results. While 58.5% of first

IT7
generation Marthomites list other Malayalees as their five closest friends, only 15.B%
of second generation Marthomites make the same assertion.
In controlling for gender, Table 5.19 displays several high ETA coefficients for
the cross-tabulations involving generation and the five objective identity factors.
Associations between language proficiency, endogamous behaviour, choice of ingroup
friends, and independent variable generation produced highly significant coefficients
once again. Six strong coefficients were calculated in relation to generation and
behaviour when controlling for gender.
Two substantial coefficients were calculated in relation to generation and
ethnic language proficiency. ETA coeffîcients of 0.77 and 0.82 (both suggesting
moderate correlations, and marked relationships), were calculated for males and
females respectively. Data in Table 5.19, indicate that first generation males are
considerably more proficient in Malayalam than second generation males. High levels
of ethnic language proficiency are displayed by 86.9Yo of fîrst generation males, in
contrast, no second generation males display high proficiency in Malayalam. Table
5.19 indicates that 94.9% of first generation females display high language
proficiency, and only 6.0Yo of the second generation display similar levels. In this
respect, males and females are very similar.
Two strong coefficients were also calculated for generation and endogamy.
An ETA of 0.60, (suggesting a moderate correlation, and a substantial relationship), in
Table 5.19, indicates that first generation males are considerably more endogamous

118
TABLE 5.19 THE ASSOCIATION BETWEEN GENERATION AND OBJECTIVE ETHNICIDENTITY WHEN CONTROLLING FOR GENDER
GENDER
FIRST GENERATION
LOW MED HIGH%%o/o
SECOND GENERATION
LOW MED HIGH TOTAL ETA%%y,N
TOTALN
MALE
FEMALE
MALE
FEMALE
MALE
FEMALE
MALE
FEMALE
O MALAYALEE FRIENDS
I MALAYALEE FRIEND
2 MALAYALEE FRIENDS
3 MALAYALEE FRIENDS
4 MALAYALEE FRIENDS
5 MALAYALEE FRIENDS
TOTAL ¡Y
ETA
SECOND GENo//o
36.4
39.4
15.2
6.1
0.0
3.0
33
ETHNIC LAì\IGUAGE PROFICIENCY
1.2 I1.9 86.9 84 15.6 84.4
0.0 5.1 94.9 79 22.4 7t.6
PARTICIPATION IN ETHNIC RELIGIOUS SERVICES
37.5 42.5
32.4 43.7
5.1 61.5
5.5 61.6
32 0.t7
67 0.82
40 0.25
7t 0.07
39 0.08
73 0.01
33 0.60
63 0.69
SECOND GENo//o
29.9
20.9
t9.4
11.9
10.4
7.5
67
0.0
6.0
19.0 38.1 42.9 84
30.7 36.0 33.3 75
2.5 s7.0 40.5 79
5.3 60.5 34.2 76
ENDOGAIVIOUS BEHAVIOR
0.0 29.8 70.2 57
0.0 15.9 84.1 63
CHOICE OF INGROT]P FRMNDS
20.0
23.9
PARTICIPATION IN ETHNIC ORGA}IIZATIONS
6.1 84.8
15.9 71.4
33.3
32.9
9.1
12.7
MALE
FIRST GEN%
5.2
3.9
7.8
tt.7
13.0
58.4
77
0.70
FEMALE
FIRST GENo//o
1.4
5.7
12.9
12.9
t5.7
51.4
70
0.58

119
than second generation males. High levels of endogamy are displayed by 70.2o/o of the
first generation, while only 9.lo/o of the second generation display simila¡ results. An
ETA of 0.69 suggests that the generational decline noted in males is paralleled in the
female population as well. This assertion is substantiated in that 84.10 of the first
generation show high endogamous behaviour, as opposed to only 12.7o/o of second
generation females.
We also calculated the relationship between generation and choice of ingroup
friends. ETA coefficients of 0.70 and 0.58, (suggesting moderate correlations, and
marked relationships), were calculated for males and females respectively. The data
in Table 5.19 indicate that 58.4yo of fîrst generation males list other Malayalees as
their five closest friends, in contrast, only 3.0% of second generation males do the
sEune. A similar analysis of the female population yields very similar results. While
5I.4% of first generation females list other Malayalees as their five closest friends,
only 7.5o/o of second generation females make the same assertion.
Three significant Beta coeffîcients for the association between generation and
the factors of objective ethnic identity were calculated. The Beta coefficients of 0.82
in MCA 7, and 0.67 in MCA 10 (Appendix D), both indicate that when controlling
for all independent variables, a moderate correlation continues to exists between
ethnic language profrciency, endogamous behaviour and generation. Similarly, the
Multiple R coefficients of 0.784 in MCA i,0.665 in MCA 10, both show that a
relatively large proportion of the variance in these objective indicators can be
associated with the variance in the four independent va¡iables: More specifically, a

t20
Multiple R Squared coeffrcient of 0.670 in MCA 7, indicates that 67.00/0 of the
variance in ethnic language proficiency ca¡r be associated with the variance in the four
independent variables (particularly generation). A Multiple R Squared coeffîcient of
0.437 indicates that 43.7o/o of the variance in endogamous behaviour can be associated
with the variance in the four independent variables, and once again, generation is
particularly infl uential.
The Beta coeffrcient of 0.71 in MCA l l (Appendix D), indicates that when
controlling for the other three independent variables, the correlation between
generation and choice of ingroup friends rises dramatically. We can interpret the
Multiple R coeffrcient of 0.665 to suggest that there is a high correlation between
choice of ingroup friends and the four independent variables. The Multiple R Squared
coeffrcient indicates that 44.2o/o of the variance in choice of ingroup friendships can
be associated with the variance in the four independent variables, and again,
generation is of paramount importance here.
Interpretatiorts
Some of the literature written in the area of ethnic identity retention has been
associated with the Hansen Hypothesis. According to this concept, second generations
will rebel against the ethnic heritage of their parents, and the subsequent generation
will return to it with some form of ethnic resurgence (Isajiw, 1990:38). This
hypothesis has been tested in several studies with varying results. However, in one of
the first such studies, Gans (1956) observed that even if the third generation had an
ethnic resurgence of sorts, it was not the same type of traditional ethnic culture that

t2r
TABLE 5.20 THE ASSOCIATION BET\ryEEN DTJRATION OF STAY A¡fD I¡IDICATORS OFSTIB.IECTIVE ETHIUC IDENTITY
DT]RATION LOW MED HIGH TOTAL ETA%%%N
PAROCHIAL EDUCATION
sHoRT (0-10) 3.4 48.3 48.3 29 0.09
MED ( I I -25) 2.2 60.0 37 .8 t 80
LONG (26-51) 6.1 61.2 32j 4e
ETHNIC LANGUAGE
sHoRT (o-lo) lo.0 36j 53.3 30 0.06
MED (l l-25) 2.7 56.3 4t.0 188
LONG (26-5 r) 3.8 60.4 3s.8 53
ETH|IIC RELIGION
sHoRT (0-10) 6.5 38.7 54.8 31 0.10
MED (t l-2s) 4.3 61.6 34.t 185
LONG (26-51) s.7 s8.s 35.8 53
ENDOGAMY
slloRT (0-10) 10.3 37.9 st.1 zs 0.24
MED (l l-2s) 20.2 sl.g 21.s 178
LONG (26-st) 6.3 s4.2 3s.6 48
INGROI.JP FRIE¡IDS
sIloRT (0-10) 0.0 67.7 32.3 31 0.06
MED (t l-2s) 8.0 s8.3 33.7 r87
LONG (26-s l) 9.4 62.3 28.3 53
ETHNIC ORGANIZATIONS
sHoRT (0-10) 3.2 71.0 25.8 31 0.05
MED (l t-2s) L l 67.7 31.2 r89
LONG (26-sl) 0.0 69.8 30.2 53

t22
was practiced by the first generation. Levels of ethnocentrism among the third
generation are sure to be lower than that of the first (Isajiw, 1990:39). Studies have
shown that while some members of the second generation may rebel against their
ethnic heritage, they are often the minority. Also, other studies suggest that while the
second generation may rebel in some ways, they tend to remain ethnic in others
(Isajiw, 1990:39).
The data in this research do not tend to support the Hansen hypothesis, even
though a serious decline in Malayalee ethnic identity is indicated. Second generation
Malayalees have not rebelled against their culture or their heritage, in fact, they
indicate surprisingly comparable levels of subjective identity to those of the first
generation. The fact that subjective and objective attitudes are so divergent among the
second generation lead to the conclusion, that while second generation Malayalees
have relatively positive attitudes towards their ethnicity, forces of assimilation and
acculturation still influence their behaviour toward Canadian norïns.
Duration of Stay
Subj ective ldentity Factors
Hypothesis four states that there will be a negative association between
duration of stay and subjective ethnic identity. The data in Table 5.20, shows that the
expected associations between respondent's duration of stay and subjective ethnic
identity are largely unsupported. In fact, the coefficient concerning duration of stay
and attitudes toward ingroup friends is the only significant statistic in Table 5.20.

t23
TABLE 5.21 TIIE ASSOCIATION BETWEEN DURATION OF STAY AND SUBJECTTVEETHNIC IDENTITY WHEN CONTROLLING FOR GENERATION
POSiTIVEATTITI'DES
F'IRST GENERATION
SHORT70
LONG ETA%
SECOND GENERATION
SHORT MED% o/o
ETAMEDõ/70
LONGYo
LOW
MEDIUM
HIGH
TOTAL N
LOW
MEDIUM
HIGH
TOTÄL N
LOW
MEDIUM
I]IGH
TOTÄL N
LOW
MEDITJM
I{IGH
TOTAL N
LOW
MEDIUM
HIGH
TOTAL N
LOW
MEDIUM
HIGH
TOTAL N
PAROCHIAL EDUCATION
3.4 3.7 4.9 0.09
48.3 5t.2 58.5
48.3 45.1 36.ó
29 82 4L
ETIINIC LA¡{GUAGE
10.0 3.5 0.0 0.05
36.7 s7.0 60.5
53.3 39.5 39.5
30 86 43
ETHNIC RELIGION
6.5 2.4
38.7 52.4
54.8 45.2
31 84
0.0
58.1
4t.9
43
ENDOGAMY
10.3 1.3 2.6
37.9 s7.3 48.7
51.7 4t.3 48.7
29 75 39
INGROTIP F'RIENDS
0.0 t.2 4.7
87.7 50.0 60.5
32.3 48.8 34.9
31 86 43
0.04
0. l6
ETHNIC ORGANIZATIONS
3.2 0.0 0.0 0.14
71.0 s9.8 62.8
25.8 40.2 37.2
31 87 43
1.0 12.5 0.16
67.3 75.0
31.6 12.5
988
2.0 20.0 0.20
55.9 60.0
42.t 20.0
L02 10
5.9 30.0 0.20
69.3 60.0
24.8 10.0
101 10
34.0 22.2 0.02
s8.3 77.8
7.8 0.0
103 9
13.9 30.0 0.18
65.3 70.0
20.8 0.0
l0r 10
2.0 0.0 0.14
74.5 100.0
23.s 0.0
102 10
0.0
0.0
0.0
0
0.0
0.0
0.0
0
0.0
0.0
0.0
0
0.0
0.0
0.0
0
0.0
0.0
0.0
0
0.0
0.0
0.0
0

124
Theoretically, duration of stay should be a strong indicator of either ethnic
identity maintenance or decline. The lack of significant results in this research with
respect to duration of stay, may be attributed to the large number of second generation
Malayalees occupying the medium grouping, thereby skewing the data. Of interest
however, is the consistent decline in high positive attitudes over duration of stay, when
the medium duration category is omitted. More generations need to be examined, the
limitations of this sample do not allow for adequate analysis of this issue.
In controlling for generation, Table 5.21 displays two significant ETA
coefficients. For the cross-tabulations involving generation and the five objective
identity factors, the associations concerning ethnic language and ethnic religion both
produced small ETA coeffîcients of 0.20. The ETA would seem to suggest that first
generation Malayalees display higher levels of long term identity maintenance with
reference to both ethnic language and religion.
The data in Table 5.21 indicate that a trend does occur within the second
generation category. Second generation Malayalees that are associated with long
durations of stay display lower levels of subjective identity than those with
medium durations of stay. With reference to each indicator, higher levels
of subjective ethnicity are displayed by Malayalees associated with medium
durations of stay than those associated with long durations of stay.
Objective ldentity Factors
Hypothesis eight states that there will be a negative association between
duration of stay and the indicators of objective ethnic identity. This hypothesis is

125
TABLE 5.22 THE ASSOCIATION BETWEEN DURATION OF STAY AIID INDICATORS OF'OBJECTIVE ETHNIC IDENTITY
DURATION LOW MED HIGH TOTAL ETAVo Vo Vo ¡{
ETIINIC LANGUAGE PROFICMNCY
sHoRT (0-10) 0.0 22.6 77.4 31 0.31
MED (11-2s) I1.3 4r.8 46.9 t77
LONG (26-sl) 1.9 15.4 82.7 s2
PARTICIPATION IN ETHNIC RELIGIOUS SERVICES
sHoRT (0-lo) 30.0 46.7 23.3 30 o.loMED (l l-2s) 26.3 39.2 34.4 186
LONG (26-sl) 36.5 38.s 2s.0 52
PARTICIPATION IN ETHNIC ORGANIZATIONS
sHoRT (0-10) 6.7 60.0 33.3 30 0.14
MED (l l-25) 3.3 57.6 39.1 184
LONG (26-51) 7.8 68.6 23.6 sl
ENDOGA}IOUS BEHAVIOR
sHoRT (0-10) 0.0 28.0 72.0 25 0.24
MED (ll-25) 7.3 s2.3 40.4 l5lLONG (26-st) 2.6 36.8 60.5 38
CHOICE OF INGROT]P FRIENDS
SHORT MEDIIJM LONG TOTAL ETA%%%¡/
O MALAYALEE FRIENDS 6.9 17.3 12.2 37 0.11
1 MALAYALEE FzuEND 13.8 I5.5 8.2 34
2 MALAYALEE FRIENDS 10.3 13.7 14.3 33
3 MALAYALEE FRIENDS 6.9 8.9 22.4 28
4 MALAYALEE FRIENDS 17.2 9.5 14.3 28
5 MALAYALEEFRIENDS 44.S 35.1 28.6 86
TOTAL N 29 168 49 246

126
based on the theoretical concept that the longer one lives in a given are4 the more that
individual is likely to adopt some of the attitudes, behavioural pattems and norms of
that society. However, as seen in Table 5.22, none of the suggested relationships are
supported by the data. While ANOVA VI and IX do support the existence of a
variance between the means of at least two of the groups, Table 5.22 doesnot suggest
a directional relationships compatible with the proposed hypothesis.
htlerpretations
The small relationships noted between ethnic language proficiency,
endogamous behaviour and duration of stay, are spurious at best. A visual analysis of
the table suggests that the statistical significance surrounding these interactions stems
from the fact that nearly all second generation Malayalees a¡e found within the
grouping of l1-25 years duration of stay. Since l5 years of age was the cut-off point
for participants, there are no second generation Malayalees within the first grouping.
Furthermore, since Malayalee immigration did not begin enm¿$s until the early
seventies, there will be very few second generation Malayalees within the third
grouping of 26'51 years duration of stay. This issue is problematic due to the
relatively small sample size of this research. As with the other independent variables,
controlling for intervening variables may provide needed interpretive dat4 but the
size of the sample population will draw the statistical significance of that data into
question.
In controlling for generation, Table 5.23 displays no statistically significant
interactions. Keeping the spurious nature of this data in mind, it should also be

r27
TABLE 5.23 THE ASSOCIATION BETWEEN DURATION OF'STAY AIID OBJECTIVEETHNIC IDENTITY WHEN CONTROLLING FOR GENERATION
POSITIVEBETIAVIOTIR
F'IRST GEI\IERATION
SHORTYo
SECO¡ID GENERATION
SHORTo/o
MED%
LONG ETA%
MED LONG ETA%%
LO\ry
MEDIUM
I{IGH
TOTAL N
LOW
MEDiLrM
HIGH
TOTAL N
LOW
MEDIUM
HIGH
TOTAL N
LOW
MEDIIJM
I{IGH
TOTAL N
O MALAYALEE FRIENDS
I MALAYALEE FRIEND
2 MALAYALEE FRIENDS
3 MALAYALEE FRIENDS
4 MALAYALEE FRIENDS
5 MALAYALEE FRIENDS
ETHNIC LANGUAGE PROFICIENCY
0.0 l.l 0.0 0.21
22.6 6.9 2.3
17.4 92.0 97.7
31 87 43
PARTICIPATION IN ETHNIC ORGA¡TIZATIONS
6.7 t.2 7.3 0.24
ó0.0 52.4 70.7
33.3 46.3 22.0
30 82 4t
ENDOGAMOUS BEHAVIOUR
0.0 0.0 0.0 0.07
28.0 20.6 23.3
72.0 79.4 76.7
25 63 30
CHOICE OF INGROTJP FRIENDS
6.9 1.3 5. I 0.28
13.8 2.6 2.6
10.3 7 .7 t5.4
6.9 9.0 23.1
t7 .2 I 1.5 17 .9
44.8 67.9 35.9
0.0 21.1 ll.l 0.ll0.0 75.6 77.8
0.0 3.3 I l.l0909
PARTTCIPATION IN ETHI\IIC RELIGIOUS SERVICES
30.0 16.5 38.1 0.28
46.7 34.1 38.1
23.3 49.4 23.8
30 85 42
0.0 34.7 30.0 0.05
0.0 43.6 40.0
0.0 2r.8 30.0
0 101 10
0.0 4.9 10.0 0.04
0.0 61.8 60.0
0.0 33.3 30.0
0 102 10
0.0 t2.5 12.5 0.07
0.0 75.0 s7.5
0.0 12.5 0.0
0888
0.0 31 . I 40.0 0.09
0.0 26.7 30.0
0.0 r8.9 10.0
0.0 8.9 20.0
0.0 7.6 0.0
0.0 6.7 0.0
09010TOTAL N 29 39

r28
mentioned that a trend similar to the one noted in Table 5.21 does occur within the
second generation category. Second generation Malayalees that a¡e associated with
long durations of stay, display lower levels of objective identity tha¡r those associated
with medium duration of stay. Also, the same trend is noted in the fîrst generation
category, between short and long durations of stay. These trends cannot be statistically
supported given the limitations of this data set in relation to duration of stay, therefore,
further investigation with a larger sample size is definitely wa¡ranted.

r29
CHAPTER VI
SUMMARY AND CONCLUSIONS
Summary
The main purpose of this study is twofold; to examine levels and patterns of
ethnic identity retention within Toronto's Malayalee community, and to investigate
whether a dichotomy can be drawn between subjective and objective ethnic identity.
Furthermore, we examined how religious affrliation, gender, generation and duration
of stay were associated with those aspects of ethnic identity maintenance.
In researching ethnicity and ethnic identity maintenance, Driedger's conformity
Pluralist Model was used to develop our conceptual frame. Theoretically, Malayalees
in different stages of development and natural adaptation to Canadian society will fit
into various cells of the Driedger model. For example, newly arriving Malayalee
immigrants are sure to fît into Cell E of the model, a¡rd second generation Malayalees
would tend to occupy Cell D. One of our major concerns in this research, is whether
the second generation react to their marginalization by strengthening ingroup bonds
(moving towa¡ds cell E), or by abandoning their ethnic heritage in the hopes of greater
acceptance within Canadian society. Theoretically, visible minorities by virtue of their
physical differences alone, should be unable to cross beyond the ba¡riers of Cell D,
however, future generations of Malayalees may find themselves transcending racial
boundaries and evolving into Cell C of the Driedger model.

130
Identity is central to an understanding of ethnic boundary maintenance and
movement throughout the Conformity-Pluralist model. As ethnics are assimilated or
acculturated towards conformity with a core group, changes in cultural features and
cha¡acteristics may signal shifts in ethnic boundaries. In relation to forms of ethnic
identity, a review of the literature suggests two contradicting theories that may denote
the direction of such shifts. The first proposes that a sense of group belonging is the
only component necessary for the continuance of ingroup identity; the second
maintains that symbolic and subjective identity alone are nothing more than a
minimization of ethnic culture and a fall back to an ethnicity of last resort.
The study focuses on the maintenance of Malayalee ethnicity over two
generations in Canada. Eight hypotheses were developed in order to specifically
address the dichotomy between objective and subjective Malayalee ethnic identity. An
analysis of the data gathered from the sample of Malayalee-Canadians in the GTA
resulted in partial support for several of the hypotheses, however, the level of
associations and relationships were generally substantial. As expected, a strong
dichotomy exists between subjective and objective ethnic identity, and a definite trend
exists with respect to the two most influential independent va¡iables, religious
affiliati on and generation.
Second generation attitudes towards their ethnic group were not signifrcantly
different from those of the fîrst generation. Other than attitudes towards endogamy
(ETA 0 52), all other coeffrcients revealed either insignifrcant or low correlations.
However, first generation Malayalees show substantially higher levels of objective

13t
identity than the second generation with respect to ethnic language proficiency,
endogamous behaviour and choice of ingroup friends. These results indicate that
while both generations tend to share similar symbolic and subjective attitudes towards
their ethnicity, second generation Malayalee behaviour reflects little ingroup cohesion.
Religious affrliation was also found to be an important variable in analyzing
Malayalee ethnic identity retention. Hypothesis one was partially supported and
hypothesis two was substantially supported by the data. In relation to subjective
identity, other than ethnic religion (ETA 0.25), all coefficients were insignificant.
However, Marthomites display substantially higher levels of objective identity than
Roman Catholic Malayalees with respect to participation in ethnic religious services
and organizations. The unexpectedly high participation in ethnic organizations w¿¡s
attributed to their religious nature.
As aforementioned, levels of subjective ethnic identity may be attributed to
nothing more than a feeling or a symbolic connection to one's heritage. Statistical
coefficients generated through the MCA analysis suggest that of the variance found in
the indicators of subjective ethnic identity, only a slight percentage can be attributed to
the variance in the independent variables. Previous studies have used indicators of
objective ethnic identity as control variables to better understand subjective attitudes,
but this research has determined that the arbitrary nature of subjective identity makes
such analysis difficult at best.

t32
Conclusions
The Malayalee community is very unique within the framework of Riesman's
Ideal Ethnic Types. First generation Malayalee immigrants can be understood in terms
of Riesman's model, dependent upon their durations of stay and rates of acculturation.
The second generation however, is harder to place within the model as they tend to fit
somewhere between the marginalized and the middleperson ethnic types.
While the second generation does tend to be marginalized in terms of their
cultural position between two world, they also manage to compete relatively well in
the economic fray. As noted by Mangalam, Malayalees are not typified by pools of
unemployment, rather, they are a very successful immigrant group that value
education, and promote economic competition within the industrial core (Cell A).
Although economically successful, second generation Malayalees do not fit into the
ethnic model of the Middleperson. They are socially and psychologically motivated by
the norms and networks of Canadian society rather than those of their ethnic group. It
is this connection to Canadian culture, and their apparent inability to separate their
economic and social lives, that leaves the second generation with such a precarious
sense of nomos. If a definition is required, then they must be understood as a
Marginalized-Middlepeople.
Second generation Malayalees enter the industrial core without a secure
grounding in their ethnic reference group. As we have considered the importance of
the sacred canopy in protecting a sense of ethnic Gemeinschaft, we must reflect that
the Malayalee canopy's relative state of disrepair, results in a type of 'partial culture'

133
that cannot instill ethnic grounding and identification. Of the four major stakes in the
sacred canopy, spatial proximity (territory) is of prime importance in this phenomena.
Malayalee dispersal throughout the GTA does not allow the second generation to
establish any sense of Gemeinschaft with their ethnic community. The Malayalee
canopy provides little insulation from the pressures and influence of the surrounding
society, so although economically prosperous, second generation Malayalees are an
ethnic group in the midst of decline, and this decline is reflected in their patterns of
identity maintenance.
Isajiw and Edwards in their discussions on ethnicity assert that symbolic
ethnicity, in its non-obtrusive and private nature, may come to anchor Malayalee
ethnicity for future generations, since it can be maintained indefinitely at little cost.
This interpretation however, does not look at the reality of ethnic degradation and
decline. An ethnic group that devalues or minimizes the importance of culture,
tradition and ritual within their ethnic milieu, relegates their sense of ethnicity and we-
ness to a type of residual ethnicity. A firm dichotomy must be drawn between the
objective and subjective forms of Malayalee ethnicity.
The assertion that the persistence of ethnic identity is not necessarily related to
the persistence of traditional ethnic culture, seems particularly relevant for Malayalees
in the GTA. Hybrid forms of ethnicity have formed within the Malayalee community
in relation to both generations. With specific reference to the Marginalized-
Middlepeople of the second generation, the data in this research clearly indicates that
these Malayalees show simila¡ levels of subjective identity to their parents, but

134
considerably lower levels of objective identity. This transition indicates the move of
the second generation towards new forms of ideological-symbolic ethnicity. Contrary
to the research conducted by Isajiw and Edwards, this study shows that objective
ethnic identity is necessary if ethnicity is to be secured for future generations.
It was suggested earlier that second generation Malayalees may consider
themselves more Canadian than Malayalee, as they tend to behave as Canadian
regardless of their subjective ethnic identity. Levels of ethnocentrism, both subjective
and objective, would appear to indicate that they do indeed show lower levels of
Malayalee identity than the first generation. Low levels of identity maintenance, and
strong out-group participation would suggest that second generation Malayalees reflect
a certain amount of ethnocentrism with respect to their Canadian cultural heritage.
This connection between second generation Malayalees and their Canadian heritage,
results in the minimization of their Malayalee ethnic identity, and a move away from
their ethnic heritage.
The assimilationist model developed by Park, while a deterministic macro
theory, may hold some insights into Malayalee community development, and identity
maintenance in Ca¡rada. Though assimilationist theory generally overlooks the barriers
faced by un-meltable visible minorities, future Malayalee-Canadians may find
themselves assimilating into the dominant group via Park's 'conflict-competition-
accommodation' pathway. With Driedger's framework in mind, it becomes clear that
as future Malayalee generations make ties of solidarity with Canadian society,
members of the Malayalee community will be located in almost ever cell of the

t35
Conformity-Plurali st model.
Conflict theory suggests that some first generation Malayalees (Tradition-
Directed Ethnics) will be reluctant to acculturate to the Canadian Majority. For these
people, ethnic heritage and culture is the grounding that brings a sense of nomos and
meaning to life. Located exclusively in Cell E of the Driedger model, these ethnics are
generally newly arriving immigrants that have no interest in the cultural norïns of their
surrogate homeland, and have no desire to interact with the Ca¡radian out-group.
Also located in Cell E of the Driedger model are those first generation
Malayalees that have spent a moderate amount of time in Canada. These Malayalees
compete in the economic centre, but they manage to retain a strong connection with
their ethnic community and heritage. These Malayalee Middlepeople are the perfect
example of Simmel's Stranger. They retain a sense of ethnicity by grounding
themselves in their heritage and culture even while interacting outside of their
community.
Taking into account processes of change, Modified Pluralism theory suggests
that first generation Malayalees with long durations of stay may find themselves
located between the involuntary pluralist Cell D, and the voluntary pluralist Cell E of
Driedger's model. These Malayalees are able to shift from their original cultures to
new interest foci in order to maintain a distinctive ethnicity (Driedger, 45:1989). This
Hybrid-Pluralist ethnic type, more than any other, reflects Isajiw and Edwards'
theories of ethnic identity maintenance through evolving symbolic ethnicity. While
some of the first generation may evolve into in Cell D as marginalized ethnics, the

136
great majority will retain suffrcient levels of ethnic identity to prevent such personal
ethnic decline.
Gordon's Modified Assimilation model, in its assertion that assimilation is not
a single process, outlines the stages through which ethnic groups in the midst of
decline must evolve. This model seems most appropriate for an analysis of second
generation Malayalees since their placement within Cell D of the Driedger model is
determined almost exclusively by discrimination from the host society, what Gordon
refers to as 'Structural Assimilation.' These Malayalees that display moderate levels
of subjective identity and low levels of objective identity (the Marginalized), are
caught between Canadian society and their cultural roots. Unlike other visible
minority groups in the GTA, second generation Malayalees have assimilated with
respect to almost all seven variables noted by Gordon, and they have accepted nearly
all of the cultural characteristics of Canadian society.
Despite efforts of the first generation to act as an anchor, tying them to their
heritage and culture, second generation Malayalees are neither dedicated nor disposed
to concepts of endogamy, ingroup friendship maintenance or ethnic language
proficiency. As a result of ethnic identity decline in the second generation, future
generations will have little sense of heritage and culture to which they may attach
themselves. As out-group marriage, and further ethnic dispersal take place, future
Malayalee generations may not find themselves marginalized and involuntarily
pluralist, instead, they may frnd themselves as modified assimilationist within Cell C of
the Conformity-Pluralist model. Malayalee culture, as it has been, will undoubtedly

t3'7
come to an end with the passing of the first generation, and the hybrid forms of
symbolic-ethnicity that develop afterwards, may reflect similar patterns of generational
identity decline.
As members of the South Asian diaspor4 separated and independent of their
mother country, the Toronto Malayalee community must struggle with issues of ethnic
insulation and cultural interchange. The reality of generational decline is of paramount
importance to this ethnic group as assimilation and acculturation stand in the forefront
of the Malayalee-Canadian experience. While the first generation may hold strong ties
with their Indian 'culture of origin', second generation Malayalees have no such tie to
their South Asian heritage, and future generations will find Canadian cultural
socialization deep and difficult to overcome.
Suggestions for Future Research
The research findings presented in this study represent a first step in the
exploration of South Asian Identity in Canada. As previously noted, we have not
attempted to provide definitive or exhaustive answers to all the complex issues
surrounding race and the Canadian experience. There are still areas and methods of
research that need to be addressed if we are to fill in the missing gaps of knowledge.
As a result of this study, three main suggestions for future research are advanced.
First, there are aspects to the study of culture and ethnicity that cannot be
approached through the use of quantitative methods. Qualitative research (ie. in-depth
interviews, participant observations) may provide valuable information that would not

138
be attainable through the use of general survey research. Whereas, quantitative
investigation will often provide answers that researchers are looking for, qualitative
study is often surprising in its ability to generate rich, unexpected information. With
reference to this work, qualitative methods may have been useful in explaining the lack
of territorial cohesion in the Malayalee community. Where survey research can
indicate that such a trend exists, qualitative research may explain why it exists.
Second, a more inclusive study needs to be collected in order to establish
further trends in Malayalee ethnic identity retention. A larger sample size would build
upon this research in two ways: it would allow for the study of other religious groups
within the Malayalee community, thereby improving our understanding of the
Malayalee sacred canopy; and it would allow for a statistically significant analysis of
'duration of stay.'
Third, as second generation Malayalees form their sense of nomos from within
the Canadian social sphere, it is important that we gain an understanding of Malayalee
ethnic salience. How important is ethnicity to this community? While this research
has made conclusions as to how Malayalees feel about their ethnicity and nationality,
future research needs to address whether the generations to come will see themselves
as Malayalee, as Canadian, or as a combination of both.
Policv Implications
Researching the Malayalee community in the GTA has been problematic. As
with many smaller minority groups, studies are often based on limited references

139
attained through the community, and even lesser information from governmental
sources. In state surveys or census dat4 small ethnic communities will generally be
absorbed under categories such as South Asian or Indian. These categorizations are
not legitimate and do not express the true multicultural nature of the South Asian
diaspora. Although some efforts a¡e made to delineate these groups by religious
affrliation, or by mother tongue, small groups are often lost in the shuffle. This
research would have been greatly improved had we been able to analyze the
territorial cohesion of this community through the use of census track data. These
types of governmental data must be available if ethnicity and ethnic groups are to be
adequately studied, and the quality of future research hinges on the incorporation of
such sources.
140
BIBLTOGRAPHY
Anderson, Alan B. and James S. Frideres.1981 Ethnicitv in Canada. Toronto : Butterworths & Co.
Adorno, T. W.. E. Frenkel-Brunswick, D. J. Levinson and R. N. Sanford1950 The Authoritarian Personality. New York : Harper and Brothers, Publishers.
Barth, F.1969 Ethnic Groups and Boundaries. Boston : Little Brown
Berger, Peter L.1978 'The Sacred Canopy.' In Robert S. Ellwood. Readings on Religion : From Inside
and Outside. New Jersey : Prentice-Hall, Inc. 13-16
Bhabha, Homi K.1994 The Location of Culture. London : Routledge
Borhek, J.T.1970 'Ethnic-Group cohesion.' American Journal of sociology.33-45
Breton, R.1964 'Institutional Completeness of Ethnic Communities and the Personal Relations of
Immigrants.' American Journal of Sociology. T0 : 193-205
Buchignani, N.1979 'South Asian Canadians and the Ethnic Mosaic : An Overview.' Canadian Ethnic
Studies. I 1:48-68
Buchignani, N, Doreen Indra and Ram Srivastava.1985 Continuous Journey . A SocialHistory of South Asians in Canada. Toronto .
McClelland & Stewart Ltd
Census Canada. (1991)
Charon, Joel M.1992
Toronto : Prentice Hall CanadaLtd.
Das Gupta, Tania.1994 'PoliticalEconomy of Gender, Race, and Class : Looking at South Asian
Immigrant women in canada.' canadian Ethnic studies. 26:59-7r

14l
Dasheßky, Arnold.1975 'Theoretical Frameworks in the Study of Ethnic ldentity.' Ethnicity. 2.1-15
DeVos, G and Romanucci-Ross, L. (Eds.)1975 Ethnic Identity. Palo Alto, California : Mayfreld.
Driedger, Leo.I97T Ethnic Identity and Social Structure. Unpublished Manuscripts and Data.
Winnipeg: University of Manitoba
Driedger, Leo.1976 'Ethnic SelÊIdentity : A comparison of Ingroup Evaluations.' Sociometry.
39:131-41
Driedger, Leo.1987 Ethnic Canada : Identities and Inequalities. Toronto : Copp Clark Pitman Ltd.
Driedger, Leo.1989 The Ethnic Factor : Identitl¡ in Diversity. Toronto . McGraw-Hill Ryerson Ltd.
Edwards, John.1985 Language. Society and Identity. Oxford : Basil Blackwell.
Edwards, John and Lori Doucette.1987 'Ethnic Salience, Identity and Symbolic Ethnicity.' Canadian Ethnic Studies.
19:52-62
Gans, Herbert J.
1979 'Symbolic Ethnicity : The Future of Ethnic Groups and Cultures in America.'Ethnic and Racial Studies. Z:l-20
Gans, Herbert J.
1992 'Second-Generation Decline : Scenarios for the Economic and Ethnic futures ofthe Post-1965 American Immigrants.' Ethnic and Racial Studies.2:173-192
Gans, Herbert J.
1994 'Symbolic Ethnicity and Symbolic Religiosity : Towards a Comparison of Ethnicand Religious Acculturation.' Ethnic and Racial Studies.4:577-92
Geismer, Ludwig.1954 'A Scale for the Measurement of Ethnic Identification.' Jewish Social Studies.
l6:33-60
Gordon, Milton.1964 Assimilation in American Life. New York : oxford university press

142
Government of Canada - Manpower and Immigration.1974 The Immigration Program: A Report of the Canadian Immigration and Population
Study. Ottawa: Information Canada
Hagedorn, Robert.1983 Essentials of Sociology. united States of America:Holt, Rinehart and
Winston of Canada, Ltd.
Hawkins, Freda.1972 Canada and Immigration: Public Polic]¡ and public Concern. Montreal: McGill -
Queens University Press
Hebdige, Dick.1990 Hiding in the Light. London : Routledge
Hebdige, Dick.l99l SUBCULTURE : The Meaning Of St)¡le. London : Routledge
Hinkle, Dennis E. William Wiersma and Stephen G. Jurs.1988 Applied Statistics for the Behavioural Sciences. Boston: Houghton Mifflin
Company
Isajiw, Wsevolod W.T974 'Definitions of Ethnicity.' Ethnicity. l:lll-24
Isajiw, Wsevolod W. et al.1990 Ethnic Identity and Inequality : Varieties of Experience in a Canadian City.
Toronto : University of Toronto press
Jenkins, Richard.L994 'Rethinking Ethnicity : Identity, Categorization and Power.' Ethnic and Racial
Studies 2:198-223
Karumanchery, Nisha.1992 South East Asian Students'Perceptions and experience of Racism and Their
Relation to School Achievement: Masters Thesis. University of Toronto : Toronto
Mackie, M. and Brinkerhofi M.1984 'Measuring Ethnic Salience.' canadian Ethnic studies. r6:114-l3l
McCall, George J. and J.L.Simmons.1968
Life. New York : Collier-Macmillan Canada Ltd.

r43
McNall, G.Scott.T974 The Sociological Perspective. Boston : Little, Brown and Company
Mundadan, A. Mathias C.M.I.1995 The Syro-Malabar Church : An Overview. The Department of Communications -
Sacred Heart Provincial House : India
Nahirney, Vladimir and Joshua A. Fishman.1965 'American Immigrant Groups : Ethnic ldentification and the Problem of
Generations.' Sociological Review. 13:3 1,1,-26
Park, Robert.1950 Race and Culture. Edited by Everett C. Hughes. Glencoe, Illinois : The Free
Press.
Peters, Jacob.l97l The association of Religious Affiliation. Socio-economic Status. Generation and
Segregation with German Ethnocentrism. Winnipeg : University of Manitoba.
Radhakrishnan, R.1991 'Ethnicity In An Age Of Diaspora.' Transition #54, November,
Reitz, Jeffrey G.1980 The survival of Ethnic Groups. Toronto : McGraw-Hill Ryerson Ltd
Simmel, Georg.1950 The Sociology of Georg Simmel. Kurt Wolff(ed.).Glencoe, Illinois: The Free
Press
Singleton, Royce A. Bruce Straits and M. Straits.1993 Approaches to social Research. New York : oxford university press
Swartz, Marc J.
'Negative Ethnocentrism.' Journal of Conflict and Resolution, Vol 5,(March):75-81
The Canadian Mar Thoma Church Dedication Booklet. (1987)

t44
APPENDIX A
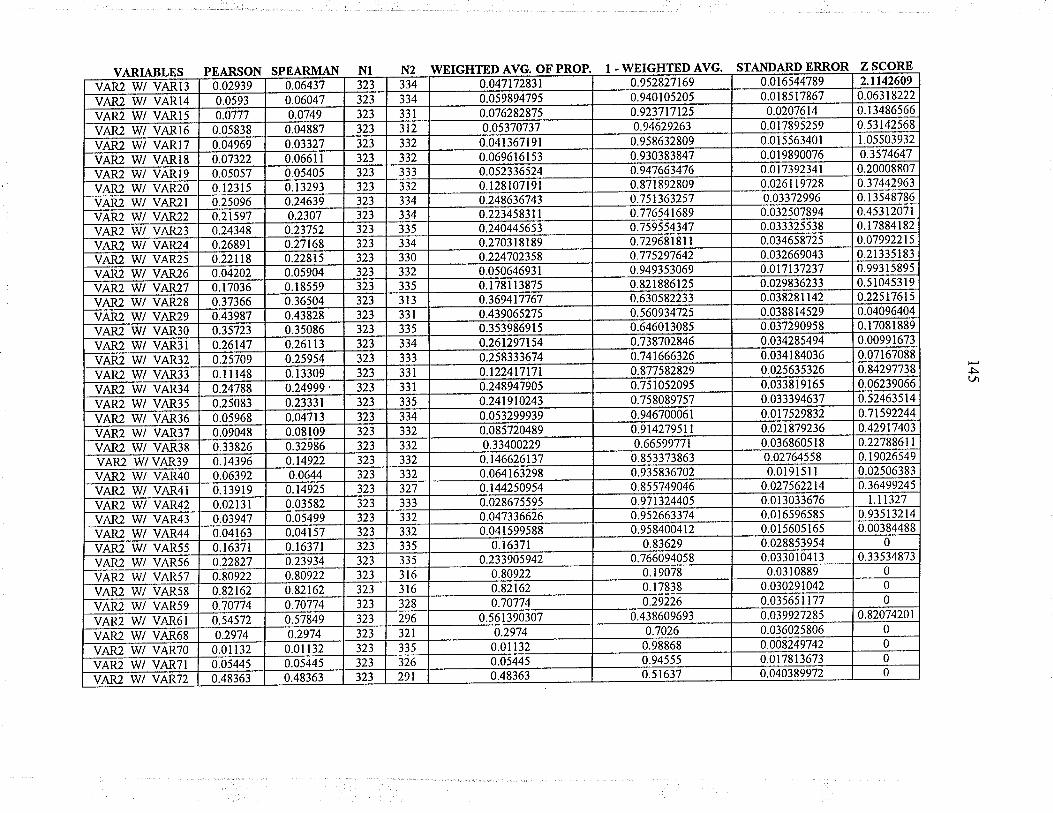
VAR2 w/ VARVÁP? \l// VÂP
VAR2 w/ VARVAR2 w/ VARVÂR' W/ VAR
s
VAR2 w/ VARVAR2 w/ VAR
3
VAR2 w/ VAR2O
4
VAR2 w/ VAR2I
0.02939
5
VAR2 w/ VAR22
6
0.0593
VAR2 w/ VAR23
0.0777
7
VAR2 w/ VAR24
0.05838
8
VAR2 w/ VAR25
0.04969
9
VAR2 w/ VAR26
0.07322
0.06437
VAR2 w/ VAR27
0.06047
0.05057
VAR2 w/ VAR28
0.12315
0.0749
VAR2 w/ VAR29
0.04887
o.25096
VAR2 w/ VAR3O
0.03327
0.21597
VAR2 w/ VAR3I
0.24348
323
0 0661 I
VAR2 w/ VAR32
323
0.05405
0 ?_6R9t
VAR2 \ry/ VAR33
0.13293
323
0.22Ú8
VAR? w/ VAR
334
0.04202
0.24639
1)1
VAR2 w/ VAR:
0. I 7036
WEIGHTED
174
323
0.2307
VÁR? W/ VARJ6
0.37366
331
0.23752
J23
312
VAR2 w/ VAR37
0.27168
323
0.43987
VAR2 w/ VAR38
323
0.22815
o 757),7
332
0.26147
332
323
0.05904
VAR2 w/VAR39
0.047172831
0.25709
t4
0. I 8559
323
VAR2 w/ VAR4O
333
0.059894795
VAR2 w/ VAR4I
0.1 I t4
0.36504
332
5
t¿l
0.076282875
0.24788
0.43828
3?,3
VAR2 w/ VAR42
434
OF'PROP. 1 . WEIG
0.05370737
334
0.35086
VAR2 w/ VAR43
0.25083
323
0.04 r 367191
8
335
0.261l3
VAR2 W/ VAR44
323
0.05968
0.069616 I 53
323
VAR2 w/ VAR55
334
0.09048
0,25954
0.052336524
VAR2 w/ VAR56
323
0. l 3309
0 33826
.t ltI
0.t2810719t
323
77),
VAR2 w/ VAR57
0.24999
0.14396
0.248636743
335
VAR2 w/ VAR58
0.23331
0.06392
J2J
0.223458311
VAIU W/ VAR59
0.04713
lt3
323
0.1 39 I
0.240445653
0.952827169
331
VAR2 W VAR6I
323
0.021 3 I
0.08109
0.2703181
0.940105205
323
135
VAR2 w/ VAR68
0.03947
0.32986
o.224702358
9
0.9237r7125
?14
v^t?? w/ vÁR70
323
0.14922
0.04 t63
0.05064693 I
333
\/^Þt lu/ vÁP7l
0.94629263
0.16371
97
0.1 781 1 3875
0.0644
v
0.958632809
VAR2 w/ VAR72
323
89
o 22827
{tt
0.14925
0.3694t7767
331
0.930383847
0.80922
0.03582
32J
0.43906527s
0.947663476
335
0.82162
STANDARI)
0.05499
323
0.3s398691
0.87 I 892809
334
0.04157
323
0.70774
0.26t297154
0.75t363257
0.16371
172
0.54572
Ð,1
0.258333674
0.776541689
0.016544789
332
Ð7
0.23934
0.2974
0.t224171"Ìt
0.0
0.75955434't
332
0.80922
0.01 I 32
323
0.248947905
5
0.72968181 I
332
0.82162
0.05445
8517867
t23
0.02076t4
0 241910243
0 775297642
0.0
327
323
0.70174
0.48363
0.053299939
0.949353069
0.0
JJJ
0.57849
J2J
7895259
0.085720489
0.821886125
0.0
332
123
0.2974
5563401
z
0.33400229
0.630582233
0.0
332
323
0.01132
9890076
SCORE
0.t46626t37
2.tt42609
0.560934725
335
0.026lL9728
0.05445
t?,7
7392341
0.06318222
0.064 163298
0.64601 3085
323
?35
0.03372996
0.48363
0. I 3486566
0.144250954
0.738702846
0.032507894
316
323
0.028675595
0.53 I 42568
0.033325538
0.741666326
316
323
0.047336626
1,05503932
0.034658725
0.877582829
328
7)7
0.04 I 599588
0.3574647
0.032669043
0.75 1052095
296
t7 I
0.20008807
0.0
0.758089757
321
323
0.16371
0.233905942
0.37442963
0.029836233
0.946700061
335
7t37237
0. I 3548786
0.038281 142
0.9142795n
326
0.80922
0.453t2071
0.038814529
291
0.66599771
0.82162
0.17884182
0.0:
0.853373863
0.707740.56 I 390307
0.07992215
0.034285494
0.935836702
i7290958
0.213351
0.034184036
0.855749046
0.993 I 5895
0.2974
0.971324405
0.025635326
0.01132
0.51045319
0.03381 9165
0.952663374
0.05445
0.225t76t5
83
0.9584004 l2
0.033394637
0 48363
0.04096404
0.0
0.17081889
0.83629
0.02t879236
0.766094058
0.00991673
t529832
0.0
0.07167088
0. I 9078
0.0276455868605 1 8
0.84297738
0.17838
0.0l9l5ll
0.06239066
o 29226
0.0275622t4
0.438609693
0.5246
0.01 3033676
0.7t592244
0.0r 6596585
0 7026
0.42917403
0.98868
0.01 5605 I 65
35
0.22788611
0.94555
l4
0.028853954
0.19026s49
0.51637
0.0:
0.02506383
5(^
0
3010413
0.36499245
0.03029t0423 I 0889
0.0:
1.113270.93513214
0.039921285565n77
0 00384488
0.0360258060.008249742
0.335348'73
0.0
0
0.04038997278t3673
0
0
0.820742010
000
0

\/Ál)t w/ vÂR7?\/^pt w/ v^P75VAR2 w/ VAR76VAR2 w/ VAR78
Þr I.c
VAR2 w/ VAR79VAR2 w/ VARSO
VAR2 w/ VARSIVAR2 w/ VAR82VAR2 w/ VAR83
o 756q\
VAR2 w/ VAR84
0.02222
VAR2 w/ VAR85
0.1093
VAR2 W/ VAR95
0.01889
sp
VAR2 w/ VAR
0.09243
VAR2 w/ VAR
0.25695
0.12948
\tÁpt w/ vÀP
0.16885
0.02222
VAR2 w/ VAR
0. r 093
0.0751
VAR2 w/ VAR
0.01889
0.14593
VAR2 w/ VAR
0.12273
o,09243
VAR2 w/ VAR
0l
0.12129
1)'1
0.161
VAR2 w/ VAR
04
0.26335
323
0.17064
VAR? w/ VAR
?q
N2W
323
0.33353
0.0751
VAR2 w/ VAR
63
323
0. I 4593
0.2423t
), ltr
VAR2 w/ VAR
65
327
0.12415
323
o t61s7
VAR2 w/ VAR
66
323
325
0.19337
0.05491
67
334
0.28145
0.Q4579
t?,7
7l
334
VART w/ VARI3
0.15413
323
0.33235
72
332
\/^P7 tI// V.Ap
323
0.2423
0.0368
AVG. OF'PR
326
73
VART w/ VAR
0.25664
0.23226
323
0.25695
74
0.04144
VART w/ VAR
t1
32.3
(l 05909
0.02222
75
JJJ
0.09102
323
VART w/ VAR
0.05342
0.1093
VART w/ VAR
0.09278
0.13022
0.01889
4) I
l)a
332
0. I 9265
VART w/ VAR
0.02t 82
1?1
0.092430.t25328733
VART w/ VAR2O
329
323
o.27354
4
0.169749t37
VART w/ VAR2I
293
5
0.0579
0.0429
,j
293
0.081 I 8
VART w/ VAR22
323
6
0
0.0751
-WEIGHTED
324
t4
0 09278
VÂR7 w/ V,AR?-3
0.03044
7
427
0.145930.t23444369
VART w/ VAR24
314
0?
0.17554
Ð,7
8
0.03364
0.t77407389
237
\/^P7 \v/ VÂp?s
0.16656
9
a'l, a
0.272483282
0.7430s
VART w/ VAR26
227
0.05907
0.02019
lz3
0.332968734
0.97778
249
VART w/ VAR27
323
0.13752
0.07723
0.242305244
0 8907
213
rt^Þ'7 tul v^P?R
0.07594
0.03051
1),4
o.249867743
0.98lll
247
VART w/ VAR29
0.02721
0.051
t23
0.056970471
0.907570.874671267
243
0
0.0I834
0.049019125
0.830250863
14506
234
0.00484
68
0.00078
332
ST
0.t44261691
)76
0.07945
0.03923
332
0.030278986
0.9249
0.14365
0.07651
332
0.2637221
0.85407
0.035817143
0.87655563 I
0.02839
334
332
0.09879
0.048572667
0.01 I 563096
0.822592611
4.00727
0.05416
174
332
0.086795406
0.024514349
0.727st6718
ERROR Z
-0.00272
0.014
332
331
0.010623877
0.66703t266
94
312
0.01107
0.04941
f32
0.092780. l 85426458
0.022602409
0;157694756
332
0. I 0362
l2
t72
0.025876057
0.750t32257
332
332
0.0361
0.05 I 009279
0.169749137
0.943029s29
332
0.05509
333
0.141762222
0.950980875
0.020582395
332
0.03973
t32
0.030474947
0.027570686
0.855738309
332
334
0.09891
0
0.0305539 I 3
0.969721014
0.025805182
332
t34
0
0.736277806
0.029855792
332
0
l3)
0.15581
0.951427333
0.034875t44
334
332
0.0 r 0485
0
0.078341669
0.3 IÓ5UEð I
0.913204594
U.UJðU
ti0
332
0
0.01054497
0.034568762
0.076225
332
332
0.075305736
0.907220.814513542
0.03404 1006
335
0.005496547
313
0.0 I 836924
0
0.00950087
0.05t0¿t n
0.01846661
0.948990721
33t
0
0.025t07718
1.0842
0.858237778
0.030430785
0.123695468
0.5 I E9942U
o.014450'775
0.969525053
0.03103501
o.037874976
0.969446087
ll
0.0322450.054627091
0.00028928
72
0.018170692
3
0.01'7879767
1.03610333
0.844 I 9
0.023907614
0.22755433
0.989515
0.074t2267
0.921658331
0.02490588
0.4131781
0.033281251
o.923115
0.7857t75
0.924694264
t.036622s8
0.994503453
0.0t705t022
0.4462049
0.027032045
0.9904991 3
0.90585431
0.974892282
0.013351336
0.41158436
0.876304532
0.01 3570375
0.028149049
0.967755
0.51410327
0.945372909
0.00790571 9
0
0.982120233
U.U2Uð4U I b
0.94833025
0.020595758
0.92587733
0.31481155
0.020450689
0.00524292
o 005729846
Þo\
0.46940487
0.007512426
0.76379135
0.012124861
2.4551847t
0.025592t87
u. luo)t)uv
0.013710707
0.0276756
0.0t /)9ð))ð
Z.JUJ5öYö4
0.010440034
4.46957919
0.0203481 99
1.235286732.322500821.564t49230.56233423u.u)¿ó4)¿44.066078752.43264772

VART w/ VARVART w/ VAR3IVAPT w/ VAR3?,
VART w/ VAR33
\¡AÞ? 1I// VÂR?5D1 !.I/l 1/^D?1
30
VART w/ VAR361r^D't lt// \/^Þ?7
VART w/ VA]
0.02t20.08886
VART w/ VA
0.025270.07461-0.00955
VART w/ VAR42
T.,TPMAN
VART w/ VA
0.05485
0.0851
w/ VAR4
38
VART w/ VAR44
0. I 1603
0.08643-Q.00277
0.03667
t4t)
\/^Þ? ttt/ vÂP5.i
n n676.6
0.04368
VART w/ VAR57
0.00712
n netsd
N
t
vÁp7 w/ vÂR51
0.03484
0.09275
t32
43
VART w/ VAR59
0.10701
0 03009
ìi2
\/^D? \lll \/^ÞÁl
0.04595
0.06971
332
VART w/ VAR68
332
0.08696
335
0.06807
334
0.08918
332
WEIG
\/^p7 w/ v^p7ll
ônÁls
VART w/ VA
333
0.02466
172
0.06824
VART w/ VAR72
331
332
o o?¿95
0.05888
VART w/ VAR73
0.06971
0.10001
i3l
t32
335
332
VART W VAR75
0.08237
0.0775
0 038100675
VART w/ Vl
112
ti4
0 0i103
n 061 51
0.087641351
VG. OFPRO
332
332
VART w/ VAR78
0.06824
ô nÁ¿R6
0.011228917
t'7 I
332
332
VÂR7 w/ VARTq
o.04176
0.059 168326
332
0.10001
o 017R1
VART w/ VARSO
It)
-0.001227572
0.t2502
7T,
332
0.08237
0.088942204
327
323
0.08209
D.1 lr¡t \t^Dal
0.t6072
0.111506456
76
333
1I^D? II7/ \/Af¿R?
323
0.07971
0.0622
332
VART w/ VAR84
n oqq6?
0.34135
t23
0.041 3l
- WEIGHTED A
332
332
0.03788
\/^Þ? w/ vÁRt{s
0.07731
0.26411
335
332
VART w/ VAI
0.12502
n ntÁn
0.08586
0.961 899325
VART w/ VARIOI
335
0.16072
132
0.02975
0 05187
0.027539499
0.912358649
\/^p7 w/ VÂ
0.07971
0.01062
ì16
\32
0.988771 083
332
0.34 I 35
0.0697t
ìt6
0. l0l
0.940831
VART w/ VARI63
328
0.072785
332
0.26411
n f¡<d?
VART w/ VARI65
t.001227572
332
296
0.00604
o n4601
0.06153
1r// lt^Dt20
ì95
5
0.91 1057796
321
0.01658
0.05187
712
0.068240.u)Jz lðÕu
0.888493544
67
STANDARD E
0.02932
332
135
0.00721
4
oÁ
32t
0.01377
0.10216
0.10001
472
0.95869
291
0.05437
0.08237
332
0. I 705
o 0s6405273
0.92269
0.01482527
276
332
0.02167
o.063606242
0.0064
0.9t4t4
0 02191453
327
0.01512
332
0.r3531
0.97025
0.008172153
0.972460501
325
332
0.09962
0.06102
0.01326
0.0 I 832628 I
334
0.015
332
0. 145 l4
0.03788
0.93029
112
0.l70ol
114
o 12502
0.927215
0.022044405ERR
332
97
1T,
0.16072
0.93847
0.021
0.02439338
326
0.t3472
332
0.07971
2.26977315
0.93 I 76
0.946781 398
0.07502
332
u.u I )¿t¿{)ðõ
133
0.34135
U. I IUÜð:
0.020729637
333
0. I 5582
332
3.43116439
0.264|
o 021744416
0.89999
1);7
332
0.04601
0.91763
0.013 l 86552
t.bð//4ulö
0.943594727
332
332
0.05187
0.012750106
0.936393758
329
0.008915
332
0.34702683
0.101826991
Et<t(
0.019750422
426
t12
0.36977245
0.90038
0.020163092
29
112
0.054370.006220271
0.96212
0.0tE'/E03ó4
3
324
0 93103415
0.0r 5855539
0.87498
3t4
0.0196635
0.30536575
0.83928
0.017504345
334
0.02t290.0 14865008
0.7719986
0.92029
0.023578462
0. I 7028696
0.4031 339
0.65865
0.021606939
0.02 I 355904
0.73589
0.017960508
0.46768621
0. I 3501 8598
0.0 I 9509406
0.95399
0
0.067824954
0.023443434
0.9481 3
0. I 50496036
0.991085
0.01478397
u.ðvút /JUUv
0
0.63527083
0.025788371
o
0.945630.993779729
0.029492860.022062106
0.984t44461
0
-¿-'l4-z9u4u5
0.036942569
0
u. I JOJ444v
0.97871
0.034400982
0 985134992
0.01623651
0.829713040.978644096
0.017186479
0
0.864981402
u.0u /29)ó I ð
0
0.932t75046
0
0 849503964
7
0.017585712
0
0.00609774',1
U
0.009732395
5{
0
0.01t203683
0
0.0094 r 3783
0
U.4b /4UJðO
0.02930824 I
0
0.02798964
0.0115880010.026687664
0.0590382
0.01 979365
0
0. I JUU 144 /
0.027710226
t.433457240.233699890.014671640.05781843V.U¿¿IU I)Y0.'707297550 38541728

VART w/ VARVARIABLES
VART w/ VARVART w/ VARVART w/ VARVART w/ VARVART w/ VARVART w/ VAR
66
VART w/ VAR
67
VART \ry/ VAR
68
0.12548
VART \ry/ VAR
69
0.07345
70
0.14675
'71
0.09624
72
0.02639
73
0.09405
0.0455
74
0.20253
0.10497
t5
0.t2765
0.14933
0.06692
0.r 1639o.01617
0.0273
I
0.02616
332332
0.24245
N2 \ryEIGHTED AVG. OF
332
0.t1943
t32
t72
0.0162
333
0.02187
332
233
332
247
t32
243
332
234
Il)\72
0.109765
)16
0,089233699
237
0.t4781396s
22
0.104835941
249
0.0223245040.0375043 I
0.2t91t64790.1242262040.046323506
- WEIGHTED AVG.
0.024972857
0.8902350.9 I 076630 I
0.852 r 860350.895 I 640590.9776754960.9624956890.78088352 I0.8757737960.953676494
I
0.9750271
0.0242622030.02'¿10994
0.0303320780.025741t64
43
0.0124'1
RZ
0.0162t7027o 035219227
SCOREt.2954306
0 028048R78
24
t.42560306
0.0 r 8101943
0.08505847
0.013081629
0.782792880.771 303051.19257371
t.13347190.293059852.801909220.4 r 508593
soo

r49
APPENDIX B

ls0
PART I
INSTRUCTIONS: PLEASE COMPLETE THE F'OLLOWING QUESTIONS USINGA CHECKMARK WHERE POSSIBLE. PRINT ALL OTHER RESPONSES CLEARLY.
l. Age:
2. Place of Birth :
(country) (city\town)
3. Sex : Male [] Female []
4. Your Religion :
(denomination) (branch)
5. What is your ethnicity?
6. Home Address :
7. Length ofyears you have lived :
a. at present address
b. in Metro Toronto
c. in Canada
8. Fathers place ofbirth :
country
9. Father's father's country of birth :
10. Father's rnother's country of birth :
I l. Father's religion :
denolnination
branch
12. Mother's place of birth :
country
town
13. Mother's father's countrv of birth :

t5l
14.
15.
Mother's mother's courtry of birth
Mother's religion :
denomination
branch
Estimate your total family incorne : (check one)
Under $ 20,000 U
$ 25.000 - $ 29,999 U
$ 35,000 - $ 39,999 []
$ 4s,000 - $ 4e,eee []
$ 55,000 - $ 59,999 []
$ 65,000 - $ 69,999 []
16.
$ 20,000 - s 24,999 ll
$ 30,000 - $ 34,999 []
$ 40,000 - $ 44,999 U
$ 50,000 - $ 54,999 []
$ 60,000 - $ 64,999 []
$ 70,000 - or lnore tl

t52
PART II
INSTRUCTIONS : TO ANSWER THE F'OLLOWING ATTITUDE QUESTIONS, KEEP Y9UROWN ETHNIC GROTJP AND RELIGION IN MIND. CIRCLE THE ANSWERWHICH BEST INDICATES YOURATTITUDE AS F'OLLOWS :
1 . STRONGLY AGREE2 -AGREE3 - UNCERTAIN4 - DISAGREE5 - STRONGLY DISAGREE
L A parochial (religious) educationeducation is one of the mostimportant gifts a family can give toits children.
2. One of the best ways to ensure thatmy ethnic culture is perpetuated isthrough parochial (religious)education.
3. A parochial education tends to giveone a narrow one-sided view of life.
9. It is embarrassing for me to see
members of my ethnic group conversingin their native language in a mixed group.
t2345
12345
4. The parochial education system of I Z 3 4 5
my ethnic group does not measure upto the public school standards.
5 I would be interested in attending I 2 3 4 5a Malayalee School instead of themainstream separate or public school
6. All those in my ethnic group should I Z 3 4 5make an honest attempt to learn tospeak their ethnic language.
7. It is more important for me to learn I Z 3 4 5my ethnic language than it is to learnanother second language.
8. It is of tremendous importance to I 2 3 4 5speak my ethnic language in the homeso that it may be preserved for futuregenerations.
1234s
r2345

153
10. For me, my religion is a real source | 2 3 4 5
of strength.
I l. It is important for members of my I Z 3 4 5
ethnic group to attend churchregularly.
, 12. For me, my religion helps me to I Z 3 4 5remember my ethnic heritage.
13. It is important to attend Malayalee I Z 3 4 5religious services instead of aregular mainstream church.
14. Being a member of my ethnic group I 2 3 4 5religion is something I acknowledgebecause of rny birth, but I do not feelit important enough to activelyparticipate in it.
15. The idea of God has tremendous I Z 3 4 5signifrcance in my daily life
16. For me, it makes little difference I Z 3 4 5what ethnic group the person I date: belongs to.
17. Unless a person in my ethnic group I Z 3 4 5has good reasons, he\she should notmarry an outsider under anycircumstances.
i 18. Endogamy(marriagewithinyour LZ34 5
ethnic group) is the best way toensure the future of my ethnic culture
tg. It is important for me to have most I Z 3 4 5of my close friends within my ethnicgroup.
.: 20 ff,åï"Tï;:,",iîffio;i"**' 12345feeling of warmth and security.
2I. I prefer not to spend leisure time I Z 3 4 5
rvith members of my ethnic group.
22. I prefer to spend time with members I Z 3 4 5of my ethnic group.

154
23. Those in my ethnic group should be
considerably more involved in theirown ethnic organizations than otherorganizations.
24. Ethnic organizations are wonderfi.rlbecause they allow one to take anactive part in the affairs of one's
own ethnic group.
25. The organizations of my ethnic groupseem to be too concerned with narrowissues instead of the importantissues ofthe world.
30. For me, being a member of my ethnicgroup is far more important thanbeing merely a Canadian (or residentof this country)
31. Living in a community composed almostentirely of my ethnic group would notbe a desirable thing
26. Every member of my ethnic group should I 2 3 4 5
subscribe to at least one ofhis\herethnic newspapers.
27. Receiving ethnic newspapers at home is I 2 3 4 5
a tremendous asset because it informsone about the current activities ofhisVrer ethnic group.
28. Ethnicnewspaperspresentanarrow | 2 3 4 5
one-sided point of view.
29. It would give a member of my ethnic | 2 3 4 5group a good feeling to live in acommunity composed almost entirely ofone's own ethnic group.
r2345
12345
r234s
t2345
1234s

155
PART ru
INSTRUCTIONS : PLEASE ANSWER THE FOLLOWING QUESTIONS USING A CHECKMARK WHERE APPROPRIATE. PLEASE PRINT ALL OTHERRESPONSES CLEARLY.
L Have you had any parochial (church operated) education?
yes [] no I If yes, how many years?
2. Have you attended any extra language classes (outside school hours) in your ethniclanguage?
yes [] no []
If yes : language :_months\years,etc. :
language : _ months\years,etc. :
Did your parents receive any parochial education?
father : yes [] no [] unknown []
mother:yes [] no [] unknown []
What language is used most often :
a) when speaking to your parents?
b) when speaking to your sibling(s)?
when speaking to your grandparent(s)?
when speaking to your children?
in your church services?e)
Do you personally have any ability to use Malayalam?
If yes, rate your ability to use Malayalam. (check)
yes [] no []
J.
4.
c)
d)
5.
Understanding :well []Reading: well []
Writing: well []
Speaking: well []
limited []
limited []
limited []
limited []

156
6. Will you encourage your children to learn your ethnic language?
yes I no []
7 . List your five closest friends (first names only).
a)
d)
b)
e)
c)
8. With reference to question #7, what etfnic background zurd religion are they?
ETHNIC GROUP RELIGION
e.g. Malayalee Christian (Catholic)
a)
b)
c)
d)
e)
9. Does your family subscribe to any ethnic publications? (ie. newspapers, magazine orjournals)
yes [] no []
If ycs, do you find thern worth reading?
yes [] no U undecided []
10. Are any of your relatives married to a person of a different ethnic background than yourfamily?
yes U no []
If yes, please indicate who married into which group and religion.
eg. relative : sister ethnicity : Ukrainian religion : Catholic
a) relative :-- ethnicity : _ religion : _b) relative :_ ethnicity : _ religion : _c) relative :_ ethnicity : _ religion : _

157
I 1. Are you presently or have you ever dated a person outside your own ethnic group orreligious background?
yes [] no []
12. Are you, or have you ever been married? yes [] no []
if yes :
a) Was it an arranged marriage? yes [] no []
b) Would you like an arranged marriage for your children? yes [] no []
13. If you have never been married, would you :
a) consider marrying outside of your ethnic group?
yes [] no I
b) prefer to marry outside your ethnic group?
yes [] no []
14. Does your ethnic group subscribe to arranged marriages?
yes [] no []
15. Do you expect to take part in an arranged marriage?
yes [] no []
16. If given an option, would you agree to an arranged marriage?
yes [] no []
17. Do you attend mainstream (non-Malayalee) church services?
yes [] no []
18. Do you belong to any Malayalee associations, clubs, or organizations (includingreligious)?
yes [] no []
19. Do you attend Malayalee church services?
yes [] no []

20.
158
Are you an active participant in mainstream religious group activities?
yes [] no I21. Are you an active participant in Malayalee religious group activities?
yes [] no []
If you answered yes to either or both #17 and #19 please check the approximatenumber of times you attend church in the appropriate list.
MAINSTREAM CHURCH
Every week (or nearly) tl
About twice a month tl
About once a month n
Several times a year Il
About once ayear tl
Very active
Fairly active
Uncertain
Fairly inactive
Very inactive
tl
t1
tl
It1
MALAYALEE CHURCH
Every week (or nearly) tl
About twice a month tl
About once a month tl
Several times a year tl
About once a year tl
Very active
Fairly active
Uncertain
Fairly inactive
Very inactive
u
tl
tl
Ifyou answered yes for either or both # 20 and #21, please check the appropriatebox in the appropriate list.
MAINSTREAM CHURCH GROUP MALAYALEE CHTJRCH GROUP

159
APPENDIX C

160
ANALYSIS OF VARIANCE I
VAR2OO BY VAR4VARTVAR5
VARI76
GENDERDURATION OF STAYRELIGION OF RESPONDENTGENERATION
SOURCE OF VARIATION
MAIN EFFECTS
VAR4VARTVAR5VARI76
EXPLAINED
RESIDUAL
TOTAL
SOURCE OF VARIATION
MAIN EFFECTS
VAR4VARTVAR5VARI76
EXPLAJNED
RESIDUAI
TOTAL
ANALYSIS OF VARIANCE II
VAR2OI BY
SUM ofSQUARES
2.036
0.0140.5720.043t.407
2.036
61.280
63.3t6
SUM ofSQUARES
0.783
0.00r0.4930.0650.224
0.783
71.476
72.259
MEANSQUARE
0.407
0.0140.5720.043t.407
0.407
0.275
0.279
MEANSQUARE
0.157
0.0010.2470.0650.224
0.157
0322
0.318
|.475 .199
0.05 t .82tl 037 .3560.154 .6955.098 .025
1.475 .199
SIGNIF.ofF
SIGNIF,ofF
DF
5
I
2I
I
5
222
227
VAR4 GENDERVART DURATIONOFSTAYVAR5 RELIGION OF RESPONDENT
VARI76 GENERATION
DF
5
I2I
I
5
aaa
227
0.486 .786
0.002 .9660.766 .4660.201 .6540.696 .405
0.48ó .786

r6l
ANALYSIS OF VARIANCE Itr
VAR2O2 BY VAR4VARTVAR5
VARI76
CENDERDTJRATION OF STAYRELIGION OF RESPONDENTGENERATION
SOURCE OF VARIATION
MAIN EFFECTS
VAR4VARTVAR5VARI76
EXPLAINED
RESIDUAL
TOTAL
SOURCE OF VARIATION
MAIN EFFECTS
VAR4VARTVAR5VARI76
EXPLAINED
RESIDUAL
TOTAL
ANALYSIS OF VARIANCE IV
VAR2O3 BY VAR4VARTVAR5
VARI76
GENDERDURATION OF STAYRELIGION OF RESPONDENTGENERATION
SUM ofSQUARES
11.264
0.t381.4804.8344.8t2
lt.264
6l.999
73.263
MEAI.ISQUARE
2.253
0.1380.7404.8344.8t2
2.253
0.279
0.323
MEANSQUARE
5.720
t.9464.r37t.674
16.706
5.720
8.067 .000
0.494 .4832.649 .07317.308 .00017.232 .000
8.067 .000
SIGNIF.ofF
SIGNIF.ofF
SUM ofSQUARES
28.600
t.9468.273t.674
16.706
28.600
73362
102.561
DF
5
I2lI
5
222
.1.r1
DF
5
I2
II
5
t7.t69 .000
5.841 .0r612.4t6 .0005.026 .026
50.t44 .000
l7.t69 .000
222 0.333
227 0.452

r62
ANALYSIS OF VARIANCE V
VAR2O4 BY VAR4VARTVAR5
VARI76
GENDERDURAIION OF STAYRELIGION OF RESPONDENTGENERATION
SOURCE OF VARIATION
MAIN EFFECTS
VAR4VARTVAR5VARI76
EXPLAINED
RESIDUAL
TOTAL
SOURCE OF VARIATION
MAJN EFFECTS
VAR4VARTVAR5VARI76
EXPLAINED
RESIDUAL
TOTAL
SUM ofSQUARES
10.251
1.7180.4420.0378.053
10.251
70.960
8l .21 I
SUM ofSQUARES
3.r32
0.1640.5780.1 002.290
3.t32
43.029
46.t62
MEANSQUARE
2.050
t.7t 8
0.22t0.0378.053
2.050
0.320
0.358
MEANSQUARE
0.626
0.1 640.2890.1002.290
0.626
0.224
0.234
SIGNIF,ofFDF
5
Ia
II
5
222
227
DF
5
I2II
5
192
r97
6.414 .000
5.376 .0210.692 .5020.I 17 .73325.t93 .000
6.4t4 .000
ANALYSIS OF VARIANCE VT
VAR2O5 BY VAR4VARTVAR5
VARI76
GENDERDURATION OF STAYRELIGION OF RESPONDENTGENERATION
SIGNIF,ofF
2.795 .018
0.732 .3931.290 .2780.448 .50410.217 .002
2.795 .018

163
ANALYSIS OF VARIANCE VII
VAR2IO BY VAR4VARTVAR5
vARl76
GENDERDURATION OF STAYRELIGION OF RESPONDENTGENERATION
SOURCE OF VARIATION
MAJN EFFECTS
VAR4VARTVAR5VARI76
EXPLAINED
RESIDUAL
TOTAL
SOURCE OF VARIATION
MAIN EFFECTS
VAR4VARTVAR5VARI76
EXPLAINED
RESIDUAL
TOTAL
77.933 .000
3.899 .05034.795 .0008.199 .005
307.978 .000
77.933 .000
SUM ofSQUARES
56.5 l6
.56510.093
1.18944.668
56.5 l6
27.847
84.364
MEANSQUARE
I1.303
.5655.047Ll89
44.668
I 1.303
. t45
.428
MEANSQUARE
10.038
.000
.58948.469
.s44
10.038
.343
.589
SIGNIFofF
SIGNIF.ofF
DF
5
I2II
5
192
197
ANALYSIS OF VARIANCE VItr
VAR2I I BY VAR4 GENDERVART DURATIONOFSTAYVARs RELIGION OF RESPONDENT
VARI76 GENERATION
SUM olSQUARES
50.192
.000t.179
48.469.544
s0.t92
65.808
l 16.000
29.288 .000
.000 1.000t.720 .r82
l4l.4l4 .0001.587 .209
29.288 .000
DF
5
I2II
5
t92
197
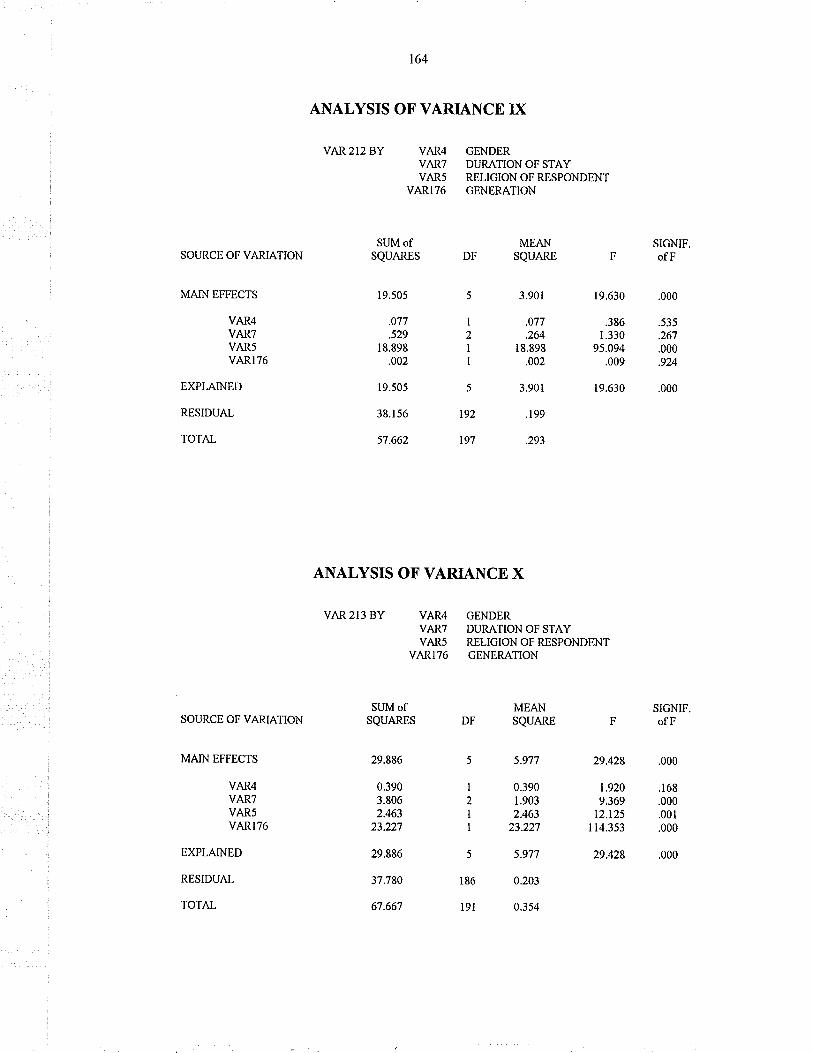
t64
ANALYSIS OF VARIANCE D(
VAR2I2 BY VAR4VARTVAR5
VARI76
GENDERDURATION OF STAYRELIGION OF RESPONDENTGENERATION
SOURCE OF VARIATION
MAIN EFFECTS
VAR4VARTVAR5VARI76
EXPLAINED
RESIDUAL
TOTAL
SOURCE OF VARIATION
MAIN EFFECTS
VAR4VARTVAR5VARI76
EXPLAINED
RESIDUAL
TOTAL
SUM ofSQUARES
19.505
.077
.52918.898
.002
19.505
38. I 56
57.662
SUM ofSQUARES
29.886
0.3903.8062.463
23.227
29.886
37.780
67.667
MEANSQUARE
3.901
.077
.26418.898
.002
3.901
.199
.293
MEANSQUARE
5.977
0.3901.9032.463
23.227
5.977
0.203
0.354
SIGNIF.ofF
SIGNIF.ofF
DF
5
I2II
5
t92
t97
19.630 .000
.386 .5351.330 .267
95.094 .000.009 .924
19.630 .000
ANALYSIS OF VARIANCE X
VAR 2I3 BY VAR4 GENDERVART DURATIONOFSTAYVAR5 RELIGION OF RESPONDENT
VARI76 GENERATION
DF
5
I)II
5
l8ó
l9t
29.428 .000
t.920 . 168
9.369 .000t2.t25 .001
I14.353 .000
29.428 .000

165
ANALYSIS OF VARIANCE XI
VAR6I BY VAR4 GENDERVART DURATIONOFSTAYVAR5 RELIGION OF RESPONDENT
VARI76 GENERATION
SOURCE OF VARLATION
MAIN EFFECTS
VAR4VARTVAR5VARI76
EXPLAINED
RESIDUAL
TOTAL
SUM ofSQUARES
14292.228
32.8702057.362
0.3491220t.647
t4292.228
192835.450
207127.678
MEAI.¡SQUARE
2858.446
32.8701028.681
0.349t220t.647
2858.446
722.230
76t.499
F
3.958
0.0461.4240.000
16.894
3.958
SIGNIF.ofF
.002
.831
.242
.982
.000
.002
DF
5
I)II
5
267
272

166
APPENDIX D

r67
MULTIPLB CLASSIFICATION ANALYSIS 1
VAR 2OO BY VAR4 GENDER GRAND MEAN = 2.342VART DURATION OF STAYVARs RELIGION OF RESPONDENT
VARI76 GENERATIONADruSTED FOR
UNADruSTED INDEPENDENTSVARIABLE + CATEGORY N DEV'N ETA DEV'N BETA
VAR4r MALE 102 .01- .03-2 FEMALE 126 .01 .02
.01 .04VART
l sHoRT (0-10) 26 .08 .002 MEDTUM (l l-2s) 158 .01 .043 LONG (26-5 I ) 44 .09- .I 5-
.09 .14VAR5
I CATHOLIC 176 .0t- .002 MARTHOMITE 52 .OZ .OO
.02 .00vARl76
I FIRST GENERATION 128 .06 .082 SECOND GENERATION lOO .07. .IO.
MULTIPLE R SQUARED 0.032MULTIPLE R 0.179
IVf ULTIPLD CTASSIFICATION ANALYSIS 2
VAR2OI BY VAR4 GENDER GRANDMEAN:2.390VART DURATIONOFSTAYVAR5 RELIGION OF RESPONDENT
VARI76 GENERATIONADruSTED FOR
UNADruSTED INDEPENDENTSVARIABLE + CATEGORY N DEV'N ETA DEV'N BETA
VAR4I MALE t02 .00 .01-2 FEMALE t26 .00 .01
.00 .01VART
I SHORT (0-10) 26 .03 .002 MEDTUM (l l-2s) ls8 .02 .033 LONG (26-5r) 44 .09- .r2-
.08 .10VAR5
I CATHOLIC 176 .01 .01-2 MARTHOMITE 52 .03 .02
.03 .02VARI76
I FIRSTGENERATION I28 .02 .032 SECOND GENERATION IOO .02 .04-
MULTIPLE R SQUARED 0.01IMULTIPLE R O.IO4
.t7.t2
.03 .06

168
MULTIPLE CTASSIFICATION ANALYSIS 3
VAR 202 BY VAR4 GENDER GRAND MEAN : 2.316VART DURATIONOFSTAYVARs RELIGION OF RESPONDENT
VARI76 GENERATIONADruSTED FOR
UNADruSTED INDEPENDENTSVARIABLE + CATEGORY N DEV'N ETA DEV'N BETA
VAR4r MALE t02 .03 .01-2 FEMALE 126 .02 .01
.04 .02VART
r sHoRT (0-10) 26 .22 .092 MEDTUM(II-25) 158 .02- .023 LONG (26-51 ) 44 .04- . 13-
.t4 .t2VAR5
l CATIIoLIC t76 .08- .07-2 MARTIIOMITE 52 .26 .22
.25 .22VARI76
I FIRST GENERATION 128 .I5 .I52 SECOND GENERATION IOO .20. .I9-
MULTTPLE R SQUARED 0.t54MULTIPLE R 0.392
MULTIPLB CT,ASSIFICATION ANALYSIS 4
VAR2O3 BY VAR4 GENDER GRANDMEAN:2.I23VART DURATIONOFSTAYVAR5 RELIGION OF RESPONDENT
VARI76 GENERATIONADruSTED FOR
IjNADruSTED INDEPENDENTSVARIABLE + CATECORY N DEV'N ETA DEV'N BETA
VAR4l MALE t02 .10 .052 FEMALE 126 .08- .04-
.t4 .07VART
l sHoRT (0-10) 26 .34 .072 MEDIUM (il-2s) 158 .t2- .03-3 LONG (26-51) 44 .24 .07
.28 .07VAR5
I CATHOLIC t76 .04- .02-2 MARTHOMITE 52 .I5 .07
.t2 .06VARI76
I FIRST GENERATION 128 .3I .282 SECOND GENERATION IOO .39- .36-
MULTTPLE R SQUARED 0.279MULTIPLE R 0.528
.30.31
.52 .47

169
Nf ULTIPLE CTASSIFICATION ANALYSIS 5
VAR 204 BY VAR4 GENDER GRAND MEAN = 2.237VART DURATIONOFSTAYVAR5 RELIGION OF RESPONDENT
VARI76 GENERATIONADruSTED FOR
UNADruSTED INDEPENDENTSVARIABLE + CATEGORY N DEV'N ETA DEV'N BETA
VAR4I MALE 102 .10 .062 FEMALE 126 .08- .05-
.15 .09VART
I SHORT (0-10) 26 .l I .08-2 MEDIUM (l l-2s) 158 .00 .063 LONG (26-51 ) 44 .06- .r7-
.07 . t6VAR5
I CATHOLIC t76 .01- .012 MARTHOMITE 52 .03 .03-
.03 .03v^,R176
I FIRST GENERATION 128 .16 .I92 SECOND GDNERATION IOO .21. .25-
MULTIPLE R SQUARED 0]26MULTIPLE R 0.355
MULTIPLE CI,ASSIFICATION ANALYSIS 6
VAR 205 BY VAR4 GENDER GRAND MEAN :2.283VART DURATIONOFSTAYVARs RELIGION OF RESPONDENT
VARI76 GENERATION
uNADrusrED ffi#;,i3Ä9i'VARIABLE + CATEGORY N DEV'N ETA DEV'N BETA
VAR4I MALE 82 .03 .012 FEMALE I 16 .02- .01-
.06 .02VART
I SHORT (0-10) 23 .15- .272 MEDTUM (l l-25) 138 .02 .063 LONG (26-5t) 37 .01 .04_
.ll .22VAR5
I CATHOLIC 154 .01 .022 MARTHOMITE 44 .03- .07-
.04 .08VARI76
I FIRST GENERATION I I I .07 .I I2 SECOND GENERATION 87 .09. .14-
MULTIPLE R SQUARED 0.068MULTIPLE R 0.260
.37.31
.16 .25
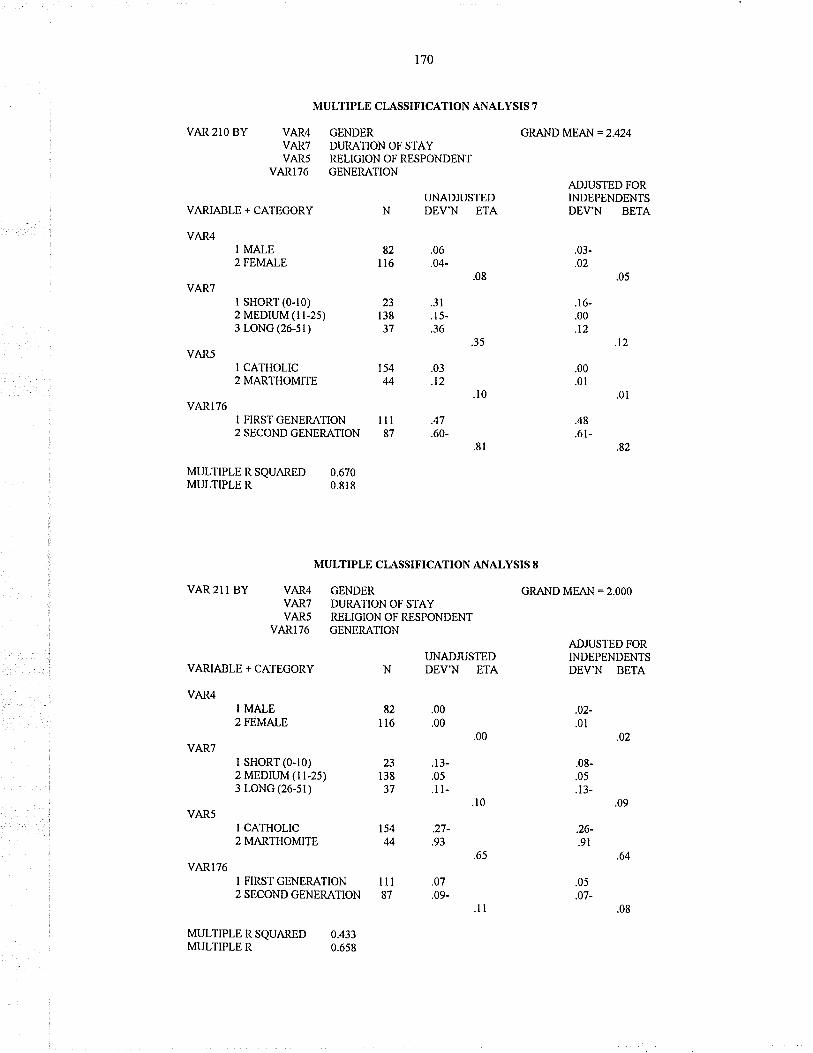
t'70
MULTIPLE CT,ASSIFICATION ANALYSIS 7
VAR 2IO BY VAR4 GENDER GRAND MEAN = 2.424VART DURATIONOFSTAYVAR5 RELIGION OF RESPONDENT
VARI76 GENERATION
uNADrusrED ffiffi*BÄiå'VARIABLE + CATEGORY N DEV'N ETA DEV'N BETA
VAR4I MALE 82 .06 .03-2 FEMALE lt6 .04- .02
.08 .05VART
l sHoRT (0-10) 23 .31 .16-2 MEDIUM (l l-25) 138 .r5- .003 LONG (26-5 I ) 37 .36 .t2
.35 .t2VAR5
I CATI-IOLIC 154 .03 .002 MARTHOMITE 44 .12 .OI
.10 .01VARI76
I FIRST GENERATION I I I .47 .482 SECOND GENERATION 87 .60- .6I-
MULTTPLE R SQUARED 0.670MULTIPLE R 0.818
MULTIPLE CT,ASSIFICATION ANALYSIS 8
VAR 2I I BY VAR4 GENDER GRAI.ID MEAN = 2.OOO
VART DURATIONOFSTAYVAR5 RELIGION OF RESPONDENT
VARI76 GENERATIONADruSTED FOR
UNADruSTED INDEPENDENTSVARLABLE + CATEGORY N DEV'N ETA DEV'N BETA
VAR4l MALE 82 .00 .02-2 FEMALE 116 .00 .01
.00 .02VART
l sHoRT (0-10) 23 .t3- .08-2 MEDIUM (r l-25) 138 .05 .053 LONG (26-st) 37 .l t- .13-
.10 .09VAR5
I CATHOLTC 154 .27- .26-2 MARTHOMITE 44 .93 .9I
.65 .64VARI76
I FIRST CENERATION I I I .07 .052 SECOND GENERATION 87 .09- .07-
MULTIPLE R SQUARED 0.433MULTIPLE R 0.658
.82.81
.l l .08

t7l
MULTIPLE CT,ASSIFICATION ANALYSIS 9
VAR 2I2 BY VAR4 GENDER GRAND MEAN = 2.328VART DURATIONOFSTAYVAR5 RELIGION OF RESPONDENT
VARITó GENERATIONADruSTED FOR
UNADruSTED INDEPENDENTSVARIABLE + CATECORY N DEV'N ETA DEV'N BETA
VAR4I MALE, 82 .02- .03-2 FEMALE I ló .02 .02
.04 .04VART
r sr{oRT (0-10) 23 .07- .002 MEDIUM (r l-25) 138 .03 .023 LONG (26-51) 37 .09- .08-
.10 .07VAR5
r CATHOLIC 154 .t7- .r7-2 MARTHOMITE 44 .58 .58
.58 .58VARI76
I FIRSTGENERATION IIl .OI .OO
2 SECOND GENERATION 87 .02- .OO
MULTIPLE R SQUARED 0.338MULTIPLE R 0.582
MULTIPLE CI.,ASSIFICATTON ANALYSIS 1O
VAR 2I3 BY VAR4 GENDER GRAND MEAN = 2.444VART DURATIONOFSTAYVAR5 RELIGION OF RESPONDENT
VARI76 GENERATIONADruSTED FOR
vARIABLE+cArEcoRy N HÈfl''f i',? Bti''i*BBü'VAR4
I MALE 82 .04 .03-2 FEMALE I 16 .03- .02
.06 .04VART
l sHoRT (0-10) 23 .29 .04-2 MEDIUM (l l-25) 138 .08- .023 LONG (26-51) 37 .t2 .05-
.23 .05VAR5
l CATHOLTC 154 .05- .03-2 MARTI]OMITE M .I9 .II
.t7 .10VARI76
I FIRST GENERATION I I I .34 .352 SECOND CENERATION 87 .43- .44-
MULTIPLE R SQUARED 0.437MULTIPLE R 0.66I
.01.03
.65 .67

172
MULTIPLE CT"ASSIFICATION ANALYSIS 1 1
VAR 6I BY VAR4 GENDER GRAND MEAN :3.943VART DURATIONOFSTAYVAR5 RELIGION OF RESPONDENT
VARI76 GENERATION
uNADrusrED ffi#J'iBJ'?l'VARI-ABLE + CATEGORY N DEV'N ETA DEV'N BETA
VAR4I MALE 109 .t4 .18-2 FEMALE 136 .l l- .15
.07 .09VART
l sHoRT (0-10) 29 .s4 .s4-2 MEDIUM (l l-25) t67 .t2- .233 LONG (26-51) 49 .10 .46-
.l I .18VAR5
I CATHOLIC 185 .19- .t t-2 MARTITOMITE 60 .59 .33
.18 .t0VARI76
I FIRSTCENERATION I45 .99 I.II2 SECOND GENERATION IOO 1.43- I.6I.
MULTIPLE R SQUARED 0.442MULTIPLE R 0.665
,71.63