Kenzie Dawn Birse - MSpace - University of Manitoba
142
The influence of ovarian hormones on the mucosal proteome of the female genital tract & the implications for HIV susceptibility in women By Kenzie Dawn Birse A Thesis submitted to the Faculty of Graduate Studies of The University of Manitoba in partial fulfillment of the requirements of the degree of MASTER OF SCIENCE Department of Medical Microbiology University of Manitoba Winnipeg Copyright © 2015 by Kenzie Dawn Birse
-
Upload
khangminh22 -
Category
Documents
-
view
0 -
download
0
Transcript of Kenzie Dawn Birse - MSpace - University of Manitoba

The influence of ovarian hormones on the mucosal proteome of the female genital
tract & the implications for HIV susceptibility in women
By
Kenzie Dawn Birse
A Thesis submitted to the Faculty of Graduate Studies of
The University of Manitoba
in partial fulfillment of the requirements of the degree of
MASTER OF SCIENCE
Department of Medical Microbiology
University of Manitoba
Winnipeg
Copyright © 2015 by Kenzie Dawn Birse

I
Abstract
Increased HIV susceptibility has been associated with the progesterone-dominant luteal phase of
the menstrual cycle and the use of progesterone-only contraceptives, yet the mechanism is poorly
understood. Here, we performed mass spectrometry-based analyses of cervicovaginal fluids
collected from women with differing ovarian hormone levels as demonstrated by menstrual cycle
phase or exogenous progesterone-only contraceptive use. We found that proteins associated with
maintaining the integrity of epithelial barrier were enriched during times of high estradiol,
whereas during times of high progesterone, there was a loss of barrier integrity proteins and an
enrichment of proteins with known roles in inflammatory processes including leukocyte
infiltration. Progesterone-based proteomic profiles were also strongly associated with neutrophil
signatures with some evidence of CD4+ T cell signatures. This study generates new hypotheses
about the potential mechanisms of hormone-associated HIV susceptibility including a weakened
epithelial barrier and increased HIV target cell recruitment during times of increased
progesterone.

II
Acknowledgements
This body of work would not have been possible without the help, encouragement and
collaboration of many individuals. First and foremost, I would like to extend a huge thank you to
my supervisor, Dr. Adam Burgener. Thank you for insisting that I pursue graduate studies, and
for all of your guidance along the way. Thank you for helping me find my career path in
research. I truly believe scientific research is the most gratifying work I could be doing, and I
want to thank you for helping me realize that!
Thank you to all of the Burgener lab members for your camaraderie and insightfulness. Thank
you to Laura Romas for being such a supportive colleague and friend. I am certain I would not
have enjoyed my graduate work as much as I have without you! Thanks to Max Abou, the
“Master Digester” for his excellent work as a technician and for all the entertaining
conversations over the bench top. Michelle Perner, Jennifer Butler, Lauren Girard, Liane Arcinas
and Irene Xie, thanks for being such bright and enjoyable people to work with. It has been a
pleasure to work with you all!
Thank you to my co-supervisor, Dr. Blake Ball for allowing me the opportunity to work in his
lab as both a co-op student and a graduate student, and for his helpful advice throughout this
project. I would also like to thank all of his lab members including those from both the past and
present for taking the time to listen to my ideas and for helping me grow as both a student and a
scientist. I would especially like to thank Dr. Aida Sivro, Dr. Derek Stein and Margot Plews for
helping me learn the most basic lab skills as a co-op student, without which I would not have
been able to perform the work necessary for this project.
Thank you to my committee members, Dr. Kevin Coombs and Dr. Dana Moffatt for agreeing to
sit on my committee and for their advisement over the course of my Master’s project. All of your
comments and suggestions have been greatly appreciated.
I would like to extend a very big thank you to the Public Health Agency of Canada’s Mass
Spectrometry core: Dr. Garrett Westmacott, Stuart McCorrister, and Dr. Patrick Chong for
running my samples on their mass spectrometers, and teaching me the ins and outs of mass
spectrometry. You are truly mass spectrometry wizards!
I also want to thank all of our collaborators who shared their clinical samples with us and/or
designed studies with us to specifically answer questions that arose from this study’s initial
findings. These individuals include: Dr. Richard Novak and his team from the University of
Chicago at Illinois for the samples from the Chicago cohort; Dr. Kristina Broliden, Dr. Klara
Hasselrot and Frideborg Bradley for collecting samples from the IMMENSE cohort; Dr.
Brandon Guthrie for sharing samples from the CAT cohort; and Dr. Frank Plummer and all of
the Nairobi staff for establishing and collecting samples from the Pumwani cohort. Of course, I
would like to extend my most sincere gratitude to all the women from these cohorts who agreed

III
to provide their samples, without their selfless contributions, this study would not have been
possible.
A very big thank you must also be extended to our collaborators from MIT. Dr. Douglas
Lauffenburger, thank you for allowing me to visit your lab, thank you for taking the time to meet
with me to discuss my analysis, and thank you for your contributions to our manuscript. Dr.
Kelly B. Arnold, thank you so very much for teaching me how to code in MatLab and for
teaching me how to perform multivariate modeling. You are an awesome teacher and I truly
appreciate the time you took to teach me these invaluable skills.
I would also like to extend my gratitude to all of the support staff: Syeda Rahman, Christine
Mesa, Sue Ramdahin, Angela Nelson, Jude Zieske, and Sharon Tardi for all of their assistance.
From administrative tasks, sending out reminders about important events, ordering new
reagents, helping track down specific clinical samples, to helping with shipments, import
permits, you name it; you have all played a large role in ensuring my graduate work reached
completion, and I thank you for that!
Thank you to Research Manitoba (Manitoba Health Research Council) for specifically funding
my graduate work. It is greatly appreciated!
Finally, I would like to thank my family for their continued support over the entirety of my
educational adventure, and a special thank you goes out to my husband for always being there
for me to celebrate the good days, and for pushing me through the bad ones by reminding me
about the importance of the work that I do, and never letting me give up. Much love!

IV
Dedication
To my parents:
Thank you for instilling within me an insatiable curiosity, and for teaching me both patience and
perseverance. These traits have been the driving force behind this thesis, and without them I
would not have succeeded in my scientific endeavours.

V
Table of Contents
Abstract ...................................................................................................................................... I
Acknowledgements .................................................................................................................. II
Dedication ............................................................................................................................... IV
Table of Contents ..................................................................................................................... V
List of Tables .......................................................................................................................... IX
List of Figures ........................................................................................................................... X
Publications arising from this thesis ................................................................................... XII
Chapter 1: Introduction ........................................................................................................... 1
1.1 The HIV Pandemic................................................................................................. 1
1.1.1 Classification & Origins ......................................................................... 1
1.2 HIV Virology .......................................................................................................... 3
1.2.1 Structure .................................................................................................. 3
1.2.2 Life Cycle................................................................................................ 3
1.3 HIV Transmission .................................................................................................. 4
1.4 Host Immunity........................................................................................................ 5
1.5 Current Prevention Efforts ................................................................................... 6
1.5.1 Pre-Exposure Prophylaxis ....................................................................... 7
1.5.2 Other HIV Acquisition Risk Factors..................................................... 10
1.6 HIV Susceptibility in Women & the Female Genital Tract ............................ 12
1.6.1 HIV Vulnerability Unique to Women................................................... 12
1.6.2 Defensive barriers of the FGT .............................................................. 12
1.6.2.1 Physical Defense Barriers ......................................................... 13
1.6.2.2 Cellular Defense Barriers .......................................................... 14
1.6.2.3 Molecular Defense Barriers ...................................................... 15
1.6.3 Hormonal Regulation of the Defensive Barriers of the FGT ................ 16
1.6.3.1 Impact of Endogenous Hormones & the Menstrual Cycle ....... 16
1.6.3.2 Impact of Exogenous Hormone Application ............................ 19
1.7 Study Rationale, Hypothesis, and Objectives .................................................... 20
1.7.1 Rationale ............................................................................................... 20
VI
1.7.2 Global Hypothesis ................................................................................. 21
1.7.2.1 Sub-hypotheses ......................................................................... 22
1.7.3 Objectives ............................................................................................. 22
Chapter 2: Materials and Methods ....................................................................................... 24
2.1 Study Populations & Ethics Statements............................................................. 24
2.1.1 Chicago Cohort ...................................................................................... 24
2.1.2 Pumwani Cohort .................................................................................... 24
2.1.3 IMMENSE Cohort ................................................................................ 25
2.1.4 CAT Cohort ........................................................................................... 25
2.2 General Reagents ................................................................................................. 26
2.3 Sample Collection ................................................................................................. 26
2.3.1 Cervicovaginal Lavage Sample Collection ........................................... 26
2.3.2 Plasma Collection ................................................................................. 27
2.4 Hormone Measurements ..................................................................................... 27
2.4.1 Pumwani cohort .................................................................................... 27
2.4.2 IMMENSE cohort ................................................................................. 27
2.5 BCA (bicinchoninic acid) protein assay ............................................................. 28
2.6 Protein Digestion & Mass Spectrometry Analysis ............................................ 28
2.6.1 Overnight Trypsin Digestion ................................................................ 28
2.6.2 Reverse Phase Liquid Chromatography................................................ 29
2.6.3 Peptide Quantification .......................................................................... 29
2.6.4 Mass Spectrometer Run Details ............................................................ 30
2.6.5 Label-Free Proteomic Data Analysis .................................................... 31
2.7 Statistical Analysis of Proteomic Data ............................................................... 32
2.7.1 Technical Variability & Sample Outlier Filtering ................................. 32
2.7.2 Data Normalization ............................................................................... 33
2.7.3 Statistical Tests & Pathway Analysis .................................................... 33
2.7.4 Least Absolute Shrinkage and Selection Operator and Partial
Least-Squares Discriminant Analysis .................................................... 34
2.7.5 Gene Set Enrichment Analysis .............................................................. 35
Chapter 3: Results................................................................................................................... 37
3.1 Mucosal Proteomics Method & Sampling Optimization
3.1.1 Technical Comparison of Peptide Recovery & Desalting Methods ..... 37
3.1.1.1 Peptide Recovery Method Optimization ................................... 37

VII
3.1.1.2 Peptide Desalting Method Comparison .................................... 38
3.1.1.3 Summary ................................................................................... 40
3.2 Proteomic Changes in the Genital Mucosa over the Menstrual Cycle
3.2.1 Study Aim ............................................................................................. 41
3.2.2 Primary Cohort Results ..................................................................... 41
3.2.2.1 Clinical Information .................................................................. 41
3.2.2.2 Study Design ............................................................................. 42
3.2.2.3 Univariate Analysis ................................................................... 42
3.2.2.4 Multivariate Analysis ................................................................ 49
3.2.2.5 Bacterial Analysis ..................................................................... 53
3.2.2.6 Gene Set Enrichment Analysis ................................................. 55
3.2.3 Validation Cohort Results .................................................................. 56
3.2.3.1 Clinical Information .................................................................. 56
3.2.3.2 Study Design ............................................................................. 58
3.2.3.3 Univariate Analysis & Primary Cohort Overlap ....................... 59
3.2.3.4 Multivariate Analysis ................................................................ 60
3.2.3.5 Bacterial Analysis ..................................................................... 65
3.2.3.6 Gene Set Enrichment Analysis ................................................. 68
3.3 Endogenous Hormone and Genital Tract Mucosal Factor Associations
3.3.1 Study Aim ............................................................................................. 69
3.3.2 Clinical Information .............................................................................. 69
3.3.3 Study-Specific Methods ........................................................................ 70
3.3.4 Estradiol Spearman Correlations ........................................................... 72
3.3.5 Progesterone Spearman Correlations .................................................... 74
3.3.6 Overlapping Findings ............................................................................ 76
3.3.6.1 Estradiol and Progesterone Correlate Overlap .......................... 76
3.3.6.2 Cohort Data Overlap ................................................................. 77
3.4 Exogenous Progesterone Application & Mucosal Barrier Integrity
3.4.1 Study Aim ............................................................................................. 80
3.4.2 Clinical Information .............................................................................. 80
3.4.3 Study Design ......................................................................................... 81
3.4.4 Univariate Analysis ............................................................................... 82
3.4.5 Multivariate Analysis ............................................................................ 86
3.4.6 Gene Set Enrichment Analysis ............................................................. 87
3.4.7 Functional Overlap Between the Luteal Phase and DMPA Use........... 88
Chapter 4: Global Discussion ................................................................................................ 91
4.1 General Discussion ................................................................................................ 91
4.2 Study Limitations & Future Directions ............................................................ 106
4.3 Contributions & Importance to the HIV Field ................................................ 107
4.4 Concluding Remarks .......................................................................................... 108

VIII
Chapter 5: References .......................................................................................................... 109
Chapter 6: Appendices ......................................................................................................... 118
6.1 List of Abbreviations ......................................................................................... 118
6.2 Gene Set Enrichment Analysis Results
6.2.1 Results from Chicago cohort ............................................................... 119
6.2.2 Results from IMMENSE cohort .......................................................... 120
6.2.3 Results from CAT cohort .................................................................... 121
6.3 Endogenous Hormone and Mucosal Factor Spearman Correlations
6.3.1 Pumwani Estradiol Correlates ............................................................. 123
6.3.2 Pumwani Progesterone Correlates ....................................................... 123
6.3.3 IMMENSE Progesterone Correlates ................................................... 124
6.3.4 IMMENSE Estradiol Correlates .......................................................... 127

IX
List of Tables
Table 3.1 Primary cohort clinical information .................................................................42
Table 3.2 Differentially abundant proteins associated with the follicular and luteal
phases of the menstrual cycle ..........................................................................45
Table 3.3 Luteal phase-enriched biological functions with predicted activation states...49
Table 3.4 LASSO-selected features from the primary cohort menstrual cycle phase
data ...................................................................................................................52
Table 3.5 Immunology of menses/validation cohort clinical information .......................58
Table 3.6 LASSO-selected features from validation cohort menstrual cycle phase
data ...................................................................................................................64
Table 3.7 Estradiol correlate biological functions with predicted activation states .........73
Table 3.8 Progesterone correlate biological functions with predicted activation states ..75
Table 3.9 Couple against transmission cohort contraceptive methods ............................80
Table 3.10 Differentially abundant proteins associated with DMPA use ..........................84
Table 3.11 Biological functions of proteins significantly associated with DMPA use .....85
Table 3.12 Biological functions with predicted activation states based on all proteins
measured in DMPA users versus non-HC users ..............................................85
Table 3.13 LASSO-selected features from DMPA user data ............................................87

X
List of Figures
Figure 1.1 A brief overview of the natural defenses of the female genital tract ...............13
Figure 1.2 The menstrual cycle .........................................................................................17
Figure 2.1 Sample outlier discovery..................................................................................32
Figure 2.2 Q-Q normality plot ...........................................................................................33
Figure 2.3 P-value frequency and false discovery rate analysis ........................................34
Figure 3.1 Flip versus flow-through method comparison heat map ..................................39
Figure 3.2 Peptide elution profile comparison after desalting .........................................40
Figure 3.3 Schematic of menstrual cycle study design and experimental work flow .......43
Figure 3.4 Volcano plot of the differentially abundant proteins based on the luteal
and follicular phases of the menstrual cycle ....................................................44
Figure 3.5 Hierarchical clustering and bio-functional analysis of differentially
abundant proteins during the follicular phase and the luteal phase .................48
Figure 3.6 Multivariate menstrual cycle phase-based model from primary cohort data ...51
Figure 3.7 Partial least-squares discriminant analysis of bacterial proteins from
primary cohort ..................................................................................................54
Figure 3.8 Pie chart of bacterial genera-specific proteins identified in the primary
cohort ...............................................................................................................54
Figure 3.9 Top two gene sets enriched during the follicular phase and the luteal phase
based on data from the primary cohort ............................................................57
Figure 3.10 Longitudinal plots of plasma hormone levels used to determine menstrual
cycle phase .......................................................................................................59
Figure 3.11 Menstrual cycle phase-based heat maps and cohort overlap. ..........................61
Figure 3.12 Pathway and bio-function comparison analysis between primary and
validation cohorts .............................................................................................62
Figure 3.13 Multivariate model based on validation cohort data ........................................62
Figure 3.14 Partial least-squares discriminant analysis of the bacterial proteins
identified in the validation cohort data set. ......................................................66

XI
Figure 3.15 Pie chart of bacterial genera-specific proteins identified in the validation
cohort ...............................................................................................................67
Figure 3.16 Top two gene sets associated with the follicular phase and the luteal phase
based on data from the validation cohort .........................................................70
Figure 3.17 Top ten pathways associated with plasma estradiol mucosal factor
correlates ..........................................................................................................74
Figure 3.18 Top ten pathways associated with plasma progesterone mucosal factor
correlates ..........................................................................................................76
Figure 3.19 Biological function comparison analysis of progesterone correlates
identified in two different cohorts of women ..................................................78
Figure 3.20 Overlapping pathways associated with the ovarian hormone correlates
measured in two different cohorts of women ..................................................79
Figure 3.21 Seminal contamination exclusion criteria ........................................................81
Figure 3.22 Volcano plot of differentially abundant proteins between DMPA users and
non-hormonal contraceptive users ...................................................................83
Figure 3.23 Multivariate model based on data from DMPA users and non-hormonal
contraceptive users ...........................................................................................86
Figure 3.24 Top two gene sets associated with DMPA use and non-hormonal
contraceptive use ..............................................................................................89
Figure 3.25 Bio-functional comparison analysis of luteal phase and DMPA mucosal
proteomic profiles ............................................................................................90
Figure 4.1 Overlapping themes of this study’s findings .................................................103
Figure 4.2 Proposed model of hormone-associated HIV susceptibility ..........................105

XII
Publications arising from this thesis
Kenzie Birse, Kelly B. Arnold, Richard M. Novak, Stuart McCorrister, Souradet Shaw, Garrett
R. Westmacott, Terry B. Ball, Doug Lauffenburger, Adam Burgener. 2015. Molecular signatures
of immune activation and epithelial barrier remodelling are enhanced during the luteal phase of
the menstrual cycle: implication for HIV susceptibility. Journal of Virology. 89(17):8793:805.

1
Chapter 1. Introduction
1.1 The HIV Pandemic: The ongoing Human Immunodeficiency Virus (HIV) pandemic has
and continues to devastate many individuals across the globe, leaving children orphaned,
families fractured, and local economies disrupted. The first known and confirmed case of HIV
infection dates back to 1959 [1], however HIV-related pathologies were not recognized as
interrelated outcomes from the same disease until 1981 when clusters of young, homosexual men
in New York City and Los Angeles began presenting with Pneumocystis pneumonia and
Kaposi’s sarcoma [2,3], illnesses most often associated with compromised immunity. The
causative agent of this immunodeficiency, initially known as Human T-Lymphotropic Virus,
type III, now known as HIV, was first discovered in 1983 by French and American scientists
[4,5]. Since this discovery, an estimated 39 million people have died from HIV/AIDS, and over
35 million people are living with HIV today with an estimated 2.1 million new infections
believed to occur each year based on the most recent data from the World Health Organization
(WHO) [6]. Sub-Saharan Africa represents the most heavily burdened region with women
disproportionately affected; accounting for 58% of HIV infected individuals. Furthermore, young
women, aged 15-24 from this area represented 60% of all newly infected individuals in 2013 [7].
Young women therefore represent a unique group at high risk for acquiring HIV, and reasons for
this increased susceptibility require further investigation.
1.1.1 Classification & Origins: HIV is classified in the family Retroviridae, subfamily
Orthoretrovirinae and genus Lentivirus [8,9]. The prefix ‘lenti’ literally translates to the word
‘slow’ meaning lentiviruses are slow viruses that incubate within their host for long periods of
time and often result in long-term illnesses, which is certainly the case for HIV and its resulting
2
acquired immunodeficiency syndrome (AIDS). HIV can be further classified into two separate
species known as HIV-1 and HIV-2. Both species are believed to have originated from simian
immunodeficiency viruses (SIV) from non-human primates likely through human contact with
infected simian bodily fluids and/or through the consumption of bush meat [10]. HIV-1 was
transmitted across the species barrier on at least four separate occasions resulting in group
variations M, N, O and P [11,12]. Group variants M, N, and O are believed to have been
transmitted from chimpanzees (Pan troglodytes troglodytes) and variant P is believed to have
arisen from an SIV strain from gorillas (Gorilla gorilla) [11,12]. However, the HIV-1 group that
accounts for over 90% of HIV-1 infections in humans and is responsible for the HIV/AIDS
pandemic of today are viruses belonging to the “main” group or group M. Viruses within group
M can be further categorized into nine clades: A, B, C, D, F, G, H, J and K based upon genetic
diversity [6]. Clades A and C account for the majority of new infections worldwide, and these
clades are found predominantly in Africa and parts of southeast Asia, while clade B viruses
account for the majority of infections in Europe, Australia and the Americas [10].
HIV-2 origination has been traced back to cross-species transmission with sooty
mangabeys (Cercocebus atys) [10]. These cross-species transmission events also occurred
several times resulting in HIV-2 groups A to H [13]. HIV-2 is known to be less infectious than
HIV-1 as it reaches a lower viral load set point [14] resulting in decreased odds of transmission
and slower disease progression within the infected individual [15,16]. However, there are still a
number of HIV-2 infections found in West Africa with clades A and B representing the endemic
strains [10].

3
1.2 HIV Virology:
1.2.1 Structure: HIV virions are 100-120nm spheres that consist of an envelope made of a
lipid bilayer derived from its host cell. This envelope is embedded with various protruding viral
glycoproteins that give HIV its characteristic spiky appearance as seen via electron micrograph.
These glycoproteins include gp120 and gp41, and together these proteins form a trimeric
complex. Gp120 forms the outer most spike/protrusion and gp41 is found within the membrane
where it functions as a transmembrane anchor. Encompassed by envelope are structural proteins
that make up the capsid and nucleocapsid, including p24 proteins and p7 proteins, respectively.
Enclosed within the nucleocapsid are the genetic contents of the virus, two copies of roughly 9.7
kilobases of single-stranded positive sense RNA. This genome contains 9 genes that encode for
the aforementioned proteins. Structural proteins that make up the matrix, capsid, nucleocapsid
and envelope glycoproteins are derived from the gag and env genes; viral enzymes such as
protease, reverse transcriptase and integrase are derived from the pol gene; regulatory proteins
are derived from the tat and rev genes; and HIV’s accessory proteins are derived from the vpu,
vif, vpr and nef genes (reviewed in [17]).
1.2.2 Life Cycle: When free HIV virus encounters its preferred targets cells, it gains entry
through the binding of gp120 to the target cell’s CD4 receptor (found on T lymphocytes and
macrophages) and to the virus’s preferred co-receptor [R-tropic virus=C-C chemokine receptor
type 5 (CCR5), X-tropic virus=C-X-C chemokine receptor type 4 (CXCR4)] [18,19]. This
binding causes a conformational change in gp41 which ultimately leads to the viral envelope
fusing with the membrane of the target cell, releasing its viral contents in to the cell’s cytoplasm
[20]. The viral particle then uncoats and replication can begin. The viral RNA is reverse

4
transcribed into single-stranded DNA, and then further transcribed into double-stranded proviral
DNA by its virally encoded reverse transcriptase. Once the proviral DNA is synthesized, it can
then be imported into the host cell’s nucleus where it can integrate into the host genome using
the virally encoded integrase. Once this virus is integrated it can become latent and successfully
evade the host immune response, or the proviral DNA can also be transcribed by the host’s
transcription machinery to generate more infectious viral particles. These viral transcripts can
then be translated into long polypeptides that are cleaved by HIV’s virally encoded protease. The
viral proteins and newly formed RNA transcripts are transported to the cellular membrane and
assembled. Newly formed viral particles then bud out and mature through various protease-
mediated modifications (reviewed in [21]).
1.3 HIV Transmission: HIV can be transmitted in a number of ways including vertically
from mother to child or horizontally through exposure to infected bodily fluids either through
sexual contact, by receiving a contaminated blood transfusion, or by sharing contaminated
syringes [22]. Globally, HIV is still most often transmitted via sexual contact with heterosexual
intercourse as the predominant mode of contact in the most HIV-burdened areas of the world [6].
Without any form of intervention, the odds of successful sexual transmission can range from
0.01-1.86% per sex act with oral sex generating the lowest risk (0-0.04%), penile-vaginal sex
generating intermediate risk (0.01-0.14%), and receptive anal intercourse generating the greatest
risk (1.02-1.86%) [23]. It is estimated that as many as 19 million individuals are currently HIV
positive, but do not know their HIV status [7]. This population along with the inconsistent use of
prevention methods like condoms is one of the main reasons HIV continues to infect over 2

5
million people globally per year, and it is for this reason the development of novel and
efficacious prevention technologies remains a public health priority [24].
1.4 Host Immunity: The human immune system is both friend and foe to HIV. On one hand
HIV requires its hosts’ immune cells for replication and survival, yet if the host is able to mount
an appropriate response it can destroy the virus altogether. The human immune system consists
of two arms: the innate immune system and the adaptive immune system. The innate immune
system functions as the first responder to potential threats; this response is both immediate and
antigen non-specific. Components of the innate immune system include the epithelial barrier,
mucosal fluid and various innate cells such as phagocytes (dendritic cells, and
monocytes/macrophages), granulocytes (neutrophils, mast cells, basophils, eosinophils) and
natural killer cells. Molecular components of the innate immune system include complement,
acute phase proteins and various secreted factors produced by immune cells such as cytokines
and antimicrobial peptides. The adaptive immune system is very specific and is initially much
slower in producing a response than the innate immune system. This is because it takes time to
develop a specific response to new antigenic determinants. The benefit to this slow-to-develop
response is that it is specific to the target/antigen with which it is presented resulting in much
less bystander damage to host tissues, and that immunologic memory to that specific antigen can
also be developed. Memory to the antigen can then be used to elicit a rapid antigen-specific
response upon subsequent exposures. The adaptive immune system can also be further
subdivided into two branches: humoral immunity and cell-mediated immunity. Humoral
immunity is generated through antibodies produced and secreted by antigen-specific B cells; this
form of immunity is very important for targeting extracellular pathogens. Cell-mediated

6
immunity is primarily mediated by T cells. CD4+ T cells are the coordinators of the adaptive
immune response as they help direct effector cells to mount appropriate responses to the
corresponding stimulus. For instance, CD4+ T cells help to prime B cells to produce antibodies
and CD8+ cytotoxic T cells to kill cells infected with intracellular pathogens such as viruses
(reviewed in [25]). The host immune response is particularly hindered in individuals infected
with HIV as CD4+ T cells are the virus’ preferred target cell. In fact, the definition of AIDS is
based on CD4+ T cell levels, such that an HIV-infected individual is clinically defined to have
AIDS when their CD4+ T cell count falls below 200 cells/µL in their peripheral blood. This
decline in CD4+ T cells leaves the infected individual incapable of mounting effective immune
responses against opportunistic pathogens which can ultimately lead to their death (reviewed in
[26]).
1.5 Current HIV Prevention Efforts: Understanding that sexual contact functions as a
major route of transmission, it is logical to utilize sexual interventions as a means of preventing
infection. Behavioural interventions include partaking in abstinence, monogamy or reducing
one’s number of sexual partners. Physical interventions include male circumcision or the use of
barrier methods such as condoms; both of which have been shown to decrease the risk of
acquiring HIV up to 73% in men and 80% in both sexes, respectively [23,27,28]. Further to
these physical methods, there are also chemical agents such as antiretroviral therapy (ART)
drugs that can, and have immensely reduced the number of new HIV infections since their
implementation. ART is used to treat HIV-infected patients to improve duration and quality of
life by lowering viral loads to undetectable levels. This reduction in viral load also translates to
fewer new infections as it reduces HIV-infected individuals’ infectiousness and transmissibility.
7
HIV transmission can be reduced by as much as 99.4% when both ART and condoms are
properly utilized [23].
1.5.1 Pre-exposure Prophylaxis: ART can also be used by HIV-uninfected individuals as a
form of pre-exposure prophylaxis (PrEP). PrEP drugs can be administered using various
approaches including: topical microbicide gels [29], oral pills [30-33], drug-eluting rings and
films [34,35], or long-acting injectables [36,37]. Tenofovir-emtricitabine has been the forerunner
in most clinical PrEP trials as it was the first drug approved by the Food and Drug
Administration (FDA) in 2012 [38]. Tenofovir (TFV) is a nucleotide reverse transcriptase
inhibitor and emtricitabine (FTC) is a nucleoside reverse transcriptase inhibitor. Trials examining
their efficacy separately or in combination have been met with varying results. The Centre for
the AIDS Programme of Research in South Africa 004 (CAPRISA-004) trial found that a 1%
TFV vaginal gel applied peri- and postcoitally reduced HIV infection by 39% [29]. Yet, the
Follow-on African Consortium for Tenofovir Studies 001 (FACTS-001), a follow-up trial to
CAPRISA-004 was unable to confirm this efficacy due to a lack of drug adherence [39]. A small
subgroup of women who were adherent such that TFV was detectable within their genital fluids
were shown to have their risk of HIV acquisition reduced by 52%. The young women who
participated in this study reported difficulties with adherence due to issues with discretion whilst
living at home with their parents. Fortunately, there are newer PrEP delivery methods
undergoing clinical trials that can be applied more discretely.
One such method is the daily use TFV-FTC oral pills. TFV-FTC pills have been found to
be efficacious in a variety of clinical trials examining various risk groups such as African women

8
in HIV-serodiscordant relationships (HIV-negative women with HIV-positive male partners),
who had their risk reduced by 91% [33]. The IPERGAY (Intervention Préventive de l’Exposition
aux Risques avec et pour les hommes GAYs) and PROUD (Pre-exposure Option for reducing
HIV in the UK: an open-label randomisation to immediate or Deferred daily Truvada for HIV
negative gay men) pilot studies found that men who have sex with men (MSM) and transgender
women taking TFV-FTC either peri- and postcoitally or daily, respectively, each reduced their
risk of acquisition by 86% [40]. Interestingly, the iPREX (Iniciativa Profilaxis Pre-Exposicón)
trial found that MSM and transgender women who took their tablets at least four days per week
had no incidence of HIV infection [41]. These results are promising and demonstrate that TFV-
FTC pills are protective in real life settings including times when participants are not completely
adherent to their drug regimens. However, these PrEP formulations have been found to be much
less efficacious in young women due to issues with drug concentrations at the site of exposure
[42]. One female-specific biological variable that could be impacting the availability of active
drug at the site of exposure is ovarian hormone levels. Indeed, ovarian hormones have been
shown to impact active, intracellular drug concentrations of TFV in various genital tract cells.
One study in particular found CD4+ T cells isolated from the genital tract that were treated with
progesterone had lower levels of active TFV than non-hormonally treated controls [43]. Clearly,
further studies examining the impact of ovarian hormones on the genital tract’s mucosal
immunology are required to better design efficacious PrEP drugs for women.
Since TFV-FTC’s FDA approval, other PrEP formulations have been approved and are
currently being studied such as Maraviroc, a CCR5 antagonist, that is currently undergoing
safety and tolerability evaluation in the NEXT-PrEP (Novel Exploration of Therapeutics

9
(NEXT) for Pre-Exposure Prophylaxis (PrEP)) trial [44]. Dapivirine, a non-nucleoside reverse
transcriptase inhibitor, applied using a vaginal ring is currently being investigated in the ASPIRE
(A Study to Prevent Infection with a Ring for Extended Use) trial in African women [45]. The
Film Antiretroviral Microbicide Evaluation 02 (FAME-02) trial has also shown that Dapivrine
delivered via a vaginal film is also safe, tolerable, and capable of delivering suitable drug
concentrations to its target site. This delivery method is also undergoing further study [46].
Lastly, another delivery method that shows great promise is the long-lasting injectable. Current
injectable formulations include rilpivirine, a non-nucleoside reverse transcriptase inhibitor, and
cabotegravir, an integrase strand transfer inhibitor. These injectable formulations are currently
undergoing Phase II studies [47]. Injectable ART holds a great deal of promise as it is believed
this quarterly applied therapy will help overcome issues with adherence [48].
Further to these PrEP drugs, there are also numerous HIV vaccines that are being
developed. Many vaccines that have undergone clinical trials were not found to be efficacious
against HIV-1 infection [Vax003, Vax004, HIV Vaccine Trial Network (HVTN) 502, 503, and
505) [49]. The RV144 vaccine trial conducted in Thailand is the only HIV vaccine thus far to
demonstrate efficacy against HIV-1 infection as it was shown to reduce HIV acquisition rates by
31.2% [49,50]. The RV144 vaccine was based on a prime-boost regimen, which consisted of
four injections of ALVAC-HIV, a recombinant canarypox vector vaccine, that was used to
prime, and two booster injections of AIDSVAX, a recombinant glycoprotein 120 subunit vaccine
[50]. Follow-up studies have identified immune correlates believed to be associated with the
modest protection observed, such as antibodies specific for the V1V2 region of gp120 that
mediate antibody-dependent cell-mediated cytotoxicity [49,51]. Vaccine trials using a modified

10
version of the RV144 vaccine with improved HIV-1 envelope immunogens are currently being
conducted in heterosexual populations in South Africa (HVTN 100) and MSM populations in
Thailand (RV306).
Despite the promising results of these various forms of chemoprophylaxis, hurdles still
remain as a vaccine with license-worthy efficacy has yet to be designed, and antiretroviral drugs,
although highly efficacious are currently only available to about one third of HIV-infected
individuals, let alone to HIV-uninfected individuals who wish to use them for prevention. The
cost of ART is one of the main barriers prohibiting most individuals from accessing these life-
saving drugs. Therefore, it is important that new, efficacious treatment and prevention therapies
are developed to help drive down these costs through competition. New drugs will also help to
combat ART resistance, and may present new options to individuals who develop negative side
effects to current treatments. Furthermore, current forms of chemoprophylaxis are not efficacious
for all populations including young women who represent one of the most at-risk groups in the
most HIV burdened areas of the world; therefore more studies are required to better understand
biological variables specific to women which may affect their susceptibility. This understanding
will help in designing better prevention technologies and mitigate future infections.
1.5.2 Other HIV Acquisition Risk Factors: There are many other factors known to
contribute to a person’s susceptibility to HIV infection beyond those mentioned (male foreskin,
high-risk behaviours, unprotected sex, lack of ART) such as immune activation, age, and sex.
Immune activation state is a better predictor than viral load for disease progression and mortality
in HIV-infected individuals [52], it therefore follows that individuals already primed and in an

11
immunologically active state would also be more likely to become infected with HIV when
challenged. The role of immune activation and its impact on HIV acquisition risk has been made
evident by the increased HIV acquisition rates among populations infected with other sexually
transmitted infections (STI) such as herpes simplex virus-2, chlamydia, syphilis, and gonorrhoea
[53-56], and the influence of both age and sex on HIV susceptibility has been demonstrated by
studies conducted in South Africa. These studies discovered that women between the ages of 15
to 49 had significantly higher HIV prevalence than men, with a particularly large disparity
amongst those 15-24 years of age [57]. One possible behavioural explanation for this increase in
prevalence amongst young women is the fact that they were more likely to participate in sexual
relationships with older male partners than their age-matched male counterparts. Male HIV
prevalence is known to increase with age with highest prevalence between the ages of 35 to 39
[57], and these sexual relationships would therefore increase these young women’s likelihood of
exposure. However, a nested study examining HIV-infected cases versus controls from
CAPRISA-004 found that the likelihood of HIV acquisition could not be fully explained by
young age or STI status alone, thus it was postulated that there must be some other variable
influencing susceptibility. Interestingly, they discovered that the cases had an overall higher
innate immune activation state. Upon further investigation, they also discovered that highly
adherent cases assigned to the TFV arm of the trial with high levels of innate immune activation
were unable to benefit from the prophylactic properties of TFV as their active immune state
outweighed whatever protection was produced (reviewed in [58]). The cause of this increased
immune activation was not attributed to concurrent STIs, and was reportedly unknown. This
study demonstrates that there is still a great deal to be understood about inflammation and its
unique sources in women. Discovering what these immune activating sources are will be

12
important for the development of efficacious HIV prevention technologies that can target these
potential sources and mitigate the downstream immune activating effects.
1.6 HIV Susceptibility in Women & the Female Genital Tract:
1.6.1 HIV Vulnerabilities Unique to Women: Women are more susceptible to HIV infection
than their male counterparts when exposed via heterosexual intercouse [57,59,60]. Reasons for
this increased vulnerability include both social and biological variables unique to women. Social
variables may include the inability to negotiate mutual monogamy and/or the inability to enforce
their partner’s use of barrier-based contraceptives such as condoms. Biological variables include
the larger surface area and the microbial-growth promoting environment of the female genital
tract (FGT), and its increased likelihood of developing abrasions during intercourse. Other
biological variables includes high viral loads present in HIV-infected semen, female-specific
infections such as bacterial vaginosis and the various physical and immunological changes,
associated with fluctuating ovarian hormone levels such as estradiol and progesterone, that occur
over the menstrual cycle or through the use of hormonal contraceptives [61-65].
1.6.2 Defensive Barriers of the Female Genital Tract: When a woman is exposed to HIV
during heterosexual intercourse, there are a plethora of defensive barriers, including physical;
cellular; and molecular barriers, the virus must first overcome before establishing an infection
(Figure 1.1).

13
Figure 1.1 A brief overview of the natural defenses present in the female genital tract including the physical,
cellular and molecular barriers. (Image made by Kenzie Birse using purchased, pre-made cells from Motifolio)
1.6.2.1 Physical Defense Barriers: Physical barriers include the genital tract epithelium which
is non-keratinized, stratified, squamous in the lower FGT (vagina and ectocervix), and transitions
to simple columnar cells held together by tight junctions in the upper FGT (endocervix,
endometrium, and fallopian tubes) [66]. Maintaining the integrity of these barriers is of the
utmost importance as the epithelium functions as the first line of defense, and is very effective in
preventing foreign materials such as pathogens from gaining access to the host’s system when it
remains intact. The one-layer thick epithelium of the upper FGT is more vulnerable to pathogens
than the lower FGT, but this compartment is further protected by a mucin-based plug generated
in the endocervix. This sticky mucous is believed to help separate the relatively sterile upper
FGT from the microbe-enriched environment of the lower FGT. The lactic acid-producing

14
microbes, which are predominately Lactobacilli in healthy individuals, present in the lower FGT
also play a major role in the physical defensive barrier, as the acid they produce prevents the
growth of non-commensal/pathogenic microbes. The displacement of Lactabacilli with non-
commensal microbes results in a condition called bacterial vaginosis [67]. Bacterial vaginosis is
known to impact innate immunity within the FGT and is a known risk factor for HIV acquisition
[67,68].
1.6.2.2 Cellular Defense Barriers: There are also a variety of immune cells found interspersed
throughout the genital tract that are important for cellular defense against pathogens such as
dendritic cells (DCs), macrophages, neutrophils, natural killer cells (NKs), and lymphocytes,
with T lymphocytes representing the predominant immune cell type found within the FGT [69].
These immune cells differ in number, phenotype, and locale between the upper and lower
compartments. For instance, DCs or Langerhans cells can be found within the stratified
epithelium of the lower FGT sampling antigens and presenting them to lymphocytes within the
submucosa, whilst DCs in the upper FGT are limited to the submucosa [66]. Natural killer cells
are found in greater numbers within the upper FGT and also phenotypically differ between
compartments such that they express little CD94 and high CD16 in the lower FGT compared to
the upper FGT [70]. The expression of these different markers suggest differing functionalities
such that the NK cells prevalent in the lower FGT are more so primed for antibody-dependent
cell-mediated cytotoxicity whilst upper FGT NK cells are primed to produce cytokines. NK cells
are also larger and more granular in the ectocervix than they are in the upper FGT suggesting NK
cells found in the lower FGT are more activated [70]. Considering the high prevalence of
extracellular microbes in the lower FGT compared to relative sterile environment of the upper

15
FGT, these differing NK phenotypes are biologically fitting (reviewed in [66,69,70]). It is clear
that the compartmental environments of the FGT impact the residing immune cells’ phenotypes;
therefore it is possible that the environmental immune milieu generated under differing hormonal
conditions may also induce phenotypical changes in immune cells important for HIV infection.
1.6.2.3 Molecular Defense Barriers: The epithelium of the FGT is also lined in a protective
fluid which contains various antimicrobial products secreted by epithelial cells and other immune
cells, and the factors found within this fluid make up the molecular defense barrier. Many of
these factors are known to affect HIV infectivity in vitro such as defensins, elastase, elafin,
serpins, mucosal IgA and others [71-74]. However, observations from in vitro studies do not
always represent what happens in vivo. For instance, although some of these factors demonstrate
anti-HIV properties in vitro, their presence in human mucosal fluids has actually been associated
with increased HIV acquisition risk [75,76]. For example, elevated levels of alpha-defensins and
secretory leukocyte peptidase inhibitor (SLPI) were associated with an increased risk of HIV
acquisition when detected in the foreskin of men [75], and increased levels of alpha-defensins
and LL37 in cervicovaginal secretions were associated with increased HIV risk in women [76].
On the contrary, increased levels of anti-inflammatory factors such as antiproteases have been
associated with reduced acquisition among highly exposed sex workers [72,77]. Clearly, the
interplay amongst these molecules is complex, and insights from in vitro studies examining the
effects of individual molecules on HIV infectivity are not adequate to understand their impact on
immunity in vivo. Therefore, mucosal samples collected from humans may be a more
representative model to study actual immunological events important for HIV susceptibility
and/or resistance.

16
Overall, the FGT is equipped with various defensive barriers that are able to prevent most
infections. However, as mentioned in section 1.6.1 there are biological variables that can dampen
the robustness of these barriers generating unique opportunities for pathogens to overcome the
hurdles of host immunity and ultimately thrive.
1.6.3 Hormonal Regulation of the Defensive Barriers of the Female Genital Tract:
1.6.3.1 Impact of Endogenous Hormones & the Menstrual Cycle: One such variable that has
proven to impact the defensive barriers of the FGT are endogenous hormone levels. Endogenous
hormones produced by both the ovaries and the pituitary gland of the brain are required for
priming the FGT for successful reproduction. These hormone levels dynamically change in a
cyclic manner over a set period, and play major roles in the physiological cycle known as the
menstrual cycle. The menstrual cycle can be divided into four stages: the menstrual phase, the
pre-ovulatory or follicular phase, the ovulatory phase, and the post-ovulatory or luteal phase
(Figure 1.2). Menstrual cycle duration varies from woman to woman, but generally ranges
between 21 to 35 days in length with 28 days considered average. Menses occurs at the
beginning of each cycle. After menstruation (around day 5 of the cycle), the pituitary gland
releases follicle-stimulating hormone (FSH) into the blood, which signals the ovary to begin
producing ovarian follicles. Once the dominant follicle is generated, it will begin producing
estradiol. Estradiol levels continue to increase as the follicle develops with peak levels occurring
mid-cycle just before ovulation. This peak in estradiol then triggers the pituitary gland to release
a large pulse of luteinizing hormone (LH) known as the LH surge. The LH surge causes the
mature follicle to rupture and release an egg. This LH surge signifies a transition into the

17
ovulatory phase. Once the egg is released from the ruptured follicle, the corpus luteum begins to
develop and produce estradiol and progesterone for the duration of the luteal phase. Progesterone
is the predominant hormone found at this time as it plays a major role in maintaining the lining
within the endometrium as it awaits implantation. If fertilization and implantation do not occur,
progesterone levels will peak during the mid-luteal phase, and the corpus luteum will begin to
degrade resulting in a sharp decrease in both progesterone and estradiol levels triggering the
onset of menstruation (reviewed in [69,78]).
Figure 1.2 The menstrual cycle. A diagrammatic representation of the fluctuating hormone levels and the resulting
physical changes known to occur within the ovaries and the endometrium over the course of the menstrual cycle: A.
Follicular phase B. Luteal phase. (Image made by Kenzie Birse using pre-made cells purchased from Motifolio)
These fluctuating hormone levels have landscape-shaping effects within the FGT
including transformations in the aforementioned defense barriers. Components of the physical
defense barrier that are impacted include mucous viscosity and epithelial barrier thickness
[79,80]. The cellular defense barrier is also impacted as immune cell numbers are also known to
18
change over the course of the menstrual cycle. Natural killer cells, neutrophils, and macrophages
are all found at higher levels during the luteal phase at both the systemic and local levels within
the upper female genital tract [66,81]. Upper FGT lymphocyte aggregates are also known to be
at their largest during the luteal phase. Immune cell numbers are believed to fluctuate much less
in lower female genital tract [69], however changes in activation status/cellular phenotype and/or
immune cell localization over the course of menstrual cycle within this compartment, the area
where HIV founder populations are thought to penetrate the mucosal barrier [82], is not known.
Ovarian hormones may also impact the molecular arm of defense by affecting the
expression of antimicrobials in mucosa. For instance, certain factors associated with HIV
resistance have shown a relationship with the menstrual cycle including an elevation of serpins
during the estradiol-dominant follicular phase [83], and a reduction of secretory leukocyte
peptidase inhibitor (SLPI) and defensins during the early luteal phase [84,85]. However, only a
short list of predefined innate immune factors have been associated with hormone levels, and
there are likely many more factors important for HIV infection governed by ovarian hormones
that have yet to be described. Considering the impact of ovarian hormone levels on the various
defense barriers of the FGT, it is reasonable to hypothesize that menstrual cycle-based changes
in host immunity may impact women’s susceptibility to infections. Indeed, observational studies
have discovered altered HIV infectivity and transmissibility during the progesterone-dominant
luteal phase of the menstrual cycle in non-human primate (NHP) and human cervical explant
models [86-88]. In the NHP studies, it was observed that the majority (95% (n=17/18) in the
study by Vishwanathan et al [86], 88% (n=38/43 in the study by Kersh et al [87]) of macaques
vaginally challenged with low dose SHIV became infected during the luteal phase or

19
premenstrual phase of their menstrual cycle. These studies also found that fewer challenges were
required to infect the animals in the luteal phase (median number of challenges=4) versus those
in the follicular phase (median number of challenges=10) [86]. Similar results were seen in Saba
et al’s study which also discovered that human ectocervical biopsies collected from women in
their luteal phase were more likely to become infected by HIV ex vivo and produce higher viral
titres as a result [88]. These findings suggest there is an association between endogenous ovarian
hormone levels and HIV susceptibility; however the mechanism behind this vulnerability has yet
to be elucidated.
1.6.3.2 Impact of Exogenous Hormone Application: Local application of exogenous estradiol
and systemic application of exogenous progesterone have been shown to affect SIV
susceptibility in non-human primates, with topical estradiol treatment shown to reduce infection,
and subcutaneously implanted progesterone treatment shown to increase acquisition rates. The
application of these hormones was shown to directly impact genital tract epithelial barrier
function. The topical application of estradiol resulted in the vaginal epithelium becoming highly
cornified and thick, while the implanted application of progesterone resulted in vaginal thinning
(reviewed in [89,90]). Whether or not similar effects can be seen in humans remains a topic of
great debate as there are physical differences between the genital tracts of macaques and humans
that could impact the translatability of these findings on to humans. For instance, the lower
genital tracts of non-human primates are keratinized whereas human FGTs are non-keratinized,
which changes what components or layers of the epithelium may be most important for
maintaining barrier integrity [91]. There have also been conflicting findings in various studies
examining the impact of exogenously applied progesterone-based contraceptives on epithelial

20
barrier integrity within the lower FGT as well as their impact on other defense barriers that
further studies could help to clarify [92-95].
Exogenous hormones are commonly utilized for the purposes of contraception in women
and can be applied using various methods and formulations. In fact, hormonal contraceptives are
the most widely used contraceptive method in sub-Saharan Africa, the most HIV-burdened
region of the world, with as many as 12 million women using injectable formulations [96]. Depot
medroxyprogesterone acetate (DMPA), a synthetic progesterone derivative, is the most popular
injectable formulation in these regions due to its affordability, convenient application and
effectiveness in preventing pregnancy [97,98]. However, there is an increasing body of evidence
suggesting the use of progesterone-only contraceptives may be associated with an increased risk
of HIV acquisition [79,99-103]. The most recent meta-analysis examining the impact of DMPA
use on HIV acquisition risk found a 1.5-2.0 fold increase in risk associated with its use [101].
This increase in risk translates to up to as many as 130,000 more infections globally per year,
which is a substantial global burden that could potentially be mitigated and/or alleviated upon the
removal of DMPA from the market [96]. Therefore, gathering information on the mechanism
responsible for this increased susceptibility observed amongst DMPA users represents an
important area for continued research [104].
1.7 Study Rationale, Hypothesis & Objectives:
1.7.1 Rationale: Variable HIV/SIV acquisition risk has been indirectly linked to ovarian
hormone levels. This has been showcased in non-human primate studies and cervical explant
studies which found particular susceptibility to infection during the progesterone-dominant luteal

21
phase [86,87,105], and meta-analytic observations associating DMPA use with HIV acquisition
risk [101]. However, the mechanism behind this hormone-associated susceptibility is poorly
understood. There is some evidence supporting an association between menstrual cycle phase
and altered host mucosal innate immunity, however this is based on standard univariate analysis
of only a few known immune factors [83-85]. Univariate analysis alone may underappreciate
complex biological events and protein interactions important for host immunity. Mucosal
secretions contain many hundreds of unique factors important for innate immunity [77,106],
many of which interact together resulting in biological processes with the potential to modulate
risk of HIV infection. Mass spectrometry-based proteomics coupled with data-driven
multivariate modeling may have the capacity to uncover novel biological protein networks not
observable by traditional approaches, and provide new insights into biological mechanisms
associated with particular hormone-based phenotypes.
An unbiased, comprehensive proteomic analysis measuring the innate immune factors present at
the mucosal level of the FGT in relation to ovarian hormone levels has never been performed and
represents a major gap in knowledge. Uncovering potential hormone-associated sources of
vulnerability at the mucosal level of the FGT will have important implications for women’s
health.
1.7.2 Global Hypothesis: Mucosal immune factor expression is significantly affected by
ovarian hormone levels as demonstrated by endogenously changing levels over the course
of the menstrual cycle and through the use of exogenous hormonal contraceptives.

22
1.7.2.1 Sub-hypotheses:
1) Immunological changes that occur at the mucosal level during the luteal phase of the
menstrual cycle associate with an environment that is more conducive to successful HIV
infection due to increased levels of proteins involved in inflammation and epithelial
barrier disruption.
2) Endogenous estradiol and progesterone levels demonstrate an antagonistic relationship
with immune factors at the mucosal level in the FGT, with high levels of progesterone
associating with decreased levels of epithelial barrier integrity factors.
3) The exogenous application of the synthetic progesterone, medroxyprogesterone acetate,
will impact proteins involved in the defensive barriers of the female genital tract in a
manner similar to endogenous progesterone during the luteal phase of the menstrual
cycle, such that signatures of inflammation and epithelial barrier integrity loss will be
enhanced.
1.7.3 Objectives:
1) Optimize a label-free proteomic method to identify and relatively quantify proteins in
mucosal samples
2) Identify proteins differentially abundant between the follicular and luteal phase of the
menstrual cycle using a mass spectrometry-based proteomics approach.
i) Validate findings from the primary cohort with a secondary low-risk
cohort.
3) Identify associations between endogenous hormone levels and mucosal immune factors
secreted in the female genital tract.

23
i) Compare estradiol and progesterone correlates from two separate cohorts.
4) Identify proteins differentially abundant between women using DMPA compared to
non-hormonal contraceptive users using a mass spectrometry-based proteomics
approach.
5) Apply computational methods such as hierarchical clustering, pathway analysis, gene
set enrichment analysis and partial least-square discriminant analysis with LASSO
feature selection to analyze each data set and compare their corresponding protein
networks and associated biological processes to infer the potential effects of ovarian
hormones on host mucosal immunology.
24
Chapter 2. Materials & Methods
2.1 Study Populations & Ethics Statements:
2.1.1 Chicago Cohort: This cohort consists of women from the United States who are
considered to be at low risk for HIV acquisition as determined by a questionnaire on their sexual
history. Inclusion criteria included the following answers on their questionnaires: never
exchanged sex for money, drugs or shelter, no more than one sexual partner in the last 6 months,
no more than 5 sexual partners in the last 5 years, and no history of sexually transmitted
infections. This cohort was established for the purposes of studying immune responses that
contribute to HIV acquisition risk [107]. All of the participants underwent testing for HIV,
bacterial vaginosis, Trichomonas vaginalis, Neisseria gonorrhoeae, and Chlamydia trachomatis
at the time of collection. Patients positive for any of these tests were excluded from the study.
Study participation required written, informed consent, and was approved by the human subjects
committee of the University of Illinois at Chicago and the Research Ethics Board of the
University of Manitoba.
2.1.2 Pumwani Cohort: This cohort consists of female sex workers from the Pumwani district
of Nairobi who are considered to be at high risk for HIV acquisition. This cohort was established
in 1985 for the purposes of studying the immunobiology and epidemiology of STIs including
HIV [83]. A questionnaire was filled out upon each participant’s visit which provides
information about medical, gestational and menstrual history as well as information about sexual
practices. Samples utilized from this cohort were from HIV-negative women only as determined
by serology and Reverse-Transcription polymerase chain reaction (RT-PCR). Study participation

25
required written, informed consent, and was approved by both the University of Manitoba and
Nairobi human research ethics boards.
2.1.3 Immunology of Menses (IMMENSE) Cohort: This cohort consists of women from
Sweden considered to be at low risk for HIV acquisition. This cohort was established in 2014
and was designed to collect female genital tract mucosal samples for the purposes of studying
changes in mucosal immunology over the course of the menstrual cycle. All study participants
are tested for Neisseria gonorrhoeae, Chlamydia trachomatis, Human Papilloma Virus, and
bacterial vaginosis. Any participants with positive results were excluded from the study.
Participants did not present with any herpes simplex virus or genital wart lesions; however HSV-
2 serology and DNA were not measured. Participants were not on any form of hormonal
contraception and were not taking any prescribed medication during their enrollment in this
study. Participants provided written, informed consent. Ethical approval was received from the
institutional review board of the Karolinska Institutet in Sweden.
2.1.4 Couples against transmission (CAT) Cohort: This cohort consists of HIV-negative
women who are in a sexual relationship with an HIV-positive partner from Kenya. These women
are considered at high risk of HIV acquisition. This cohort was established in 2007 for the
purposes of studying HIV transmission factors. HIV-1-discordant couples were recruited from
voluntary counseling and testing centers in Nairobi, Kenya, between September 2007 and May
2009. Eligible couples reported sex ≥3 times in the 3 months prior to screening, were not
pregnant, and planned to remain together for the duration of the study. At enrollment, HIV-1-
infected participants did not have a history of clinical AIDS (WHO stage IV) and were not
26
currently on antiretroviral ART. Eligibility screening and couple counseling, including risk
reduction and condom counseling, preceded the enrollment visit. Participants included in this
study were grouped based on hormonal contraceptive use: DMPA use or no hormonal
contraceptive use. Written informed consent was obtained from all participants. The study
received ethical approval from the institutional review boards of the University of Washington,
the Karolinska Institutet, and the Kenyatta National Hospital.
2.2 General Reagents:
Urea Exchange Buffer (UEB): 8M Urea (GE Healthcare, Uppsala, Sweden) with 50mM HEPES,
pH 8.0
Four-Protein Standard: 12.86mg Enolase (Sigma, MO, USA), 11.2mg Alcohol dehydrogenase
(Sigma, MO, USA), 11.5mg Myoglobin (Sigma, MO, USA), 1.18mg Hexokinase (Sigma, MO,
USA) combined in mass-spectrometry grade water
2.3 Sample Collection:
2.3.1 Cervicovaginal Lavage Sample Collection: To obtain a mucosal sample from the
genital tracts of all participants included in this study, a speculum was inserted into the vagina
and the cervix was located. For the purposes of standard STI testing, four cotton tipped brushes
were used to swab the posterior, lateral, frontal and cervical areas of the vaginal vault. This was
followed by the instillation of 10mL of saline solution into the vagina covering all areas of the
vaginal vault and ectocervix. The saline lavage of the cervicovaginal compartment was then
redrawn (8-10mL) using the same syringe with which it was instilled. All samples were

27
immediately stored on wet ice and subsequently frozen at -80ºC within 1 hour of sample
collection.
2.3.2 Plasma Collection: For all participants of the Pumwani cohort and the IMMENSE
cohort, 10 mL of blood was collected in heparin. Plasma was isolated via whole blood
centrifugation at 1000x g for 10 minutes. The top layer (plasma) was removed, aliquotted and
stored at -80ºC for subsequent hormone measurement.
2.4 Hormone Measurements
2.4.1 Pumwani cohort: Hormones were extracted from Pumwani cohort plasma samples and
measured using the Milliplex MAP Steroid/Thyroid Hormone Magnetic Bead Panel – Endocrine
Multiplex Assay (STTHMAD-21K, EMD Millipore, MA, USA) using the manufacturer’s
protocol. In brief, hormones were extracted using acetonitrile and trifluroacetic acid, and run on
a steroid hormone magnetic bead panel with magnetic anti-estradiol and anti-progesterone beads.
The plate was read and hormone levels were measured using the Bio-Plex Mgr 5.0 software.
Hormone measurements greater than the lower limit of detection (LLOD) (E2>0.02ng/mL,
P>0.09ng/mL) were utilized for correlative studies (n=7 excluded from estradiol analysis, n=2
excluded from progesterone analysis).
2.4.2 IMMENSE cohort: Plasma hormone level measurements were contracted out to the
Karolinska Hospital Laboratory. Estradiol levels were measured via a radioimmunoassay
(LLOD<0.02ng/mL) (Orion Diagnostica, Espoo, Finland), progesterone levels were measured
via a chemiluminescence immunoassay (LLOD<0.1ng/mL) (Beckman Coulter, CA, USA), and
28
follicle stimulating hormone and luteinizing hormone were measured using fluorescence
immunoassays (LLOD<0.05IU/L) (Perken Elmer, MA, USA).
2.5 BCA (bicinchoninic acid) protein assay: Mucosal sample protein content was measured
by BCA protein assay (Novagen, MA, USA) according to the manufacturer’s standard assay
protocol. In brief, bovine serum albumin (BSA) was used to create a standard curve ranging from
0-1000 µg/mL in sterile Eppendorf tubes. The working reagent was prepared by combining 4%
Cupric sulfate with 20x the volume of BCA Solution using the Micro-scale assay guidelines.
Two replicates of twenty five microliters of diluted sample (1:3) and standard were aliquotted
into a 96-well plate, and then two hundred microliters of working reagent was added to each
well. The plate was then incubated at 37ºC for 30 minutes. The plate was then read at 562nm in a
microplate reader (Molecular Devices, SPECTRA Max PLUS 384, CA, USA).
2.6 Protein Digestion and Mass Spectrometry Analysis
2.6.1 Overnight trypsin digestion: Trypsin digestion was performed using the filter-aided
sample preparation method [108] with modifications. In brief, equal amounts of mucosal sample
were denatured in urea exchange buffer for 10 minutes at room temperature placed into Nanosep
filter cartridges (10 kDa). After centrifugation samples were treated with 25 mM dithiothreitol
(Sigma, MO, USA) for 20 minutes, then 50 mM iodoacetamide (Sigma, MO, USA) for 20
minutes, and washed with 50 mM HEPES buffer. Trypsin (Promega, WI, USA) was added (2
mg/100 mg protein) and incubated at 37ºC overnight in the cartridge. Peptides were eluted off
the filter with 50 mM HEPES, and were dried via vacuum centrifugation and stored at -80ºC.

29
2.6.2 Reversed-phase liquid chromatography: The samples were then cleaned of salts and
detergents by reverse-phase liquid chromatography (LC) (high pH RP, Agilent 1200 series
micro-flow pump, CA, USA; Water XBridge column C18 3.5um, 2.1x100mm, ON, Canada)
using a step-function gradient such that all peptides elute into a single fraction for each sample.
The elution gradient was from 97% buffer A (20mM Ammonium Formate, pH10, MA, USA) to
70% buffer B (90% acetonitrile, 20mM Ammonium Formate, pH 10, MA, USA) in 35 minutes
at a constant flow of 150 µl/min. Peptide eluted off the column at about 27 minutes. The
fractions were then dried via vacuum centrifugation and kept at -80ºC.
2.6.3 Peptide Quantification: Cleaned peptides were then quantified using LavaPep’s
Fluorescent Peptide and Protein Quantification Kit (Gel Company, CA, USA) according to the
manufacturer’s protocol with the exception of the peptide standard used. A protein standard
described in section 2.2 was digested using the same protocol as the mucosal samples and was
used as a peptide standard. In brief, dried peptides were resuspended in mass-spec grade water.
The peptide standard underwent a 4-fold serial dilution ranging from 40-655,360ng/mL. A
working solution of LavaPep reagent was made by mixing water with Part A and Part B
solutions. Fifty microliters of diluted peptide samples (1:3) and peptide standard were added to a
black, flat bottom 96-well plate, followed by fifty microliters of working solution to each well.
The plate was incubated in the dark for 60 minutes at room temperature. The plate was then read
using a fluorescence microtitre plate reader using a 540nm excitation filter and a 630nm
emission filter (Biotek Synergy H1 Hybrid Reader, Gen5 v2.05, VT, USA).

30
2.6.4 Mass Spectrometer Run Details: Equal amounts of sample peptide were re-suspended
in 2% acetonitrile, 0.1% formic acid., and injected into a nano-flow LC system (Easy nLC,
Thermo Fisher, MA, USA) connected inline to a Linear Trap Quadrupole (LTQ) Orbitrap XL
mass spectrometer (Thermo Fisher, MA, USA; MIG samples and Pumwani samples), an LTQ-
Orbitrap Velos mass spectrometer (Thermo Fisher, MA, USA; CAT samples), or a Q Exactive
Quadrupole Orbitrap mass spectrometer (Thermo Fisher, MA, USA; IMMENSE samples). The
XL mass spectrometer used the following method: a 3-cm long, 5-μm particle-sized C18 column
ReproSil-Pur C18-AQ resin (Dr. Maisch) was used for peptide trapping and desalting. A 15-cm
long, 2.4-μm particle-sized C18 column (Thermo Fisher, MA, USA) was used for peptide
separation. The elution gradient was from 98% buffer A (2% acetonitrile, 0.1% formic acid) to
35% buffer B (98% acetonitrile, 0.1% formic acid) in 60 minutes at a constant flow of 250
nl/min. MS spectra were acquired on the Orbitrap analyzer at 60000 resolution at 400m/z. After
each MS spectrum, and automatic selection of the 5 most intense precursor ions were selected for
fragmentation by CID, at 35% normalized collision energy. The Velos mass spectrometer used a
similar method with the following exceptions: the elution gradient used was 98% buffer A to
32% buffer B over 120 minutes at a constant flow of 250 nl/min, and after each MS spectrum
automatic selection of the 10 most intense precursor ions were selected for fragmentation by
CID, at 35% normalized collision energy. The Q Exactive mass spectrometer used the following
method: a 50-cm long, 2.0-µm particle-sized Easy-Spray C-18 column (Thermo Fisher, MA,
USA) was used for peptide separation. The elution gradient was from 98% buffer A to 30%
buffer B in 200 minutes at a constant flow rate of 200nl/min. MS spectra were acquired on the
Orbitrap analyzer at 70000 resolution at 200m/z. After each MS spectrum and automatic
selection of the 15 most intense precursor ions were selected from fragmentation by HCD, at

31
28% normalized collision energy, and were acquired in the Orbitrap analyzer at 17,500
resolution at 200m/z.
2.6.5 Label-free proteomic data analysis: All spectra were processed using Mascot Distiller
(Matrix Science, London, UK), and database searching was done with Mascot Daemon (Matrix
Science, London, UK). Searches were performed against the UnitProtKB/SwissProt database
restricting taxonomy to Human and Bacteria. A decoy database option was also used to
determine the false discovery rate of the peptides identified. The search parameter were set as
follows: carbamidomethylation (C) as a fixed modification, oxidations (M) as a variable
modification, fragment ion mass tolerance of 0.5 Da, parent ion tolerance of 10 ppm, and trypsin
enzyme with up to 1 missed cleavage. Mascot search results were imported into Scaffold
(Proteome Software, OR, USA) to validate the protein identifications, using the following
criteria: 80% confidence for peptide identification, 95% confidence for protein identification,
and at least 2 peptides identified per protein (False discovery rate (FDR) <1%). The Scaffold
data was imported into Progenesis LC-MS software (Nonlinear Dynamics, New Castle, UK) to
perform label-free differential protein expression analysis based on MS peak intensities. Feature
detection, normalization, and quantification were all performed using default settings from the
software. Retention time alignment was performed using peptides mixes that consisted of a pool
of all samples included in the study that were injected between every 10 samples throughout the
length of the experiment’s run time on the mass spectrometer. Alignment was also manually
reviewed for correctness. Only charge states between 2+ and 7+ were included to exclude
contaminations from the analysis. All features detected before 10 minutes and during the last 15

32
minutes in retention time were also discarded. Protein abundances were further normalized by
total ion current (representing total peptides signal detected in the mass spectrometer).
2.7 Statistical Analysis of Proteomic Data
2.7.1 Technical variability & Sample Outlier Filtering: Pooled mixes run over the course of
mass spectrometer run time were used to measure technical variability. The covariance of each
experiment was measured using these replicates, and proteins that had a covariance greater than
25% over the run time were excluded from further downstream analysis. Sample outliers were
identified by calculating each sample’s total protein abundance median, and determining whether
or not each sample’s median total protein abundance was within or outside the 1.5X interquartile
range from the median (Figure 2.1). This helped to negate sampling variability.
Figure 2.1 Sample outlier discovery. All samples’ median total protein abundances are used to detect sample
outliers (A sample qualifies as an outlier when its sample median total protein abundance is found outside 1.5 times
the interquartile range, see the highlighted boxplot in red as an example).

33
2.7.2 Data Normalization: Each protein was divided by the mean normalized abundance
using the measurements from all samples included in the study. This ratio was then log (base 2)
transformed. To determine whether or not these transformations generated normalized values for
each protein, q-q normality plots were performed randomly on 5 proteins within the data set
(Figure 2.2). The results of these normality tests were used to determine whether parametric or
non-parametric statistics were to be used for downstream statistics. However, data sets with
samples numbers below 10 per group were analyzed using non-parametric statistics as the
sample size would be too small to apply the assumptions based on a normal distribution.
Figure 2.2 Q-Q normality plot. This is a probability plot where a protein’s log transformed measurements are
ranked into quantiles and compared to those of a parametric curve (plotted as a 45º line). If the plotted, ranked log
transformed protein quantiles are similar to those of a parametric curve, it is an indication that the data is normal,
and parametric statistics can be applied.
2.7.3 Statistical Tests & Pathway Analysis: Protein abundance differences between
individuals in their respective study groups were determined by Student’s t-test or Mann-
Whitney U-test depending on the distribution of the comparison groups. Benjamini-Hochberg’s
Local FDR (q<0.05) for multiple comparison corrections were applied when appropriate.
However, all proteomic experiments had the statistical stringency relaxed to p<0.05 to avoid
type-II error and subsequent downstream analysis was performed without multiple comparisons
correction (Figure 2.3).
Z-score (Rank percentile)
Log
(ab
un
dan
ce)

34
Figure 2.3 P-value frequency and false discovery rate analysis. A. False discovery rate (q-value) versus Mann-
Whitney U-test p-values. B. The frequency of p-values. This graph shows that the frequency of proteins below our
significance threshold of p<0.05 is above what would be expected if the null hypothesis were true (equal distribution
for all p-values) indicating a true effect was likely observed.
Unsupervised cluster analysis was performed on proteins found to be differentially abundant
between study groups (p<0.05, Fold change ≥2) using complete linkage and Spearman rank
correlation coefficient as the distance metric. Gene ontology and pathway associations were
determined using The Database for Annotation, Visualization and Integrated Discovery (DAVID,
v6.7, MD, USA) and Ingenuity Pathway Analysis software (Qiagen, Limburg, Netherlands).
Right-tailed Fisher’s Exact Tests were used to calculate the probability that the association
between each protein in the dataset and the biological function or pathway was random.
Pathways/bio-functions with p-values <0.05 and had at least 2 proteins selected were considered
positively associated.
2.7.4 Least Absolute Shrinkage and Selection Operator & Partial Least-Squares
Discriminant Analysis: Least Absolute Shrinkage and Selection Operator (LASSO) and Partial

35
Least-Squares Discriminant Analysis (PLSDA) are statistical procedures that can be applied to
generate regression models. These models can be used as classification tools for predictive
modeling. Models are generated by selecting the minimum set of proteins necessary to classify
study samples based on a binary variable (e.g. phase of menstrual cycle, DMPA use vs non-
hormonal contraceptive use). Minimal feature sets were determined using the LASSO method
and the selected features were then tested using the regression model, PLSDA. Both procedures
were implemented using Matlab software (MathWorks, MA, USA). Briefly, for LASSO, K-fold
cross-validation was used to determine the optimum value of the tuning parameter (“s”), such
that the resulting model had the lowest possible mean squared error for prediction, and a
minimum of 5 features selected. Resulting features were chosen as the minimum set of
biomarkers to be utilized for PLSDA, which was used to assess how well the LASSO-selected
features were able to distinguish between the two different groups under investigation. Data was
normalized via mean centering and variance scaling prior to analysis. Cross-validation was
performed by iteratively excluding random subsets (in groups equal to the number of LASSO
selected features) during model calibration, then using excluded data samples to test model
predictions. Cross-validation enables us to determine if our LASSO-selected model is the best
out of the 10,000 models tested, and also provides us with an empirical p-value.
2.7.5 Gene Set Enrichment Analysis
Gene set enrichment analysis (GSEA) is computational software available through the Broad
Institute (http://www.broadinstitute.org/gsea) that can be used to compare experimental
expression data sets to pre-defined gene sets acquired from previously published literature.
Normalized protein abundance values from the various experiments included in this body of

36
work were uploaded to the Broad Institute’s gene set enrichment tool and compared against
curated Immunological Signatures gene set (C7.all.v4.0). Gene rank was calculated from the
normalized protein abundance levels using the signal-to-noise metric. The permutation type was
set to ‘phenotype’, gene set size parameters were set between 5 and 500 proteins associated,
datasets were not collapsed, and were left in their original format. Only human gene sets with a
nominal p-value below 0.05 were included in our analysis. For gene sets with overlapping
associations such that our expression dataset was found to associate with more than one dataset
produced from the same gene set, only the most significantly enriched (highest normalized
enrichment score and lowest p-value) gene sets are shown. We defined normalized enrichment
scores (NES) greater than an absolute value of 2.0 as high scoring, NES> |1.5| as medium
scoring and NES<|1.5| as weak scoring associations [109].

37
Chapter 3. Results
3.1 Mucosal Proteomics Method Optimization
3.1.1 Technical Comparisons of Peptide Recovery & Desalting Methods
Shotgun proteomics is a widely used method for the study of proteins in various biological
matrices such as cell and tissue lysates. However, it is less commonly used to study the protein
contents of mucosal secretions, the sample type examined in this study. Therefore, we chose to
use existing methods for the proteomic analysis of cell lysates [108,110], and optimized them for
the analysis of cervicovaginal mucosal secretions in an immunological context. The optimization
of this mucosal proteomic pipeline was necessary to address this study’s hypothesis that mucosal
immune factors measurable at the proteomic level are significantly affected by endogenous and
exogenous ovarian hormones. We here aimed to compare peptide recovery and desalting
methods to identify a method that obtains the greatest number and most reliable data in regards
to protein identification and relative abundance.
3.1.1.1 Peptide Recovery Method Optimization: After overnight tryptic digestion of protein
samples (as described in section 2.6.1), the peptides are to be recovered from the filter of the
10kDa cartridge. There were two possible options for peptide recovery, either flipping the filter
to retrieve all peptides (flip method) or running buffer through the filter to elute all peptides
(flow-through method). We wanted to determine which method was superior in peptide yield, as
this translates to better protein identification and relative quantification results. To compare these
recovery methods, three replicates per method of the same CVL pool were digested and
underwent their respective peptide recovery treatment. A total of 356 proteins were identified,
and of those 97 (27%) were found differentially abundant (Student’s T-test, p<0.05) between

38
recovery methods, with 92 recovered at significantly greater abundances via the flip method and
5 recovered at greater levels via the flow through method (Figure 3.1). Further to this, we
examined which proteins these were, and many of the proteins collected in significantly greater
abundances via the flip method had immune functions (n=38) according their gene ontology.
Therefore, we concluded that although the flow-through method may yield cleaner samples,
potentially free of detergents and debris, it was inferior when considering the identification of
proteins, particularly those of interest for the purposes of this study. The flow-through peptide
recovery method may be impeded by mucous trapped on the filter as we were working with
mucosal samples, and this might explain why the flip method was found to be superior.
However, contaminants stuck on the filter may also carry over with the recovered peptides when
using the flip method; therefore an extra clean-up step was required in our protocol prior to
peptide injection into the mass spectrometer.
3.1.1.2 Peptide Desalting Method Comparison: With the flip method having been chosen as
the superior method for protein identification, we chose to incorporate it as part of our protocol.
We next needed to determine the best method to desalt our sample peptides. We chose to
evaluate and compare two methods: the manual reverse phase (C-18) TopTip microspin column
method and the automated reverse-phase liquid chromatography (Water XBridge column C18)
method. The CVL pool was digested according to the protocol above and each desalting method
was applied in triplicate. The cleaned samples were then run through the LC system to obtain
chromatograms for comparison (Figure 3.2). There was less detergent/salt detected in the
TopTip cleaned samples, but there was also a 20% loss in peak signal intensity compared to the
LC cleaned peptides. The loss of peptide was confirmed to impact protein identification,
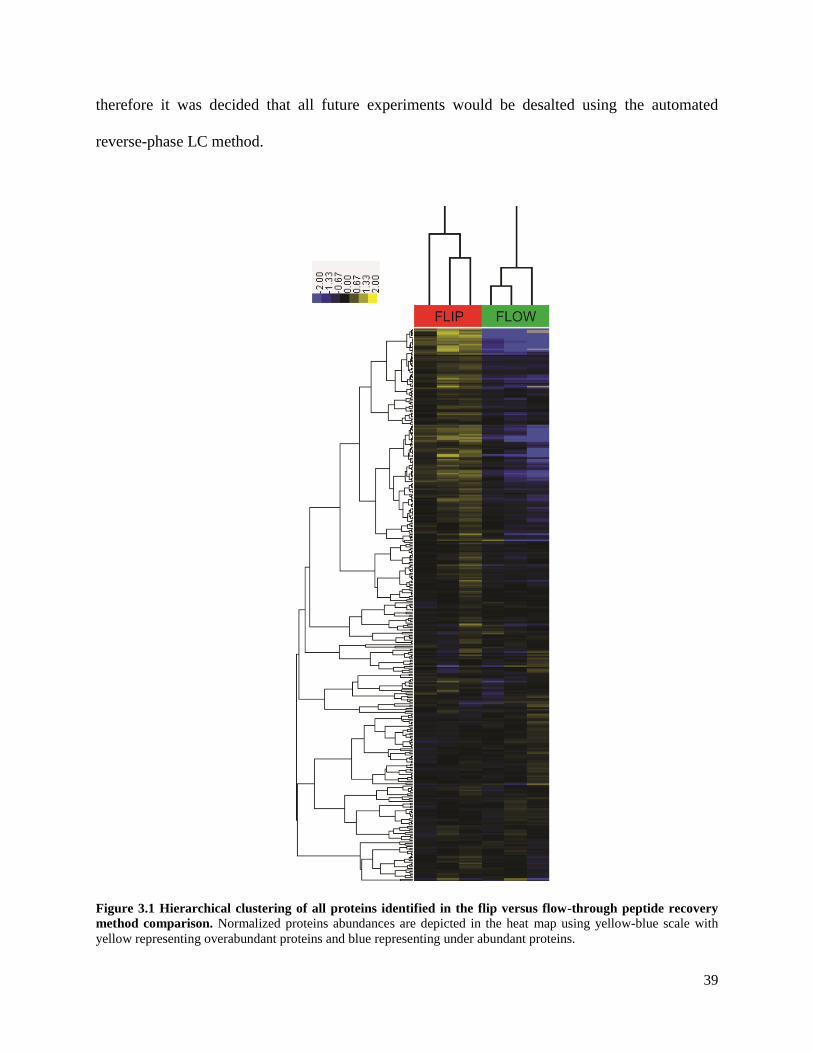
39
therefore it was decided that all future experiments would be desalted using the automated
reverse-phase LC method.
Figure 3.1 Hierarchical clustering of all proteins identified in the flip versus flow-through peptide recovery
method comparison. Normalized proteins abundances are depicted in the heat map using yellow-blue scale with
yellow representing overabundant proteins and blue representing under abundant proteins.
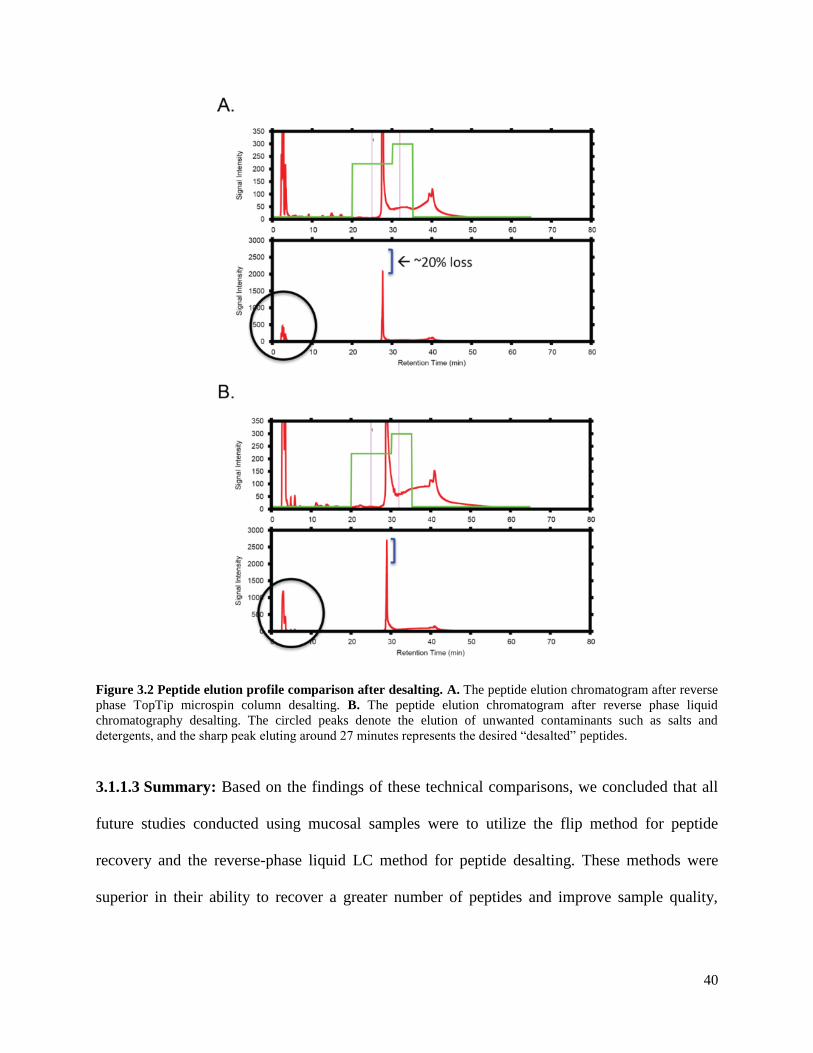
40
Figure 3.2 Peptide elution profile comparison after desalting. A. The peptide elution chromatogram after reverse
phase TopTip microspin column desalting. B. The peptide elution chromatogram after reverse phase liquid
chromatography desalting. The circled peaks denote the elution of unwanted contaminants such as salts and
detergents, and the sharp peak eluting around 27 minutes represents the desired “desalted” peptides.
3.1.1.3 Summary: Based on the findings of these technical comparisons, we concluded that all
future studies conducted using mucosal samples were to utilize the flip method for peptide
recovery and the reverse-phase liquid LC method for peptide desalting. These methods were
superior in their ability to recover a greater number of peptides and improve sample quality,

41
which is important for confident protein identification and relative quantification, as well as
uninterrupted runs on the mass spectrometer.
3.2 Changes within the Proteome of the Genital Mucosa over the Menstrual Cycle
3.2.1 Study Aim: The aim of this study was to better understand the biological impact of the
hormonally controlled menstrual cycle on female genital tract immunology, and to generate new
hypotheses about the mechanism responsible for enhanced susceptibility to HIV-1 infection
during the luteal phase.
3.2.2 Primary Cohort Results:
3.2.2.1 Clinical information: Participants included in this study were from the Chicago cohort
as described in section 2.1.1. Participants were not on any form of hormonal contraception, were
negative for all STIs tested including bacterial vaginosis, and abstained from sexual intercourse
for at least 24 hours prior to sample collection. To confirm each mucosal sample was not
contaminated with semen, we examined our proteomic data for seminal proteins. Seminal
contamination was deemed to have occurred if a sample had high levels (>1 log above the
median abundance) of specific seminal proteins (prostate-specific antigen, semenogelin-1,
semenogelin-2) [111]. All samples were deemed free of seminal contamination as only
semenogelin-2 was detectable in these samples; however its levels did not pass the set
contamination threshold. Furthermore, semenogelins are also naturally found in women’s
mucosal secretions, therefore only individuals with high levels would be considered
contaminated [112]. Participants also abstained from using any kind of vaginal
medication/creams or douching for at least 24 hours prior to sample collection. Further clinical
information is provided in Table 3.1.
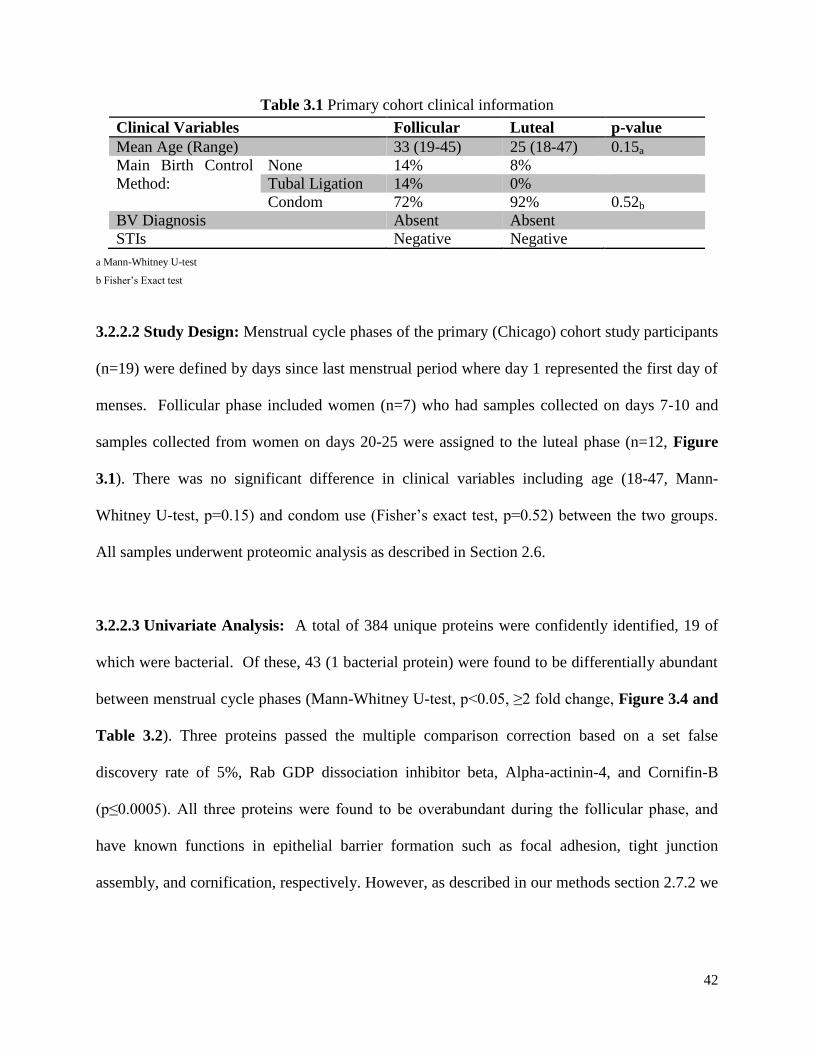
42
Table 3.1 Primary cohort clinical information
Clinical Variables Follicular Luteal p-value
Mean Age (Range) 33 (19-45) 25 (18-47) 0.15a
Main Birth Control
Method:
None 14% 8%
Tubal Ligation 14% 0%
Condom 72% 92% 0.52b
BV Diagnosis Absent Absent
STIs Negative Negative
a Mann-Whitney U-test
b Fisher’s Exact test
3.2.2.2 Study Design: Menstrual cycle phases of the primary (Chicago) cohort study participants
(n=19) were defined by days since last menstrual period where day 1 represented the first day of
menses. Follicular phase included women (n=7) who had samples collected on days 7-10 and
samples collected from women on days 20-25 were assigned to the luteal phase (n=12, Figure
3.1). There was no significant difference in clinical variables including age (18-47, Mann-
Whitney U-test, p=0.15) and condom use (Fisher’s exact test, p=0.52) between the two groups.
All samples underwent proteomic analysis as described in Section 2.6.
3.2.2.3 Univariate Analysis: A total of 384 unique proteins were confidently identified, 19 of
which were bacterial. Of these, 43 (1 bacterial protein) were found to be differentially abundant
between menstrual cycle phases (Mann-Whitney U-test, p<0.05, ≥2 fold change, Figure 3.4 and
Table 3.2). Three proteins passed the multiple comparison correction based on a set false
discovery rate of 5%, Rab GDP dissociation inhibitor beta, Alpha-actinin-4, and Cornifin-B
(p≤0.0005). All three proteins were found to be overabundant during the follicular phase, and
have known functions in epithelial barrier formation such as focal adhesion, tight junction
assembly, and cornification, respectively. However, as described in our methods section 2.7.2 we

43
chose to relax our statistical significance threshold to p<0.05 to avoid type II error and to obtain
the most comprehensive results possible in our downstream analysis.
Figure 3.3 Schematic of menstrual cycle study design and experimental work flow.

44
Figure 3.4 A volcano plot of all proteins identified comparing the luteal phase protein abundances (positive values
along the x-axis) to those measured during the follicular phase (negative values). The y-axis depicts each protein’s
significance with the most significantly different proteins between the luteal and follicular phases further up the axis.

45
Table 3.2 Differentially abundant proteins between the follicular and luteal phases of the
menstrual cycle.
Gene Name Protein Name Species Mann-Whitney
test p-value
L vs F
Difference*
ACTN1 Alpha-actinin-1 Homo sapiens 0.0219 3.48
ACTN4 Alpha-actinin-4 Homo sapiens 0.0001 -1.60
ANXA3 Annexin A3 Homo sapiens 0.0354 1.36
ARHGDIB Rho GDP-dissociation inhibitor 2 Homo sapiens 0.0169 2.81
AZU1 Azurocidin Homo sapiens 0.0052 3.33
CAMP Cathelicidin antimicrobial peptide Homo sapiens 0.0037 2.12
CAPZA1 F-actin-capping protein subunit alpha-1 Homo sapiens 0.0449 -2.73
CAT Catalase Homo sapiens 0.0026 2.80
CLCA4 Calcium-activated chloride channel regulator 4 Homo sapiens 0.013 -1.50
CRNN Cornulin Homo sapiens 0.0072 -1.58
CSTB Cystatin B Homo sapiens 0.0052 -1.68
CTSG Cathepsin G Homo sapiens 0.0072 2.39
DEFA3 Neutrophil defensin 1 Homo sapiens 0.0072 2.82
DSG3 Desmoglein-3 Homo sapiens 0.013 -1.11
ECM1 Extracellular matrix protein 1 Homo sapiens 0.0098 -1.21
EEF1B2 Elongation factor 1-beta Homo sapiens 0.0026 -2.36
EEF1D Elongation factor 1-delta Homo sapiens 0.0145 -1.40
ELANE Neutrophil elastase Homo sapiens 0.0026 2.59
ENO1 Alpha-enolase Homo sapiens 0.0018 -1.41
FASN Fatty acid synthase Homo sapiens 0.0283 -1.14
GDI2 Rab GDP dissociation inhibitor beta Homo sapiens 0.0003 -1.55
IDH1 Isocitrate dehydrogenase NADP cytoplasmic Homo sapiens 0.0358 -1.34
IGKC Ig kappa chain C region Homo sapiens 0.0283 -2.13
KRT76 Keratin, type II cytoskeletal 2 oral Homo sapiens 0.0442 1.56
LCP1 Plastin-2 Homo sapiens 0.0354 1.74
LTF Lactotransferrin Homo sapiens 0.0354 1.58
MMP8 Neutrophil collagenase Homo sapiens 0.0354 2.45
MMP9 Matrix metalloproteinase-9 Homo sapiens 0.0026 3.46
MPO Myeloperoxidase Homo sapiens 0.0219 1.95
OLFM4 Olfactomedin-4 Homo sapiens 0.0221 -2.24
PSAP Prosaposin Homo sapiens 0.028 1.55
RPL11 60S ribosomal protein L11 Homo sapiens 0.0449 -1.39
RPS15A 40S ribosomal protein S15a Homo sapiens 0.0221 -1.29
RPS6 40S ribosomal protein S6 Homo sapiens 0.0145 -3.74
S100A12 Protein S100-A12 Homo sapiens 0.0442 1.93
SERPINB12 Serpin B12 Homo sapiens 0.0171 -1.59
SERPINB2 Plasminogen activator inhibitor 2 Homo sapiens 0.0171 -1.14
SERPINB5 Serpin B5 Homo sapiens 0.0037 -2.23
SPRR1B Cornifin-B Homo sapiens 0.0005 -3.18
TUBB4B Tubulin beta-4B chain Homo sapiens 0.0283 -1.25
tuf Elongation factor Tu Lactobacillus
johnsonii
0.0449 -2.36
UBA1 Ubiquitin-like modifier-activating enzyme 1 Homo sapiens 0.0026 -1.83
VCP Transitional endoplasmic reticulum ATPase Homo sapiens 0.0037 -1.05
* Log2 (protein abundance) mean difference between the luteal phase samples and the follicular phase samples

46
To distinguish which proteins were most associated with each menstrual cycle phase,
hierarchical clustering of significantly different proteins was performed. This analysis clearly
distinguished women based on menstrual cycle phase, with 26 (60%) and 17 (40%) proteins
found at higher levels during the follicular phase and luteal phase, respectively (Figure 3.5A).
Biological function and pathway analysis as described in section 2.7.2 were used to elucidate
known biological functions associated with these phase-specific enriched proteins. The top
biological categories positively associated with the proteins elevated during the follicular phase
(positive activation z-scores between 0.5-2) were cell proliferation (z-score=0.851, n=16,
p=4.31E-5) and metabolism (z-score=1.199, n=5, p=1.71E-2), while apoptosis (z-score=-0.933,
n=10, p=7.86E-3), cell death (z-score=-1.018, n=12, p=4.93E-3), and necrosis (z-score=-1.076,
n=9, p=2.02E-2) were negatively associated with this proliferative time of menstrual cycle
(Figure 3.5B, Branch 2). The top molecular function associated with the proteins enriched
during the follicular phase was protease inhibition (n=4, p=1.45E-3) as several serine protease
inhibitors (serpins) were overabundant during this time, and the top canonical pathways
associated with the follicular phase included pathways involved in cell growth and proliferation
(EIF2 Signaling, n=3, p=1.47E-2; TR/RXR Activation, n=2, p=4.87E-3; Regulation of eIF4 and
p70S6K Signaling, n=2, p=1.38E-2; mTOR Signaling, n=2, p=2.22E-2) and cell
adhesion/junction pathways (Remodeling of Epithelial Adherens Junctions, n=2, p=3.15E-3;
Epithelial Adherens Junction Signaling, n=2, p=1.38E-2, Figure 3.5C). These biological
processes are important for maintaining epithelial barrier integrity through the growth of new
tissues and restricting inflammatory processes. For instance, cornifin-B, cornulin, desmoglein-3,
and cystatins are all proteins which contribute to the impermeability of the epithelial barrier
through aiding in epithelial cell differentiation, cornification and/or generating adhesion

47
complexes between cells [113-116]. Serpins, also overabundant during the follicular phase, aid
in wound healing, epithelial damage repair, and the inhibition of inflammatory proteases [117-
119]. All of these described biological functions contribute to a healthy, adherent, defensive
barrier at the mucosal level of the FGT.
Interestingly, the top biological categories positively associated with the luteal phase
included many processes involved in the inflammatory response. These processes were predicted
to be activated during this time as they were assigned activation z-scores ≥2. These processes
included the inflammatory response (z-score=3.147, n=12, p=5.84E-7), killing of bacteria (z-
score=2.76, n=8, p=1.11E-12), cell movement of leukocytes (z-score=2.756, n=9, p=2.12E-6)
and lymphocytes (z-score=2.39, n=7, p=5.39E-5) including T lymphocytes (z-score=2.129, n=5,
p=1.87E-4), chemotaxis of leukocytes (z-score=2.377, n=8, p=2.25E-6), degranulation of
phagocytes (z-score=2.2, n=5, p=2,42E-5) including neutrophils (z-score=2, n=4, p=4.76E-7);
activation of leukocytes (z-score=2.091, n=8, p=4.77E-4), leukocyte migration (z-score=2.008,
n=14, p=4.05E-8), proliferation of smooth muscle cells (z-score=2, n=4, p=4.96E-3), and
damage of epithelial tissue (z-score=2, n=4, p=5.78E-5) (Figure 3.5B, Branch 1). The top
molecular functions associated with proteins enriched during the luteal phase included protease
activity (n=6, p=4.7E-5) and calcium ion binding (n=7, p=3.4E-4). Further to these functional
associations, luteal phase-elevated proteins were also associated with the IL-8 (z-score=2, n=4,
p=1.41E-5) and Leukocyte Extravasation Signaling (n=3, p=5.6E-4) pathways (Figure 3.5C).
These pathways are implicated in the overall inflammatory response with IL-8 having particular
chemotactic effects on neutrophils. Several other immune-related pathways were also associated
with the luteal phase including pathways involved in immune cell trafficking (Granulocyte
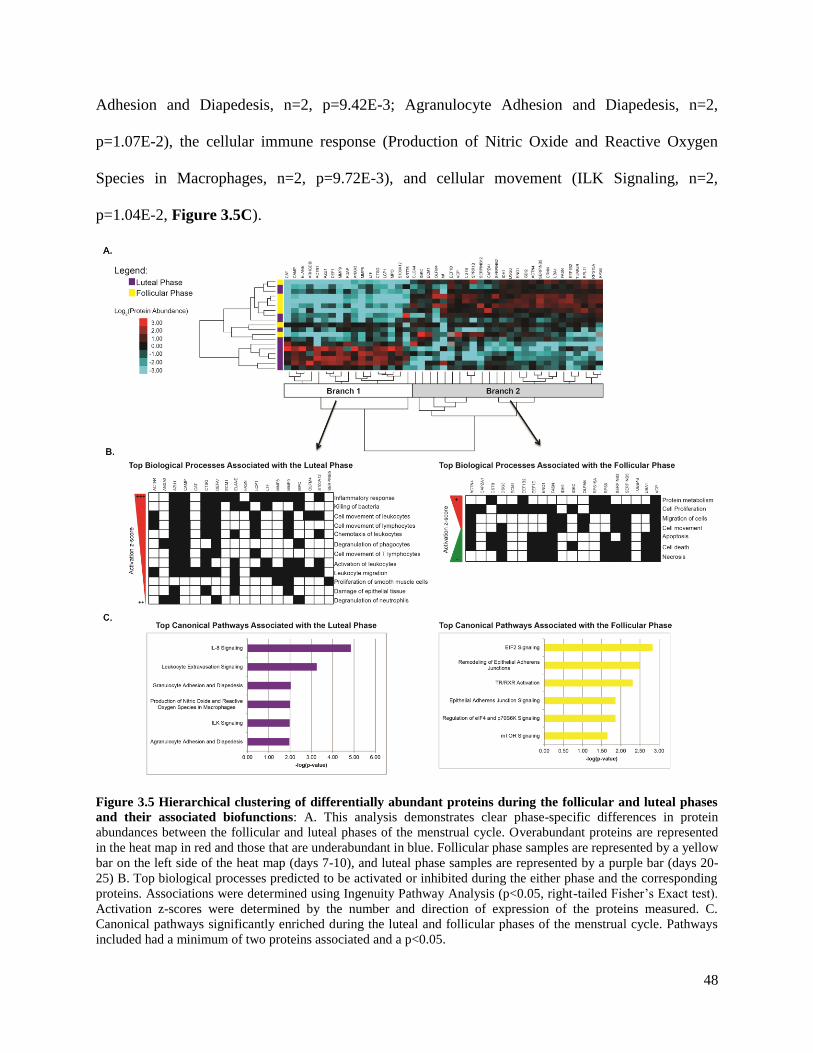
48
Adhesion and Diapedesis, n=2, p=9.42E-3; Agranulocyte Adhesion and Diapedesis, n=2,
p=1.07E-2), the cellular immune response (Production of Nitric Oxide and Reactive Oxygen
Species in Macrophages, n=2, p=9.72E-3), and cellular movement (ILK Signaling, n=2,
p=1.04E-2, Figure 3.5C).
Figure 3.5 Hierarchical clustering of differentially abundant proteins during the follicular and luteal phases
and their associated biofunctions: A. This analysis demonstrates clear phase-specific differences in protein
abundances between the follicular and luteal phases of the menstrual cycle. Overabundant proteins are represented
in the heat map in red and those that are underabundant in blue. Follicular phase samples are represented by a yellow
bar on the left side of the heat map (days 7-10), and luteal phase samples are represented by a purple bar (days 20-
25) B. Top biological processes predicted to be activated or inhibited during the either phase and the corresponding
proteins. Associations were determined using Ingenuity Pathway Analysis (p<0.05, right-tailed Fisher’s Exact test).
Activation z-scores were determined by the number and direction of expression of the proteins measured. C.
Canonical pathways significantly enriched during the luteal and follicular phases of the menstrual cycle. Pathways
included had a minimum of two proteins associated and a p<0.05.

49
To unravel the effects of menstrual cycle phase further, we chose to evaluate the entire
proteomic data set by conducting a biofunctional analysis using IPA (Table 3.3). This analysis
further solidified the functional associations seen when only significantly different proteins were
examined such that during the luteal phase of the menstrual cycle was associated with the
inhibition of keratinocyte/epidermal cell differentiation and the activation of leukocyte migration
and infiltration, with neutrophil cell movement assigned the highest activation z-score. These
functional associations suggest that the luteal phase is a more immunologically active time than
the follicular phase of the menstrual cycle.
Table 3.3 Biological functions with predicted activation states based on all proteins measured
during the luteal phase relative to the follicular phase. Biological Functions p-Value Predicted
Activation State
Activation z-score # Molecules
differentiation of keratinocytes 4.65E-10 Decreased -2.449 18
apoptosis of blood cells 1.05E-05 Decreased -2.433 27
differentiation of epidermal cells 2.73E-10 Decreased -2.433 19
hydrolysis of protein fragment 1.64E-05 Increased 2.000 18
adhesion of phagocytes 1.06E-08 Increased 2.012 16
metabolism of carbohydrate 5.78E-07 Increased 2.032 35
infiltration by neutrophils 7.65E-08 Increased 2.128 16
leukocyte migration 6.84E-17 Increased 2.137 64
proteolysis 4.41E-06 Increased 2.164 21
cell movement of myeloid cells 4.11E-14 Increased 2.166 44
killing of cells 5.04E-09 Increased 2.179 20
organismal death 8.00E-12 Increased 2.185 107
infiltration of leukocytes 1.64E-08 Increased 2.238 28
blister 2.06E-08 Increased 2.254 9
cell movement of phagocytes 1.65E-12 Increased 2.319 42
cell movement of granulocytes 3.62E-15 Increased 2.348 37
production of reactive oxygen species 1.03E-09 Increased 2.427 29
hydrolysis of protein 1.03E-05 Increased 2.433 19
cell movement of leukocytes 5.15E-15 Increased 2.489 56
killing of bacteria 8.31E-12 Increased 2.697 14
cell movement of neutrophils 1.05E-13 Increased 2.803 31
3.2.2.4 Multivariate Analysis: Examining individual proteins using univariate forms of analysis
alone most likely underrepresents the interplay of various biological processes occurring within a
biological system in vivo. For this reason, we chose to perform a multivariate analysis using

50
data-driven modeling to gain a deeper understanding of the relationships and interconnected
network occurring between various proteins as a whole. The LASSO method for regression and
shrinkage was conducted using our protein expression data set of 384 proteins as described in
section 2.8.2. This algorithm selected the minimum set of proteins (n=18) that could best
differentiate the follicular phase from the luteal phase in our data set. This assessment was based
on proteins that demonstrated phase-specific multicollinearity which is the result of features
demonstrating similarities in covariance and/or overlapping biological relationships. These 18
proteins were then analyzed using a classification model, partial least squares discriminant
analysis (PLSDA). Our model demonstrated 100% calibration accuracy, 93% cross-validation
accuracy, and that 45% of the variance in the data set was accounted for in the first two latent
variables. Latent variable 1 (LV1) clearly differentiated participants in the luteal phase (positive
scores on LV1) from participants in the follicular phase (negative scores on LV1, Figure 3.6A).
Eight of the 18 identified markers were positively loaded on LV1 indicating that they were
positively associated with the luteal phase and negatively associated with the follicular phase,
while ten markers were negatively loaded on LV1, indicating it was negatively associated with
the luteal phase and positively associated with the follicular phase (Figure 3.6B). We confirmed
that our LASSO-based model was optimal by using random-subset cross validation where we
generated 10,000 additional PLSDA models, each with 18 different combinations of proteins
selected from the remaining (non-LASSO) 366 measured proteins. This analysis suggested that
our LASSO-selected model was significantly better at distinguishing between the follicular and
luteal phases of the menstrual cycle (p=0.0013) than a model generated by chance, as both
calibration accuracy and cross-validation accuracy were in the 99.9th percentile rank compared
to other models.

51
Figure 3.6 Multivariate analysis based on LASSO-identified biomarkers and the partial least squares
discriminant analysis (PLSDA) classification model. Our multivariate analysis expanded upon our univariate
analysis by uncovering ten new biologically relevant biomarkers that did not meet the univariate statistical
thresholds. A. Scores plot of the 19 individuals included in this study demonstrating clear classification based on
menstrual phase with 100% calibration accuracy, 93% cross validation accuracy, and the first two latent variables
accounting for 45% of the variance (p=0.0013). Latent Variable 1 (LV1) differentiated participants in the luteal
phase (positive scores on LV1) from participants in the follicular phase (negative scores on LV1). B. Loading plot
of the 18 LASSO-identified biomarkers. Eight of the 18 identified markers were positively loaded on LV1 indicating
that they were positively associated with the luteal phase (red bars), while ten markers were negatively loaded on
LV1, indicating it was negatively associated with the luteal phase or positively associated with the follicular phase
(blue bars).
Interestingly, of the 18 LASSO-selected features, only 8 were found to overlap with
factors identified as significant via Mann-Whitney U-test. The other 10 were novel biomarkers
that did not meet the initial significance threshold (Table 3.4). The 10 proteins that were
positively correlated with the follicular phase were proteins involved in transport (calcium-
activated chloride channel regulator 4, chloride intracellular protein 1), signal transduction (rab
dissociation inhibitor beta, chloride intracellular protein 1), keratinization (cornifin-B), cell
adhesion (desmoglein-3), protein biosynthesis (elongation factor 1-beta, elongation factor Tu),
immune response (Ig heavy chain VI region V35, protein S100-A9), and nuclear lamina structure
(lamin-B1). These proteins were all negatively loaded on LV1 which suggests that a biological
relationship may exist between these factors potentially through protein-protein interactions or
p=0.0013

52
through overlapping involvement in downstream processes such as cell proliferation and barrier
integrity maintenance processes during the follicular phase.
Table 3.4 Proteins identified via LASSO-based multivariate modeling that accurately distinguish
between luteal and follicular phases of the menstrual cycle Gene Name Description Species Functions Log2FC L
vs F.
p-value
ARF4 ADP-ribosylation factor 4 Homo sapiens Activation of phospholipase
activity, vesicle-mediated
transport
0.47 0.288
AZU1 Azurocidin* Homo sapiens Cellular extravasation,
inflammatory response
3.33 0.001
CLCA4 Calcium-activated
chloride channel regulator
4*
Homo sapiens Chloride transport -1.50 0.027
CLIC1 Chloride intracellular
protein 1
Homo sapiens Chloride transport, signal
transduction
-0.76 0.021
SPRR1B Cornifin-B* Homo sapiens Epidermis development,
keratinization
-3.18 0.001
DSG3 Desmoglein-3 * Homo sapiens Cell adhesion -1.11 0.012
EEF1B2 Elongation factor 1-beta * Homo sapiens Protein biosynthesis -2.36 0.008
Tuf Elongation factor Tu* Lactobacillus
johnsonii
Protein biosynthesis -2.36 0.045
Ig heavy chain V-I region
V35
Homo sapiens Immune response, antigen
binding
-0.81 0.035
KRT10 Keratin, type I
cytoskeletal 10
Homo sapiens Structural constituent of
epidermis
0.82 0.138
KRT76 Keratin, type II
cytoskeletal 2 oral*
Homo sapiens Plays role in terminal
cornification
1.56 0.060
KRT75 Keratin, type II
cytoskeletal 75
Homo sapiens Structural molecular activity 2.32 0.038
LMNB1 Lamin-B1 Homo sapiens Apoptotic process -0.30 0.620
S100A9 Protein S100-A9 Homo sapiens Innate immune response -0.89 0.124
GDI2 Rab GDP dissociation
inhibitor beta *
Homo sapiens GTPase activation -1.55 0.0001
slpH S-layer protein Lactobacillus
helviticus
Structural constituent of cell wall 1.33 0.169
WFDC2 WAP four-disulfide core
domain protein 2
Homo sapiens Broad range protease inhibitor 1.94 0.180
AZGP1 Zinc-alpha-2-glycoprotein Homo sapiens Negative regulation of cell
proliferation, Positive regulation
of T cell mediated cytotoxicity
0.99 0.331
* Overlapping proteins with Mann-Whitney U-test
In contrast, proteins positively loaded on LV1 (positively correlated with luteal phase)
included enzymes such as proteases (azurocidin), ribonucleases (zinc-alpha-2-glycoprotein),
activators of downstream cell migration enzymes such as phospholipase D (ADP-ribosylation

53
factor 4), mediators of protease activity (WAP four-disulfide core domain protein 2), cytoskeletal
elements (keratin, type I cytoskeletal 10, keratin, type II cytoskeletal 2 oral, keratin, type II
cytoskeletal 75), and a Lactobacillus helviticus protein (S-layer protein). This finding suggests a
positive relationship amongst these proteins which are known to participate in the activation of
tissue remodeling processes. These findings build upon our univariate analysis and add to a
hypothesis that tissue remodeling processes, potentially preceding or associated with leukocyte
extravasation pathways are enhanced during the luteal phase, and barrier integrity processes are
enhanced during the follicular phase.
3.2.2.5 Bacterial Analysis: Interestingly, the only bacterial proteins that were found to be
significantly different between menstrual cycle phases were Lactobacillus johnsonii’s Elongation
Factor Tu (EFTU_LACJO) which was significantly enriched during the follicular phase in both
the univariate and multivariate analyses, and Lactobacillus helviticus’ S-layer protein
(SLAP_LACHE) which was found to be positively associated with the luteal phase in our
multivariate model. We also performed a sub-analysis using all the bacterial proteins measured
in this study using the PLSDA methods described in section 2.8.2, and phase-specific differences
in bacterial genera were noted. The bacterial proteins identified (n=19) classified menstrual cycle
phases with 77% calibration accuracy, 59% cross validation accuracy, and the first two latent
variables accounted for 41% of the variance measured (Figure 3.7 & Figure 3.8).

54
Figure 3.7 Multivariate model based on all bacterial proteins confidently identified via mass spectrometry
from the primary cohort and partial least squares discriminant analysis classification. A. Scores plot of the 19
individuals included in this study demonstrating 77% calibration accuracy, 59% cross-validation accuracy and the
first two latent variables accounting for 41% of the variance measured in classification based on menstrual cycle
phase. Latent Variable 1 (LV1) was able to partially differentiate participants in the luteal phase (positive scores on
LV1) from participants in the follicular phase (negative scores on LV1). B. Loadings plot of the 19 bacterial
proteins measured. Eight of the 19 bacterial proteins were positively loaded on LV1 indicating that they were
positively associated with the luteal phase (red bars), while 11 other bacterial proteins were negatively loaded on
LV1, indicating they were negatively associated with the luteal phase or positively associated with the follicular
phase (blue bars). Pie charts denote major functions associated with each protein associated with each menstrual
cycle phase.
Figure 3.8 Differences between proteins produced by specific bacterial genera at the mucosal surface of the female
genital tract between the follicular and luteal phases of the menstrual cycle.

55
All bacteria and their corresponding proteins detected in the follicular phase samples are
considered to be regular vaginal microflora and all but one bacterium were considered regular in
the luteal phase samples. The only irregular or unusual bacterial identification was
Synechococcus elongatus during the luteal phase. Synechococcus elongatus is a cyanobacterium
which is found in fresh water; therefore it is curious as to how these bacteria ended up in the
vaginal secretions of our study participants. It is possible that it may represent an environmental
fresh water contaminant that does not actually come from the FGT. Furthermore, it is difficult to
deduce much about changes in the microbiome using the samples from this cohort as this study
was cross-sectional with each sample having been collected from different individuals.
Microbiome changes across the menstrual cycle would be better measured in a longitudinal
analysis from the same individuals.
3.2.2.6 Gene Set Enrichment Analysis: The GSEA toolset was used to uncover if our FGT
mucosal proteomic expression data overlapped with any known immune cell phenotypes and
their corresponding enrichment profiles by comparing our results to independently-generated
immune cell gene expression data sets that have been previously published. Three genes sets
were enriched with medium strength (absolute normalized enrichment score (NES)>1.5) in the
luteal phase and 6 gene sets were enriched with medium strength in the follicular phase using the
methods outlined in section 2.9 (Appendix Section 6.2.1). The top two follicular phase-
associated gene sets were unstimulated immune cell types, including: genes up-regulated in
macrophage controls relative to those exposed to Leishmania major (8 proteins, NES=-1.87,
p<0.001, Figure 3.9C), and genes up-regulated in monocyte controls relative to those treated
with LPS (12 proteins, NES=-1.76, p=0.008, Figure 3.9D). The top two immune signature gene
56
sets associated with the luteal phase were those of neutrophils (6 proteins, NES=1.55, p=0.029,
Figure 3.9B) and HIV target cells (naïve CD4 T cells) (7 proteins, NES=1.57, p=0.011, Figure
3.9A). Although these independent datasets from the Broad Institute were not generated from
mucosal samples, and acknowledging the limitations of comparing proteomic data from mucosal
secretions to that of cellular genomic datasets, these findings do support that an immune
activated phenotype is associated with FGT samples collected during the luteal phase, which
agrees with the preceding pathway and biofunctional analysis.
3.2.3 Validation Cohort Results:
3.2.3.1 Clinical Information: Study participants were from the IMMENSE cohort described in
section 2.1.3; they were used as a validation cohort for the previous study. IMMENSE
participants were between the ages of 20-29, were negative for all STIs tested including bacterial
vaginosis, were not using any form of hormonal contraception, and abstained from sexual
intercourse prior to sample collection. FGT samples were also tested for seminal exposure to
confirm participants did not partake in unprotected intercourse prior to sample collection and to
determine if there would be any confounding effects attributed to seminal contamination if the
participants had been seminally exposed. We did not detect any of the following seminal
proteins: prostate-specific antigen, semenogelin-1 and -2 in any of the samples, therefore all
samples were included in the study. All other pertinent clinical information is provided in Table
3.5.

57
Figure 3.9 The top 2 gene sets found to be significantly enriched during the luteal phase (A-B) and the
follicular phase (C-D) based on gene set enrichment analysis. Gene sets associated with the luteal phase
represented specific immune cell signatures from neutrophils and CD4+ T lymphocytes, whereas gene sets
associated with the follicular phase represented unstimulated/unexposed, control immune phenotypes. The gene sets
were: A. Genes up-regulated in naïve CD4 T cells relative to naïve B cells (7 proteins, NES=1.57, p=0.011), B.
Genes up-regulated in neutrophils relative to basophils (6 proteins, NES=1.55, p=0.029), C. Genes up-regulated in
macrophage controls relative to Leishmania major exposed macrophages (8 proteins, NES=-1.87, D. Genes up-
regulated in monocyte controls relative to /LPS treated monocytes (12 proteins, NES=-1.76, p=0.008). Dots and bars
in red represent proteins enriched in the luteal phase and those in blue represent proteins enriched in the follicular
phase.

58
Table 3.5 Immunology of menses cohort clinical information
Clinical Variables
Mean Age (Range) 25 (20-29)
Menstrual cycle frequency Regular
Mean Menstrual Cycle Length (Range) 28 Days (25-30
Days)
Condom Use Frequency Always 20%
Never 80%
Mean sex frequency per week (Range) 1 (0-2)
STI None
Bacterial Vaginosis Absent
3.2.3.2 Study Design: The menstrual cycle phase of the samples collected from the study
participants (n=6) of the validation cohort were determined using both days since last menstrual
period and plasma hormone levels. CVL and plasma were collected longitudinally on a weekly
basis over the course of one menstrual cycle. Ovulation was predicted by subtracting 14 days
from the last day of menstrual cycle estimated using each participant’s typical menstrual cycle
length, and ovulation capture was validated if an LH surge was detected and the sampling day
was within +/- 2 days of the predicted ovulation day (Figure 3.10A). All samples that were
collected after an LH surge/ovulation were confirmed to be luteal phase samples. For those that
the LH surge was missed (due to the limitation of having only collected weekly samples), their
luteal phase samples were determined using days since last menstrual period and progesterone
levels (>1.5ng/mL) in combination (Figure 3.10B). Five out of the six participants had their
menstrual cycle phases clearly defined using this method and were used for subsequent analysis,
one participant (Patient 6) was omitted as her hormone levels were low, and we could not deduce
if ovulation had occurred and/or establish if her samples were collected during her luteal phase.

59
Figure 3.10 Longitudinal plots of plasma hormone levels used to determine phase of menstrual cycle. A. Luteinizing hormone levels plotted based on days since last menstrual period. Individuals with a surge in LH levels
were validated as having ovulated and are circled. B. Progesterone levels plotted based on days since last menstrual
period. Increased progesterone levels in combination with days since last menstrual period was used to determine
which samples were captured during the luteal phase. Luteal phase samples used in the downstream analysis are
circled.
3.2.3.3 Univariate Analysis & Primary Cohort Overlap: A total of 659 unique proteins were
confidently identified including 30 bacterial proteins in all 18 IMMENSE samples analyzed
(including all 3 time points) via mass spectrometry. Of those, 78 were found to be differentially
abundant (2 bacterial proteins) between the follicular and luteal phases of the menstrual cycle
(Paired t-test, p<0.05, ≥2 Fold Change), with 39 proteins overabundant during the follicular
phase and 39 overabundant during the luteal phase. Interestingly, when these significant factors
were compared with those identified in the primary cohort, only 4 factors directly overlapped
(keratin 76, plastin-2, protein S100-A12, and rho GDP-dissociation inhibitor 2, Figure 3.11). .
All four proteins were found to be overabundant during the luteal phase in both cohorts. Plastin-2
is an actin-binding protein that plays a role in T cell activation as it is a component of the
immune synapse generated between antigen presenting cells and T lymphocytes [120]. Protein
S100-A12 is a pro-inflammatory protein involved in leukocyte adhesion and migration. It also
functions as a danger-associated molecular pattern molecule which stimulates innate immune

60
cells [121]. Rho GDP-dissociation inhibitor 2 is a lymphocyte-specific RhoGTPase dissociation
inhibitor which is involved in T cell adhesion and trafficking during inflammation [122]. Keratin
76 (also known as keratin, type II cytoskeletal 2 oral) is structural protein that contributes to
terminal cornification of the epidermis [123]. Despite the low level of direct overlap in specific
proteins identified via univariate analysis, there was in fact a great deal of overlap between each
cohorts’ phase-specific proteins’ biological functions as determined via IPA (Figure 3.12). Most
strikingly, luteal phase samples from both cohorts were strongly associated with inflammation
and leukocyte migration.
3.2.3.4 Multivariate analysis: PLSDA with LASSO feature selection was performed on the 659
proteins identified as described in section 2.8.2. LASSO selected 5 features that best
distinguished the two phenotypes in question. This set of features classified menstrual cycle
phase with 100% calibration accuracy, 98% cross validation accuracy, and 83% of the variance
was accounted for in the first two latent variables. Latent variable 1 (LV1) clearly differentiated
participants in the luteal phase (positive scores on LV1) from participants in the follicular phase
(negative scores on LV1, Figure 3.13A). Four of the five identified markers were positively
loaded on LV1 indicating that they were positively associated with the luteal phase and
negatively associated with the follicular phase, while one marker was negatively loaded on LV1,
indicating it was negatively associated with the luteal phase and positively associated with the
follicular phase (Figure 3.13B).

61
Figure 3.11 Hierarchical clustering of differentially abundant proteins based on menstrual cycle phase from
two separate cohorts. A. Differentially abundant proteins identified in the primary cohort (Chicago). B.
Differentially abundant proteins identified in the validation cohort (IMMENSE). Red signifies overabundant
proteins and blue signifies underabundant proteins. Proteins found to overlap with the primary cohort are
highlighted with green boxes (left) and arrows (right).

62
Figure 3.12 Comparison analyses of the luteal phase-associated findings between the primary and validation
cohorts. The top overlapping biological processes associated with the proteins found to be significantly
overabundant during the luteal phase in the primary and validation cohorts. Yellow represents functions that are
predicted to be activated, and gray represents functions that are predicted to be inhibited.
Figure 3.13 Multivariate analysis based on LASSO-identified biomarkers and the partial least squares
discriminant analysis (PLSDA) classification model. A. Scores plot of the 10 samples collected from 5
individuals included in this study demonstrates clear classification based on menstrual cycle phase with 100%
calibration accuracy, 98% cross validation accuracy, and the first two latent variables accounting for 83% of the
variance (p=0.0079). Latent Variable 1 (LV1) differentiated participants in the luteal phase (positive scores on LV1)
from participants in the follicular phase (negative scores on LV1). B. Loadings plot of the 5 LASSO-identified
biomarkers. Four of the five identified markers were positively loaded on LV1 indicating that they were positively
associated with the luteal phase (red bars), while one marker was negatively loaded on LV1, indicating it was
negatively associated with the luteal phase or positively associated with the follicular phase (blue bars).

63
We confirmed that our model was optimal by generating 10,000 additional PLSDA models, each
with 5 different combinations of proteins selected from the remaining (non-LASSO) 654
proteins. This analysis suggested that our LASSO-selected model was significantly better at
distinguishing between our two phenotypes in question (luteal vs follicular phase, p=0.0079), as
both calibration accuracy and cross-validation accuracy were in the 99.2th percentile rank
compared to other models.
Interestingly, different proteins were identified as menstrual cycle phase classifying
features in the validation cohort as compared to those selected from the primary cohort. These
features included apoptosis-promoting proteins (Annexin A5, Apoptosis-associated speck-like
protein containing a CARD), and inflammatory response proteins (Lysozyme C, Ras-related
protein Rab-1A and Apoptosis-associated speck-like protein containing a CARD) which
positively associated with the luteal phase, and a negative regulator of apoptosis (Beta-2-
glycoprotein 1) which positively associated with the follicular phase (Table 3.6). There are
various reasons different features were selected as classifying features from the validation cohort
than the primary cohort. Firstly, the primary cohort data set consisted of 384 proteins and the
validation data set consisted of 659 proteins (differences in the number of protein identifications
between cohorts was due to differences in sensitivity between the different mass spectrometers
used), and not all of the proteins identified in one data set were identified in the other, which
resulted in different pools of features for each model to select from. Furthermore, the primary
data set was based on cross-sectional samples with different individuals sampled during either
the follicular or the luteal phase. This adds natural inter-individual variability between our
menstrual cycle phase comparison, whereas the validation data set consisted of longitudinal

64
samples collected from the same individuals over both their follicular and luteal phases from one
menstrual cycle. This is likely why fewer factors were required to classify the two phases in the
validation cohort. However, even though different features were selected from either cohort, it
appears as though the factors identified from both models reflect similar biological processes
occurring during the luteal phase such as processes important for apoptosis, tissue remodeling
and inflammation.
Table 3.6 Proteins identified via LASSO-based multivariate modeling that accurately distinguish
between luteal and follicular phases of the menstrual cycle based on the validation cohort data
Gene Name Description Species Functions Log2FC L
vs F*
p-value
ANXA5 Annexin A5 Homo sapiens Negative regulation of
coagulation
1.01 0.0029
APOH Beta-2-glycoprotein 1 Homo sapiens Negative regulation of myeloid
cell apoptotic process
-2.49 0.0029
LYZ Lysozyme C Homo sapiens Inflammatory response 1.63 0.0122
PYCARD Apoptosis-associated
speck-like protein
containing a CARD
Homo sapiens Inflammatory response, apoptosis 1.39 0.0063
RAB1A Ras-related protein Rab-
1A
Homo sapiens IL-8 secretion, role in cellular
migration
1.90 0.0106
* Log2 (protein abundance) mean difference between the luteal phase and the follicular phase
Furthermore, it is important to note that LASSO selects the minimal set of proteins that
distinguish the variable in question. This means that there may be various other factors suitable
to classify menstrual cycle phase that are not represented here due to the nature of the algorithm.
For this reason, we chose to evaluate the features identified in the primary cohort’s model to
check and see if the same factors in the validation cohort were expressed in a similar fashion
(under/overabundant in the same phases), and many of the factors identified in the primary
model were also found expressed in the same direction in the validation cohort. For instance,
cornifin-B, desmoglein-3, and calcium-activating chloride channel regulator 4 were found to be

65
overabundant during the follicular phase, and keratin 10 and azurocidin were found to be
overabundant during the luteal phase in the validation cohort, although they did not reach
statistical significance. However, a study with increased power may find these factors
differentially abundant between menstrual cycle phases at statistically significant levels. These
phase-specific trends help to reinforce our interpretation of the potential biological processes that
may be occurring over the menstrual cycle.
3.2.3.5 Bacterial Analysis: The only bacterial proteins that were identified as significantly
different between menstrual cycle phases were two Lactobacilli proteins that were overabundant
during the follicular phase from Lactobacillus plantarum (EFTU_LACPL) and Lactobacillus
gasseri (ENO1_LACGA) as determined by univariate analysis. However, there were a total of
30 bacterial proteins identified and relatively measured in this data set. Therefore, a sub-analysis
of all bacterial proteins measured (n=30) was performed using PLSDA using the methods
described in section 2.8.2. PLSDA of these 30 proteins was able to classify menstrual cycle
phases with 100% calibration accuracy, 80% cross validation accuracy, and 44% of the variance
was accounted for in the first two latent variables (Figure 3.12).

66
Figure 3.14 Multivariate model based on all bacterial proteins confidently in the validation cohort identified
via mass spectrometry and partial least squares discriminant analysis (PLSDA) classification. A. Scores plot
of the 10 samples collected from 5 individuals included in this study demonstrating 100% calibration accuracy, 80%
cross-validation accuracy and the first two latent variables accounting for 44% of the variance measured in
classification based on menstrual cycle phase. Latent Variable 1 (LV1) was able to differentiate for the most part
participants in the luteal phase (positive scores on LV1) from participants in the follicular phase (negative scores on
LV1). B. Loadings plot of the 30 bacterial proteins measured. Eighteen of the 30 bacterial proteins were positively
loaded on LV1 indicating that they were positively associated with the luteal phase (red bars), while 12 other
bacterial proteins were negatively loaded on LV1, indicating they were negatively associated with the luteal phase or
positively associated with the follicular phase (blue bars). Pie charts denote major functions associated with each
protein associated with each menstrual cycle phase.
Due to the longitudinal nature of the validation cohort study design, we are better able to assess
changes in the vaginal microbiota over the course of the menstrual cycle (Figure 3.13). Eleven
of the twelve (92%) bacterial proteins associated with the follicular phase were considered
regular vaginal microflora. The one irregular bacterial species detected during the follicular
phase was Streptomyces aureofaciens. Streptomyces aureofaciens are soil bacteria responsible
for producing an antibiotic known as tetracycline [124]. Based on the epidemiological data
collected, none of the study participants were taking antibiotics during the time of sample
collection; therefore I am unsure why this bacterial species is present. Nearly all of the bacterial
proteins associated with the luteal phase are considered normal vaginal microflora, except for
Pseudomonas putida. Pseudomonas putida are soil bacteria which rarely colonize mucosal

67
surfaces. However, they have been shown to infect immunocompromised individuals [125],
therefore it may be possible that our data represents a rare colonization event. It is also
noteworthy to mention that Gardnerella vaginalis proteins were positively associated with the
luteal phase samples, and were negatively associated with the matching follicular phase samples
from these women. Gardnerella vaginalis is considered to be a microbial species that is present
in normal vaginal flora, however increased levels of G. vaginalis is also associated with bacterial
vaginosis. Although the presence and/or increased levels of G. vaginalis is not considered the
cause of BV, it is considered to be a sign of an alteration within the FGT’s ecology allowing for
the potential overgrowth of pathogenic microbes [126]. Based on this data, it is possible that the
immunological environment generated during the luteal phase may cause a shift such that
specific microbiota are better able to grow in the FGT resulting in an environment with increased
microbial diversity, which may make women more susceptible to the development of bacterial
vaginosis.
Figure 3.15 Differences between the bacterial genera producing proteins at the mucosal surface of the female
genital tract between the follicular and luteal phases of the menstrual cycle of validation cohort samples.

68
3.2.3.6 Gene Set Enrichment Analysis: The GSEA toolset was used again to uncover any
overlap between our validation cohort’s proteomic data set and any known immune cell
phenotypes and their corresponding enrichment profiles by comparing our results to
independently-generated immune cell gene expression data sets that have been previously
published as described in the methods section 2.9. Nine genes sets were enriched with medium
strength in the luteal phase and 8 gene sets were enriched with medium strength in the follicular
phase (Appendix Section 6.2.2). The top two luteal phase-associated gene sets were both from
neutrophils: genes up-regulated in neutrophils infected with a bacterium versus controls (13
proteins, NES=1.86, p<0.001, Figure 3.14A), genes up-regulated in neutrophil controls versus
those treated with Francisella tularensis vaccine (22 proteins, NES=1.85, p<0.001, Figure
3.14B). The top two follicular phase-associated gene sets were both from B cells: genes up-
regulated in B cells versus monocytes (8 proteins, NES=-1.85, p<0.001, Figure 3.14C), and
genes up-regulated in B cells versus dendritic cells (9 proteins, NES=-1.68, p<0.001, Figure
3.14D). The factors most enriched and/or associated with B cells were various immunoglobulins
including IgM and IgD as well as barrier proteins, trefoil factor 3 (TFF3) and small proline-rich
protein 3 (SPRR3). Interestingly, GSEA identified neutrophil signatures to be enriched during
the luteal phase in both the primary and validation cohorts. This data suggests neutrophils may
be playing a major role in the immunologically active phenotype associated with the luteal
phase.

69
3.3 Endogenous Ovarian Hormone and Mucosal Immune Factor Associations
3.3.1 Study Aim: Since it is understood that the menstrual cycle-based changes observed in
the previous section are mainly governed by the ovarian hormones, estradiol and progesterone,
we chose to correlate matching mucosal proteomic data with plasma estradiol and progesterone
levels to uncover potential relationships between endogenous hormone levels and immunological
factors relevant to HIV susceptibility. We chose to perform this analysis using the two distinct
cohorts, an HIV low-risk cohort and high-risk cohort, to determine if these effects are
consistently measured in women on a global scale regardless of geographical location, ethnicity
and/or sexual behaviour.
3.3.2 Clinical Information: High-risk samples used in this study were collected from the
Pumwani cohort described in section 2.1.2, and following the protocols in sections 2.3.1 and
2.3.3. Plasma hormone levels for all subjects were measured using protocols outlined in section
2.4.1. Of the 38 women included in this cross-sectional, high-risk cohort, the mean age was 38,
and the range was from 20 to 48. All women tested negative for HIV, Chlamydia trachomatis,
Neisseria gonorrhea and bacterial vaginosis, and were not on any form of hormonal
contraception. In addition, women in menses, in menopause, or pregnant were excluded from the
analysis. Low-risk samples used in this study were collected from the IMMENSE cohort
described in section 2.1.3, following protocols in sections 2.3.1 and 2.3.3. Plasma hormone
levels were measured for all three time points as outlined in section 2.4.2. Of the 6 women
sampled longitudinally included in the low-risk cohort, the mean age was 25 with a range from
20-29. All low-risk women were negative for all STIs tested including bacterial vaginosis, and
were not on any form of hormonal contraception.

70
3.3.3 Study-Specific Methods: Proteomic data was collected using protocols described in
sections 2.5-2.7. Spearman correlation tests were conducted comparing all protein abundances
measured (Pumwani cohort, n=458 and IMMENSE cohort, n=659) to the matching plasma
estradiol and progesterone levels (GraphPad Prism v6.0).

71
Figure 3.16 The top 2 gene sets found to be significantly enriched during the luteal phase (A-B) and the
follicular phase (C-D) based on gene set enrichment analysis of the validation cohort data. Gene sets associated
with the luteal phase represented specific immune cell signatures from neutrophils, whereas gene sets associated
with the follicular phase represented signatures from B cells. The gene sets were: A. Genes up-regulated in bacteria-
infected neutrophils relative to controls (13 proteins, NES=1.86, p=<0.001), B. Genes up-regulated in neutrophil
controls relative to those treated with Francisella tularensis vaccine (22 proteins, NES=1.85, p<0.001), C. Genes
up-regulated in B cells relative to monocytes (8 proteins, NES=-1.85, p<0.001), D. Genes up-regulated B cells
relative to dendritic cells (9 proteins, NES=-1.68, p<0.001)

72
3.3.4 Estradiol Spearman Correlation Results: There were 458 unique proteins identified
within the cervicovaginal secretions of the high-risk cohort (n=38) with high confidence via
label-free mass spectrometry. Protein abundances were correlated against matching plasma
estradiol (n=31 above LLOD) and progesterone (n=36 above LLOD) levels. Plasma estradiol
levels positively correlated with 11 human proteins and one Lactobacillus delbrueckii protein
(ldhA). These positive correlates have known roles in epidermis development, metabolism,
proteolysis, wound healing and the defense response according to their gene ontologies
(Appendix 6.3.1). A total of 659 unique proteins were identified within the cervicovaginal
secretions of the low-risk cohort (n=6). Protein abundances were correlated against the matching
plasma estradiol and progesterone levels. Estradiol levels from the low-risk cohort were found to
positively correlate with 17 human proteins and 3 bacterial proteins from the following species:
Lactobacillus acidophilus, Lactobacillus helveticus, and Bifidobacterium animalis (Appendix
6.3.4). These positive correlates have known roles in epithelial cell-cell adhesion, tight junction
assembly, and complement inhibition. There were also mucosal factors found to negatively
correlate with estradiol levels measured in the high-risk cohort, these included an angiogenesis
factor (LRG1) and an actin crosslink formation factor (ACTN1). Negative estradiol correlates
identified within the low-risk cohort included 37 human proteins and 8 bacterial proteins from
the following species: Lactobacillus gasseri, Lactobacillus delbrueckii, Lactobacillus plantarum,
Lactobacillus brevis, and Streptomyces aureofaciens. These negative correlates have known
roles in various functions such as acute-phase response, blood coagulation, complement
activation, and protease inhibition.

73
Biofunctional analysis was performed on these estradiol correlates (both positive and
negative) using Ingenuity Pathway analysis, and many of the identified correlates were found to
be associated with a variety of immunological processes (Table 3.7). Based on these functional
associations as well as each function’s predicted activation state, we can infer that at times of
high estradiol such as during the follicular phase, biological processes such as the activation and
recruitment of immune cells, and the necrosis of the epithelial barrier are inhibited.
Table 3.7 Biological functions with predicted activation states based on mucosal proteins found
to correlate with plasma estradiol levels.
Diseases or Functions Annotation p-Value Predicted Activation State Activation z-
score
activation of cells 1.84E-12 Decreased -2.876
necrosis of epithelial tissue 4.04E-05 Decreased -2.853
cell death 1.45E-09 Decreased -2.835
release of lipid 4.12E-06 Decreased -2.724
apoptosis 1.17E-05 Decreased -2.663
activation of blood cells 3.50E-12 Decreased -2.619
apoptosis of endothelial cells 4.68E-08 Decreased -2.539
activation of leukocytes 8.23E-12 Decreased -2.462
synthesis of nitric oxide 2.00E-03 Decreased -2.365
tyrosine phosphorylation of protein 7.56E-04 Decreased -2.226
necrosis 2.48E-05 Decreased -2.213
recruitment of leukocytes 1.56E-03 Decreased -2.088
cell movement of mononuclear leukocytes 5.37E-04 Decreased -2.021
Pathway analysis was also performed to deduce the top immune-related pathways
associated with the estradiol correlates (Figure 3.17). Four of these top pathways were assigned
activation z-scores, which predict the likelihood of the pathway being inhibited or activated
based on the direction of the correlates provided. Acute Phase Response Signaling (z-score= -
1.34), LXR/RXR Activation (z-score= -1.29) and Production of Nitric Oxide and Reactive
Oxygen Species in Macrophages (z-score=-1.633) pathways were all predicted to be inhibited,
and the Coagulation System (z-score=0.38) was predicted to be activated during times of high

74
estradiol. The other six pathways mentioned were not assigned activation z-scores, but many
estradiol correlates were found to be significantly associated.
Figure 3.17 Top 10 pathways found to associate with plasma estradiol mucosal factor correlates. Pathways
included were those manually filtered for roles in immunity.
3.3.5 Progesterone Spearman Correlation Results: Of the 458 proteins identified within the
high-risk cohort samples, five human proteins were found to positively correlate with plasma
progesterone levels including proteins involved in keratinization (SPRR2F); proteolysis (CTSV,
KLK10); RNA catabolism (RNASET2); and leukocyte migration (CD177) based on their gene
ontology, and three bacterial proteins produced by the following species: Lactobacillus
delbrueckii, Lactobacillus gasseri, and Halothermothrix orenii (Appendix 6.3.2). Of the 659
unique proteins identified within the cervicovaginal secretions of the low-risk cohort, there were
13 human proteins and 2 Lactobacillus helviticus proteins found to positively correlates with
progesterone levels, and the primary functions of these correlates based were oxidation-reduction
(PRDX3, DPYD, GSR), defense response (LYZ, HMGB2, PTPRC), protein transport (MVP,
RAB1A), epidermis development/cell-cell adhesion (KRT14, VCL) (Appendix 6.3.3).
Progesterone levels from the high-risk cohort were also negatively correlated with 10 human
0 5 10 15 20 25
Production of Nitric Oxide and Reactive…
Extrinsic Prothrombin Activation Pathway
IL-12 Signaling and Production in…
Intrinsic Prothrombin Activation Pathway
Clathrin-mediated Endocytosis Signaling
Complement System
Coagulation System
FXR/RXR Activation
LXR/RXR Activation
Acute Phase Response Signaling
-log(p-value)

75
proteins. Many of these negative progesterone correlates were factors involved in the modulation
of the acute-phase response (ORM1, ALB, A2M, TTR, HPX, C3), protease inhibition (ITIH2,
A1BG), inflammation (MIF), and/or are structural molecules important for tissue/epidermis
regeneration (KRT19, GSN). There were also 45 human proteins and 2 bacterial proteins (from
Lactobacillus brevis and Lactobacillus plantarum) that were found to negatively correlate with
progesterone in the low-risk cohort (Appendix 6.3.3). The primary functions of these negative
correlates were also acute-phase response, protease inhibition, and inflammation. These low-risk,
negative correlates were also involved in complement activation according to their gene
ontology. Biofunctional analysis of these progesterone correlates measured from both the high-
risk and low-risk cohorts linked high progesterone levels with increased mucosal inflammation
and cell lysis, and decreased cell proliferation and activation, and decreased cell death of T
lymphocytes (Table 3.8).
Table 3.8 Biological functions with predicted activation states based on mucosal proteins found
to correlate with plasma progesterone levels.
Functions p-Value Predicted Activation
State
Activation z-
score
size of lesion 1.04E-05 Increased 2.396
loss of neurons 4.76E-04 Increased 2.213
inflammation of intestine 8.75E-04 Increased 2.190
organismal death 1.48E-05 Increased 2.136
cytolysis 1.53E-08 Increased 2.014
efflux of lipid 9.09E-07 Decreased -2.028
growth of connective tissue 1.49E-04 Decreased -2.049
activation of cells 2.87E-06 Decreased -2.065
activation of neuroglia 1.99E-04 Decreased -2.101
concentration of cyclic AMP 2.14E-03 Decreased -2.182
cell movement of muscle cells 1.14E-04 Decreased -2.183
cell death of T lymphocytes 2.27E-03 Decreased -2.271
fatty acid metabolism 7.92E-05 Decreased -2.375
proliferation of connective tissue cells 3.14E-04 Decreased -2.577

76
Pathway analysis was also performed to deduce the top immune-related pathways
associated with the progesterone correlates (Figure 3.18). Three pathways were assigned
activation z-scores. The Acute Phase Response Signaling (z-score= -0.38), and Production of
Nitric Oxide and Reactive Oxygen Species in Macrophages (z-score=-1.89) pathways were
predicted to be inhibited similar to predicted inhibition observed with increasing estradiol levels.
However, the LXR/RXR Activation pathway was predicted to be activated (z-score=0.30) which
contrasts the predicted inhibition observed based on the estradiol correlates.
Figure 3.18 Top 10 pathways found to associate with plasma progesterone mucosal factor correlates. Pathways included were those manually filtered for roles in immunity.
3.3.6 Overlapping findings:
3.3.6.1 Estradiol and Progesterone Correlate Overlap: Both progesterone and estradiol were
found to correlate with overlapping mucosal factors based on the data collected from the low-risk
cohort. They both negatively correlated with 6 factors including the C9 complement component
of the membrane attack complex; monocyte differentiation antigen CD14; complement
inhibitors, Complement Factor I and plasma protease C1 inhibitor; mucosal immunoglobulin Ig
alpha-1 chain C region; and a cellular adhesion factor, Mesothelin. There were also four factors
found to positively correlate with both estradiol and progesterone levels: Proteasome subunit
0 2 4 6 8 10 12 14
Granzyme A Signaling
Primary Immunodeficiency Signaling
Sertoli Cell-Sertoli Cell Junction Signaling
Complement System
IL-12 Signaling and Production in Macrophages
Clathrin-mediated Endocytosis Signaling
Production of Nitric Oxide and Reactive…
FXR/RXR Activation
Acute Phase Response Signaling
LXR/RXR Activation
-log(p-value)

77
beta type-8; a protein known to play a role in IL-8 secretion, Ras-related protein Rab-1A; actin
capping factor, Spectrin alpha chain, non-erthrocytic 1; and cell-cell adhesion protein, Vinculin.
This demonstrates the overlapping effects both estradiol and progesterone exert on mucosal
factors expressed within the FGT, and likely recapitulates how both estradiol and progesterone
levels are interrelated and interdependent.
3.3.6.2 Cohort Data Overlap: Interestingly, there were very few specific factors found to
overlap between the two sets of hormone correlates from the high-risk and low-risk cohorts; only
two acute phase response proteins (C3, ORM1) were found to negatively correlate with
progesterone in both cohorts. However there was indeed overlap at the functional level as many
processes and pathways found to overlap between the each cohorts’ set of progeterone correlates
despite the lack of direct factor overlap. The overlapping biological functions of the high-risk
and low-risk progesterone correlates were analyzed using Ingenuity Pathway Analysis’
comparison analysis feature (Figure 3.19). Overlapping functionality of the progesterone
correlates from both cohorts included the predicted activation of cell death, proliferation of T
lymphocytes, inflammation, and necrosis at times of high or increasing progesterone levels.

78
Figure 3.19 Biological function comparison analysis of progesterone correlates identified in two different
cohorts: the high-risk, Pumwani cohort and the low-risk, IMMENSE cohort. Biological functions highlighted
in blue are predicted to be inhibited and functions highlighted in yellow are predicted to be activated. The activation
z-score is based on the direction of the correlation of the factors known to be associated with each function.
The only overlapping biological function amongst the estradiol correlates of the two cohorts was
cell proliferation, which was predicted to be activated in both cohorts (low-risk cohort activation
z-score=2.02 and high-risk cohort activation z-score=1.62).
Furthermore, the top pathways associated with each cohort were analyzed and examined
for overlap. Overlapping pathways were identified based on the progesterone correlates
identified in either cohort, and included the LXR/RXR Activation, Acute Phase Response
Signaling, FXR/RXR Activation, Production of Nitric Oxide and Reactive Oxygen Species in
Macrophages, as well as IL-12 Signaling and Production in Macrophages (Figure 3.20).
Interestingly, there were differences between the cohorts in the predicted activation state of
certain pathways such as the LXR/RXR Activation pathway, which was predicted to be activated
in the low-risk cohort (z-score=1.13), yet inhibited in the high-risk cohort (z-score=-0.45), and
the Production of Nitric Oxide and Reactive Oxygen Species in Macrophages Pathway was
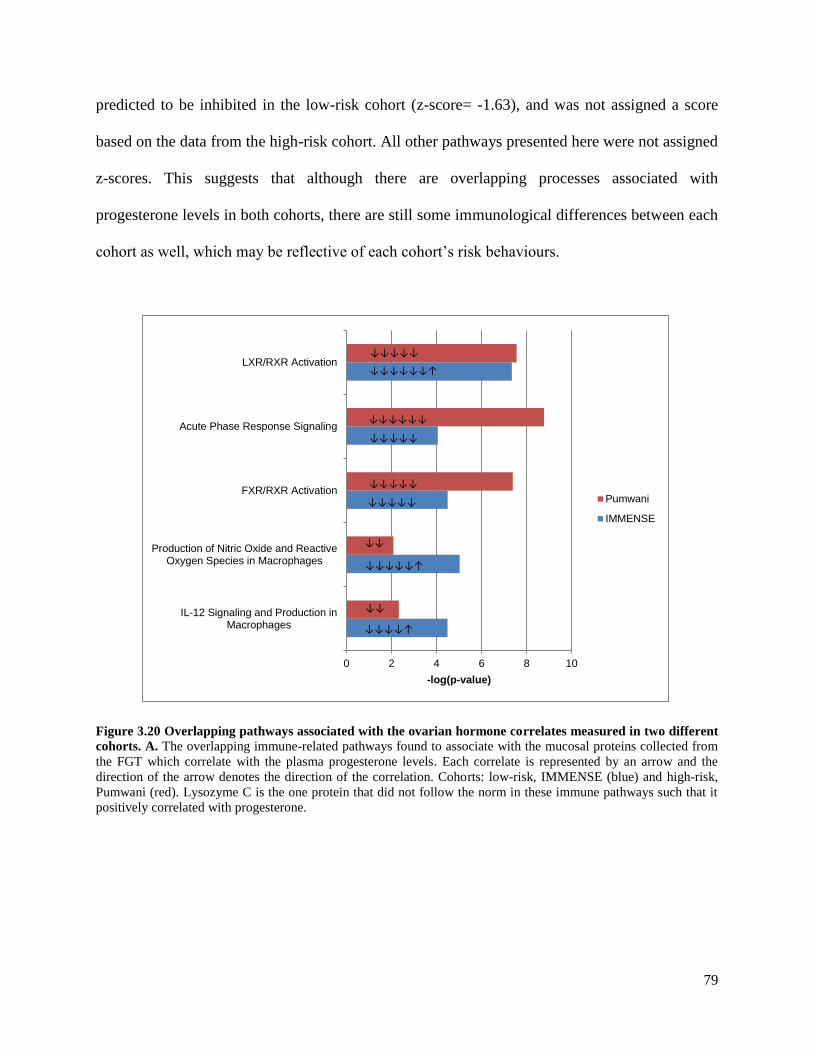
79
predicted to be inhibited in the low-risk cohort (z-score= -1.63), and was not assigned a score
based on the data from the high-risk cohort. All other pathways presented here were not assigned
z-scores. This suggests that although there are overlapping processes associated with
progesterone levels in both cohorts, there are still some immunological differences between each
cohort as well, which may be reflective of each cohort’s risk behaviours.
Figure 3.20 Overlapping pathways associated with the ovarian hormone correlates measured in two different
cohorts. A. The overlapping immune-related pathways found to associate with the mucosal proteins collected from
the FGT which correlate with the plasma progesterone levels. Each correlate is represented by an arrow and the
direction of the arrow denotes the direction of the correlation. Cohorts: low-risk, IMMENSE (blue) and high-risk,
Pumwani (red). Lysozyme C is the one protein that did not follow the norm in these immune pathways such that it
positively correlated with progesterone.
0 2 4 6 8 10
IL-12 Signaling and Production inMacrophages
Production of Nitric Oxide and ReactiveOxygen Species in Macrophages
FXR/RXR Activation
Acute Phase Response Signaling
LXR/RXR Activation
-log(p-value)
Pumwani
IMMENSE
↓↓↓↓↓↓↑
↓↓↓↓↓
↓↓↓↓↓↓
↓↓↓↓↓
↓↓↓↓↓
↓↓↓↓↓
↓↓↓↓↓↑
↓↓
↓↓
↓↓↓↓↑

80
3.4 Exogenous Progesterone Application & Mucosal Barrier Integrity
3.4.1 Study Aim: Based on the knowledge gained from the previous sections about the effects
of endogenous hormones on FGT immunology, we postulate that ovarian hormone derivatives
used exogenously, such as those used for contraceptive purposes, impact the defense barriers of
the FGT in a similar manner, which in turn may affect HIV susceptibility. The aim of this study
was to identify immune pathways affected by the popular hormonal contraceptive and exogenous
progestin, DMPA, and determine if these pathways overlap with those associated with the luteal
phase of the menstrual cycle.
3.4.2 Clinical Information: Participants included in this study were from the CAT cohort as
described in section 2.1.4. All participants tested negative for the following STIs: including
Trichomonas vaginalis, Treponema pallidum, as well as bacterial vaginosis. Also, any patients
who presented with vaginitis or cervitis symptoms, or became pregnant throughout the study
were excluded. Contraceptive methods used by study participants included in this study are
described in Table 3.9. Furthermore, of those using DMPA (n=12) as their method of
contraception, nine had recently received their injection (≤3 months since last injection), two had
not received an injection within the recommended 3 months, and 1 participant did not provide
information on when they received their last injection.
Table 3.9 Couples against transmission cohort contraceptive methods.
Contraception Method N
Hormonal Injectable DMPA 12
Non-hormonal Condom only 28
Tubal ligation 1
Natural 1
None 19

81
3.4.3 Study Design: This study included CVL samples collected from DMPA users (n=12)
and non-hormonal contraceptive users (n=49). Epidemiological data collected from this cohort
was used to test for differences between DMPA users and non-hormonal contraceptive users in
sex frequency (Mann-Whitney U-test, p=0.50), age (Mann-Whitney U-test, p=0.17), douching
practices (Chi-square, p=0.24), partner viral load (Mann-Whitney U-test, p=0.45), and vaginal
drying practices (Chi-square, p=0.50). There were no significant differences based on these
epidemiological factors between the groups compared (p>0.05). Furthermore, since one of the
inclusion criteria of this cohort was to be sexually active with an HIV-positive partner and many
participants claimed not to use condoms, the samples used in this study were tested for seminal
contamination to remove the confounding effects of recent seminal exposure. Any participants
with high levels (>1 Log10 above the median abundance) of all three seminal proteins, prostate
specific antigen, semenogelin-1 and semenogelin-2, were excluded from this study (Figure
3.21).
Figure 3.21 Participants excluded from downstream analysis based on evidence of seminal contamination. Seminal contamination was confirmed if a sample was found to have seminal protein abundances (Prostate-specific
antigen, Semenogelin-1 and Semenogelin-2) at least 10 times greater than the median abundance measured in all
samples.

82
3.4.4 Univariate Analysis: Of the 487 unique proteins confidently identified (including 16
bacterial proteins), 19 were found to be differentially abundant (1 bacterial protein) (Mann-
Whitney U-test, p<0.05) between DMPA users compared to non-hormonal contraceptive users
(Figure 3.22). Four proteins involved in inflammation (S100A8), bleeding (HBD), protease
inhibition (ITIH2), and antigen binding (KV106) were found to be overabundant in DMPA users
and 15 proteins involved in epithelial barrier integrity (TFF3, KLK7, F11R, SPRR2D, DSG1),
tissue proliferation (NCCRP1, ACE), metabolism (eno, ALDH7A1, NPC2), leukocyte migration
(CD177), negative regulation of apoptosis (PLAUR), protease inhibition (SPINT1), fertilization
(OVGP1), and necrosis (HEBP2) were found to be underabundant (Table 3.10).

83
Figure 3.22 Volcano plot of protein expression in DMPA users as compared to non-hormonal contraceptive users.
The y-axis denotes significance with increasing values demonstrating increasing significance in the differences
between DMPA users and non-hormonal contraceptive users.

84
Table 3.10 Differentially abundant proteins associated with women who use depot
medroxyprogesterone acetate.
Gene Name Protein Name Species P-value Log2 FC
Difference
(DMPA vs
nonHC)
General Function
UNDERABUNDANT PROTEINS
OVGP1 Oviduct-specific glycoprotein Homo sapiens 0.0045 -1.64 Fertilization
ACE Angiotensin-converting
enzyme
Homo sapiens 0.0450 -1.51 Blood vessel
remodeling
eno Enolase Bifidobacterium
longum
0.0275 -1.41 Glycolysis
TFF3 Trefoil factor 3 Homo sapiens 0.0034 -1.40 Mucosal epithelium
repair
NCCRP1 F-box only protein 50 Homo sapiens 0.0179 -1.39 Promotes cell
proliferation
KLK7 Kallikrein-7 Homo sapiens 0.0145 -1.25 Maintenance of the
cornified envelope
CD177 CD177 antigen Homo sapiens 0.0045 -1.24 Leukocyte
migration
F11R Junctional adhesion molecule
A
Homo sapiens 0.0092 -1.21 Tight junction
formation
SPRR2D Small proline-rich protein 2D Homo sapiens 0.0154 -1.04 Keratinization
SPINT1 Kunitz-type protease inhibitor
1
Homo sapiens 0.0188 -0.805 Protease inhibitor
PLAUR Urokinase plasminogen
activator surface receptor
Homo sapiens 0.0126 -0.771 Positive regulation
of epidermal
growth factor
receptor signaling
pathway
ALDH7A1 Alpha-aminoadipic
semialdehyde dehydrogenase
Homo sapiens 0.0470 -0.757 Protein metabolism
HEBP2 Heme-binding protein 2 Homo sapiens 0.0217 -0.727 Positive regulation
of necrotic cell
death
NPC2 Epididymal secretory protein
E1
Homo sapiens 0.0170 -0.687 Steroid metabolism
DSG1 Desmoglein-1 Homo sapiens 0.0262 -0.683 Cell-cell adhesion
OVERABUNDANT PROTEINS
HBD Hemoglobin subunit delta Homo sapiens 0.0154 1.56 Oxygen transport
S100A8 Protein S100-A8 Homo sapiens 0.0302 0.971 Inflammatory
response
ITIH2 Inter-alpha-trypsin inhibitor
heavy chain H2
Homo sapiens 0.0126 0.919 Protease inhibitor
KV106 Ig kappa chain V-I region EU Homo sapiens 0.0114 0.795 Antigen binding
Further evaluation of these DMPA-associated factors via IPA (using methods outlined in section
2.7.3) uncovered common biological functions which were predicted to be activated based on the
specific proteins found to be differentially abundant. Inflammation, cell death and apoptosis were
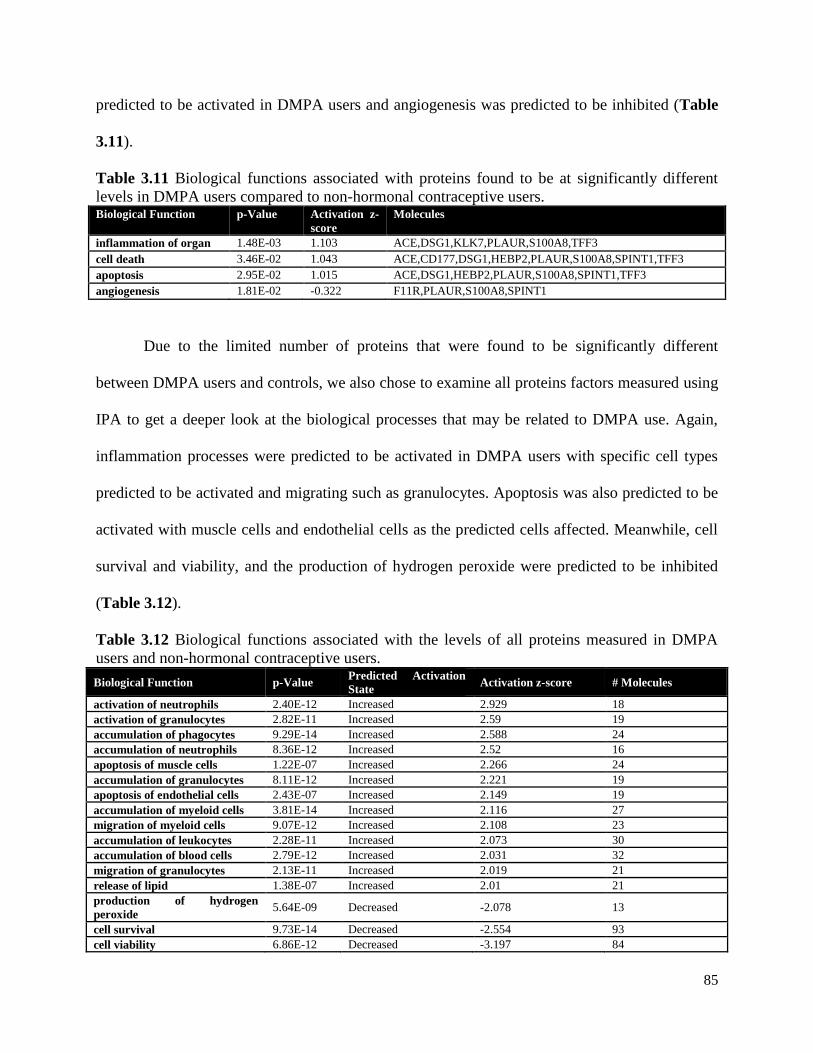
85
predicted to be activated in DMPA users and angiogenesis was predicted to be inhibited (Table
3.11).
Table 3.11 Biological functions associated with proteins found to be at significantly different
levels in DMPA users compared to non-hormonal contraceptive users. Biological Function p-Value Activation z-
score
Molecules
inflammation of organ 1.48E-03 1.103 ACE,DSG1,KLK7,PLAUR,S100A8,TFF3
cell death 3.46E-02 1.043 ACE,CD177,DSG1,HEBP2,PLAUR,S100A8,SPINT1,TFF3
apoptosis 2.95E-02 1.015 ACE,DSG1,HEBP2,PLAUR,S100A8,SPINT1,TFF3
angiogenesis 1.81E-02 -0.322 F11R,PLAUR,S100A8,SPINT1
Due to the limited number of proteins that were found to be significantly different
between DMPA users and controls, we also chose to examine all proteins factors measured using
IPA to get a deeper look at the biological processes that may be related to DMPA use. Again,
inflammation processes were predicted to be activated in DMPA users with specific cell types
predicted to be activated and migrating such as granulocytes. Apoptosis was also predicted to be
activated with muscle cells and endothelial cells as the predicted cells affected. Meanwhile, cell
survival and viability, and the production of hydrogen peroxide were predicted to be inhibited
(Table 3.12).
Table 3.12 Biological functions associated with the levels of all proteins measured in DMPA
users and non-hormonal contraceptive users.
Biological Function p-Value Predicted Activation
State Activation z-score # Molecules
activation of neutrophils 2.40E-12 Increased 2.929 18
activation of granulocytes 2.82E-11 Increased 2.59 19
accumulation of phagocytes 9.29E-14 Increased 2.588 24
accumulation of neutrophils 8.36E-12 Increased 2.52 16
apoptosis of muscle cells 1.22E-07 Increased 2.266 24
accumulation of granulocytes 8.11E-12 Increased 2.221 19
apoptosis of endothelial cells 2.43E-07 Increased 2.149 19
accumulation of myeloid cells 3.81E-14 Increased 2.116 27
migration of myeloid cells 9.07E-12 Increased 2.108 23
accumulation of leukocytes 2.28E-11 Increased 2.073 30
accumulation of blood cells 2.79E-12 Increased 2.031 32
migration of granulocytes 2.13E-11 Increased 2.019 21
release of lipid 1.38E-07 Increased 2.01 21
production of hydrogen
peroxide 5.64E-09 Decreased -2.078 13
cell survival 9.73E-14 Decreased -2.554 93
cell viability 6.86E-12 Decreased -3.197 84

86
3.4.5 Multivariate Analysis: LASSO was performed on the 487 proteins identified, and 5
protein features were selected by the algorithm based on the criteria outlined in section 2.8.2.
These five LASSO-selected features were able to classify DMPA users from non-HC users with
80% calibration accuracy, 73% cross-validation accuracy, and the first two latent variables
accounted for 45% of the variance measured (Figure 3.23). Latent variable 1 (LV1) showed
partial separation between DMPA users and non-HC users (Figure 3.23A). Three of the five
features (hemoglobin subunit delta, Ig kappa chain V-I region EU, keratin, type II cytoskeletal
6c) were negatively loaded on LV1 indicating they were positively associated with DMPA use,
and the other two features (CD177 antigen, heme-binding protein 2) were positively loaded on
LV1 indicating they were positively associated with non-HC use and negatively associated with
DMPA use (Figure 3.23B, Table 3.13).
Figure 3.23 Multivariate analysis based on LASSO-identified biomarkers and the partial least squares
discriminant analysis (PLSDA) classification model of proteins associated with DMPA use. A. Scores plot of
the 61 individuals included in this study demonstrates partial classification based on hormonal contraceptive use
with 80% calibration accuracy, 73% cross validation accuracy, and the first two latent variables accounting for 45%
of the variance (p=0.0072). Latent Variable 1 (LV1) partly differentiated non-hormonal contraceptive users (positive
scores on LV1) from DMPA users (negative scores on LV1). B. Loadings plot of the 5 LASSO-identified
biomarkers. Two of the five identified markers were positively loaded on LV1 indicating that they were positively
associated with non-hormonal contraceptive users (blue bars), while three markers were negatively loaded on LV1,
indicating they were negatively associated with non-hormonal contraceptive use or positively associated with
DMPA use (red bars).

87
Table 3.13 LASSO-selected features that distinguish between DMPA users and non-hormonal
contraceptive users via PLSDA.
Gene Name Description Species Functions Log2FC
DMPA vs
non-HC
p-value
CD177 CD177 antigen Homo sapiens Leukocyte migration -1.24 0.018
HBD Hemoglobin subunit delta Homo sapiens Oxygen transport 1.56 0.0025
HEBP2 Heme-binding protein 2 Homo sapiens Positive regulation of necrotic
cell death
-0.73 0.0061
KV106 Ig kappa chain V-I region
EU
Homo sapiens Classical complement activation 0.795 0.0044
KRT6C Keratin, type II
cytoskeletal 6C
Homo sapiens Structural molecule activity 0.436 0.392
We confirmed that our model was optimal by generating 10,000 additional PLSDA models, each
with 5 different combinations of proteins selected from the remaining (non-LASSO) 482
measured proteins. This analysis suggested that our LASSO-selected model was significantly
better at distinguishing between our two phenotypes in question (DMPA use vs non-HC use,
p=0.0072), as both calibration accuracy and cross-validation accuracy were in the 99.3th
percentile rank compared to other models.
3.4.6 Gene Set Enrichment Analysis: The GSEA toolset was used to uncover phenotypic
associations within our proteomic data set comparing mucosal samples between women using
DMPA and women who were not using non-hormonal contraception as described in the methods
section 2.9 above. Two genes sets were enriched with medium strength and one gene set with
low strength with DMPA user samples and 8 gene sets were enriched with medium strength with
the non-hormonal contraceptive-using control samples (Appendix 6.2.3). The top DMPA-
associated gene sets were from naïve B cells: genes up-regulated in naïve B cells versus IgM-
memory B cells (5 proteins, NES=1.99, p<0.001, Figure 3.24A), and monocytes: genes down-
regulated in monocytes treated with 5000ng/mL LPS versus those treated with 1ng/mL LPS (6
88
proteins, NES=1.58, p=0.028, Figure 3.24B). The third most enriched gene set was from
neutrophils (7 proteins, NES=1.50, p=0.07), although this enriched gene set did not reach
statistical significance likely due to the underpowered nature of our study. The top gene sets
associated with non-hormonal contraceptive users were from cord blood CD4 T cells: genes up-
regulated in CD4 T cells from cord blood versus those from adult blood (7 proteins, NES=-1.98,
p<0.001, Figure 3.24C), and dendritic cells: genes up-regulated in dendritic cells versus NK
cells (16 proteins, NES=-1.79, p=0.007, Figure 3.24D).
3.4.7 Functional overlap between the luteal phase and DMPA use: A comparison analysis
was performed using IPA to compare the luteal phase proteomic profiles from both the primary
and validation cohorts and the proteomic profile measured in DMPA users. The purpose of this
analysis is to help uncover which biological processes are similarly activated or inhibited in both
high progesterone conditions whether expressed endogenously or applied exogenously. Indeed,
we found many of the same biological processes were predicted to be activated based on these
progesterone-based phenotypes including the infiltration, accumulation and adhesion of
leukocytes/neutrophils (Figure 3.25). These findings suggests that endogenous and exogenous
progesterone may impact inflammation-driven pathways in a similar fashion, which could have
important implications for injectable progesterone-based contraceptive use in women at high-risk
for HIV acquisition.

89
Figure 3.24 The top two gene sets associated with DMPA users (A-B) and non-hormonal contraceptive users
(C-D) based on the gene set enrichment analysis. Gene sets associated with DMPA represented specific immune
cell signatures from monocytes and naïve B cells; whereas gene sets associated with non-hormonal contraceptive
using controls represented signatures from CD4+ T cells and dendritic cells. The gene sets were: A. Genes up-
regulated in naïve B cells versus IgM-memory B cells (5 proteins, NES=1.99, p=<0.001), B. Genes down-regulated
in monocytes treated with 5000ng/mL LPS versus those treated with 1ng/mL LPS (6 proteins, NES=1.58, p=0.028),
C. Genes up-regulated in CD4 T cells from cord blood versus those from adult blood (7 proteins, NES=-1.98,
p<0.001), D. Genes up-regulated in dendritic cells versus NK cells (6 proteins, NES=-1.79, p=0.007)
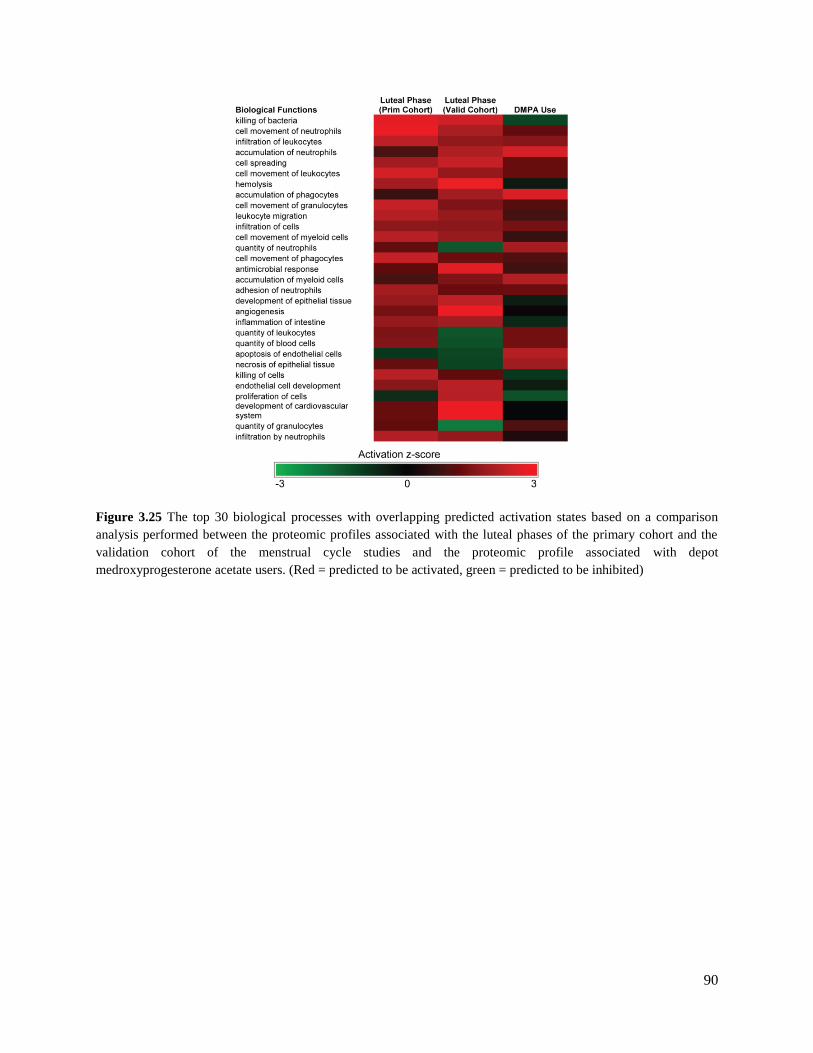
90
Figure 3.25 The top 30 biological processes with overlapping predicted activation states based on a comparison
analysis performed between the proteomic profiles associated with the luteal phases of the primary cohort and the
validation cohort of the menstrual cycle studies and the proteomic profile associated with depot
medroxyprogesterone acetate users. (Red = predicted to be activated, green = predicted to be inhibited)

91
Chapter 4. Global Discussion
4.1 General Discussion: This is the first comprehensive proteomics study to examine the
mucosal proteome of the FGT in the context of ovarian hormone levels. Ovarian hormones,
estradiol and progesterone, are produced and maintained at varying levels within the female body
to generate an environment that promotes successful reproduction within the FGT [80]. This is
accomplished in humans through cyclical hormonal changes known as the menstrual cycle where
ovulation is induced, the endometrial lining is maintained for potential conception, and
menstruation follows if successful conception and implantation does not occur [69]. In this body
of work we examined how these physiological and immunological changes, induced by
endogenous hormone levels, affected the mucosal proteome of the FGT through the examination
of secretions collected from individuals in the follicular and luteal phases of the menstrual cycle,
by correlating mucosal protein levels with plasma ovarian hormone levels, and by examining
how the mucosal proteome differed between individuals exogenously injecting a synthetic
progesterone contraceptive (DMPA) compared to individuals not using any form of hormonal
contraception.
Estradiol is associated with the enrichment of epithelial barrier integrity proteins in the female
genital tract
Here, we found that the mucosal proteome generated during the estradiol-dominant follicular
phase was enriched with proteins with biological functions that are responsible for cellular
proliferation, adherence, mediation of inflammation, and epithelial barrier integrity
[119,127,128]. These functions likely contribute to the generation and maintenance of the FGT’s
epithelium. A healthy, impassable epithelium represents a nearly insurmountable defensive force

92
against pathogens that attempt to gain access to the host’s submucosa, and represents a major
barrier in preventing HIV infection. This has been highlighted in various studies which have
associated innate immune activation and epithelial barrier damage with increased incidence of
HIV [58,129]. Indeed, various protease inhibitors were found to be enriched during the estradiol-
dominant follicular phase and are known regulators of inflammation [119,130]. Higher levels of
these antiproteases may help to reduce immune activating processes, while at the same time
perform innate anti-viral functions [119], which may in turn help prevent the establishment of an
HIV founder population if a woman were to be challenged with virus at this time. The
association between increased antiproteases levels and an HIV resistant phenotype has been
previously characterized in highly exposed seronegative female sex workers [77,131]. Protease
inhibition also aids in the mitigation of protease-mediated barrier damage [130], and thus
promotes epithelial barrier integrity. Estradiol’s link to epithelial barrier integrity is further
substantiated as other proteins enriched during the estradiol-dominant follicular phase included
cell-cell adhesion factors and components of the cornified envelope, both of which contribute to
the impermeability of the epithelial barrier [113,116]. Plasma estradiol levels were also found to
directly positively correlate with proteins involved in epidermis development, the cornified
envelope and cellular proliferation. Estradiol levels were found to negatively correlate with
proteins involved in necrosis of epithelial tissue. These findings provide further evidence of the
strong link which exists between estradiol levels and the development and maintenance of the
epithelial barrier. This association with enhanced barrier function may explain the protective
effects observed in non-human primates who were treated with estrogen and did not become
infected with SIV when challenged intravaginally [89,132]. Furthermore, the estradiol-dominant
follicular phase of the menstrual cycle was also associated with quiescent innate immune cell

93
signatures and B cell signatures. These immune cells may help to maintain a protective
environment, particularly if B cells are most abundant during this time and are actively
producing various immunoglobulins, as increased antibody production may result in a more
targeted response against pathogens and less overall inflammation [25].
Progesterone is associated with a loss of epithelial barrier integrity proteins and increased
inflammation and leukocyte migration proteins in the female genital tract
On the contrary, the mucosal proteome of the progesterone-dominant luteal phase was found to
have an overabundance of proteins primarily associated with cellular movement particularly that
of migrating leukocytes, inflammation, peptidase activity, apoptosis and cell/tissue permeability.
These bio-functions have all been associated with enhanced HIV infection and/or transmission
[74,133,134]. These findings agree with the inflammatory events that are predicted to occur
during the late luteal phase in the upper FGT preceding endometrial bleeding [135]. The
withdrawal of progesterone during the mid to late luteal phase is known to trigger a signaling
cascade that leads to tissue remodeling within the endometrium and the infiltration of leukocytes
including neutrophils, macrophages and natural killer cells. The signatures of these biological
processes are reflected in the analyses of this study including IL-8 and Leukocyte Extravasation
Signaling pathways, which agrees with these predicted physiological outcomes [136]. These
biological processes were also consistently associated with the luteal phase proteome measured
in a second cohort, the IMMENSE validation cohort, with various inflammation and immune cell
recruitment pathways predicted to be activated with a particularly strong link to neutrophils.

94
Our multivariate models also reiterated these findings whilst at the same time uncovered
unique protein relationships which were not initially identified. For instance, our primary cohort
data-driven model included 8 overlapping factors identified in the univariate analysis as well as
10 unique factors. This proteomic signature of 18 LASSO-selected features may better reflect the
global changes occurring over the course of the menstrual cycle in vivo as these proteins were
selected based on their shared variance or multicollinearity, meaning together as a group they
help to better explain measurable differences between menstrual cycle phases. Multivariate
analysis provides us with greater power to infer true biological effects from probabilistic noise as
many of the changes that occur in vivo are often of small magnitude and do not always pass
univariate statistical thresholds. Indeed, the multivariate models produced from both the primary
and validation cohorts were highly accurate (100% calibration accuracy) in distinguishing
follicular phase from luteal phase samples. Although different proteins were selected in each
model, their functions were overlapping based on menstrual cycle phase. The model generated
from the primary cohort’s data identified positive associations between cytoskeletal elements and
proteases/chemoattractants such as Azurocidin, and concurrent negative associations with cell-
cell adhesion and cornification factors during the luteal phase. The validation cohort’s model
positively associated features with known roles in inflammation and apoptosis with the luteal
phase. These inferred biological processes include those that are involved in tissue remodeling
which must occur prior to leukocyte infiltration [137]. This time of potentially increased
epithelial barrier disruption may be a key feature contributing to HIV susceptibility.
These findings from two distinct cohorts from different geographical locations generate
greater confidence that these processes are occurring on a global scale in women when they are

95
in the progesterone-driven luteal phase of their menstrual cycles. Furthermore, our correlative
analysis also found high progesterone levels from the IMMENSE and Pumwani cohorts
associated with markers of inflammation and apoptosis, further solidifying the link between
these immunological processes and progesterone levels. Indeed, the findings from our study
demonstrate the antagonistic relationship which exists between estradiol and progesterone
including opposing effects on the genital tract’s proliferative capacity as well as opposing effects
on inflammation [138,139]. Progesterone has been shown to exacerbate triggered inflammatory
responses, whereas estradiol has been shown to prevent inflammatory reactions altogether [140].
These antagonistic effects have been shown to impact susceptibility to HSV-2 in the genital tract
of mice such that mice treated with estradiol did not become infected, and those treated with
progesterone had exacerbated inflammation and increased neutrophil infiltration [141]. These
progesterone-related findings match our study’s findings that proteins with known roles in
neutrophil infiltration were enriched during the progesterone-driven luteal phase in women.
These processes may represent a mechanism that may lead to increased epithelial barrier
disruption and increased HIV susceptibility during times of elevated progesterone levels as HIV
has been shown to successfully infect the FGT in both in vivo macaque models and ex vivo
cervical explant models by simple diffusion when cellular junctions were compromised
[82,86,87,105].
Gene-set enrichment analysis associates neutrophil signatures with the progesterone-driven
luteal phase of the menstrual cycle
Our initial IPA-based functional analysis pointed to neutrophils as a major cell type contributing
to the proteomic signature observed during the luteal phase of the menstrual cycle. To evaluate

96
this relationship and other immune cell type associations with either phase of the menstrual
cycle, we performed gene-set enrichment analysis on the entire proteomic data sets measured.
Neutrophil signatures were consistently the most enriched immune cell signature associated with
the luteal phase in both the primary and validation cohorts, and trended towards significant
enrichment in DMPA users. It is currently understood that neutrophils increase in number in the
endometrium upon progesterone withdrawal during the late luteal phase as well as during menses
following an IL-8 surge [66]. This influx is believed to occur for the purposes of aiding in
endometrial tissue breakdown via the release of proteases and to increase immune defense whilst
the epithelial barrier is disrupted. Interestingly, our analysis also associated CD4+ T cell
signatures with the luteal phase phenotype in our primary cohort. These results are in contrast to
the results of other studies which did not find increased levels of CD4+ T cells in cervical explant
tissues collected during the luteal phase or in progesterone-based contraceptive users [88,142].
This may have been due to the fact that the samples from Saba et al’s study were collected from
women undergoing hysterectomy due to various morbidities, therefore these samples may not
necessarily recapitulate the natural changes occurring over the course of the menstrual cycle in
young, healthy women [88]. Whereas the study examining cervical explants from progesterone-
based contraceptive users, used non-hormonal contraceptive users in their luteal phases as their
controls, which might explain why they did not observe any differences in CD4+ T cell numbers
as both groups were in a state of high progesterone [142]. However, other work by our group has
shown that a proteomic signature of elevated proteases (MMP9, MMP8, Neutrophil elastase)
and cytoskeletal elements, a signature very similar to the luteal phase signature described in our
study, positively associated with increased numbers of cervical CD4+ T-cells [143]. Further to
this, neutrophils and lymphocytes have been shown to actively migrate through cervical mucus

97
ex vivo, and the migratory pathway created within the mucosa by these immune cells has been
proposed to permit easy translocation of infectious pathogens such as HIV [144]. Although, we
were unable to directly confirm increased levels of these immune cell populations in our study,
our proteomic findings do indeed suggest that the proteomic signatures measured during the
progesterone-dominant luteal phase were consistently associated with active neutrophil
signatures in both cohorts examined. Using this information, we have generated new mechanistic
hypotheses. We hypothesize that neutrophils represent the primary immune cell type responsible
for the epithelial barrier disruption observed during times of elevated progesterone, and the
various chemoattractants they secrete draw in CD4+ T lymphocytes to the site of HIV
transmission. This potential increase in HIV target cell numbers with activated phenotypes found
near breaches in the epithelial barrier may create an environment that is more susceptible to HIV
infection.
Bacterial diversity is increased during the luteal phase of the menstrual cycle
We also performed multivariate modeling with the bacterial proteins found in our primary and
validation data sets to determine which bacterial proteins were most associated with each
menstrual cycle phase. We were unable to gather informative data about the changes occurring at
the bacterial level over the course of the menstrual cycle using samples from primary cohort as
samples were collected cross-sectionally from different individuals. However, we were able to
detect differences between the bacterial genera present during the follicular and luteal phases
based on the proteins expressed in the samples collected from the validation cohort as they were
collected from the same individuals longitudinally. Our mass spectrometry data suggests that
there may be a shift in the microbial environment from a largely Lactobacillus-dominated

98
environment during the follicular phase to a more diverse microbial environment during the
luteal phase. Increased bacterial diversity is associated with bacterial vaginosis and the
generation of a pro-inflammatory environment, which could lead to enhanced HIV acquisition
risk [62,145]. Interestingly, a study by Bradshaw et al associated estrogen-containing
contraceptives with decreased BV recurrence [146], which matches the findings of our study
such that the estrogen-dominant follicular phase was found to be dominated by Lactobacillus.
There have also been other studies which have linked normal vaginal flora with increased
estradiol levels, and abnormal vaginal flora and bacterial vaginosis with low estradiol levels
[147]. Progesterone has been shown to impact vaginal microflora as well such that the
application of the exogenous progesterone, DMPA, resulted in a loss of Lactobacillus and
thinning of vaginal epithelium, which was believed to have occurred due to DMPA having
suppressed the production of estradiol [94]. This hormonal effect on vaginal microflora may also
be linked to estradiol and progesterone’s antagonistic effects on the proliferative capacity of the
epithelial barrier, which not only functions as the primary barrier keeping pathogens from
gaining access to the host’s system, it also functions as an ecological niche for Lactobacilli
[138,148]. Therefore, a loss of epithelial barrier thickness and integrity may result in a transition
from a Lactobacillus-dominated microbial environment to a more diverse microbial
environment, and all of this together may represent another driver of inflammation and enhanced
HIV susceptibility during times of increased progesterone levels.

99
Exogenous progesterone use is also associated with reduced levels of epithelial barrier integrity
proteins
To further examine the impact of exogenous progesterone use, we chose to examine a cohort of
women using the injectable hormonal contraceptive, DMPA, and compare their mucosal genital
tract proteomic profiles to those of women who were not using any form of hormonal
contraception. DMPA has been associated with an increased risk of HIV acquisition in various
meta-analyses [101,102,149], and the mechanism behind this enhanced vulnerability has been
partly explored, but has not been fully elucidated [98,150-152]. Here, we chose to investigate
whether the use of exogenous progesterone would induce the same immunological processes
observed during times of high endogenous progesterone levels. Indeed, we found that DMPA use
negatively associated with various epithelial barrier integrity factors, which overlaps with what
we found during the luteal phase of menstrual cycle. However in this study, several novel
epithelial barrier integrity factors were identified, and were also some of the most differentially
abundant proteins based on DMPA use. These proteins included Trefoil factor 3 (TFF3) and
Junctional adhesion molecule A (JAM1). JAM1 is a protein involved in epithelial cell tight
junction formation [153], which has been shown to be affected by ovarian hormone levels in
studies of ovarectomized rats exogenously treated with estradiol. These estradiol-treated rats
were found to have reduced transepithelial permeability over the mucosal epithelium due to an
up-regulation of tight junction barrier proteins including JAM1 [154]. TFF3 is a mucin-
associated protein involved in the repair and healing of mucosal epithelia [155] that also appears
to be affected by estradiol. For instance, Borthwick et al. found TFF3 transcript levels to be
much higher during the estrogen-dominant follicular phase in the endometrium, which was
postulated to occur due to the restitution required after menstruation [156]. TFF3 was not

100
identified as differentially abundant between menstrual cycle phases in this analysis, likely due
to the fact that our study was underpowered and was mainly focused on proteins secreted in the
lower FGT. However, TFF3 was found to be an enrichment factor associated with B cell
signatures which were positively associated with the estradiol-dominant follicular phase in our
gene-set enrichment analysis of the IMMENSE cohort. Interestingly, TFF3 was found to be
significantly underabundant in individuals using DMPA. It is possible that DMPA is preventing
the barrier-promoting effects of estradiol in these women as DMPA has been shown to abrogate
the effects of estradiol by suppressing the formation of graafian follicles, which are responsible
for estrogen production [157]. Evidence of this DMPA-associated loss of barrier integrity is also
partly supported by hemoglobin (HBD) levels being positively associated with DMPA use in our
multivariate model, as this may represent increased break-through/irregular bleeding in DMPA
users, a common side-effect associated with this hormonal contraceptive [158].
Interestingly, one specific leukocyte migration protein, CD177, was found to be
negatively associated with DMPA in both our univariate and multivariate analyses. Based on
CD177’s known role in neutrophil infiltration, this finding appears to contradict what we would
expect based upon our previous findings which found CD177 positively correlated with
progesterone, and markers of active neutrophil infiltration were significantly associated with
high progesterone levels. This difference may be explained by the fact that DMPA has been
found to have off-target effects by its affinity for other steroid receptors beyond the progesterone
receptor (PR) such as the glucocorticoid receptor (GR) [159]. DMPA has been shown to bind to
GR with a similar or greater affinity than the GR’s natural agonist, cortisol [160]. This
interaction has been associated with immunosuppressive outcomes [159], which might explain

101
the negative association observed between CD177 and DMPA use in our analysis. However,
when the DMPA and luteal phase proteomic profiles were compared there were overlapping
biological processes predicted to be activated including increased cell movement, accumulation
and infiltration of leukocytes. It is possible that these processes are triggered through the PR
pathway, and concurrent immune-regulating pathways are also triggered via the GR in
individuals using DMPA. These combined effects may result in the perfect storm of triggered
immunological events such as increased epithelial barrier disruption with a concurrently
hampered immune response which would increase HIV’s access to target cells and prevent
effective viral clearance. This also might explain why DMPA use is more strongly associated
with HIV acquisition risk than non-hormonal contraceptive users in their luteal phase [161-163].
Gene-set enrichment analysis did not find an association between DMPA use and HIV
target cell signatures, although it is possible that with a larger sample size these results may
change as other studies have observed an influx of HIV target cells in the cervices of young
women using DMPA. This preliminary study was associated with a 5-fold increased risk of HIV
acquisition compared to their non-injectable user counterparts [164]. HIV target cells have also
been found to be enriched in the vagina and endocervix of DMPA-treated ovarectomized
monkeys [79]. Even if target cells are not specifically recruited to the FGT in DMPA users, a
loss of epithelial barrier integrity alone would still increase one’s susceptibility to infection as
HIV would be more likely to gain access to the submucosa where CD4+ T cells are present.
Indeed, a loss of epithelial barrier integrity has been associated with other progesterone-only
contraceptives such as specific intrauterine devices which were associated with ectocervical
epithelial thinning and decreased mRNA levels of important tight junctions proteins [142]. Other

102
studies such as in vitro studies in epithelial cell lines have also associated DMPA use with
reduced epithelial cell proliferation, diminished epithelial barrier integrity, and increased
production of pro-inflammatory cytokines [98]. These findings corroborate our study’s findings
which strongly suggest ovarian hormones and their derivatives impact the physical barrier of the
genital tract.
In summary, we found various overlapping biological themes based on the proteins
expressed under varying ovarian hormone-based conditions. Increased estradiol levels associated
with mucosal proteomes enriched with cell proliferation, cell-cell adhesion, and inflammation
mediation proteins suggesting estradiol is associated with maintaining a robust and intact
epithelial barrier in the genital tract. On the contrary, overlapping immunological themes of
inflammation, leukocyte infiltration, apoptosis, and a loss of epithelial barrier integrity were
found to associate with increased progesterone levels. These themes were consistent whether the
progesterone levels were expressed endogenously during the luteal phase or were applied
exogenously in the form of DMPA (Figure 4.1).

103
Figure 4.1 The overlapping themes identified based on conditions associated with ovarian hormone levels including
major immunological features found to associate with the luteal phase, endogenous estradiol and progesterone
plasma levels, and exogenous medroxyprogesterone acetate use.
We now revisit our global hypothesis and conclude that mucosal immune factor
expression in the FGT is indeed impacted by ovarian hormone levels. Here, we propose an
ovarian hormone-associated mucosal model of HIV susceptibility based on the findings of this
study (Figure 4.2). We propose that during times of increased estradiol levels such as the
follicular phase of the menstrual cycle, there are increased levels of protease inhibitors present
within the mucosa which can limit protease-mediated epithelial barrier damage and
inflammation. During this time, there is also a more robust epithelial barrier as there are more
cellular adhesion, cornification, and cellular proliferation and differentiation factors expressed,
which ensures a strong, flexible yet impermeable epithelial barrier is maintained (Figure 4.2A).
104
We believe that this robust barrier would provide the necessary protection required to prevent
HIV from infecting its target cells found in the submucosa below if a woman were to be
challenged with virus at this time. Whilst during times of increased progesterone levels whether
produced endogenously during the luteal phase of the menstrual cycle or exogenously applied in
the form of an injectable progestin-only hormonal contraceptive, there is increased neutrophil
recruitment which results in higher levels of secreted tissue remodeling proteases and T
lymphocyte chemoattractants. These proteases contribute to the degradation of the epithelial
barrier, and the chemoattractants draw HIV targets cells closer to the damaged and more
permeable barrier (Figure 4.2B). Reduced cellular proliferation and adhesion during this time
further exacerbate the loss of epithelial barrier integrity due to vaginal wall thinning, and may
also contribute to a loss of Lactobacilli which may generate opportunities for non-
commensal/pathogenic microbes to proliferate, potentially adding to this inflammation-feeding
cycle. All of the processes together may help to generate an environment that increases HIV’s
access to its preferred target cells, which would increase a woman’s susceptibility to infection if
challenged with HIV during this time.

105
Figure 4.2 Mucosal model of ovarian hormone-associated HIV susceptibility deduced from changes in the mucosal
proteome of the female genital tract over the course of the menstrual cycle or through the application of exogenous
progestins such as the injectable hormonal contraceptive, depot medroxyprogesterone acetate. (Modified from Birse
et al. 2015 [165])
106
4.2 Study Limitations & Future Directions: This study has several limitations that warrant
discussion. As this study was initially designed in a post-hoc nature, we were unable to confirm
or ascertain immune cell populations and other biological events in our analysis. However, these
are important next steps in the ongoing IMMENSE study. Other caveats include the small
sample sizes of all the cohorts included in this study, which resulted in a lack of statistical power.
For this reason, multiple comparison corrections could not be applied to the univariate analyses
applied to our data sets without causing substantial type II error. Furthermore, data acquired from
the primary cohort had several limitations as it was performed cross-sectionally, utilized days
since last menstrual period as an indicator of menstrual cycle phase, and did not include systemic
hormone measurements. To mitigate these issues, we chose to set very narrow windows for our
follicular and luteal phase inclusion criteria to prevent phase mismatch or overlap. These caveats
were further alleviated as we chose to repeat our study in a separate cohort of women, a
validation cohort, which consisted of women who had CVL and plasma collected weekly over
the duration of one menstrual cycle. Menstrual cycle phase was based on plasma hormone levels
as well as days since last menstrual period. Data from the validation cohort was utilized to verify
data obtained from the primary cohort, and there was indeed functional overlap based on
menstrual cycle phase between the two cohorts. Validation of the mechanisms proposed based on
this study’s findings have not yet been performed, however this is a future direction as samples
continue to be collected from the validation cohort to increase the study’s power. Ectocervical
biopsies are also being collected from this cohort, and these tissues will be used to characterize
changes in epithelial barrier thickness, immune cell populations and immune cell phenotypes
during the luteal phase of the menstrual cycle using tools such as immunohistochemistry.
Specific immune cell targets will include neutrophils and CCR5+ CD4
+ T lymphocytes based on

107
our initial findings. Other biomarkers of interest for immunohistochemical staining will include
Plastin-2, neutrophil elastase, and metalloproteases 8 and 9, as we hypothesize that these factors
will stain in areas of the tissues where immune cell infiltration and activation are occurring. Once
immune cells signatures and biomarker expression are confirmed to be differentially regulated
during the menstrual cycle. Animal studies and/or in vitro studies could then be performed to
further validate how ovarian hormones impact transepithelial permeability and HIV infection by
knocking down or activating specific leukocyte infiltration pathways. Similar studies are also
being planned in a separate cohort of DMPA users from the CAPRISA-004 trial, and will include
the measurement of participant’s plasma MPA levels. This information will help us to better
understand at what specific level of MPA these predicted biological processes of epithelial
barrier integrity loss occur. We can then relate this information back to when these women
received their DMPA injection, and if there is a window of increased vulnerability to HIV
infection when plasma MPA reach specific levels.
4.3 Study Contributions & Importance to the HIV Field: The findings of this study
contribute to our knowledge of how ovarian hormones impact the mucosal proteome of the FGT.
Here, we propose ovarian hormone-based molecular mechanisms that may explain the enhanced
HIV susceptibility observed in pig-tail macaques and human cervical explants during the
progesterone-dominant luteal phase as well as the increased HIV acquisition risk associated with
DMPA use. If these mechanisms are indeed proven in future studies, this information will be
important for guiding efficacious HIV prevention technology design, and will have important
implications for women using progesterone-only hormonal contraceptives. If progesterone-only
108
contraceptives such as DMPA are contributing to an increased susceptibility to HIV infection,
their future use in HIV prevalent countries and/or their formulation will need to be re-evaluated.
4.4 Concluding Remarks: We believe that the findings of this study shed light on
immunological events that occur in the FGT in relation to changing ovarian hormone levels. The
antagonistic relationship between estradiol and progesterone is here shown to impact epithelial
barrier integrity and immune cell recruitment and activation processes, such that increased
estradiol levels promote a more protective environment in the FGT and increased progesterone
levels promote a more HIV susceptible environment. This susceptibility may be linked to the
increased access to HIV target cells generated by these processes at the site of HIV transmission.
This research is hypothesis generating, and further research is needed to test these proposed
mechanisms of hormone-associated vulnerability in women.

109
Chapter 5. References
1. Zhu T, Korber BT, Nahmias AJ, Hooper E, Sharp PM, Ho DD (1998) An African HIV-1 sequence
from 1959 and implications for the origin of the epidemic. Nature 391: 594-597.
2. (CDC) CfDCaP (1981) Kaposi's sarcoma and Pneumocystis pneumonia among homosexual men--New
York City and California. MMWR Morbidity and mortality weekly report 30: 305-308.
3. (CDC) CfDCaP (1996) Pneumocystis pneumonia--Los Angeles. 1981. MMWR Morbidity and
mortality weekly report 45: 729-733.
4. Barre-Sinoussi F, Chermann JC, Rey F, Nugeyre MT, Chamaret S, Gruest J, et al. (1983) Isolation of a
T-lymphotropic retrovirus from a patient at risk for acquired immune deficiency syndrome
(AIDS). Science 220: 868-871.
5. Gallo RC, Salahuddin SZ, Popovic M, Shearer GM, Kaplan M, Haynes BF, et al. (1984) Frequent
detection and isolation of cytopathic retroviruses (HTLV-III) from patients with AIDS and at risk
for AIDS. Science 224: 500-503.
6. WHO (2015) Global Health Observatory data.
7. UNAIDS (2014) The Gap Report
8. Chiu IM, Yaniv A, Dahlberg JE, Gazit A, Skuntz SF, Tronick SR, et al. (1985) Nucleotide sequence
evidence for relationship of AIDS retrovirus to lentiviruses. Nature 317: 366-368.
9. Wain-Hobson S, Alizon M, Montagnier L (1985) Relationship of AIDS to other retroviruses. Nature
313: 743.
10. Heeney JL, Dalgleish AG, Weiss RA (2006) Origins of HIV and the evolution of resistance to AIDS.
Science 313: 462-466.
11. Keele BF, Van Heuverswyn F, Li Y, Bailes E, Takehisa J, Santiago ML, et al. (2006) Chimpanzee
reservoirs of pandemic and nonpandemic HIV-1. Science 313: 523-526.
12. Plantier JC, Leoz M, Dickerson JE, De Oliveira F, Cordonnier F, Lemee V, et al. (2009) A new
human immunodeficiency virus derived from gorillas. Nat Med 15: 871-872.
13. Santiago ML, Range F, Keele BF, Li Y, Bailes E, Bibollet-Ruche F, et al. (2005) Simian
immunodeficiency virus infection in free-ranging sooty mangabeys (Cercocebus atys atys) from
the Tai Forest, Cote d'Ivoire: implications for the origin of epidemic human immunodeficiency
virus type 2. J Virol 79: 12515-12527.
14. Martinez-Steele E, Awasana AA, Corrah T, Sabally S, van der Sande M, Jaye A, et al. (2007) Is HIV-
2- induced AIDS different from HIV-1-associated AIDS? Data from a West African clinic. AIDS
21: 317-324.
15. Ariyoshi K, Jaffar S, Alabi AS, Berry N, Schim van der Loeff M, Sabally S, et al. (2000) Plasma
RNA viral load predicts the rate of CD4 T cell decline and death in HIV-2-infected patients in
West Africa. AIDS 14: 339-344.
16. O'Donovan D, Ariyoshi K, Milligan P, Ota M, Yamuah L, Sarge-Njie R, et al. (2000) Maternal
plasma viral RNA levels determine marked differences in mother-to-child transmission rates of
HIV-1 and HIV-2 in The Gambia. MRC/Gambia Government/University College London
Medical School working group on mother-child transmission of HIV. AIDS 14: 441-448.
17. Sierra S, Kupfer B, Kaiser R (2005) Basics of the virology of HIV-1 and its replication. J Clin Virol
34: 233-244.
18. Deng H, Liu R, Ellmeier W, Choe S, Unutmaz D, Burkhart M, et al. (1996) Identification of a major
co-receptor for primary isolates of HIV-1. Nature 381: 661-666.
19. Balter M (1996) A second coreceptor for HIV in early stages of infection. Science 272: 1740.
20. Eckert DM, Kim PS (2001) Mechanisms of viral membrane fusion and its inhibition. Annu Rev
Biochem 70: 777-810.
21. Oelrichs MS-XaR (2009) Basic HIV virology; Hoy J LS, Post J, Street A, editor: Darlinghurst:
Australasian Society for HIV Medicine.
22. Morison L (2001) The global epidemiology of HIV/AIDS. Br Med Bull 58: 7-18.

110
23. Patel P, Borkowf CB, Brooks JT, Lasry A, Lansky A, Mermin J (2014) Estimating per-act HIV
transmission risk: a systematic review. AIDS 28: 1509-1519.
24. Foss A. Watts C. Vickerman P. ea (2004) Are people using condoms: current evidence from sub-
Saharan Africa and Asia. Reprodutive Health Matters 12: 176-177.
25. Delves PJ, Roitt IM (2000) The immune system. First of two parts. N Engl J Med 343: 37-49.
26. Center ANR (2014) Guide for HIV/AIDS Clinical Care. HIV Classification: CDC and WHO Staging
Systems. AETC National Resource Center.
27. Weller S.C. D-BK (2002) Condom Effectiveness in reducing heterosexual HIV transmission
(Review). Cochrane Database Syst Rev: CD003255.
28. Auvert B, Taljaard D, Lagarde E, Sobngwi-Tambekou J, Sitta R, Puren A (2005) Randomized,
controlled intervention trial of male circumcision for reduction of HIV infection risk: the ANRS
1265 Trial. PLoS Med 2: e298.
29. Abdool Karim Q, Abdool Karim SS, Frohlich JA, Grobler AC, Baxter C, Mansoor LE, et al. (2010)
Effectiveness and safety of tenofovir gel, an antiretroviral microbicide, for the prevention of HIV
infection in women. Science 329: 1168-1174.
30. Network HPT (2015) HPTN 067: The ADAPT Study: A Phase II, Randomized, Open-Label,
Pharmacokinetic and Behavioral Study of the Use of Intermittent Oral Emtricitabine/Tenofovir
Disoproxil Fumarate Pre-Exposure Prophylaxis (PrEP).
31. Anderson PL, Glidden DV, Liu A, Buchbinder S, Lama JR, Guanira JV, et al. (2012) Emtricitabine-
tenofovir concentrations and pre-exposure prophylaxis efficacy in men who have sex with men.
Sci Transl Med 4: 151ra125.
32. Murnane PM, Celum C, Mugo N, Campbell JD, Donnell D, Bukusi E, et al. (2013) Efficacy of
preexposure prophylaxis for HIV-1 prevention among high-risk heterosexuals: subgroup analyses
from a randomized trial. AIDS 27: 2155-2160.
33. Donnell D, Baeten JM, Bumpus NN, Brantley J, Bangsberg DR, Haberer JE, et al. (2014) HIV
protective efficacy and correlates of tenofovir blood concentrations in a clinical trial of PrEP for
HIV prevention. J Acquir Immune Defic Syndr 66: 340-348.
34. Nel A, Haazen W, Nuttall J, Romano J, Rosenberg Z, van Niekerk N (2014) A safety and
pharmacokinetic trial assessing delivery of dapivirine from a vaginal ring in healthy women.
AIDS 28: 1479-1487.
35. Akil A, Agashe H, Dezzutti CS, Moncla BJ, Hillier SL, Devlin B, et al. (2015) Formulation and
Characterization of Polymeric Films Containing Combinations of Antiretrovirals (ARVs) for HIV
Prevention. Pharm Res 32: 458-468.
36. Andrews CD, Spreen WR, Mohri H, Moss L, Ford S, Gettie A, et al. (2014) Long-acting integrase
inhibitor protects macaques from intrarectal simian/human immunodeficiency virus. Science 343:
1151-1154.
37. Spreen W, Williams P, Margolis D, Ford SL, Crauwels H, Lou Y, et al. (2014) Pharmacokinetics,
safety, and tolerability with repeat doses of GSK1265744 and rilpivirine (TMC278) long-acting
nanosuspensions in healthy adults. J Acquir Immune Defic Syndr 67: 487-492.
38. Administration USFaD FDA approves first drug for reducing the risk of sexually acquired HIV
infection. 16 July 2012.
39. CONRAD FACTS 001 Results Presented at CROI 2015: HIV prevention study does not confirm
pericoital tenofovir gel effectiveness: protection observed in small group of women who used the
product consistently.
40. HIVandHepatitis.com CROI 2015: On-Demand PrEP Prevents 86% of HIV Infections in Ipergay.
41. Grant RM, Anderson PL, McMahan V, Liu A, Amico KR, Mehrotra M, et al. (2014) Uptake of pre-
exposure prophylaxis, sexual practices, and HIV incidence in men and transgender women who
have sex with men: a cohort study. Lancet Infect Dis 14: 820-829.
42. van der Straten A, Van Damme L, Haberer JE, Bangsberg DR (2012) Unraveling the divergent results
of pre-exposure prophylaxis trials for HIV prevention. AIDS 26: F13-19.
111
43. Shen Z, Fahey JV, Bodwell JE, Rodriguez-Garcia M, Kashuba AD, Wira CR (2014) Sex hormones
regulate tenofovir-diphosphate in female reproductive tract cells in culture. PLoS One 9:
e100863.
44. Network HPT HPTN 069: A Phase II Randomized, Double-Blind, Study of the Safety and
Tolerability of Maraviroc (MVC), Maraviroc + Emtricitabine (MVC + FTV), Maraviroc +
Tenofovir disoproxil fumarate (MVC+TDF), or Tenofovir disoproxil fumarate + Emtricitabine
(TDF+FTC) for Pre-Exposure Prophylaxis (PrEP) to Prevent HIV Transmission in At-Risk Men
Who Have Sex with Men and in At-Risk Women.
45. Network MT ASPIRE Phase III trial of a vaginal ring for HIV prevention completes enrollment of
2,629 women.
46. Microbicides IPF Two Studies Advance HIV Prevention Options for Women.
47. Krakower DS, Jain S, Mayer KH (2015) Antiretrovirals for Primary HIV Prevention: the Current
Status of Pre- and Post-exposure Prophylaxis. Curr HIV/AIDS Rep.
48. Dolgin E (2014) Long-acting HIV drugs advanced to overcome adherence challenge. Nat Med 20:
323-324.
49. Kim JH, Excler JL, Michael NL (2015) Lessons from the RV144 Thai phase III HIV-1 vaccine trial
and the search for correlates of protection. Annu Rev Med 66: 423-437.
50. Rerks-Ngarm S, Pitisuttithum P, Nitayaphan S, Kaewkungwal J, Chiu J, Paris R, et al. (2009)
Vaccination with ALVAC and AIDSVAX to prevent HIV-1 infection in Thailand. N Engl J Med
361: 2209-2220.
51. Rolland M, Edlefsen PT, Larsen BB, Tovanabutra S, Sanders-Buell E, Hertz T, et al. (2012) Increased
HIV-1 vaccine efficacy against viruses with genetic signatures in Env V2. Nature 490: 417-420.
52. Giorgi JV, Hultin LE, McKeating JA, Johnson TD, Owens B, Jacobson LP, et al. (1999) Shorter
survival in advanced human immunodeficiency virus type 1 infection is more closely associated
with T lymphocyte activation than with plasma virus burden or virus chemokine coreceptor
usage. J Infect Dis 179: 859-870.
53. Peterman TA, Newman DR, Maddox L, Schmitt K, Shiver S (2015) Risk for HIV following a
diagnosis of syphilis, gonorrhoea or chlamydia: 328,456 women in Florida, 2000-2011. Int J STD
AIDS 26: 113-119.
54. Masson L, Mlisana K, Little F, Werner L, Mkhize NN, Ronacher K, et al. (2014) Defining genital
tract cytokine signatures of sexually transmitted infections and bacterial vaginosis in women at
high risk of HIV infection: a cross-sectional study. Sex Transm Infect 90: 580-587.
55. Des Jarlais DC, Arasteh K, McKnight C, Perlman DC, Feelemyer J, Hagan H, et al. (2014) HSV-2 co-
infection as a driver of HIV transmission among heterosexual non-injecting drug users in New
York City. PLoS One 9: e87993.
56. Ghebremichael M, Habtzgi D, Paintsil E (2012) Deciphering the epidemic synergy of herpes simplex
virus type 2 (HSV-2) on human immunodeficiency virus type 1 (HIV-1) infection among women
in sub-Saharan Africa. BMC Res Notes 5: 451.
57. Shishana O RT, Simbayi LC, Zuma K, Jooste S, Zungu N, Labadarios D, Onoya D, et al. (2012)
South African national HIV prevalence, incidence and behaviour survey.
58. Naranbhai V, Abdool Karim SS, Altfeld M, Samsunder N, Durgiah R, Sibeko S, et al. (2012) Innate
immune activation enhances hiv acquisition in women, diminishing the effectiveness of tenofovir
microbicide gel. J Infect Dis 206: 993-1001.
59. UNAIDS (2012) Women Out Loud: How Women Living with HIV Will Help the World End AIDS.
60. UNAIDS (2013) UNAIDS Report on the Global AIDS Epidemic 2013.
61. Society CA (2012) Women's Biological Susceptibility to HIV.
62. Mitchell C, Marrazzo J (2014) Bacterial vaginosis and the cervicovaginal immune response. Am J
Reprod Immunol 71: 555-563.
63. Mingjia L, Short R (2002) How oestrogen or progesterone might change a woman's susceptibility to
HIV-1 infection. Aust N Z J Obstet Gynaecol 42: 472-475.
112
64. Morrison C, Fichorova RN, Mauck C, Chen PL, Kwok C, Chipato T, et al. (2014) Cervical
inflammation and immunity associated with hormonal contraception, pregnancy, and HIV-1
seroconversion. J Acquir Immune Defic Syndr 66: 109-117.
65. Yi TJ, Shannon B, Prodger J, McKinnon L, Kaul R (2013) Genital immunology and HIV
susceptibility in young women. Am J Reprod Immunol 69 Suppl 1: 74-79.
66. Hickey DK, Patel MV, Fahey JV, Wira CR (2011) Innate and adaptive immunity at mucosal surfaces
of the female reproductive tract: stratification and integration of immune protection against the
transmission of sexually transmitted infections. J Reprod Immunol 88: 185-194.
67. Cole AM (2015) HIV-Enhancing Factors are Secreted by Reproductive Epithelia Upon Inoculation
with Bacterial Vaginosis-Associated Bacteria. Protein Pept Lett.
68. Doerflinger SY, Throop AL, Herbst-Kralovetz MM (2014) Bacteria in the vaginal microbiome alter
the innate immune response and barrier properties of the human vaginal epithelia in a species-
specific manner. J Infect Dis 209: 1989-1999.
69. Wira CR, Rodriguez-Garcia M, Patel MV (2015) The role of sex hormones in immune protection of
the female reproductive tract. Nat Rev Immunol.
70. Mselle TF, Meadows SK, Eriksson M, Smith JM, Shen L, Wira CR, et al. (2007) Unique
characteristics of NK cells throughout the human female reproductive tract. Clin Immunol 124:
69-76.
71. Shapiro L, Pott GB, Ralston AH (2001) Alpha-1-antitrypsin inhibits human immunodeficiency virus
type 1. FASEB J 15: 115-122.
72. Iqbal SM, Ball TB, Levinson P, Maranan L, Jaoko W, Wachihi C, et al. (2009) Elevated
elafin/trappin-2 in the female genital tract is associated with protection against HIV acquisition.
AIDS 23: 1669-1677.
73. Broliden K, Hinkula J, Devito C, Kiama P, Kimani J, Trabbatoni D, et al. (2001) Functional HIV-1
specific IgA antibodies in HIV-1 exposed, persistently IgG seronegative female sex workers.
Immunol Lett 79: 29-36.
74. Bristow CL, Mercatante DR, Kole R (2003) HIV-1 preferentially binds receptors copatched with cell-
surface elastase. Blood 102: 4479-4486.
75. Hirbod T, Kong X, Kigozi G, Ndyanabo A, Serwadda D, Prodger JL, et al. (2014) HIV Acquisition Is
Associated with Increased Antimicrobial Peptides and Reduced HIV Neutralizing IgA in the
Foreskin Prepuce of Uncircumcised Men. PLoS Pathog 10: e1004416.
76. Levinson P, Kaul R, Kimani J, Ngugi E, Moses S, MacDonald KS, et al. (2009) Levels of innate
immune factors in genital fluids: association of alpha defensins and LL-37 with genital infections
and increased HIV acquisition. AIDS 23: 309-317.
77. Burgener A, Rahman S, Ahmad R, Lajoie J, Ramdahin S, Mesa C, et al. (2011) Comprehensive
proteomic study identifies serpin and cystatin antiproteases as novel correlates of HIV-1
resistance in the cervicovaginal mucosa of female sex workers. J Proteome Res 10: 5139-5149.
78. Mihm M, Gangooly S, Muttukrishna S (2011) The normal menstrual cycle in women. Anim Reprod
Sci 124: 229-236.
79. Goode D, Aravantinou M, Jarl S, Truong R, Derby N, Guerra-Perez N, et al. (2014) Sex hormones
selectively impact the endocervical mucosal microenvironment: implications for HIV
transmission. PLoS One 9: e97767.
80. Wira CR, Fahey JV, Rodriguez-Garcia M, Shen Z, Patel MV (2014) Regulation of mucosal immunity
in the female reproductive tract: the role of sex hormones in immune protection against sexually
transmitted pathogens. Am J Reprod Immunol 72: 236-258.
81. Northern AL, Rutter SM, Peterson CM (1994) Cyclic changes in the concentrations of peripheral
blood immune cells during the normal menstrual cycle. Proc Soc Exp Biol Med 207: 81-88.
82. Carias AM, McCoombe S, McRaven M, Anderson M, Galloway N, Vandergrift N, et al. (2013)
Defining the interaction of HIV-1 with the mucosal barriers of the female reproductive tract. J
Virol 87: 11388-11400.

113
83. Rahman S, Rabbani R, Wachihi C, Kimani J, Plummer FA, Ball TB, et al. (2013) Mucosal serpin A1
and A3 levels in HIV highly exposed sero-negative women are affected by the menstrual cycle
and hormonal contraceptives but are independent of epidemiological confounders. Am J Reprod
Immunol 69: 64-72.
84. Wira CR, Fahey JV (2008) A new strategy to understand how HIV infects women: identification of a
window of vulnerability during the menstrual cycle. AIDS 22: 1909-1917.
85. Wira CR, Patel MV, Ghosh M, Mukura L, Fahey JV (2011) Innate immunity in the human female
reproductive tract: endocrine regulation of endogenous antimicrobial protection against HIV and
other sexually transmitted infections. Am J Reprod Immunol 65: 196-211.
86. Vishwanathan SA, Guenthner PC, Lin CY, Dobard C, Sharma S, Adams DR, et al. (2011) High
susceptibility to repeated, low-dose, vaginal SHIV exposure late in the luteal phase of the
menstrual cycle of pigtail macaques. J Acquir Immune Defic Syndr 57: 261-264.
87. Kersh EN, Henning T, Vishwanathan SA, Morris M, Butler K, Adams DR, et al. (2014) SHIV
susceptibility changes during the menstrual cycle of pigtail macaques. J Med Primatol 43: 310-
316.
88. Saba E, Origoni M, Taccagni G, Ferrari D, Doglioni C, Nava A, et al. (2013) Productive HIV-1
infection of human cervical tissue ex vivo is associated with the secretory phase of the menstrual
cycle. Mucosal Immunol 6: 1081-1090.
89. Smith SM, Mefford M, Sodora D, Klase Z, Singh M, Alexander N, et al. (2004) Topical estrogen
protects against SIV vaginal transmission without evidence of systemic effect. AIDS 18: 1637-
1643.
90. Marx PA, Spira AI, Gettie A, Dailey PJ, Veazey RS, Lackner AA, et al. (1996) Progesterone implants
enhance SIV vaginal transmission and early virus load. Nat Med 2: 1084-1089.
91. Dietz Ostergaard S, Butler K, Ritter JM, Johnson R, Sanders J, Powell N, et al. (2015) A combined
oral contraceptive affects mucosal SHIV susceptibility factors in a pigtail macaque (Macaca
nemestrina) model. J Med Primatol 44: 97-107.
92. Bahamondes MV, Castro S, Marchi NM, Marcovici M, Andrade LA, Fernandes A, et al. (2014)
Human vaginal histology in long-term users of the injectable contraceptive depot-
medroxyprogesterone acetate. Contraception 90: 117-122.
93. Mauck CK, Callahan MM, Baker J, Arbogast K, Veazey R, Stock R, et al. (1999) The effect of one
injection of Depo-Provera on the human vaginal epithelium and cervical ectopy. Contraception
60: 15-24.
94. Miller L, Patton DL, Meier A, Thwin SS, Hooton TM, Eschenbach DA (2000)
Depomedroxyprogesterone-induced hypoestrogenism and changes in vaginal flora and
epithelium. Obstet Gynecol 96: 431-439.
95. Tjernlund A, Carias AM, Andersson S, Gustafsson-Sanchez S, Rohl M, Petersson P, et al. (2015)
Progesterone-Based Intrauterine Device Use Is Associated with a Thinner Apical Layer of the
Human Ectocervical Epithelium and a Lower ZO-1 mRNA Expression. Biol Reprod 92: 68.
96. Butler AR, Smith JA, Polis CB, Gregson S, Stanton D, Hallett TB (2013) Modelling the global
competing risks of a potential interaction between injectable hormonal contraception and HIV
risk. AIDS 27: 105-113.
97. John Stanback AKM, Martha Bekiita (2007) Contraceptive injections by community health workers
in Uganda: a nonrandomized trial. Bulletin of the World Health Organization 85: 733-820.
98. Irvin SC, Herold BC (2015) Molecular mechanisms linking high dose medroxyprogesterone with
HIV-1 risk. PLoS One 10: e0121135.
99. Venkatesh KK, Cu-Uvin S (2014) Anatomic and hormonal changes in the female reproductive tract
immune environment during the life cycle: implications for HIV/STI prevention research. Am J
Reprod Immunol 71: 495-504.
100. Polis CB, Phillips SJ, Curtis KM, Westreich DJ, Steyn PS, Raymond E, et al. (2014) Hormonal
contraceptive methods and risk of HIV acquisition in women: a systematic review of
epidemiological evidence. Contraception 90: 360-390.

114
101. Morrison CS, Chen PL, Kwok C, Baeten JM, Brown J, Crook AM, et al. (2015) Hormonal
Contraception and the Risk of HIV Acquisition: An Individual Participant Data Meta-analysis.
PLoS Med 12: e1001778.
102. Ralph LJ, McCoy SI, Shiu K, Padian NS (2015) Hormonal contraceptive use and women's risk of
HIV acquisition: a meta-analysis of observational studies. Lancet Infect Dis.
103. Heffron R, Donnell D, Rees H, Celum C, Mugo N, Were E, et al. (2012) Use of hormonal
contraceptives and risk of HIV-1 transmission: a prospective cohort study. Lancet Infect Dis 12:
19-26.
104. Helen Rees EC (2014) DMPA and HIV: why we need a trial. Contraception 90: 354-356.
105. Saba E, Origoni M, Taccagni G, Ferrari D, Doglioni C, Nava A, et al. (2013) Productive HIV-1
infection of human cervical tissue ex vivo is associated with the secretory phase of the menstrual
cycle. Mucosal Immunol.
106. Burgener A, Tjernlund A, Kaldensjo T, Abou M, McCorrister S, Westmacott GR, et al. (2013) A
systems biology examination of the human female genital tract shows compartmentalization of
immune factor expression. J Virol 87: 5141-5150.
107. Birse KM, Burgener A, Westmacott GR, McCorrister S, Novak RM, Ball TB (2013) Unbiased
proteomics analysis demonstrates significant variability in mucosal immune factor expression
depending on the site and method of collection. PLoS One 8: e79505.
108. Wisniewski JR, Zougman A, Nagaraj N, Mann M (2009) Universal sample preparation method for
proteome analysis. Nat Methods 6: 359-362.
109. Bateman AR, El-Hachem N, Beck AH, Aerts HJ, Haibe-Kains B (2014) Importance of collection in
gene set enrichment analysis of drug response in cancer cell lines. Sci Rep 4: 4092.
110. Meissner F, Mann M (2014) Quantitative shotgun proteomics: considerations for a high-quality
workflow in immunology. Nat Immunol 15: 112-117.
111. Van Steendam K, De Ceuleneer M, Dhaenens M, Van Hoofstat D, Deforce D (2013) Mass
spectrometry-based proteomics as a tool to identify biological matrices in forensic science. Int J
Legal Med 127: 287-298.
112. Rodrigues RG, Panizo-Santos A, Cashel JA, Krutzsch HC, Merino MJ, Roberts DD (2001)
Semenogelins are ectopically expressed in small cell lung carcinoma. Clin Cancer Res 7: 854-
860.
113. Hartlieb E, Kempf B, Partilla M, Vigh B, Spindler V, Waschke J (2013) Desmoglein 2 is less
important than desmoglein 3 for keratinocyte cohesion. PLoS One 8: e53739.
114. Contzler R, Favre B, Huber M, Hohl D (2005) Cornulin, a new member of the "fused gene" family,
is expressed during epidermal differentiation. J Invest Dermatol 124: 990-997.
115. Brocklehurst K, Philpott MP (2013) Cysteine proteases: mode of action and role in epidermal
differentiation. Cell Tissue Res 351: 237-244.
116. de Koning HD, van den Bogaard EH, Bergboer JG, Kamsteeg M, van Vlijmen-Willems IM, Hitomi
K, et al. (2012) Expression profile of cornified envelope structural proteins and keratinocyte
differentiation-regulating proteins during skin barrier repair. Br J Dermatol 166: 1245-1254.
117. Fadini GP, Albiero M, Millioni R, Poncina N, Rigato M, Scotton R, et al. (2014) The molecular
signature of impaired diabetic wound healing identifies serpinB3 as a healing biomarker.
Diabetologia 57: 1947-1956.
118. Guttman O, Baranovski BM, Schuster R, Kaner Z, Freixo-Lima GS, Bahar N, et al. (2015) Acute-
phase protein alpha1-anti-trypsin: diverting injurious innate and adaptive immune responses from
non-authentic threats. Clin Exp Immunol 179: 161-172.
119. Aboud L, Ball TB, Tjernlund A, Burgener A (2014) The role of serpin and cystatin antiproteases in
mucosal innate immunity and their defense against HIV. Am J Reprod Immunol 71: 12-23.
120. Wang C, Morley SC, Donermeyer D, Peng I, Lee WP, Devoss J, et al. (2010) Actin-bundling protein
L-plastin regulates T cell activation. J Immunol 185: 7487-7497.
121. Foell D, Wittkowski H, Roth J (2007) Mechanisms of disease: a 'DAMP' view of inflammatory
arthritis. Nat Clin Pract Rheumatol 3: 382-390.

115
122. Luo J, Xu T, Li C, Ba X, Wang X, Jiang Y, et al. (2013) p85-RhoGDI2, a novel complex, is required
for PSGL-1-induced beta1 integrin-mediated lymphocyte adhesion to VCAM-1. Int J Biochem
Cell Biol 45: 2764-2773.
123. Collin C, Ouhayoun JP, Grund C, Franke WW (1992) Suprabasal marker proteins distinguishing
keratinizing squamous epithelia: cytokeratin 2 polypeptides of oral masticatory epithelium and
epidermis are different. Differentiation 51: 137-148.
124. Nelson ML, Levy SB (2011) The history of the tetracyclines. Ann N Y Acad Sci 1241: 17-32.
125. Dervisoglu E, Dundar DO, Yegenaga I, Willke A (2008) Peritonitis due to Pseudomonas putida in a
patient receiving automated peritoneal dialysis. Infection 36: 379-380.
126. Kenyon CR, Osbak K (2014) Recent progress in understanding the epidemiology of bacterial
vaginosis. Curr Opin Obstet Gynecol 26: 448-454.
127. Mannan T, Jing S, Foroushania SH, Fortune F, Wan H (2011) RNAi-mediated inhibition of the
desmosomal cadherin (desmoglein 3) impairs epithelial cell proliferation. Cell Prolif 44: 301-310.
128. Presland RB, Dale BA (2000) Epithelial structural proteins of the skin and oral cavity: function in
health and disease. Crit Rev Oral Biol Med 11: 383-408.
129. Hillier SL, Moench T, Shattock R, Black R, Reichelderfer P, Veronese F (2005) In vitro and in vivo:
the story of nonoxynol 9. J Acquir Immune Defic Syndr 39: 1-8.
130. Bermudez-Humaran LG, Motta JP, Aubry C, Kharrat P, Rous-Martin L, Sallenave JM, et al. (2015)
Serine protease inhibitors protect better than IL-10 and TGF-beta anti-inflammatory cytokines
against mouse colitis when delivered by recombinant lactococci. Microb Cell Fact 14: 26.
131. Burgener A, Boutilier J, Wachihi C, Kimani J, Carpenter M, Westmacott G, et al. (2008)
Identification of differentially expressed proteins in the cervical mucosa of HIV-1-resistant sex
workers. J Proteome Res 7: 4446-4454.
132. Smith SM, Baskin GB, Marx PA (2000) Estrogen protects against vaginal transmission of simian
immunodeficiency virus. J Infect Dis 182: 708-715.
133. McKinnon LR, Kaul R (2012) Quality and quantity: mucosal CD4+ T cells and HIV susceptibility.
Curr Opin HIV AIDS 7: 195-202.
134. Kaul R, Prodger J, Joag V, Shannon B, Yegorov S, Galiwango R, et al. (2015) Inflammation and
HIV Transmission in Sub-Saharan Africa. Curr HIV/AIDS Rep 12: 216-222.
135. Berbic M, Ng CH, Fraser IS (2014) Inflammation and endometrial bleeding. Climacteric: 1-7.
136. Starkey PM, Clover LM, Rees MC (1991) Variation during the menstrual cycle of immune cell
populations in human endometrium. Eur J Obstet Gynecol Reprod Biol 39: 203-207.
137. Salamonsen LA, Zhang J, Brasted M (2002) Leukocyte networks and human endometrial
remodelling. J Reprod Immunol 57: 95-108.
138. Anderson WA, Desombre ER, Kang YH (1977) Estrogen-progesterone antagonism with respect to
specific marker protein synthesis and growth by the uterine endometrium. Biol Reprod 16: 409-
419.
139. Hassouna A, Obaia E, Marzouk S, Rateb M, Haidara M (2014) The role of sex hormones in induced-
systemic inflammation in female albino rats. Acta Physiol Hung 101: 112-127.
140. Sunday L, Tran MM, Krause DN, Duckles SP (2006) Estrogen and progestagens differentially
modulate vascular proinflammatory factors. Am J Physiol Endocrinol Metab 291: E261-267.
141. Gillgrass AE, Fernandez SA, Rosenthal KL, Kaushic C (2005) Estradiol regulates susceptibility
following primary exposure to genital herpes simplex virus type 2, while progesterone induces
inflammation. J Virol 79: 3107-3116.
142. Tjernlund A, Carias AM, Andersson S, Gustafsson-Sanchez S, Rohl M, Petersson P, et al. (2015)
Progesterone-Based Intrauterine Device Use Is Associated with a Thinner Apical Layer of the
Human Ectocervical Epithelium and a Lower ZO-1 mRNA Expression. Biol Reprod.
143. Arnold KB, Burgener A, Birse K, Romas L, Dunphy LJ, Shahabi K, et al. (2015) Increased levels of
inflammatory cytokines in the female reproductive tract are associated with altered expression of
proteases, mucosal barrier proteins, and an influx of HIV-susceptible target cells. Mucosal
Immunol.
116
144. Parkhurst MR, Saltzman WM (1994) Leukocytes migrate through three-dimensional gels of
midcycle cervical mucus. Cell Immunol 156: 77-94.
145. Anahtar MN, Byrne EH, Doherty KE, Bowman BA, Yamamoto HS, Soumillon M, et al. (2015)
Cervicovaginal bacteria are a major modulator of host inflammatory responses in the female
genital tract. Immunity 42: 965-976.
146. Bradshaw CS, Vodstrcil LA, Hocking JS, Law M, Pirotta M, Garland SM, et al. (2013) Recurrence
of bacterial vaginosis is significantly associated with posttreatment sexual activities and hormonal
contraceptive use. Clin Infect Dis 56: 777-786.
147. Wilson JD, Lee RA, Balen AH, Rutherford AJ (2007) Bacterial vaginal flora in relation to changing
oestrogen levels. Int J STD AIDS 18: 308-311.
148. Anderson DJ, Marathe J, Pudney J (2014) The structure of the human vaginal stratum corneum and
its role in immune defense. Am J Reprod Immunol 71: 618-623.
149. Polis CB, Curtis KM (2013) Use of hormonal contraceptives and HIV acquisition in women: a
systematic review of the epidemiological evidence. Lancet Infect Dis 13: 797-808.
150. Guthrie BL, Introini A, Roxby AC, Choi RY, Bosire R, Lohman-Payne B, et al. (2015) Depot
Medroxyprogesterone Acetate Use Is Associated With Elevated Innate Immune Effector
Molecules in Cervicovaginal Secretions of HIV-1-Uninfected Women. J Acquir Immune Defic
Syndr 69: 1-10.
151. Ferreira VH, Dizzell S, Nazli A, Kafka JK, Mueller K, Nguyen PV, et al. (2015)
Medroxyprogesterone Acetate Regulates HIV-1 Uptake and Transcytosis but Not Replication in
Primary Genital Epithelial Cells, Resulting in Enhanced T-Cell Infection. J Infect Dis 211: 1745-
1756.
152. Sciaranghella G, Wang C, Hu H, Anastos K, Merhi Z, Nowicki M, et al. (2015) CCR5 Expression
Levels in HIV-Uninfected Women Receiving Hormonal Contraception. J Infect Dis.
153. Mandell KJ, McCall IC, Parkos CA (2004) Involvement of the junctional adhesion molecule-1
(JAM1) homodimer interface in regulation of epithelial barrier function. J Biol Chem 279: 16254-
16262.
154. Braniste V, Leveque M, Buisson-Brenac C, Bueno L, Fioramonti J, Houdeau E (2009) Oestradiol
decreases colonic permeability through oestrogen receptor beta-mediated up-regulation of
occludin and junctional adhesion molecule-A in epithelial cells. J Physiol 587: 3317-3328.
155. Oertel M, Graness A, Thim L, Buhling F, Kalbacher H, Hoffmann W (2001) Trefoil factor family-
peptides promote migration of human bronchial epithelial cells: synergistic effect with epidermal
growth factor. Am J Respir Cell Mol Biol 25: 418-424.
156. Borthwick JM, Charnock-Jones DS, Tom BD, Hull ML, Teirney R, Phillips SC, et al. (2003)
Determination of the transcript profile of human endometrium. Mol Hum Reprod 9: 19-33.
157. Atrio J (2015) Accounting for anovulation and vaginal thinning during depot medroxyprogesterone
acetate use. J Infect Dis 211: 850.
158. Veisi F, Zangeneh M (2013) Comparison of Two Different Injectable Contraceptive Methods: Depo-
medroxy Progesterone Acetate (DMPA) and Cyclofem. J Family Reprod Health 7: 109-113.
159. Hapgood JP, Ray RM, Govender Y, Avenant C, Tomasicchio M (2014) Differential glucocorticoid
receptor-mediated effects on immunomodulatory gene expression by progestin contraceptives:
implications for HIV-1 pathogenesis. Am J Reprod Immunol 71: 505-512.
160. Stanczyk FZ, Hapgood JP, Winer S, Mishell DR, Jr. (2013) Progestogens used in postmenopausal
hormone therapy: differences in their pharmacological properties, intracellular actions, and
clinical effects. Endocr Rev 34: 171-208.
161. Chandra N, Thurman AR, Anderson S, Cunningham TD, Yousefieh N, Mauck C, et al. (2013) Depot
medroxyprogesterone acetate increases immune cell numbers and activation markers in human
vaginal mucosal tissues. AIDS Res Hum Retroviruses 29: 592-601.
162. Ngcapu S, Masson L, Sibeko S, Werner L, McKinnon LR, Mlisana K, et al. (2015) Lower
concentrations of chemotactic cytokines and soluble innate factors in the lower female genital
tract associated with the use of injectable hormonal contraceptive. J Reprod Immunol 110: 14-21.

117
163. Huijbregts RP, Helton ES, Michel KG, Sabbaj S, Richter HE, Goepfert PA, et al. (2013) Hormonal
contraception and HIV-1 infection: medroxyprogesterone acetate suppresses innate and adaptive
immune mechanisms. Endocrinology 154: 1282-1295.
164. Byrne EH, Anahtar M, Doherty K, Olson G, Bowman B, Padavattan N, et al. (2014) Injectable
Contraceptive Use Correlates with Increased HIV Target Cells at the Cervix in Young South
African Women. AIDS Res Hum Retroviruses 30 Suppl 1: A54-55.
165. Birse K, Arnold KB, Novak RM, McCorrister S, Shaw S, Westmacott GR, et al. (2015) Molecular
signatures of immune activation and epithelial barrier remodeling are enhanced during the luteal
phase of the menstrual cycle: implications for HIV susceptibility. J Virol.

118
Chapter 6. Appendices
6.1 List of Abbreviations
AIDS – Acquired Immunodeficiency Syndrome
ART – Antiretroviral Therapy
ASPIRE - A Study to Prevent Infection with a Ring for Extended Use
BCA – Bichinchonic Acid
BSA – Bovine Serum Albumin
CAPRISA – Centre for the AIDS Programme of Research in South Africa
CAT – Couples Against Transmission
CCR5 – C-C chemokine receptor type 5
CVL – Cervicovaginal Lavage
CXCR4 – C-X-C chemokine receptor type 4
DAVID – Database for Annotation, Visualization and Integrated Discovery
DC – Dendritic Cell
DMPA – Depot Medroxyprogesterone Acetate
FACTS – Follow-on African Consortium for Tenofovir Studies
FAME - Film Antiretroviral Microbicide Evaluation
FDA – Food and Drug Administration
FDR – False Discovery Rate
FGT – Female Genital Tract
FSH – Follicle-Stimulating Hormone
FTC – Emtricitabine
GSEA – Gene Set Enrichment Analysis
HIV – Human Immunodeficiency Virus
HVTN – HIV Vaccine Trials Network
IMMENSE – Immunology of Menses
IPERGAY – Intervention Préventive de l’Exposition aux Risques avec et pour les hommes GAYs
iPREX – Iniciativa Profilaxis Pre-Exposición
LASSO – Least Absolute shrinkage and selection operator
LC – Liquid Chromatography
LC-MS – Liquid Chromatography-Mass Spectrometry
LH – Luteinizing Hormone
LLOD – Lower Limit of Detection
LTQ – Linear Trap Quadrupole
LV – Latent Variable
LXR/RXR – Liver X Receptor/Retinoid X Receptor
MSM – Men who have Sex with Men
NES – Normalized Enrichment Score
NEXT-PrEP - Novel Exploration of Therapeutics for Pre-Exposure Prophylaxis
NHP – Non-Human Primate
NK – Natural Killer
PLSDA – Partial Least Squares Discriminant Analysis
PrEP – Pre-Exposure Prophylaxis
PROUD - Pre-exposure Option for reducing HIV in the UK: an open-label randomisation to immediate or
Deferred daily Truvada for HIV negative gay men
RT-PCR – Reverse-Transcription Polymerase Chain Reaction
Serpin – Serine Protease Inhibitor
SIV – Simian Immunodeficiency Virus
SLPI – Secretory Leukocyte Peptidase Inhibitor
STI – Sexually Transmitted Infection
UEB – Urea Exchange Buffer
WHO – World Health Organization

119
6.2 Gene Set Enrichment Analysis Results
6.2.1 Results from the Chicago Cohort
(A) Top gene sets enriched during the luteal phase
Gene Set Species Description Size NES NOM p-val
GSE22886 Human
Genes up-regulated in comparison of naive
CD4 T cells versus naive B cells. 7 1.57 0.011
GSE3982 Human
Genes up-regulated in comparison of
neutrophils versus basophils. 6 1.55 0.029
GSE1460 Human
Genes up-regulated in naive CD4 T cells
from cord blood versus thymic stromal cells 5 1.54 0.031
(B) Top gene sets enriched during the follicular phase.
Gene Set Species Description Size NES NOM p-val
GSE360 Human
Genes up-regulated in comparison of control
macrophages versus macrophages exposed to
L. major. 8 -1.87 0.000
SE9006 Human
Genes up-regulated in control PBMCs
compared to patients with type 1 diabetes at
the time of diagnosis. 9 -1.83 0.010
GSE9988* Human
Genes down-regulated in monocytes treated
with anti-TREM1 and LPS versus monocytes
treated with vehicle (control). 12 -1.76 0.008
GSE3982* Human
Genes up-regulated in comparison of
macrophages versus basophils. 6 -1.67 0.000
GSE13411 Human
Genes down-regulated in comparison of naive
B cells versus memory B cells. 6 -1.67 0.008
* Gene sets utilized in for multiple data sets that have multiple associations with our data set. Only the most
significantly enriched data set from each gene set is shown.

120
6.2.2 Results from the IMMENSE cohort
(A) Top gene sets enriched during the luteal phase.
Gene Set Species Description Size NES NOM p-val
GSE20151 Human Genes up-regulated in neutrophils infected
with a bacterium versus controls.
13 1.86 <0.001
GSE37416 Human Genes up-regulated in neutrophil controls
versus those treated with F. tularensis
vaccine.
22 1.85 <0.001
GSE7400 Human Genes up-regulated in PBMCs treated with
granulocyte-colony stimulating factor
versus untreated controls.
16 1.74 0.004
GSE22886 Human Genes up-regulated in naïve CD8 T cells
versus naïve B cells.
11 1.73 <0.001
GSE3982 Human Genes up-regulated in basophils versus
effector memory CD4 T cells.
14 1.71 0.018
GSE29618 Human Genes up-regulated in myeloid dendritic
cells (DCs) versus plasmacytoid DCs.
44 1.71 0.031
GSE12845* Human Genes down-regulated in IgD- peripheral
blood B cells versus dark zone germinal
center B cells.
10 1.69 0.029
GSE1460 Human Gene down-regulated in naïve CD4 T cells
from cord blood versus thymic stromal
cells.
15 1.68 <0.001
GSE2706 Human Genes up-regulated in unstimulated DCs
versus those stimulated with LPS.
8 1.67 0.01
(B) Top gene sets enriched during the follicular phase
Gene Set Species Description Size NES NOM p-val
GSE29618* Human Genes up-regulated in B cells versus
monocytes.
8 -1.85 <0.001
GSE3982* Human Genes up-regulated in B cells versus DCs. 9 -1.68 <0.001
GSE10325 Human Genes up-regulated in B cells versus myeloid
cells.
13 -1.64 0.018
GSE17974* Human Genes up-regulated in untreated CD4 T cells
versus those treated with IL4 and anti-IL12.
5 -1.63 0.03
GSE29618* Human Genes down-regulated in mDCs pre-
influenza vaccination versus post-
vaccination.
6 -1.62 <0.001

121
GSE22886 Human Genes up-regulated in memory IgG IgA B
cells versus memory IgM B cells.
11 -1.57 0.006
GSE13484 Human Genes down-regulated in unstimulated
PMBCs versus those stimulated with a
vaccine
10 -1.56 0.032
GSE13485 Human Genes down-regulated in unstimulated
PBMCs versus those 7 days post-
vaccination.
8 -1.54 0.02
* Gene sets utilized in for multiple data sets that have multiple associations with our data set. Only the most
significantly enriched data set from each gene set is shown.
6.2.3 Results from the CAT cohort.
(A) Top gene sets enriched in DMPA users.
Gene Set Species Description Size NES NOM p-val
GSE13411 Human Genes up-regulated in naïve B cells versus
IgM-memory B cells
5 1.99 <0.001
GSE9988 Human Genes down-regulated in monocytes treated
with 5000ng/mK LPS versus those treated
with 1ng/mL LPS.
6 1.58 0.028
GSE3982 Human Genes up-regulated in neutrophils versus
eosinophils.
7 1.50 0.07
GSE34205 Human Genes up-regulated in PBMC from infants
with acute RSV versus those infected with
acute influenza.
6 1.44 0.022
(B) Top gene sets enriched in non-hormonal contraceptive users.
Gene Set Species Description Size NES NOM p-val
GSE1460 Human Genes up-regulated in CD4 T cells from cord
blood versus those from adult blood.
7 -1.98 <0.001
GSE3982* Human Genes up-regulated in dendritic cells versus
NK cells.
16 -1.79 0.007
GSE360* Human Genes up-regulated in dendritic cells exposed
to L. donovani versus DCs exposed to B.
malayi.
12 -1.78 0.007
GSE7460 Human Genes up-regulated in conventional thymic T
cells versus thymic T regulatory cells.
11 -1.77 0.004
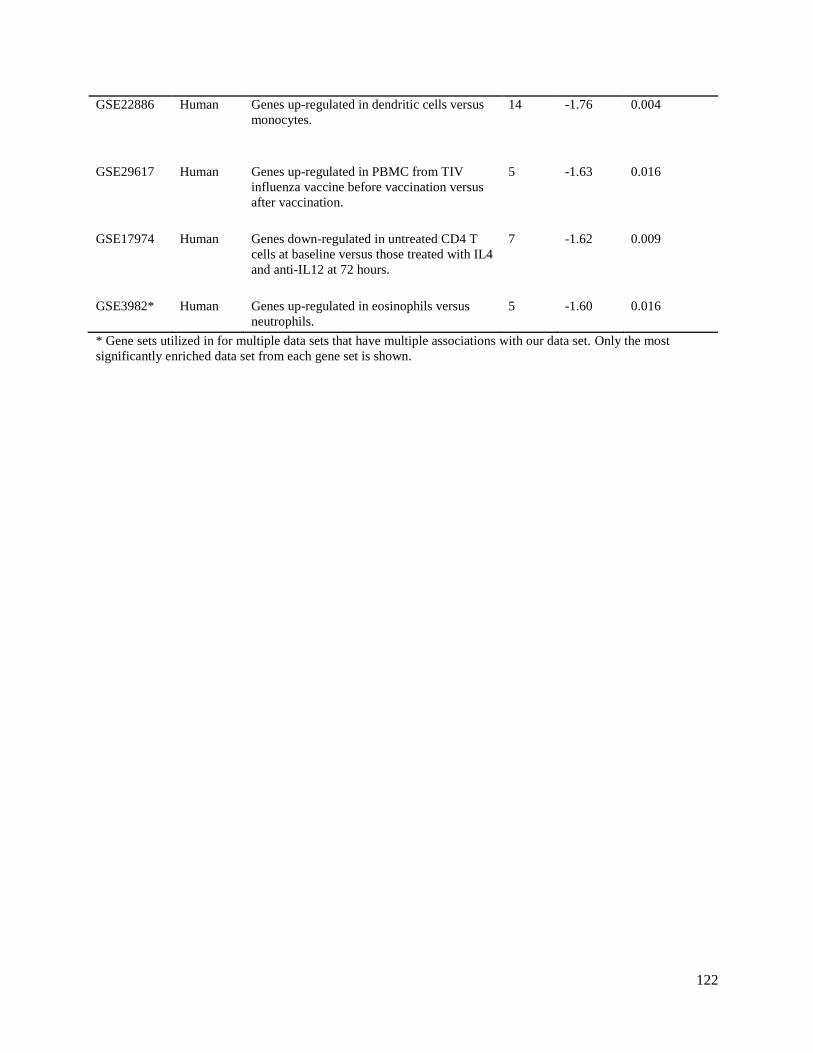
122
GSE22886 Human Genes up-regulated in dendritic cells versus
monocytes.
14 -1.76 0.004
GSE29617 Human Genes up-regulated in PBMC from TIV
influenza vaccine before vaccination versus
after vaccination.
5 -1.63 0.016
GSE17974 Human Genes down-regulated in untreated CD4 T
cells at baseline versus those treated with IL4
and anti-IL12 at 72 hours.
7 -1.62 0.009
GSE3982* Human Genes up-regulated in eosinophils versus
neutrophils.
5
-1.60 0.016
* Gene sets utilized in for multiple data sets that have multiple associations with our data set. Only the most
significantly enriched data set from each gene set is shown.

123
6.3 Endogenous hormone and mucosal factor spearman correlations
6.3.1 Pumwani Estradiol Correlates
Gene Name Protein Name Species R P-value Function
NEGATIVE CORRELATES
LRG1 Leucine-rich alpha-2
glycoprotein
Homo sapiens -0.40 0.0271 Angiogenesis
ACTN1 Alpha-actinin 1 Homo sapiens -0.37 0.0400 Actin crosslink
formation
POSITIVE CORRELATES
CDA Cytidine deaminase Homo sapiens 0.51 0.0037 Cytosine metabolism
RNASET2 Ribonuclease T2 Homo sapiens 0.49 0.0051 RNA catabolism
SCEL Sciellin Homo sapiens 0.45 0.0109 Epidermis
development
AHNAK Neuroblast differentiation-
associate protein AHNAK
Homo sapiens 0.43 0.0151 Structural elasticity
ldhA D-lactate dehydrogenase Lactobacillus
delbrueckii
0.43 0.0167 Metabolism
SPRR3 Small proline-rich protein 3 Homo sapiens 0.40 0.0243 Wound healing
TMPRSS11E Transmembrane protease
serine 11E
Homo sapiens 0.40 0.0259 Proteolysis
TXN Thioredoxin Homo sapiens 0.38 0.0334 Oxidation-reduction
CRISP3 Cystine-rich secretory
protein 3
Homo sapiens 0.38 0.0362 Defense response
CD59 CD59 glycoprotein Homo sapiens 0.37 0.0407 Inhibitor of the
complement
membrane attack
complex
ANXA2 Annexin A2 Homo sapiens 0.36 0.0476 Angiogenesis
LMNA Prelamin-A/C Homo sapiens 0.36 0.0478 Chromatin
organization
6.3.2 Pumwani Progesterone Correlates
Gene Name Protein Name Species R P-value Function
NEGATIVE CORRELATES
ORM1 Alpha-1-acid glycoprotein 1 Homo sapiens -0.48 0.0032 Acute phase reaction
modulation
KRT19 Keratin, type I cytoskeletal
19
Homo sapiens -0.41 0.0129 Structural
HPX Hemopexin Homo sapiens -0.38 0.0208 Transport, acute
phase response
ITIH2 Inter-alpha-trypsin inhibitor
heavy chain H@
Homo sapiens -0.37 0.0274 Protease inhibition
GSN Gelsolin Homo sapiens -0.36 0.029 Tissue regeneration
ALB Albumin Homo sapiens -0.36 0.0319 Acute phase reaction
modulation
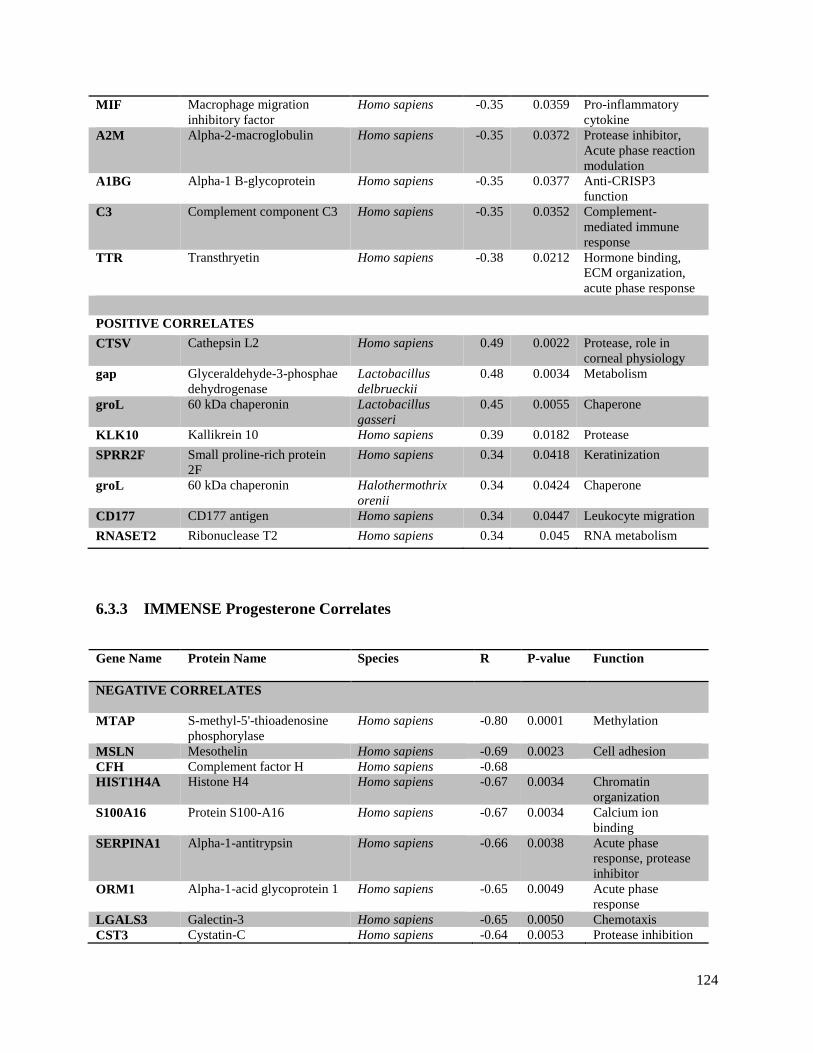
124
MIF Macrophage migration
inhibitory factor
Homo sapiens -0.35 0.0359 Pro-inflammatory
cytokine
A2M Alpha-2-macroglobulin Homo sapiens -0.35 0.0372 Protease inhibitor,
Acute phase reaction
modulation
A1BG Alpha-1 B-glycoprotein Homo sapiens -0.35 0.0377 Anti-CRISP3
function
C3 Complement component C3 Homo sapiens -0.35 0.0352 Complement-
mediated immune
response
TTR Transthryetin Homo sapiens -0.38 0.0212 Hormone binding,
ECM organization,
acute phase response
POSITIVE CORRELATES
CTSV Cathepsin L2 Homo sapiens 0.49 0.0022 Protease, role in
corneal physiology
gap Glyceraldehyde-3-phosphae
dehydrogenase
Lactobacillus
delbrueckii
0.48 0.0034 Metabolism
groL 60 kDa chaperonin Lactobacillus
gasseri
0.45 0.0055 Chaperone
KLK10 Kallikrein 10 Homo sapiens 0.39 0.0182 Protease
SPRR2F Small proline-rich protein
2F
Homo sapiens 0.34 0.0418 Keratinization
groL 60 kDa chaperonin Halothermothrix
orenii
0.34 0.0424 Chaperone
CD177 CD177 antigen Homo sapiens 0.34 0.0447 Leukocyte migration
RNASET2 Ribonuclease T2 Homo sapiens 0.34 0.045 RNA metabolism
6.3.3 IMMENSE Progesterone Correlates
Gene Name Protein Name Species R P-value Function
NEGATIVE CORRELATES
MTAP S-methyl-5'-thioadenosine
phosphorylase
Homo sapiens -0.80 0.0001 Methylation
MSLN Mesothelin Homo sapiens -0.69 0.0023 Cell adhesion
CFH Complement factor H Homo sapiens -0.68
HIST1H4A Histone H4 Homo sapiens -0.67 0.0034 Chromatin
organization
S100A16 Protein S100-A16 Homo sapiens -0.67 0.0034 Calcium ion
binding
SERPINA1 Alpha-1-antitrypsin Homo sapiens -0.66 0.0038 Acute phase
response, protease
inhibitor
ORM1 Alpha-1-acid glycoprotein 1 Homo sapiens -0.65 0.0049 Acute phase
response
LGALS3 Galectin-3 Homo sapiens -0.65 0.0050 Chemotaxis
CST3 Cystatin-C Homo sapiens -0.64 0.0053 Protease inhibition
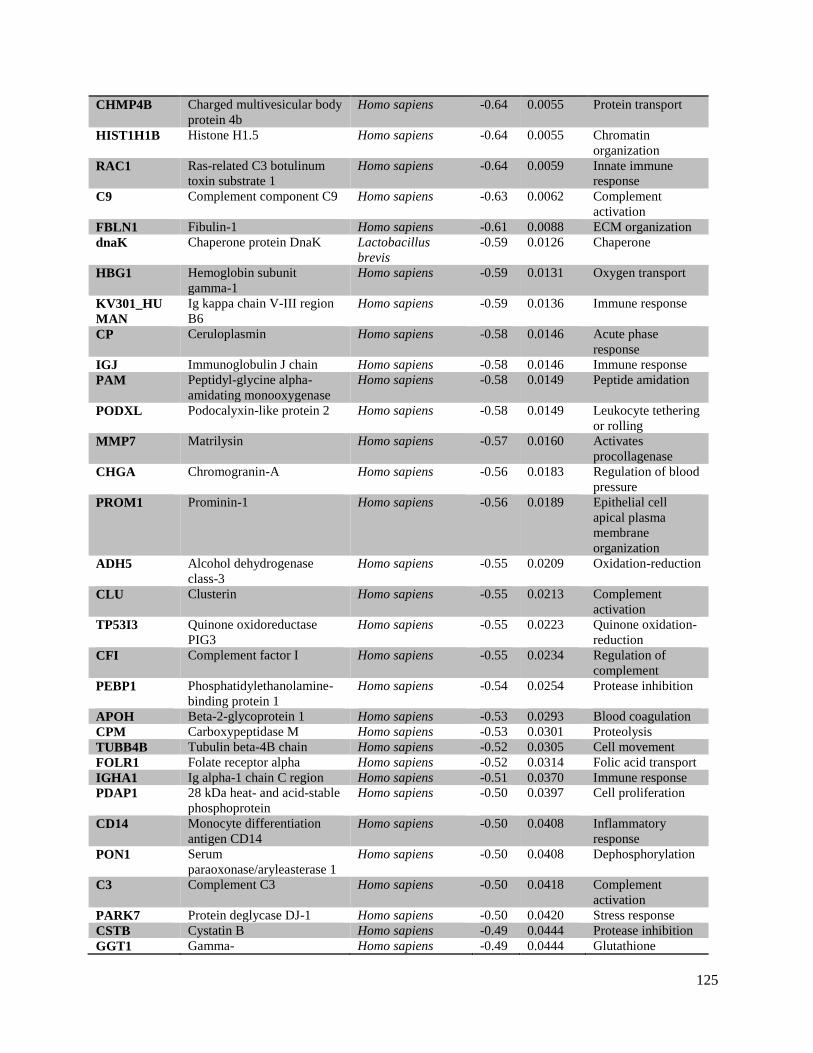
125
CHMP4B Charged multivesicular body
protein 4b
Homo sapiens -0.64 0.0055 Protein transport
HIST1H1B Histone H1.5 Homo sapiens -0.64 0.0055 Chromatin
organization
RAC1 Ras-related C3 botulinum
toxin substrate 1
Homo sapiens -0.64 0.0059 Innate immune
response
C9 Complement component C9 Homo sapiens -0.63 0.0062 Complement
activation
FBLN1 Fibulin-1 Homo sapiens -0.61 0.0088 ECM organization
dnaK Chaperone protein DnaK Lactobacillus
brevis
-0.59 0.0126 Chaperone
HBG1 Hemoglobin subunit
gamma-1
Homo sapiens -0.59 0.0131 Oxygen transport
KV301_HU
MAN
Ig kappa chain V-III region
B6
Homo sapiens -0.59 0.0136 Immune response
CP Ceruloplasmin Homo sapiens -0.58 0.0146 Acute phase
response
IGJ Immunoglobulin J chain Homo sapiens -0.58 0.0146 Immune response
PAM Peptidyl-glycine alpha-
amidating monooxygenase
Homo sapiens -0.58 0.0149 Peptide amidation
PODXL Podocalyxin-like protein 2 Homo sapiens -0.58 0.0149 Leukocyte tethering
or rolling
MMP7 Matrilysin Homo sapiens -0.57 0.0160 Activates
procollagenase
CHGA Chromogranin-A Homo sapiens -0.56 0.0183 Regulation of blood
pressure
PROM1 Prominin-1 Homo sapiens -0.56 0.0189 Epithelial cell
apical plasma
membrane
organization
ADH5 Alcohol dehydrogenase
class-3
Homo sapiens -0.55 0.0209 Oxidation-reduction
CLU Clusterin Homo sapiens -0.55 0.0213 Complement
activation
TP53I3 Quinone oxidoreductase
PIG3
Homo sapiens -0.55 0.0223 Quinone oxidation-
reduction
CFI Complement factor I Homo sapiens -0.55 0.0234 Regulation of
complement
PEBP1 Phosphatidylethanolamine-
binding protein 1
Homo sapiens -0.54 0.0254 Protease inhibition
APOH Beta-2-glycoprotein 1 Homo sapiens -0.53 0.0293 Blood coagulation
CPM Carboxypeptidase M Homo sapiens -0.53 0.0301 Proteolysis
TUBB4B Tubulin beta-4B chain Homo sapiens -0.52 0.0305 Cell movement
FOLR1 Folate receptor alpha Homo sapiens -0.52 0.0314 Folic acid transport
IGHA1 Ig alpha-1 chain C region Homo sapiens -0.51 0.0370 Immune response
PDAP1 28 kDa heat- and acid-stable
phosphoprotein
Homo sapiens -0.50 0.0397 Cell proliferation
CD14 Monocyte differentiation
antigen CD14
Homo sapiens -0.50 0.0408 Inflammatory
response
PON1 Serum
paraoxonase/aryleasterase 1
Homo sapiens -0.50 0.0408 Dephosphorylation
C3 Complement C3 Homo sapiens -0.50 0.0418 Complement
activation
PARK7 Protein deglycase DJ-1 Homo sapiens -0.50 0.0420 Stress response
CSTB Cystatin B Homo sapiens -0.49 0.0444 Protease inhibition
GGT1 Gamma- Homo sapiens -0.49 0.0444 Glutathione

126
glutamyltranspeptidase 1 biosynthesis
IGLL5 Immunoglobulin lambda-
like polypeptide 5
Homo sapiens -0.49 0.0450 Immune response
NT5E 5'-nucleotidase Homo sapiens -0.49 0.0450 Negative regulation
of inflammatory
response
tuf Elongation factor Tu Lactobacillus
plantarum
-0.49 0.0456 Protein biosynthesis
SERPING1 Plasma protease C1 inhibitor Homo sapiens -0.49 0.0462 Blood coagulation,
protease inhibition
LDHB L-lactate dehydrogenase B
chain
Homo sapiens -0.49 0.0475 Metabolism
C2 Complement C2 Homo sapiens -0.48 0.0488 Complement
activation
POSITIVE CORRELATES
LYZ Lysozyme C Homo sapiens 0.72 0.0011 Defense response
KRT14 Keratin, type I cytoskeletal
14
Homo sapiens 0.70 0.0019 Epidermis
development
PSMB8 Proteasome subunit beta
type-8
Homo sapiens 0.60
PRDX3 Thioredoxin-dependent
peroxide reductase,
mitochondrial
Homo sapiens 0.56 0.0193 Oxidation-
reduction
tuf Elongation factor Tu Lactobacillus
helveticus
0.56 0.0193 Protein biosynthesis
HMGB2 High mobility group protein
B2
Homo sapiens 0.55 0.0234 Chemotaxis
SPTA1 Spectrin alpha chain,
erythrocytic 1
Homo sapiens 0.54 0.0238 Actin filament
capping
tig Trigger factor Lactobacillus
helveticus
0.54 0.0262 Cell division
BASP1 Brain acid soluble protein 1 Homo sapiens 0.52 0.0334 Negative regulation
of transcription
PTPRC Protein tyrosine phosphatase
receptor type C-associated
protein
Homo sapiens 0.51 0.0386 Defense response
VCL Vinculin Homo sapiens 0.50 0.0397 Epithelial cell-cell
adhesion
DPYD Dihydropyrimidine
dehydrogenase [NADP+]
Homo sapiens 0.50 0.0420 Oxidation-
reduction
GSR Glutathione reductase,
mitochondrial
Homo sapiens 0.49 0.0469 Oxidation-
reduction
MVP Major vault protein Homo sapiens 0.49 0.0475 Protein transport
RAB1A Ras-related protein Rab-1A Homo sapiens 0.49 0.0482 Protien transport

127
6.3.4 IMMENSE Estradiol Correlates
Gene Name Protein Name Species R P-value Function
NEGATIVE CORRELATES
eno1 Enolase 1 Lactobacillus
gasseri
-0.77 0.0003 Glycolysis
C7 Complement component C7 Homo sapiens -0.72 0.0010 Complement
activation
dnaK Chaperone protein DnaK Lactobacillus
delbrueckii
-0.70 0.0018 Chaperone
tuf Elongation factor Tu Lactobacillus
plantarum
-0.70 0.0019 Protein biosynthesis
pgk Phosphoglycerate kinase Lactobacillus
delbrueckii
-0.69 0.0020 Glycolysis
eno Enolase Lactobacillus
delbrueckii
-0.68 0.0027 Glycolysis
ITIH2 Inter-alpha-trypsin inhibitor
heavy chain H2
Homo sapiens -0.67 0.0032 Protease inhibition
HBB Hemoglobin subunit beta Homo sapiens -0.67 0.0035 Oxygen transport
SERPINC1 Antithrombin-III Homo sapiens -0.66 0.0036 Blood coagulation,
protease inhibition
LUM Lumican Homo sapiens -0.65 0.0044 ECM organization
RBP4 Retinol-binding protein 4 Homo sapiens -0.65 0.0044 Binds transthyretin
PLG Plasminogen Homo sapiens -0.64 0.0059 Acute phase
response
APOA1 Apolipoprotein A-I Homo sapiens -0.63 0.0062 Sterol metabolism
HRG Histidine-rich glycoprotein Homo sapiens -0.63 0.0062 Blood coagulation
HP Haptoglobin Homo sapiens -0.63 0.0065 Acute phase
response
SERPINF2 Alpha-2-antiplasmin Homo sapiens -0.62 0.0079 Blood coagulation,
protease inhibition
AHSG Alpha-2-HS-glycoprotein Homo sapiens -0.62 0.0086 Acute phase
response
IGHA1 Ig alpha-1 chain C region Homo sapiens -0.61 0.0096 Immune response
GC Vitamin D-binding protein Homo sapiens -0.60 0.0104 Steroid metabolism
APOA2 Apolipoprotein A-II Homo sapiens -0.60 0.0108 Acute inflammatory
response
CD14 Monocyte differentiation
antigen CD14
Homo sapiens -0.59 0.0121 Inflammatory
response
FGA Fibrinogen alpha chain Homo sapiens -0.59 0.0130 Blood coagulation
dnaK Chaperone protein DnaK Lactobacillus
brevis
-0.58 0.0144 Chaperone
C4B Complement C4-B Homo sapiens -0.58 0.0150 Complement
activation
IGHM Ig mu chain C region Homo sapiens -0.57 0.0161 Immune response
MSLN Mesothelin Homo sapiens -0.56 0.0191 Cell adhesion
HBD Hemoglobin subunit delta Homo sapiens -0.56 0.0197 Oxygen transport
SERPIND1 Heparin cofactor 2 Homo sapiens -0.56 0.0204 Blood coagulation,
protease inhibition
ADIRF Apidogenesis regulatory
factor
Homo sapiens -0.54 0.0247 Differentiation
SERPING1 Plasma protease C1 inhibitor Homo sapiens -0.54 0.0247 Blood coagulation,

128
protease inhibition
AZGP1 Zinc-alpha-2-glycoprotein Homo sapiens -0.54 0.0255 Immune response
VTN Vitronectin Homo sapiens -0.54 0.0255 Cell adhesion
C9 Complement component C9 Homo sapiens -0.53 0.0271 Complement
activation
ORM1 Alpha-1-acid glycoprotein 1 Homo sapiens -0.53 0.0271 Acute phase
response
CFI Complement factor I Homo sapiens -0.53 0.0280 Complement
inhibition
KNG1 Kininogen-1 Homo sapiens -0.53 0.0289 Protease inhibition
gap Glyceraldehyde-3-phosphate
dehydrogenase
Streptomyces
aureofaciens
-0.53 0.0297 Glycolysis
HBA1 Hemoglobin subunit alpha Homo sapiens -0.51 0.0366 Oxygen transport
PPBP Platelet basic protein Homo sapiens -0.50 0.0410 Leukocyte
chemotaxis
groL 60 kDa chaperonin Lactobacillus
gasseri
-0.50 0.0433 Chaperone
ALB Albumin Homo sapiens -0.49 0.0445 Acute phase
response
F2 Prothrombin Homo sapiens -0.49 0.0458 Acute phase
response
LV301_HUM
AN
Ig lambda chain V-III region
SH
Homo sapiens -0.49 0.0470 Immune response
IGHG3 Ig gamma-3 chain C region Homo sapiens -0.49 0.0483 Immune response
HPX hemopexin Homo sapiens -0.48 0.0496 Acute phase
response
POSITIVE CORRELATES
LDHD_LAC
HE
D-lactate dehydrogenase Lactobacillus
helveticus
0.74 0.0011 Oxidation-reduction
SPTAN1 Spectrin alpha chain, non-
erythrocytic 1
Homo sapiens 0.73 0.0010 Actin filament
capping
CD55 Complement decay-
accelerating factor
Homo sapiens 0.72 0.0012 Complement
inhibition
IQGAP1 Ras GTPase-activating-like
protein IQGAP1
Homo sapiens 0.72 0.0012 Regulation of
cytokine production
TSN Translin Homo sapiens 0.67 0.0030 DNA
recombination
RNH1 Ribonuclease H1 Homo sapiens 0.64 0.0052 RNA metabolism
TYMP Thymidine phosphorylase Homo sapiens 0.64 0.0054 Chemotaxis
ACTN4 Alpha-actinin-4 Homo sapiens 0.63 0.0067 Tight junction
assembly
CTSH Pro-cathepsin H Homo sapiens 0.62 0.0086 Proteolysis
PSMB8 Proteasome subunit beta
type-8
Homo sapiens 0.60 0.0116 Proteolysis
HSPA8 Heat shock cognate 71 kDa
protein
Homo sapiens 0.59 0.0121 Stress response
BLA_1483 Probable phosphoketolase Bifidobacterium
animalis
0.59 0.0135 Carbohydrate
metabolism
S100A8 Protein S100A8 Homo sapiens 0.57 0.0166 Antimicrobial
activity
MYO1F Unconventional myosin-If Homo sapiens 0.56 0.0197 Neutrophil
degranulation
rplD 50S ribosomal protein L4 Lactobacillus
acidophilus
0.53 0.0283 Translation
FAM3C Protein FAM3C Homo sapiens 0.52 0.0316 Cytokine activity

129
VCL Vinculin Homo sapiens 0.52 0.0335 Epithelial cell-cell
adhesion
RAB1A Ras-related protein Rab-1A Homo sapiens 0.51 0.0345 Autophagy
YWHAZ 14-3-3 protein zeta/delta Homo sapiens 0.51 0.0355 Blood coagulation
CAB39 Calcium-binding protein 39 Homo sapiens 0.50 0.0387 Signal transduction