Analysis of Flexible Pavements Reinforced with Geogrids
11
ANALYSIS OF FLEXIBLE PAVEMENTS REINFORCED WITH GEOGRIDS Hema Siriwardane, Raj Gondle, and Bora Kutuk West Virginia University, Morgantown, West Virginia, U.S.A. 1. INTRODUCTION Flexible pavements are frequently used to construct highways and roads in the United States, and many existing pavements have been treated with bituminous or asphalt materials [1]. Due to excessive traffic loads, many existing pavements have already reached the end of their service life. As a result, surface treatment methods and the use of new pavement reinforcement materials have been explored to improve the performance and service life of flexible pavements. Asphalt overlays have been used to improve the performance of deteriorating pavements in the past. The application of geosynthetic materials in highway repairs has become popular in recent years due to their high strength, durability, and ability to relieve stresses by reinforcing the pavements [2, 3 and 4]. In the past, various types of geosynthetics like geotextiles and geogrids have been used to improve the pavement performance, which provided some reinforcing benefits. Recent studies [2, 5] have shown that geotextiles provided less resistance against lateral movements than that provided by glass fiber grids. According to a previous study [5], reinforcing the hot mix asphalt (HMA) layer requires that the stiffness of the fabric material be greater than that of the surrounding HMA. High tensile strength and elastic stiffness have made glass fiber grids more popular in reinforcing the pavement system. There is limited published information available on glass fiber grid reinforcement inside the HMA in a pavement system [6]. Designing a flexible pavement reinforced with glass fiber grid and evaluating the effectiveness of reinforced pavement performance is a complex problem requiring considerable research and study. This paper presents the results of an investigation on the effectiveness of glass fiber grids as a reinforcement of the HMA in a flexible pavement system. ABSTRACT: This paper presents the results of an investigation on the effectiveness of glass fiber grids as a reinforcement of the asphalt layer in a flexible pavement system. The study involved both laboratory experimental work and computer analysis of pavement sections. Twenty flexible pavement sections (with and without glass fiber grids) were constructed and tested in the laboratory as a part of the experimental study. The laboratory-scale pavement sections were instrumented with pressure cells, displacement gages, and strain gages. Test sections were subjected to 1,000,000 load applications at a frequency of 1.2 Hz. Static loading tests were conducted at intervals of 100,000 load applications. In thirteen experiments, the glass fiber grids were used in the asphalt layer. A series of computer analyses was performed to analyze flexible pavement sections using the Finite Element Method (FEM). The laboratory data were compared with results from the computer analysis. The results show that the glass fiber grid used in this study improved the pavement performance. It was also observed that the inclusion of glass fiber grid in the asphalt layer provided resistance to crack propagation. Overall, the flexible pavement sections reinforced with glass fiber grids showed better performance under laboratory test conditions. Keywords: Flexible Pavements; Glass grid; Finite Element Method; Reinforcement 1
Transcript of Analysis of Flexible Pavements Reinforced with Geogrids

ANALYSIS OF FLEXIBLE PAVEMENTS REINFORCED WITH GEOGRIDS
Hema Siriwardane, Raj Gondle, and Bora Kutuk West Virginia University, Morgantown, West Virginia, U.S.A.
1. INTRODUCTION
Flexible pavements are frequently used to construct highways and roads in the United States, and many existing pavements have been treated with bituminous or asphalt materials [1]. Due to excessive traffic loads, many existing pavements have already reached the end of their service life. As a result, surface treatment methods and the use of new pavement reinforcement materials have been explored to improve the performance and service life of flexible pavements. Asphalt overlays have been used to improve the performance of deteriorating pavements in the past. The application of geosynthetic materials in highway repairs has become popular in recent years due to their high strength, durability, and ability to relieve stresses by reinforcing the pavements [2, 3 and 4].
In the past, various types of geosynthetics like geotextiles and geogrids have been used to improve the pavement performance, which provided some
reinforcing benefits. Recent studies [2, 5] have shown that geotextiles provided less resistance against lateral movements than that provided by glass fiber grids. According to a previous study [5], reinforcing the hot mix asphalt (HMA) layer requires that the stiffness of the fabric material be greater than that of the surrounding HMA. High tensile strength and elastic stiffness have made glass fiber grids more popular in reinforcing the pavement system. There is limited published information available on glass fiber grid reinforcement inside the HMA in a pavement system [6]. Designing a flexible pavement reinforced with glass fiber grid and evaluating the effectiveness of reinforced pavement performance is a complex problem requiring considerable research and study. This paper presents the results of an investigation on the effectiveness of glass fiber grids as a reinforcement of the HMA in a flexible pavement system.
ABSTRACT: This paper presents the results of an investigation on the effectiveness of glass fiber grids as a reinforcement of the asphalt layer in a flexible pavement system. The study involved both laboratory experimental work and computer analysis of pavement sections. Twenty flexible pavement sections (with and without glass fiber grids) were constructed and tested in the laboratory as a part of the experimental study. The laboratory-scale pavement sections were instrumented with pressure cells, displacement gages, and strain gages. Test sections were subjected to 1,000,000 load applications at a frequency of 1.2 Hz. Static loading tests were conducted at intervals of 100,000 load applications. In thirteen experiments, the glass fiber grids were used in the asphalt layer. A series of computer analyses was performed to analyze flexible pavement sections using the Finite Element Method (FEM). The laboratory data were compared with results from the computer analysis.
The results show that the glass fiber grid used in this study improved the pavement performance. It was also observed that the inclusion of glass fiber grid in the asphalt layer provided resistance to crack propagation. Overall, the flexible pavement sections reinforced with glass fiber grids showed better performance under laboratory test conditions.
Keywords: Flexible Pavements; Glass grid; Finite Element Method; Reinforcement
1

2. OBJECTIVES
The major objective of this research was to determine the influence of glass fiber grids as reinforcement within the asphalt layer on the performance of a pavement section. Influence of the glass grid reinforcement in 76 mm (3 inch) and 152 mm (6 inch) thick asphalt sections was investigated in the laboratory. Three different types of glass grids were considered. The study involved both laboratory experimental work and computer analyses of pavement sections.
3. EXPERIMENTAL WORK
As a part of the experimental work, twenty flexible pavement sections, with and without glass fiber grids were constructed and tested in the laboratory.
3.1 Test set-up
The pavement sections were built in a rectangular container with dimensions of 1.2 m x 1.8 m x 0.8 m (4 feet x 6 feet x 2.5 feet). Cross-section of a typical pavement is shown in Figure 1. The laboratory pavement sections were instrumented with pressure cells, dial gages and strain gages.
Figure 1: Cross-section of a pavement reinforced with glass fiber grid
3.2 Load distribution
Pavements must be designed adequately to carry traffic loads. In this study, test sections were subjected to 1,000,000 load applications at a frequency of 1.2 Hz to simulate traffic with a single axle load of 80 kN (18 kips). A circular loading plate was used to apply the wheel load on the pavement section. The following equations were used to determine the dimensions of the circular loading plate to simulate the effects of a wheel load [7].
πcc p
Pr = (1)
crD 2= (2)
where
rc = radius of the contact surface,
P = total load on the tire,
pc = tire inflation pressure, and
D = diameter of contact.
The thickness of the loading plate was 25 mm (1 inch) and the diameter of the loading plate was 305 mm (12 inch).
3.3 Materials
Laboratory test section consisted of hot mix asphalt (HMA), granular base, subgrade soil and a glass fiber grid. A geotextile was used between the gravel base and the subgrade soil in all of the experiments.
3.3.1 Hot Mix Asphalt
In this study, a layer of hot mix asphalt was used as the base layer as shown in Figure 1. The maximum size of the aggregate in the mix was 25 mm (1 inch) and the fines-to-asphalt ratio for asphalt base was 1.0.
3.3.2 Gravel
The granular material used for the study meets the standard specifications. Unit weight of the granular material was found to be 17.7 kN/m3 (112.7 pcf).
2.5 in.
P - Wheel Load
Loading Plate Dial Gauge
Asphalt (HMA) Glass Grid
Gravel
Geosynthetic
Pressure Cell
Soil Subgrade
t
6 in.
8.5 in.
6 in.
2

3.3.3 Subgrade
The soil subgrade chosen for this study is classified as A-4, according to AASHTO soil classification system. The soil had a Liquid Limit (LL) of 22.75 and a Plasticity Index (PI) of 8.57. A laboratory CBR (California Bearing Ratio) value was determined as 8% for the soil subgrade. The soil was compacted to an average unit weight of 20.6 kN/m3 (131 pcf).
3.3.4 Glass Fiber Grid
Glass grids are considered to have good bonding characteristics with the asphalt due to their adhesive properties. Reinforcement using glass grids in the pavement section is expected to perform better than other polymeric fibers because of its excellent bonding nature with asphalt and also due to low creep properties. Three different types of glass fiber grids (A, B and C) were used in the study. Glass grid A represents the lightest grid while glass grid C represents the heaviest glass fiber grid. Glass grid B has a weight between those of glass grid A and glass grid C.
3.4 Experimental Program
Experiments were conducted with and without reinforcement in asphalt layer. A crack was simulated by introducing a void in the HMA layer having a thickness of 76 mm (3 inch) as shown in the Figure 2.
Figure 2: Experimental outline for pavement section with a simulated crack
3.5 Experimental Results
In the following sections, a summary of laboratory experimental results are presented.
3.5.1 Vertical Subgrade Stress
Figure 3 shows the influence of different glass grids on vertical subgrade stress in a test section with a 152 mm (6 inch) thick HMA layer. As can be seen from this figure, the measured stresses fluctuate within a narrow range. These results indicated that the influence of different glass fiber reinforcement on vertical subgrade stress was not significant when the thickness of asphalt layer was 152 mm (6 inch). Figure 4 shows the variation of vertical subgrade stress in a reinforced pavement section for different glass grids in a doubly reinforced test section. In one case, heavier glass grid was used as the reinforcement in the HMA layer. Based on these results, it appears that the vertical stress in the subgrade is lower in the pavement section with stronger glass grid for most part of the loading history.
0
1
2
3
4
5
6
7
8
9
0.E+00
Ver
tical
Str
ess (
psi)
Note: 1 psi =
Figure 3: vertical sub
P - Wheel Load Loading Plate
Dial Gauge
Asphalt (HMA) Glass Grid
Gravel Geosynthetic
Pressure Cell
Soil Subgrade
6 in.
8.5
t
Simulated Crack
Pr
e
HMA
Gravel Base
Loading Plate
3
Subgrad
2.E+05 4.E+05 6.E+05 8.E+05 1.E+06
Number of Load Cycles
Experiment # 3 (Grid - A)
Experiment # 2 (Grid - B)Experiment # 7 (Grid - C)
6.89 kPa
Influence of different glass grids on grade stress
essure Cell # 1
Pressure Cell # 2 Pressure Cell # 1

0
2
4
6
8
10
12
14
0.E+00 2.E+05 4.E+05 6.E+05 8.E+05 1.E+06
Number of Load Cycles
Ver
tical
Str
ess (
psi)
Experiment # 8 (Grid C in HMA; Grid C between GravelBase and HMA)Experiment # 9 (Grid A in HMA; Grid C between GravelBase and HMA )
Note: 1 psi = 6.89 kPa
Figure 4: Variation of vertical subgrade stress for different glass grids in a doubly reinforced section
Influence of asphalt thickness on the vertical subgrade stress is shown in Figure 5. When the thickness of the asphalt layer was increased from 76 mm (3 inch) to 152 mm (6 inch), vertical stress in the subgrade decreased. Figure 6 shows a comparison of a non-reinforced section and a reinforced section with a simulated crack in terms of measured vertical stresses. The thickness of the HMA layer in the non-reinforced section was 152 mm (6 inch). The thickness of the HMA layer in the reinforced section was only 76 mm (3 inch). Observations on the thinner pavement sections indicated that a reinforced thinner section (t = 76 mm (3 inch)) with a simulated crack behaved similar to that of a non-reinforced thicker pavement section (t = 152 mm (6 inch)). The glass grid appears to spread the circular load over a larger area in the lower layers of the pavement section causing slightly lower subgrade stress.
3.5.2 Cumulative Displacements
Figure 7 shows the cumulative displacements for reinforced and non-reinforced thick asphalt sections where the thickness of the HMA layer was 152 mm (6 inch). The cumulative displacements decreased with the inclusion of reinforcement within the asphalt layer. An improvement of approximately 38% was observed when the HMA layer was reinforced with glass grid A.
0
2
4
6
8
10
12
14
0.E+00 2.E+05 4.E+05 6.E+05 8.E+05 1.E+06
Number of Load Cycles
Ver
tical
Str
ess (
psi)
Experiment # 3 (Grid A in HMA; Thickness of HMA = 6 in)
Experiment # 17 (Grid A in HMA; Thickness of HMA = 3 in)
Note: 1 psi = 6.89 kPa
Figure 5: Influence of asphalt thickness on vertical subgrade stress in reinforced test sections
0
2
4
6
8
10
12
14
16
0.E+00 2.E+05 4.E+05 6.E+05 8.E+05 1.E+06
Number of Load Cycles
Ver
tical
Str
ess
(psi
)
Experiment # 14 (Grid A; Simulated Crack; t = 3 in)Experiment # 15 (Grid A; Simulated Crack; t = 3 in)Average values of Experiments # 14 and 15Experiment # 4 (without reinforcement, t = 6 in)
Note: 1 psi = 6.89 kPa
Figure 6: Comparison of a non-reinforced thick asphalt section (152 mm (6 inch)) with a reinforced thin asphalt section (76 mm (3 inch)) with a simulated crack
For the thicker test sections (t = 152 mm (6 inch)), doubly reinforced pavement sections improved the pavement performance in comparison to a singly reinforced pavement section as shown in Figure 8. This substantial decrease in the cumulative displacements illustrate that an improvement can be gained by doubly reinforcing the pavement section
4

by adding glass fiber grid between the gravel base and the hot mix asphalt in addition to the one inside the HMA.
0.0
0.1
0.2
0.3
0.4
0.5
0.6
0.E+00 2.E+05 4.E+05 6.E+05 8.E+05 1.E+06
Number of Load Cycles
Dis
plac
emen
t (in
ches
)
without Reinforcement
Reinforcement (Glass grid A in HMA)
Note: 1 inch = 25.4 mm
Figure 7: Cumulative Displacements for reinforced and non-reinforced thick asphalt section
For the thinner test sections (t = 76 mm (3 inch)) as shown in Figure 9, reinforced sections had no significant influence over non-reinforced sections. The reason could be the fact that compaction effort played a significant role than the reinforcement in laboratory experiments. Reinforced thin asphalt sections improved pavement performance than non-reinforced thick asphalt sections.
0
0.1
0.2
0.3
0.4
0.5
0.6
0.E+00 2.E+05 4.E+05 6.E+05 8.E+05 1.E+06
Number of load cycles
Dis
plac
emen
t (in
ches
)
without Reinforcement
Singly Reinforced (Grid A in HMA)
Doubly Reinforced (Grid A in HMA; Grid C between Gravel Base and HMA)
Doubly Reinforced (Grid C in HMA; Grid C between Gravel Base and HMA)
Note: 1 inch = 25.4 mm
Figure 8: Influence of reinforcement on cumulative displacements for a thick asphalt section (t = 152 mm (6 inch))
-0.1
0
0.1
0.2
0.3
0.4
0.5
0.6
0.E+00 2.E+05 4.E+05 6.E+05 8.E+05 1.E+06
Number of Load Cycles
Cum
ulat
ive
Disp
lace
men
ts (i
nche
s)
Experiment # 18 (No reinforcement; thickness of HMA = 3 in)
Experiment # 17 (Grid A in HMA; thickness of HMA = 3 in)
Experiment # 20 (Grid A in HMA; thickness of HMA = 2.5 in)
Note: 1 inch = 25.4 mm
Figure 9: Influence of reinforcement on cumulative displacements for a thin asphalt section
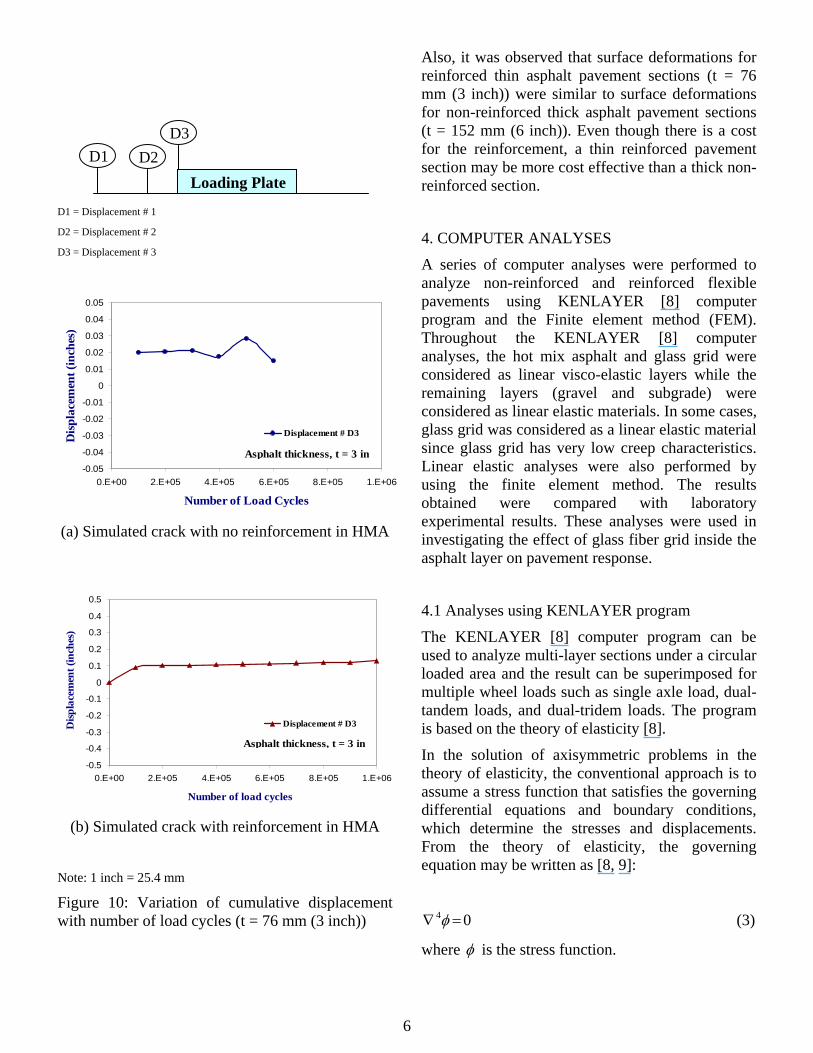
Results have shown that thinner reinforced asphalt layers with a simulated crack performed better than a thicker non-reinforced asphalt layers without a simulated crack. Figure 10 shows the variation in cumulative displacements with number of load cycles for a reinforced and non-reinforced pavement sections with a simulated crack. Failure was observed in the non-reinforced pavement sections with a simulated crack. The results show that reinforcement in the HMA helps in reducing the crack propagation leading to failure.
3.5.3 Displacement under static loading
For thicker pavement sections, displacements with lighter glass grids result in slightly larger surface deformations in comparison to test sections with heavier glass grids. For the thin pavement sections, surface deformations for the reinforced test sections were slightly higher than that of the non-reinforced test sections. This small difference was insignificant and may be caused by the difference in the compaction effort. Even though this difference was insignificant, observation have shown that under static loading, non-reinforced pavement sections with a simulated crack resulted in slightly larger surface deformations than that of a non-reinforced pavement sections without any crack.
5
D1 = Displacement # 1
D2 = Displacement # 2
D3 = Displacement # 3
-0.05
-0.04
-0.03
-0.02
-0.01
0
0.01
0.02
0.03
0.04
0.05
0.E+00 2.E+05 4.E+05 6.E+05 8.E+05 1.E+06
Number of Load Cycles
Dis
plac
emen
t (in
ches
)
Displacement # D3
Asphalt thickness, t = 3 in
(a) Simulated crack with no reinforcement in HMA
-0.5
-0.4
-0.3
-0.2
-0.1
0
0.1
0.2
0.3
0.4
0.5
0.E+00 2.E+05 4.E+05 6.E+05 8.E+05 1.E+06
Number of load cycles
Disp
lace
men
t (in
ches
)
Displacement # D3
Asphalt thickness, t = 3 in
(b) Simulated crack with reinforcement in HMA
Note: 1 inch = 25.4 mm
Figure 10: Variation of cumulative displacement with number of load cycles (t = 76 mm (3 inch))
Also, it was observed that surface deformations for reinforced thin asphalt pavement sections (t = 76 mm (3 inch)) were similar to surface deformations for non-reinforced thick asphalt pavement sections (t = 152 mm (6 inch)). Even though there is a cost for the reinforcement, a thin reinforced pavement section may be more cost effective than a thick non-reinforced section.
4. COMPUTER ANALYSES
A series of computer analyses were performed to analyze non-reinforced and reinforced flexible pavements using KENLAYER [8] computer program and the Finite element method (FEM). Throughout the KENLAYER [8] computer analyses, the hot mix asphalt and glass grid were considered as linear visco-elastic layers while the remaining layers (gravel and subgrade) were considered as linear elastic materials. In some cases, glass grid was considered as a linear elastic material since glass grid has very low creep characteristics. Linear elastic analyses were also performed by using the finite element method. The results obtained were compared with laboratory experimental results. These analyses were used in investigating the effect of glass fiber grid inside the asphalt layer on pavement response.
4.1 Analyses using KENLAYER program
The KENLAYER [8] computer program can be used to analyze multi-layer sections under a circular loaded area and the result can be superimposed for multiple wheel loads such as single axle load, dual-tandem loads, and dual-tridem loads. The program is based on the theory of elasticity [8].
In the solution of axisymmetric problems in the theory of elasticity, the conventional approach is to assume a stress function that satisfies the governing differential equations and boundary conditions, which determine the stresses and displacements. From the theory of elasticity, the governing equation may be written as [8, 9]:
04 =∇ φ (3)
where φ is the stress function.
Loading Plate
D3 D1 D2
6

In KENLAYER [8] analyses, stresses and displacements caused by moving loads were considered. Damage and environmental effects were not addressed in these analyses. KENLAYER [8] computer program does not have a capability of including geosynthetic material in the layered system. However, in this study, the glass grid reinforcement was simulated by including a very thin layer inside the hot mix asphalt.
4.2 Finite Element Method (FEM)
Finite element method is a powerful tool for solving complex problems like reinforced flexible pavements. In the present research work, a well-known commercially available finite element package ‘ABAQUS’ was chosen to analyze non-reinforced and reinforced flexible pavements [10]. Two dimensional and three dimensional linear elastic analyses were performed on non-reinforced and reinforced pavement sections. Mathematical details of the finite element method can be found elsewhere [11] and not included here due to space limitations.
The global governing equations can be expressed as [11]:
[ ]{ } { }RrK = (4)
where
[ ]K = global stiffness matrix,
{r} = global displacement vector, and
{R} = global load vector.
Results obtained from these finite element analyses were compared to the results obtained from laboratory experimental work and KENLAYER [8] computer program. Both three-dimensional and axi-symmetric finite element analyses were performed.
4.2.1 Three Dimensional Analysis
Three dimensional finite element analyses for the reinforced and non-reinforced pavement sections were carried out using ABAQUS [10]. All the layers except the glass grid were modeled using three dimensional deformable solid homogeneous
elements. Glass grid was modeled using membrane elements. Table 2 shows the material properties used in the finite element analyses. Thickness of the asphalt layer was assumed to be 76 mm (3 inch). Thickness of the glass grid was assumed to be 2.5 mm (0.1 inch). Four-noded quadrilateral membrane elements were used to mesh the glass grid. Eight-noded linear brick elements were used to mesh all the other layers in the test set-up. Figure 11 represents the finite element mesh for the pavement section. Sides of the box and the bottom of the box were constrained and a tire pressure of 551 kN/m2 (80 psi) was applied on the surface of the circular loading plate. In some cases, frictional properties were assigned at the interface between the loading plate and the HMA layer.
Table 2: Material Properties used in the FEA [12]
Layer Elastic Modulus MPa (psi) Poisson’s Ratio
HMA 1,862 (270,000) 0.35
Gravel 317 (46,000) 0.30
Subgrade 41 (6,000) 0.30
Glass Grid 28,992 (4,205,000) 0.30
Figure 11: Finite element mesh for laboratory pavement section
7

Figure 12 shows the vertical stress distribution for reinforced and non-reinforced pavement sections. Observations show that inclusion of reinforcement layer spreads the circular load over larger area in the lower layers of the pavement section slightly reducing vertical stresses.
(a) Pavement section with no reinforcement
(b) Pavement section with reinforcement layer
Note: All the units are expressed in PSI.
1 psi = 6.89 kPa
Figure 12: Vertical stress distribution for reinforced and non-reinforced pavement sections
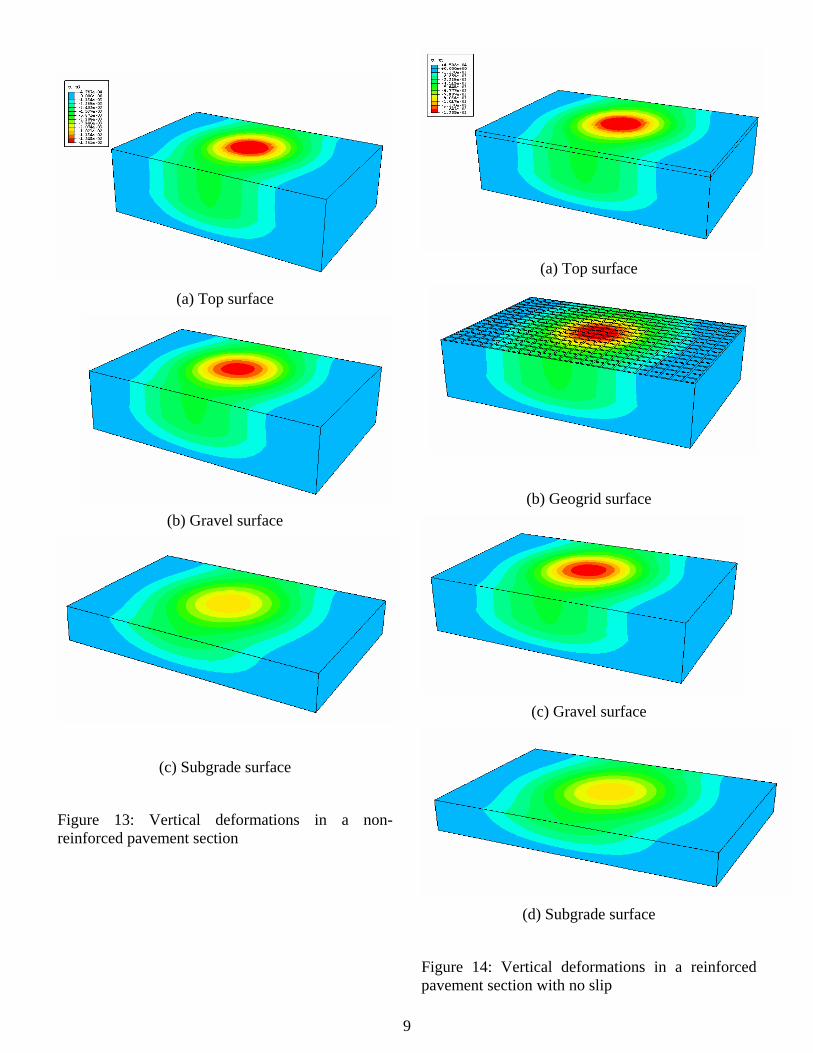
Figure 13 and 14 shows the vertical deformations in the pavements sections for non-reinforced and reinforced pavement sections, respectively. For the reinforced pavement sections, experimental observations clearly show that reinforcement in the asphalt layer spreads the circular load in the lower layers of the pavement section reducing the vertical displacements. In this analysis, relative slip was not allowed between the HMA and the reinforcement layer.
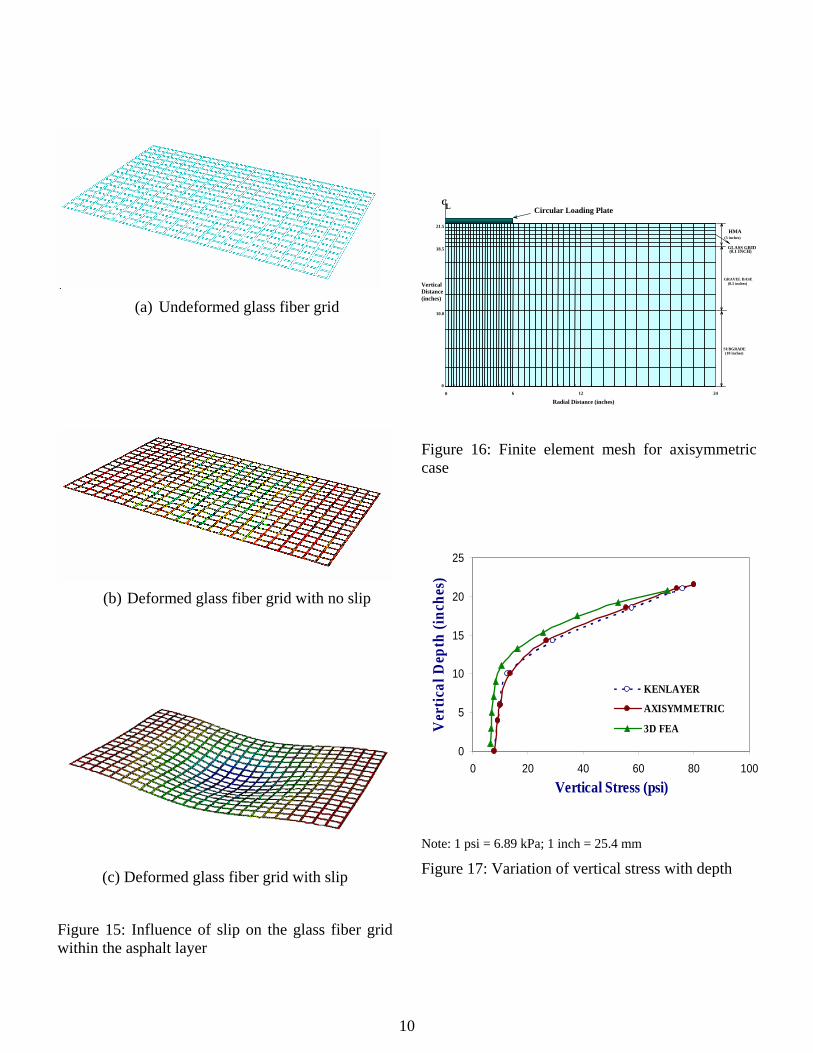
In some cases, glass fiber grid was allowed to slip within the asphalt layer. This was accomplished by assigning proper properties for the interface between the reinforcement grid and the HMA layer. Figure 15 shows the influence of relative slip on the deformed shape of the glass fiber grid on an exaggerated scale.
4.2.2 Two Dimensional Analyses
All the layers except the glass grid were modeled by using two dimensional deformable elements. Figure 16 represents the finite element mesh used for the axisymmetric case. Figure 17 shows the vertical stress distribution obtained from various computer analyses. As can be seen from this figure, the vertical stress distribution obtained from all these methods seems to be similar. However, the influence of the reinforcing layer needs to be included in the analysis. This was done by using the finite element method in which interface properties were assigned. The glass grid was simulated by using membrane elements in the three dimensional finite element analyses.
Figure 18 shows a comparison of experimentally measured vertical stress with those obtained from a two-dimensional finite element analysis. While keeping the material properties of glass grid and the HMA unchanged, the material properties of the gravel base and the subgrade were varied between a lower bound and an upper bound. The computed vertical stresses are shown in Figure 18. The comparison between the measured stresses and the computed values can be considered as reasonable.
8
(a) Top surface
(b) Gravel surface
(c) Subgrade surface
Figure 13: Vertical deformations in a non-reinforced pavement section
(a) Top surface
(b) Geogrid surface
(c) Gravel surface
(d) Subgrade surface
Figure 14: Vertical deformations in a reinforced pavement section with no slip
9
(a) Undeformed glass fiber grid
(b) Deformed glass fiber grid with no slip
(c) Deformed glass fiber grid with slip
Figure 15: Influence of slip on the glass fiber grid within the asphalt layer
Figure 16: Finite element mesh for axisymmetric case
0
5
10
15
20
25
0 20 40 60 80 100
Vertical Stress (psi)
Ver
tical
Dep
th (i
nche
s)
KENLAYER
AXISYMMETRIC
3D FEA
Note: 1 psi = 6.89 kPa; 1 inch = 25.4 mm
Figure 17: Variation of vertical stress with depth
Radial Dista ches) nce (in
Vertical Distance (inches)
(3 inches)
GRAVEL BASE(8.5 inches)
SUBGRADE(10 inches)
GLASS GRID (0.1 INCH)
0 6 12 24
10.0
18.5
21.5
0
Circular Loading Plate CL
HMA
10

0
5
10
15
20
25
30
0 2 4 6 8 10 12 14 16 18 20
Applied Load (kips)
Ver
tical
Str
ess (
psi)
Measured Stress # 1 at 500000 cycles (Experiment # 3)
Measured Stress # 1 at 500000 cycles (Experiment # 5)
Predicted Stress # 1 (Upper Bound - Case 1)Predicted Stress # 1 (Lower Bound - Case 1)
Note: 1 psi = 6.89 kPa; 1 kip = 4.45 kN
Figure 18: Comparison of Measured and Predicted Vertical Stresses in a 6 inch (152 mm) thick asphalt section with reinforcement
5. DISCUSSION AND CONCLUSIONS
Because of the need to extend pavement service life, use of pavement reinforcements has received increased attention during the last decade. Experimental and computational studies were performed to investigate the influence of synthetic grids in the HMA layer on the performance of pavements. Experiments were conducted in a container in the laboratory. Numerical modeling was performed by using both two-dimensional and three-dimensional finite element models of the experimental setup.
The influence of reinforcing grid on the vertical stress in the subgrade was insignificant when the thickness of the asphalt layer was 152 mm (6 inch). However, it was observed that the vertical stress in the subgrade was lower in pavement sections with stronger glass grids. Observations indicated that a reinforced thinner section behaved similar to that of a non-reinforced thicker section. Observations show that inclusion of reinforcement layer spreads the circular load over larger area in the lower layers of the pavement section reducing vertical stresses. The computed vertical stresses from the finite element analysis compare reasonably well with the measured values at selected locations. In the three-dimensional finite element analysis, the reinforcing
material was modeled as a membrane. The interface properties between the reinforcing material and the HMA layer have significant influence on the computed displacements and the stress distribution in the pavement section. More computational modeling work needs to be performed to study the influence of interface properties on the pavement performance.
ACKNOWLEDGEMENTS
The paper contains results from a research project funded by the WV Department of transportation (WVDOT). The authors acknowledge the support provided by WVDOT.
REFERENCES 1. Asphalt Institute (1989) The Asphalt Handbook,
Asphalt Institute Manual Series No. 4 (MS-4).
2. Barksdale. R.D. (1991) Fabrics in Asphalt Overlays and Pavements Maintenance, Report NCHRP 171, Transportation Research Board, Washington, D.C.
3. Koerner, R.M. (1994) Designing with Geosynthetics, Third Edition, Prentice Hall, Upper Saddle River, NJ.
4. Smith, T.E., Brandon, T.L., Al-Qadi, I.L., Lacina, B.A., Bhutta, S.A., and Hoffman, S.E. (1995) Laboratory Behavior of Geogrid and Geotextile Reinforced Flexible Pavements, Final Report, Virginia Polytechnic Institute and State University, Blacksburg, VA.
5. Lytton, R.L. (1989) Use of Geotextiles for Reinforcement and Strain Relief in Asphalt Concrete, Geotextiles and Geomembranes.
6. Button J.W. and Lytton R.L. (1987) Evaluation of Fabrics, Fibers and Grids in Overlays, Proceedings, 6th International Conference on Structural Design of Asphalt Pavements, Vol. 1, pp. 925-934.
7. Yoder, E.J. and Witczak (1975) Principles of Pavement Design, Second Edition, John Wiley and Sons Inc., NY.
8. Huang, Y.H. (1993) Pavement Analysis and Design, Prentice Hall, Englewood, NJ.
9. Timoshenko, S.P. and Goodier, J.N. (1987) Theory of Elasticity, Third Edition, McGraw Hill.
10. ABAQUS version 6.6 (2006) ABAQUS user’s manual, Hibbit, Karlson and Sorenson, Inc., Pawtucket, RI.
11. Cook, R.D., Malkus, D.S., Plesha, M.E., and Witt, R.J. (2003) Concepts and applications of finite element ananysis, John Wiley and Sons, Inc., Indianapolis, Indiana.
12. Kutuk, Bora (1998) Performance of Flexible Pavements Reinforced with Geogrids, Ph.D. Thesis, West Virginia University, Morgantown, WV.
11