Quantum Dynamics through Conical Intersections: Combining Effective Modes and Quadratic Couplings
Upload
independentCategory
view
0download
0
Cyanobacterial diversity and activity in modern conicalmicrobialitesT. BOSAK,1 B . LIANG,1 , 2 T . -D . WU,3 , 4 S . P . TEMPLER,1 , 5 A . EVANS,1 H. VALI , 6 , 7
J . -L . GUERQUIN-KERN,3 , 4 V . KLEPAC-CERAJ , 8 , 9 M. S . S IM1 AND J . MUI6
1Department of Earth, Atmospheric and Planetary Sciences, Massachusetts Institute of Technology, Cambridge, MA, USA2Institute of Earth Sciences, Nangang, Academia Sinica, Taipei, Taiwan3INSERM, Orsay, France4Laboratoire de Microscopie Ionique, Institut Curie, Orsay, France5Roche Molecular Diagnostics, Basel, Switzerland,6Facility for Electron Microscopy Research, McGill University, Montreal, QC, Canada7Department of Anatomy and Cell Biology, McGill University, Montreal, QC, Canada8The Forsyth Institute, Cambridge, MA, USA9Department of Biological Sciences, Wellesley College, Wellesley, MA, USA
ABSTRACT
Modern conical microbialites are similar to some ancient conical stromatolites, but growth, behavior and
diversity of cyanobacteria in modern conical microbialites remain poorly characterized. Here, we analyze
the diversity of cyanobacterial 16S rRNA gene sequences in conical microbialites from 14 ponds fed by four
thermal sources in Yellowstone National Park and compare cyanobacterial activity in the tips of cones and
in the surrounding topographic lows (mats), respectively, by high-resolution mapping of labeled carbon.
Cones and adjacent mats contain similar 16S rRNA gene sequences from genetically distinct clusters of fila-
mentous, non-heterocystous cyanobacteria from Subsection III and unicellular cyanobacteria from Subsec-
tion I. These sequences vary among different ponds and between two sampling years, suggesting that
coniform mats through time and space contain a number of cyanobacteria capable of vertical aggregation,
filamentous cyanobacteria incapable of initiating cone formation and unicellular cyanobacteria. Unicellular
cyanobacteria are more diverse in topographic lows, where some of these organisms respond to nutrient
pulses more rapidly than thin filamentous cyanobacteria. The densest active cyanobacteria are found below
the upper 50 lm of the cone tip, whereas cyanobacterial cells in mats are less dense, and are more com-
monly degraded or encrusted by silica. These spatial differences in cellular activity and density within mac-
roscopic coniform mats imply a strong role for diffusion limitation in the development and the persistence
of the conical shape. Similar mechanisms may have controlled the growth, morphology and persistence of
small coniform stromatolites in shallow, quiet environments throughout geologic history.
Received 6 October 2011; accepted 30 April 2012
Corresponding author: T. Bosak. Tel.: +01-617-324-3959; fax: +01-617-253-8630; e-mail: [email protected]
INTRODUCTION
The macroscopic record of attached, laminated sedimentary
rocks ‘accretionary from a point or limited surface’ (Semi-
khatov et al., 1979) called stromatolites may record micro-
bial interactions with sediments throughout Earth’s
sedimentary history (Grotzinger & Knoll, 1999). Stromat-
olites are conspicuous features in many Archean and Prote-
rozoic carbonate strata, but the relationships between
microscopic processes that build individual laminae and the
preservable macroscopic shapes of stromatolites are not
well understood. Evidence that microbial growth, move-
ment and orientation influenced the formation of stromat-
olite laminae is particularly elusive in progressively older
stromatolites owing to the abundance of precipitated
cements and recrystallization (e.g., Hofmann & Jackson,S.P.T., B.L., T.D.W. and T.B. contributed equally to this work.
© 2012 Blackwell Publishing Ltd 384
Geobiology (2012), 10, 384–401 DOI: 10.1111/j.1472-4669.2012.00334.x

1987; Kah & Knoll, 1996; Bartley et al., 2000; Pope &
Grotzinger, 2000). Small conical stromatolites and tufts as
old as 3.0 billion years stand out as a biologically influ-
enced end-member of precipitated stromatolites with mod-
ern, distinctly biogenic analogs that grow only in the
presence of cyanobacteria (Fig. 1, Walter et al., 1972,
1976; Grey, 1980; Beukes & Lowe, 1989; Buick, 1992;
Jones et al., 2002; Bosak et al., 2009; Petroff et al.,
2010). Given these morphological similarities, one may ask
whether similar factors have been responsible for the
growth and persistence of coniform mats throughout geo-
logic history. Here, we explore these factors by examining
cyanobacterial diversity, biomass density and temporal
changes in cyanobacterial communities in modern coni-
form microbialites from Yellowstone National Park (YNP,
Figs 1 and 2).
Microscopic examinations of modern conical mats
focus primarily on thin filamentous cyanobacteria. Walter
et al. (1976) uses microscopy and laboratory enrichment
cultures to identify filamentous cyanobacterium Phormidi-
um tenue var. granuliferum as the principal cone-build-
ing organism. Variably lithified filaments morphologically
similar to P. tenue also can be seen in cones from YNP
and New Zealand (Cady & Farmer, 1996; Jones et al.,
2002), whereas unicellular organisms and Pseudoanabae-
na are more commonly observed in the surrounding
mats (Walter et al., 1976). The true molecular, morpho-
logical and functional diversity of cyanobacteria in coni-
form mats likely exceeds these microscopic estimates.
Even before the advent of molecular techniques, Weller
et al. (1975) reported the formation of cones in a num-
ber of axenic cyanobacterial cultures but did not describe
any phenotypic or morphological differences among these
cultures. Recent molecular studies show the presence of
multiple genetically distinct cyanobacteria in photosyn-
thetic mats from hot springs (Ferris et al., 2003; Lacap
et al., 2005, 2007; Lau et al., 2005; Ward et al., 2006;
McGregor & Rasmussen, 2008; Boomer et al., 2009;
Foster et al., 2009). A single study (Lau et al., 2005)
analyzed the cyanobacterial diversity in cones, ridged
cones and flat-topped cones from one of the outflows of
Black Sands Pool in YNP and reported six cyanobacterial
sequences in all cones: one Phormidium-like sequence, a
sequence similar to unicellular Synechococcus, and four
sequences with the closest similarity to uncultured cyano-
bacteria. Because the mats around cones contained only
Synechococcus-like sequences that were distinct from those
in cones, these authors suggested that cones and mats, as
distinct components of coniform mats, contained different
microbial assemblages (Lau et al., 2005).
It remains unclear how to marry the reported molecular
diversity of cyanobacteria in coniform mats with microscopic
CA
D
B
E
F
Fig. 1 Coniform mats in alkaline hot springs in Yellowstone National Park (YNP) (A, B) Photographs of coniform mats in small depressions and quiet ponds.
(A) Dense cones. (B) Coniform mat consisting of cones (c) and surrounding mats (m). (C) Transmitted light micrograph of a vertical 30-lm-thick section
through a cone showing thin dark laminae (arrow) and thick, porous laminae. Arrow points to the region magnified in (E). (D) Photograph of a YNP cone
and the adjacent mat used in the 30-min labeling experiment. A similar cone was used in the 60-min incubation. Small divisions on the scale are 1 mm long.
(E) Transmitted light micrograph of the vertical section of a cone showing aligned filaments in a thin lamina (arrow) and randomly oriented filaments in the
porous laminae pl. (F) Transmitted light micrograph of the vertical section through the mat showing heavily lithified thin laminae (dark, Si grains) and empty
regions. The presence of Si was confirmed by energy-dispersive X-ray spectroscopy.
© 2012 Blackwell Publishing Ltd
Cyanobacteria in hot spring coniform mats 385

observations. Namely, filamentous cyanobacteria are com-
monly seen in mats (e.g., Walter et al., 1976), but only
sequences similar to unicellular Synechococcus are reported
from the mats around cones (Lau et al., 2005). It also
remains unclear whether only one organism drives the for-
mation of coniform mats in YNP, or whether these struc-
tures contain multiple genetically distinct organisms capable
of vertical aggregation. Here, we address these questions by:
• analyzing the diversity of cyanobacteria in cones and mats
in multiple ponds around four different hot springs
• characterizing the ability of different cyanobacteria to
form vertical structures in laboratory enrichment cultures
• measuring the activities and the densities of cells at the
topographic highs and lows of natural coniform mats in
YNP.
Our findings reveal that modern coniform mats contain
multiple, genetically distinct filamentous and unicellular
cyanobacteria and that these cyanobacterial communities
vary in space and time, contributing to the interannual
persistence of coniform structures. At any given point in
time, the growth, degradation and lithification of microbes
in coniform mats depend on the position within the three-
dimensional topography.
MATERIALS AND METHODS
Sample collection
Samples of conical stromatolites used in laboratory enrich-
ments, field incubations with labeled carbon, microscopic
analyses and a subset of molecular analyses were collected
in one pond of Mound Spring in YNP in September 2008.
Cones that were incubated with labeled carbon were not
used in molecular analyses, but adjacent cones from the
same pond were sampled and analyzed instead. Most sam-
ples for comparative molecular analyses were collected in
August 2009 as pairs of cones and adjacent mats (Fig. 1B,
D) from 14 ponds fed by the outflow channels of four dif-
ferent hot springs in the Sentinel Meadows thermal area:
Mound Spring, Flat Cone Spring, Bison Pool, and the Bul-
gers (Table 1, Fig. 2). Some of these samples were also
analyzed by transmitted electron microscopy (TEM,
Fig. 3D). All field incubations and sample collections were
performed under permit (#YELL-2008-SCI-5758 for the
sampling of coniform mats in Sentinel Meadows and Fairy
Creek). All samples were excised in duplicates by a sterile
surgical blade and placed in sterile Eppendorf tubes, stored
on dry ice during field collection and transport, and stored
at �80 °C in the laboratory. Flow in ponds in 2009 was
monitored by placing the floating lid of a 15-mL BD Fal-
conTM tube (BD Biosciences, San Jose, CA, USA) on the
surface of the liquid and measuring the distance that the
lid travelled in time.
Light and epifluorescence microscopy
Samples were fixed with 2.5% glutaraldehyde in 0.1 M
sodium cacodylate buffer (pH 7.4) for 2 h. Buffer-washed
samples were embedded in Sakura TissueTek O.C.T. com-
pound (VWR, West Chester, PA, USA), frozen for at least
2 h and sectioned to a thickness of 10–30 lm using a
cryo-stat (Leica, Wetzlar, Germany). Thin sections were
washed with buffer and imaged using an Axio Imager M1
epifluorescence microscope (Carl Zeiss, Thornwood, NY,
USA) with differential interference contrast and phase con-
trast modules. LSM510 confocal microscope with quasar
spectral detection (Carl Zeiss) was used to distinguish
Fig. 2 Map of the sampling area (Sentinel Meadows, Yellowstone National Park) created by Google Maps, © Google. Inset on the right contains the map of
Yellowstone National Park created by Google Maps. Star in the inset indicates the sampling area.
© 2012 Blackwell Publishing Ltd
386 T. BOSAK et al.

between chlorophyll autofluorescence (CY3 filter, excita-
tion 558 nm and emission 568 nm) and the orange auto-
fluorescence of phycoerythrin (FITC filter, excitation
490 nm and emission 520 nm).
Genomic DNA extraction
Genomic DNA from approximately 0.5 g of all samples
was extracted using UltraClean soil DNA isolation kit
Table 1 Conditions at sampling sites around four Yellowstone National Park (YNP) alkaline hot springs in Sentinel Meadows (Fig. 2). The sampling sites were
defined by the appearance of coniform mats. Only one pond was sampled in Flat Cone because other coniform structures there were permanently exposed
Hot spring General description
pH at
source
pH range
in sampled
area
T at
source
(°C)
T range (°C)
in sampled
area
No. of
sampled
ponds
No. of
samples
Mound
Spring
2008
Slightly elevated spring with single, boiling rimmed source
(approximately 2 m in diameter) and two major outflow channels.
High water level in ponds; coniform mats permanently submerged.
na 8.67–9.20 na 42.1–43.6 1 5
Mound
spring
2009
Slightly elevated spring with single, boiling rimmed source
(approximately 2 m in diameter) and two major outflow channels.
Sampling starts approximately 10 m away from source. Low water
level in ponds; coniform mats covered by a thin film of water.
9.24 9.26–9.57 78.2 24.7–51.3 6 13
The
Bulgers
2009
Flat spring with two small boiling sources (each approximately 0.5 m
in diameter) and two major outflow channels. Sampling starts
approximately 5 m away from source. Low water level in ponds;
coniform mats covered by a thin film of water.
8.30 8.50–9.00 86.4 32.0–42.1 5 12
Flat Cone
spring
2009
Elevated spring with single, non-boiling rimmed source (approximately
1.5 m in diameter) and one major outflow channel. Source erupted
occasionally. Between eruption cycles, most ponds at minimal water
level. Coniform mats exposed in most ponds.
8.78 9.20–9.30 70.0 22.2 1 4
Bison
spring
2009
Flat spring with single, non-boiling source (approximately 1.5 m in
diameter) and one major outflow channel. Coniform mats under
5–10 cm of water.
8.00 8.50–8.90 88.5 33.8–47.4 2 4
CA
D
B
E
Fig. 3 Morphology, ultrastructure and fluorescence of filamentous cyanobacteria in cones. (A) Differential interference contrast micrograph of cells in the
cone tip. c denotes representative cyanobacterial morphologies identified by chlorophyll autofluorescence. The beaded morphology is rare, other morphologi-
es are common. (B) Transmission electron microscopy (TEM) image of cells in the tip of a Yellowstone National Park (YNP) cone showing many different
cross-sections of approximately 1-lm-wide filaments. (C) TEM image of a typical filamentous spear-tipped cyanobacterium in the tip of a cone. The cell con-
tains inclusion bodies i, carboxysomes cb, thylakoids t, and SiO2 granules Si (less frequent). This cone was collected in 2008 and was not incubated with
labeled carbon. (D) TEM image of a typical sausage-shaped cyanobacterium surrounded by mucilage m and silica granules Si. This sample shows the tip of a
cone collected in 2009. (E) Confocal fluorescence micrograph of typical Synechococcus-like cyanobacteria that occur rarely on the surface of cones, but are
more common in the mat. Orange autofluorescence is consistent with the presence of phycoerhythrin. Chlorophyll a autofluoresces red.
© 2012 Blackwell Publishing Ltd
Cyanobacteria in hot spring coniform mats 387

(Mo Bio Laboratories, Carlsbad, CA, USA) following
the manufacturer’s protocol for maximum yield. The
concentrations of DNA were measured using a Nano-
Drop 1000 (Thermo Fisher Scientific Inc., Wilmington,
DE, USA).
PCR conditions
Universal bacterial primers 27F (5′-AGAGTTTGAT
CATGGCTCAG-3′) and 1492R (5′-TACGG(C/T)TAC-
CTTGTTACGACTT-3′) (Lane, 1991) were used to
amplify bacterial 16S rRNA genes. Amplification used an
initial denaturation step at 95 °C for 4 min, followed by
30 cycles of denaturation at 95 °C for 35 s, annealing at
52 °C for 55 s, elongation at 72 °C for 55 s, and a final
3 min elongation step at 72 °C in a MyCyclerTM Thermal
Cycler (Bio-Rad, Hercules, CA, USA). PCR mixtures
contained (per 50 lL): 0.4 lM of primers, 2 lL of DNA
template (or 2 lL of purified 16S rRNAgene PCR prod-
uct), 19 Ex TaqTM buffer (Takara Bio Inc., Shiga, Japan),
2 mM MgCl2, 1.25 U TaKaRa ExTaqTM (Takara Bio
Inc.), 0.25 mM of each dNTP. The PCR products were
purified using the QIAquick PCR Purification Kit (Qiagen
Inc., Valencia, CA, USA) and re-amplified in a nested PCR
using primers specific to cyanobacteria: forward primer
359F (GGG GAA TYT TCC GCA ATG GG) with a GC
clamp (CGC CCG CCG CGC CCC GCG CCG GTC
CCG CCG CCC CCG CCC G) and an equimolar mixture
of reverse primer 781R(a) (GAC TAC TGG GGT ATC
TAA TCC CAT T) and 781R(b) (GAC TAC AGG GGT
ATC TAA TCC CTT T) (Nubel et al., 1997; Lau et al.,
2005). For the amplification using cyanobacteria-specific
primers, amplification conditions were as follows: initial
denaturation step at 94 °C for 1 min 25 s; followed by 13
cycles of denaturation for 35 s at 95 °C, primer annealing
for 55 s at 55 °C and extension for 45 s at 72 °C; 13
cycles with 2 min extension time followed by nine cycles
with a 3-min extension; and a final 10-min extension at
72 °C, as previously described (Lau et al., 2005). PCR
mixtures contained (per 50 lL): 0.4 lM of primers, 2 lLof purified 16S rRNAgene PCR product), 1 9 Ex TaqTM
buffer (Takara Bio Inc.), 1.5 mM MgCl2, 1.25 U TaKaRa
ExTaqTM (Takara Bio Inc.), 0.25 mM each dNTP. The
PCR products were purified using the QIAquick PCR
Purification Kit (Qiagen Inc.).
Denaturing gradient gel electrophoresis
Approximately, 300–500 ng of amplicons from the
nested PCR were separated using a denaturing gradient
gel electrophoresis (DGGE) System (C.B.S. Scientific,
Del Mar, CA, USA) on a gel (0.75 mm thick,
15 cm 9 20 cm) by applying a double gradient of 7.5%
to 12% (w/v) polyacrylamide and between 20% and 60%
of denaturant [100% denaturant equals 7 M urea and
40% (v/v) formamide]. Electrophoresis was carried out
at 150 V for 13.5 h at 60 °C in 19 TAE buffer. Poly-
acrylamide gels were stained with SYBRTM Gold nucleic
acid gel stain (Invitrogen, Carlsbad, CA, USA) and
imaged using QUANTITY ONE 4.2 software to detect sepa-
rated amplifications products (bands) in the DGGE gels.
Individual DGGE bands were excised and rinsed in
100 lL sterile nuclease-free molecular grade water for
30 min. These gel plugs were used as template DNA in
a PCR reaction using cyanobacteria-specific primers 359F
and an equimolar mixture of reverse primers 781R(a)
and 781(b) using the amplification conditions described
previously. PCR products were re-analyzed by DGGE to
confirm single-band recovery, excised from the gel and
purified with the QIAquick PCR Purification Kit (Qia-
gen) prior to sequencing.
Phylogenetic and occurrence data analyses
Sequences were compared with sequences deposited in
GenBank using the Basic Local Alignment Search Tool
(BLAST-N) to determine the nearest relatives and percent
similarity (Altschul et al., 1997). All sequences were
checked for the presence of chimeras using Bellerophon
(Huber et al., 2004), accessed through the Greengenes
portal (DeSantis et al., 2006a). Sequences retrieved from
excised DGGE bands were grouped into 97% sequence
identity clusters and are referred to as operational taxo-
nomic units (OTUs). Cyanobacterial OTUs were classified
taxonomically according to Castenholz (2001).
Partial sequences were aligned using Greengenes’ NAST
alignment tool and imported into Greengenes May 2007
ARB database (DeSantis et al., 2006a,b) using ARB soft-
ware package (http://arb-home.de; Ludwig et al., 2004).
Affiliations of partial sequences were confirmed by the
addition to a Greengenes CoreSet tree consisting of full-
length sequences, without changing branch topology
using the parsimony insertion tool in ARB. The filter
‘lanemaskPH’ was used to ignore hypervariable regions of
the 16S rRNA molecule provided with the ARB database.
The phylogenetic tree was constructed by using maximum
likelihood method RAxML-VI-HPC under the GTRCAT
model of evolution (Stamatakis et al., 2008). The robust-
ness of inferred tree topologies was evaluated by boot-
strap analysis using 1000 replicates. Aquifex aeolicus, str.
VF5 was used as an outgroup and was subsequently
pruned from the tree.
To analyze the occurrence of various OTUs in samples
from different ponds and hot springs, UPGMA hierarchical
clustering analysis was performed with average linkage, and
Jaccard distance (Legendre & Legendre, 1998) using the
hierarchy module of the SCIPY package (v. 0.9.0) of the
Python programming language (Jones et al., 2001). To
© 2012 Blackwell Publishing Ltd
388 T. BOSAK et al.

identify cone- or mat-specific OTUs, the statistical signifi-
cance of the association of OTUs with morphology or
temperature was assessed separately for each OTU using a
two-sided Fisher’s exact test (Agresti, 1990), as imple-
mented in the statistical package of the R programming
language (v. 2.11.0), www.r-project.org. In this analysis,
temperature values were discretized to ‘hot’ (�30 °C) or
‘cold’ (<30 °C). Additionally, the dependence of the distri-
bution of OTUs on continuous temperature values was
assessed using logistic regression. Linear logistic regression
was also used to test the dependence of distribution of
OTUs on temperature. Dendrograms were generated using
UPGMA with average linkage.
Measurements of photosynthetic rates
Oxygen concentrations and photosynthetic rates were
determined using a Clark-type oxygen microsensor (OX-25
and OX-50; Unisense, Aarhus, Denmark) with a guard
cathode (Revsbech, 1989). Linear calibration of microsen-
sors was performed using air-saturated and anoxic pond
water. The diffusive flux of oxygen was calculated from
steady state oxygen microprofile using Fick’s first law of
one-dimensional diffusion (Jorgensen & Revsbech, 1985):
Jz ¼ De � dCz=dz;
where De is an effective diffusion coefficient and dCz/dz is
the slope of the microprofile at death z, De in the bacterial
colony was assumed to be 2.0 x 10�5 cm2 s�1 (Lassen
et al., 1998; Grotzschel & de Beer, 2002). Net photosyn-
thetic rates in individual layers were determined from the
balance between oxygen fluxes through the overlying and
underlying areas. The gross photosynthetic rate was
measured using oxygen microelectrodes and the light/dark
shift method (Revsbech & Jorgensen, 1983).
Enrichment cultures
Castenholz-D (Castenholz, 1988) agar plates (2%) were
scored with parallel lines using dry calcium alginate swabs
(Burton & Lee, 1978; Vaara et al., 1979), inocula from
Mound Spring 2008 were placed at the beginning of each
scored line and incubated for approximately 24 h at 45 °Cin a light gradient (from 13.9 to 12.8 lm photons m�2)
to enrich for phototactic, gliding cyanobacteria. The
migration of filaments was monitored by epifluorescence
microscopy as described previously. Single filaments that
had glided along the scored path were excised by a sterile
surgical blade and cultured in modified liquid Castenholz-
D medium at pH 8 (Bosak et al., 2009) containing auto-
claved silica sand (VWR International, Radnor, PA, USA).
This process was repeated 25 times. The liquid cultures
were grown with a fluorescent cold light source with a
12-h day, 12-h night cycle and the medium was exchanged
periodically. The purity of cultures was tested by plating
the culture onto 100% LB, 10% LB, and glucose/fructose
(5 mM final concentration) agar plates, microscopically,
and by the amplification of a single 16S rRNA gene from
biofilms grown in the liquid medium using universal bacte-
rial primers 27F (5′-AGA GTT TGA TCA TGG CTC AG-
3′) and 1492R (5′-TAC GG(C/T) TAC CTT GTT ACG
ACT T-3′) (Lane, 1991). The resulting enrichments were
characterized by microscopy and by a series of growth
experiments at various light intensities that encompassed
measurements of chlorophyll A and visual characterization
of cyanobacterial aggregation. Cyanobacteria enriched by
this process are described in Figs 5 and 6 as XAN-1, 8, 12,
and FYG.
Carbon isotope labeling
Individual cones and approximately 1 cm wide surround-
ing mats (as shown in Fig. 1D) were labeled in YNP using
a modified Castenholz-D medium (Castenholz, 1988;
Bosak et al., 2009) amended with sodium bicarbonate-13C
(98 atom%, Isotec, Inc., Miamisburg, Ohio). The total
H13CO�3 was 2.58 mM per labeling in 100 mL of the incu-
bation medium. All samples were incubated in YNP from
1 to 2 pm at ambient light intensity of approximately
1500 lE m�2 s�1, in the host spring at ambient pond
temperature (42 °C).
Transmission electron microscopy (TEM)
Isotopically labeled and unlabeled control samples were
fixed by 2.5% glutaraldehyde in 0.1 M sodium cacodylate
buffer (pH 7.4), washed with buffer, and post-fixed in 1%
osmium tetroxide and 1.5% potassium ferrocyanide. The
fixed samples were dehydrated through a gradient series
(30–100%) of acetone/water solutions and embedded in
epoxy resin (Epon). Ultrathin sections (70–100 nm) and
semi-thin sections (approximately 500 nm) were cut from
the resin blocks by using a Reichert-Jung Ultracut E ultra-
microtome (Reichert-Jung AG, Vienna, Austria) with a
Diatome diamond knife (Diatome AG, Biel, Switzerland).
The ultrathin sections were transferred onto 200-mesh Cu
TEM grids with Formvar-carbon support film for Nano-
SIMS-TEM correlation imaging. TEM was performed by a
FEI Tecnai 12 TEM (FEI Company, Eindhoven, the Neth-
erlands) equipped with a Gatan Bioscan CCD camera Model
792 (Gatan, Inc., Pleasanton, CA, USA). An accelerating
voltage of 120 kV was applied in bright-field mode.
Secondary ion mass spectrometry (NanoSIMS) mapping
Secondary ion mass spectroscopy (SIMS) imaging was per-
formed using a NanoSIMS-50 Ion Microprobe (Cameca,
© 2012 Blackwell Publishing Ltd
Cyanobacteria in hot spring coniform mats 389

Gennevillieres, France) operating in scanning mode. The
semi-thin sections (approximately 500 nm) were cut at the
same time as the ultrathin sections for observation in
TEM, providing complementary chemical information by
SIMS to the high spatial resolution structural information
by TEM.
A tightly focused, high-energy primary ion beam of Cs+
bombards the sample surface and generates negative sec-
ondary ions during the collision cascade. These secondary
ions are directed to a magnetic mass spectrometer that
ensures high transmission with a high mass resolution. The
parallel detection system allows the simultaneous recording
of up to five ion species, permitting reliable comparisons
between different ions, especially between isotopic ions
from the same microvolume. The primary beam, operated
in probe scanning mode, steps over the surface of the sam-
ple to create images of the selected ion species. In our
study, survey mosaic secondary ion images were generated
as 256 9 256 pixel rasters of 60 lm 9 60 lm pixels, with
the probe intensity of 5 pA and a typical probe size of
150 nm. To obtain high-resolution images of intracellular
details, the raster was reduced to 15–30 lm, with the
probe size smaller than 100 nm and an intensity of about
1 pA. Images were created for the following: 12C�, 13C�,12C14N�, 13C14N� and 32S�. Figures S2 and S3 provide
examples of survey mosaic images and position-dependent
high-resolution scans. The dwell time per pixel was 15 ms
for survey images and 30 ms for high-resolution images.
High mass resolution separated 13C14N� from the isobaric12C15N� species (Guerquin-Kern et al., 2005) and pre-
vented the mass interference from 11B16O� species. Com-
pared with ion species 12C� and 13C�, 12C14N� and13C14N� have higher intensities and are therefore both more
statistically reliable and better able to indicate carbon associ-
ated with biomass. Thus, the ratio (%) of 13C14N�/12C14N�
was used to track the relative carbon uptake (enrichment).
Color ratio images were generated in OpenMIMS, an IMA-
GEJ (Rasband, 1997–2006) plugin developed by Claude
Lechene’s Laboratory. OpenMIMS allows the visualization
of ratio value in a HSI (Hue-Saturation-Intensity) image
(Benson, 2003; Poczatek et al., 2009).
To calculate the average 13C14N�/12C14N� ratio in
the cells in each 60 lm 9 60 lm survey image, the
information pertaining to the microbial biomass
(enriched in 13C) has to be distinguished from the back-
ground resin (natural 13C abundance). The biomass has
a much higher CN� ion signal than the resin, allowing
the generation of a mask by adjusting the threshold level
on the sum image of 13CN� and 12CN�. The pixels in
the resulting binary mask image have values of 1 or 0,
corresponding to areas with and without cellular bio-
mass, respectively. The total number of pixels with the
value of 1 in the binary mask image was used as a mea-
sure of total cellular biomass. This binary mask image
was multiplied by the measured 13CN�/12CN� ratio
image to generate a 13CN�/12CN� ratio map, which
eliminated the resin background. This biomass ratio map
was used to calculate the net carbon uptake: the ratio
characteristic for the unlabeled controls (N = 3, numeri-
cal value 1.25%) was first subtracted from each pixel
value, and pixel values in thus corrected ratio of13CN�/12CN� were integrated over the entire13CN�/12CN� ratio map. To calculate the 13C enrich-
ment in individual filaments, we manually outlined indi-
vidual filaments in the biomass ratio map and integrated
the pixel values within the outlined area (ROI, region of
interest) after the subtraction of the unlabeled control
value (1.25%). Only distinctly filamentous cells were
selected for this analysis to avoid bias caused by the
random truncation during sectioning.
RESULTS
Environmental parameters at sampling sites
Coniform mats in YNP form in quiet ponds and other sur-
face depressions where the flow is low (such as buffalo
steps) and the pH is alkaline (pH > 8) (Fig. 1A,B,
Table 1). The water level in the outflow channels in 2009
was low, periodically exposing some mats and covering
others by only a thin film of water (Table 1). The tempera-
ture of the water around sampled coniform mats varied
from 22.0 to 51.3 °C (Tables 1 and 2) and the flow on
the surface was detectable only in two ponds in Mound
Spring (44.6 and 55.3 °C). Coniform mats around Mound
Spring in September 2008 were submerged under 2–4 cm
of warm water (40–45 °C).
Morphology and ultrastructure of cyanobacteria in cones
and mats
Filaments in the dense thin laminae of cones were nearly
parallel to the growth surface (Fig. 1C,E), whereas those
in the porous thick laminae were sparsely distributed and
randomly oriented with respect to the growth surface
(Fig. 1C,E). Thick, porous laminae were rare or absent
from the more heavily lithified adjacent horizontal mats
(Fig. 1F), where many degraded cells and cells encrusted
by silica were present (Figs S1–S3).
Cones sampled in 2008 contained various morphologi-
cally distinct cells that exhibited chlorophyll a autofluores-
cence (Fig. 3A), as well as <0.8-lm-thick filaments similar
to those of Roseiflexus- and Chloroflexus-like organisms
(Figs 3A and S4; Pierson & Castenholz, 1974; Pierson
et al., 1985; Hanada et al., 2002). The most abundant
cyanobacteria in the thin and thick laminae of cones were
>100-lm-long filaments composed of 0.8–1 lm wide and
2–3-lm-long rectangular cells. These cells contain 3–4
© 2012 Blackwell Publishing Ltd
390 T. BOSAK et al.

peripherally arranged thylakoids, approximately 150–750-
nm-wide subterminal granules (Nash, 1938) and cell walls
that were commonly surrounded by fibrous mucilage. The
terminal cells in some filaments were spear shaped (Figs 3C
and 4A). These cells were less common in the tips of cones
from Mound Spring that were sampled in 2009. YNP
cones from 2008 and 2009 also contained sausage-shaped
0.9–1.2-lm-wide and 3–5-lm-long cells with 3–4 periph-
erally arranged thylakoids, intracellular granules (150–
300 nm in diameter) and cell walls surrounded by fibrous
mucilage (Fig. 3D). These sausage-shaped cyanobacteria,
similar to Synechococcus sp. (e.g., Jones et al., 1998; Can-
non et al., 2001; Castenholz, 2001), were very abundant
in the intermittently exposed tips of cones from 2009
(Fig. 3D), and rare in the tips of permanently submerged
cones from 2008. The silicification of the sticky matrix
between these cells in cone tips (Fig. 3D) was likely pro-
moted by the evaporation in the thin film of water or dur-
ing periodic exposure (Table 1), but was still less heavy
than the silicification in mats sampled in 2008. The
approximately 0.8-lm-wide filaments and the 1 9 3 lm,
sausage-shaped cells actively took up inorganic carbon
(Fig. 4) and lacked the orange autofluorescence of phyco-
erythrin. This autofluorescence was instead observed within
some relatively rare, 2-lm-wide oval cyanobacteria mor-
phologically similar to Synechococcus (Fig. 3E). These oval
or round cyanobacteria occurred only individually in cones,
primarily on the very surface, but were more common in
the adjacent topographic lows (Figs 4C,D and S2).
Numerous ghosts of lysed cells and silica-encrusted cells
were present in the topographic lows (Figs 1 and S1–S3).
More extensive degradation of cells in mats also was
reported by Walter et al. (1976).
Molecular diversity of cyanobacteria in cones and mats
Sequences of cyanobacterial 16S rRNA genes in field sam-
ples of coniform mats from four different thermal features
and from two different years attested to the contribution
of a number of genetically distinct cyanobacteria to the
construction and the interannual persistence of modern
conical stromatolites (Fig. 5). The 33 samples from 2009,
each consisting of a cone and the adjacent mat, contained
a total of 18 different operational taxonomic units (OTUs)
forming two clusters similar to filamentous Leptolyngbya
(Fig. 5). Also present were 13 OTUs similar to the 16S
rRNA genes of cyanobacteria from cultured representatives
of Synechocystis and Synechococcus genera (Fig. 5). The PCR
amplification method using primers specific to cyanobacte-
ria also detected an unaffiliated OTU (OTU 6) similar to
candidate division SR1 (Fig. 5, Davis et al., 2009) and
Acidobacteria (not included in the phylogenetic tree).
Table 2 summarizes the observed distribution of OTUs
in the sampled ponds. More detailed description of the
occurrences with respect to individual ponds, temperatures
and morphologies (cones or mats) also can be seen in Figs
Table 2 Distribution of operational taxonomic
units (OTUs) in the ponds of Mound Spring
(MS), the Bulgers (BG), Bison Spring (BS), and
Flat Cone (FC)
OTU cluster OTU
Number of ponds in each spring
where OTU was present
OTU temperature
range (°C)
Subsection III filamentous,
non-heterocystous
1 MS(5), BG(3), BS(1) 30.0–44.6
2 BG(5) 30.0–42.1
3 MS(4) 32.5–51.3
4, 9, 29 FC(1) 22.2
5 BS(1) 35.4
18 MS(6), BG(5), BS(2), FC(1) 22.2–51.3
32 MS(6), BG(5), BS(1), FC(1) 22.2–51.3
19 MS(3), BG(4), BS(2), FC(1) 22.2–47.4
20, 21,23,24 MS(6), BG(5), BS(2), FC(1) 22.2–47.4
22 MS(5), BG(4), BS(2), FC(1) 22.2–47.4
28 BS(2) 35.4–47.4
30 BS(1) 35.4
31 MS(3) 32.5–51.3
Subsection I Synechocystis-like 7 MS(5), BG(1), FC(1) 22.2–51.3
8 BG(1) 30.0
Subsection I Synechococcus-like 10, 13, 15, 16 BG(1) 30.0
11 MS(5), BG(3), BS(2), FC(1) 22.2–51.3
12 MS(6) 32.5–51.3
14 MS(1) 36.2–40.2
17 MS(1) 32.5
25 MS(4) 34.0–51.3
26 BG(3) 30.0–42.1
27 MS(1) 40.2–51.3
Other (Acidobacteria) 6 MS(5), BG(4), BS(1), FC(1) 22.2–51.3
© 2012 Blackwell Publishing Ltd
Cyanobacteria in hot spring coniform mats 391

S5 and S6. Cones contained 2–10 OTUs from cyanobac-
terial Subsection III (‘filamentous, non-heterocystous’; Ca-
stenholz, 2001) and 0–3 of the ‘unicellular’ Synechococcus-
or Synechocystis-like OTUs from Subsection I (Castenholz,
2001), whereas the adjacent mats contained 0–5 OTUs
from Subsection III and 0–5 unicellular OTUs (Fig. S6).
Eight OTUs from the larger Leptolyngbya-like Subsection
III cluster, (OTU 18–24, 32), occurred in samples from
all hot springs (Table 2). Two of these ubiquitous OTUs
(19, 22) occurred primarily in cones (P = 0.0001, Fisher’s
exact test, Fig. S6) and four (20, 21, 23, 24) almost always
occurred together in cones and mats (Fig. S5, Jaccard simi-
larity indices higher than 0.7). In fact, the presence or
absence of these four OTUs defined the two major spatial
clusters of cyanobacterial diversity (Fig. S5). The larger
Subsection III cluster also contained sequences that were
detected only around individual hot springs (Table 2). Var-
ious motile filamentous cyanobacteria from our laboratory
enrichment cultures grouped with this cluster. Some
cyanobacteria in these laboratory enrichment cultures
(XAN-1 and XAN-12) formed cones under all growth con-
ditions, while others (XAN-8) did not (Fig. 6). Also present
in nearly all ponds was a sequence (OTU 1) from the smal-
ler Subsection III cluster (Fig. 5, Table 2) that occurred
primarily in cones (P = 0.001, Fig. S6). This sequence was
similar to a filamentous cyanobacterium forming porous
tubes and films in our laboratory enrichment cultures
(FYG, Figs 5 and 6), and to the only OTU from Subsection
III that was detected in coniform mats around Black
Sands Pool (Lau et al., 2005). Other sequences from
this cluster (OTU 2, 3, 9) were detected both in mats
and in cones, but only in individual hot springs (Table 2,
Fig. S5).
Operational taxonomic units similar to 16S rRNA gene
sequences of unicellular cyanobacteria were absent from
more than 50% of the cones from 2009, but were detect-
able in 75% of the mats (all data shown in Fig. S6). These
OTUs varied spatially, with only two detected in more
than one spring (OTU 7, 11) and eight detected only in
single samples of mats or cones (Table 2, Fig. S5). OTU
11, exhibiting the highest similarity to Synechococcus C9
and to a sequence previously reported in the mats sur-
rounding YNP cones (Lau et al., 2005; Fig. 5), was
detected primarily in mats (P = 0.0001, Fig. S6). OTUs
12–17 are most similar to Synechococcus P1 and to
sequences previously detected only in mats surrounding
the YNP cones (Lau et al., 2005). In contrast to the previ-
ous report, we detected at least some of these OTUs in
cones (e.g., OTU 12, 13). Other unicellular OTUs (25–
27) were similar to Synechococcus sp. clone JulG-B6 and
Synechocystis (OTU 7, 8), and were present in both mats
and cones.
All major cyanobacterial clusters from 2009 were also
represented by 16S rRNA sequences detected in five
D
A
D
B
E
F
Fig. 4 Carbon uptake by cells in Yellowstone National Park (YNP) cones and mats mapped as 13CN�/12CN�. All samples were collected and incubated with
labeled carbon in 2008. Relative enrichment levels above the 1.25% threshold abundance in all panels are shown on the same HSI color scale. (A) High-
resolution map of a typical spear-tipped cell from the tip of a YNP cone incubated for 30 min. Arrow points to granules with a high 13CN/12CN� ratio.
(B) High-resolution map of typical filamentous cells approximately 150 lm below the tip of a YNP cone incubated for 60 min. (C) High-resolution map of an
oval Synechococcus-like cell below the upper 0.3 mm of the YNP mat incubated for 30 min. Cells with this morphology, also shown in Fig. 3(E), are not
abundant. (D) High-resolution map of a large oval cell from the YNP mat incubated for 60 min. This morphology occurs sporadically. (E) An unlabeled long
thin filament (arrow) from a YNP cone incubated for 60 min (enlarged from a lower resolution map, see Materials and Methods). This filament is similar to
the thinnest filaments in Fig. 3A. See Fig. S4 for more examples of this morphology and its carbon uptake. (F) High-resolution map of typical sausage-shaped
cells approximately 320 lm below the tip of a cone incubated for 60 min. Arrow points to granules with a high 13CN/12CN�.
© 2012 Blackwell Publishing Ltd
392 T. BOSAK et al.

samples of cones and mats from one pond fed by Mound
Spring in 2008 (Fig. 5). The samples from 2008 contained
sequences from the larger Subsection III cluster, one
sequence from the smaller Subsection III cluster and three
sequences similar to those of unicellular cyanobacteria from
Subsection I (Fig. 5). However, none of the field samples
from 2008 contained the co-occurring OTU 20, 21, 23,
24, although these OTUs were present in all examined
ponds in 2009 (including Mound Spring). Furthermore,
unicellular sequences were detected only in one of five
mats sampled in 2008. Therefore, similar core cyanobacte-
rial clusters contributed to the growth of cones in 2008
and 2009, but individual sequences representing these
clusters in Mound Spring varied between the 2 years. Fac-
tors responsible for these variations remain unknown and
may include both lower temperatures of some ponds in
Mound Spring in 2009 (Tables 1 and 2), and different
hydrological conditions in Mound Spring between 2008
and 2009 (Table 1).
Cyanobacterial activity in cones and surrounding mats
To quantify the differential accumulation of biomass in
mats and cones, we examined the photosynthetic activity at
the approximately 100-lm scale using microelectrodes.
The highest net photosynthetic rates in coniform mats
occurred in the upper 0.5 mm of the cones (Fig. 7). The
ratio of respiration to gross photosynthesis was
Fig. 5 Operational taxonomic units (OTUs) of cyanobacteria and environmental samples from coniform mats in Yellowstone National Park (YNP) were
inserted into pre-established phylogenetic tree of full-length 16S rRNA gene sequences in Greengenes database in ARB. Numbers on branches indicate boot-
strap values obtained by RAxML. Sequences from denaturing gradient gel electrophoresis (DGGE) bands were grouped at 97% sequence similarity threshold.
Sequences from enrichment cultures were left as unique sequences. Green and blue text represents sequences of cyanobacteria that do or do not form cones,
respectively, in laboratory enrichment cultures. Boldface OTU# represents cyanobacterial sequences from samples collected in 2009, whereas 2008_MS and
DGGE sequences represent sequences from samples collected in 2008. Italicized text (gel band) are cyanobacterial sequences previously identified in coniform
mats (Lau et al., 2005). Accession numbers of GenBank entries are listed after the names of the corresponding organisms, gel bands or clones. Yellow panel
denotes Synechococcus-like sequences, green panel denotes filamentous Leptolyngbya-like cluster, and blue panel denotes unicellular sequences similar to
Synechocystis. Only bootstrap values larger than 50% are shown.
© 2012 Blackwell Publishing Ltd
Cyanobacteria in hot spring coniform mats 393

0.91 ± 0.08 (N = 3) in the upper 0.5 mm of the cones
and 1.03 ± 0.02 (N = 3) in other regions, pointing to
more vigorous organic degradation in the interiors of
cones and mats. To further link these variations to the
activities and densities of individual cyanobacterial cells in
cones and mats, we conducted labeling experiments using
inorganic carbon and nano-scale Secondary Ion Mass Spec-
troscopy (NanoSIMS) imaging. The use of 13C-labeled
bicarbonate as a carbon source identified active primary
producers and tracked their distribution and densities in
different parts of coniform mats (see Fig. S2 for an exam-
ple of the data).
As indicated by the TEM analyses, both filamentous and
sausage-shaped cyanobacteria contained inclusion bodies
that likely represent some form of carbon concentrating
granules (Fig. 3C,D). Indeed, after a 30-min incubation
with 13C-bicarbonate, these granules were the most promi-
nent loci containing detectable labeled carbon in the
uppermost 120 lm of the cone (Fig. 4A). Some label was
also present in the filament sheaths at 130 lm below the
cone tip (Fig. S7A), but was absent from most other fila-
mentous and sausage-shaped cells in the cone and in the
mat. The less abundant, round and oval cyanobacterial cells
in the mat exhibited a faster response to the influx of car-
bon than the immediately adjacent filamentous and sau-
sage-shaped cells, because they contained uniformly
distributed 13CN� even after 30 min (Fig. 4C). The rather
slow response of the abundant filamentous and sausage-
shaped cells to the influx of labeled carbon did not reflect
the time required to synthesize the carbon concentrating
granules, because abundant, morphologically identical
granules were present in the cells from untreated and unla-
beled samples (Fig. 3C,D).
After a 60-min incubation, the label was distributed
throughout filamentous and elongated cells in cones and
mats (Fig. 4B). Most new inorganic carbon was present in
the 100-lm-thick region below the uppermost 90-lm layer
of the cone (Fig. 8A). The uptake of 13C between 90 and
150 lm in the cone was 1.5 times higher than the uptake
at the very surface, and more than four times higher than
the uptake below the top 0.1 mm of the mat (Fig. 8A).
This was owing primarily to the large density of active
cells, rather than to the higher activity of individual cells in
the tip of the cone (Fig. 8B). The uptake of labeled carbon
below the surface of the cone decreased with depth
(Fig. 8A). This profile arose from the decreasing density of
active cells within the upper 500 lm and not from the
decreasing activity of individual cells with depth (Fig. 8B,
C). Cells in the uppermost 90 lm of the cone departed
from this trend, because individual filaments incorporated
lower amounts of label and the overall cell density was
lower than in the underlying region (Fig. 8B,C).
Xan-8Xan-1
Xan-12 FYG
Fig. 6 Vertical aggregation in enrichment cultures of motile filamentous cyanobacteria from YNP. Vertical structures in the cultures of XAN-1 contain approx-
imately 0.5 mm wide dense central aggregates draped by filmy biofilms on the side. XAN-12 filaments are brown, exhibit possible phycoerhythrin autofluo-
rescence, and form lawns of filmy vertical structures. XAN-8 forms horizontal filmy mats that enclose numerous bubbles (arrows). FYG forms filmy structures
and is present in various vertical structures (Bosak et al., 2009, 2010). Scale bar: 4 mm.
–4.5
–4
–3.5
–3
–2.5
–2
–1.5
–1
–0.5
0
–2.00 –1.00 0.00 1.00 2.00 3.00 4.00
dept
h (m
m)
nmole O2 cm–3 sec–1
Photosynthetic net production rate
cone
mat
Fig. 7 Photosynthetic net production rate measurements in cones and mats
from YNP. Profiles of net photosynthetic rates (average, N = 3) in the top
4 mm of cones and top 2 mm of the adjacent mats. All measurements
were performed between 11 am–2 pm in September 2008 and late August
2009 at the light intensity of approximately 1500 lE m�2 s�1. The photo-
synthetic rate in cones is nearly constant from 11 a.m. until dusk.
© 2012 Blackwell Publishing Ltd
394 T. BOSAK et al.

All parts of mat contained less cellular biomass than the
cone and the amount of labeled carbon in cells in the mat
decreased with depth, with the possible exception of the
very surface (Fig. 8A,B). Active round cells (Fig. 4D)
accounted for the threefold increase in the amount of
labeled carbon and biomass at approximately 100 lmbelow the surface (Fig. 8A,B), but similar cells were rare in
another isotopically examined mat from the same pond
incubated for 30 min. Thus, the topographic lows were
laterally heterogeneous, supported smaller active popula-
tions of cyanobacteria and exhibited visual and chemical
evidence of organic degradation and heavy silicification
(Figs 1, 7 and S1–S3).
DISCUSSION
Microbial communities in cones and mats
The shapes and the internal textures of modern conical mi-
crobialites ultimately preserve little information of the
instantaneous molecular diversity and the complexity of
microbial interactions. These interactions, however, ensure
the persistence of stromatolite-forming communities over
timescales necessary to attain macroscopic sizes and turn to
rock. Our study reveals a previously unrecognized and spa-
tiotemporally variable composition of cyanobacterial com-
munities in coniform mats in YNP, demonstrates different
cellular activities in topographic highs and lows, and hints at
factors responsible for the persistence of coniform mats over
seasonal and yearly timescales. The molecular diversity of
these cyanobacteria varies among cones and mats within the
same pond, among different ponds and hot springs
(Table 2), and between two successive sampling years
(Fig. 5). In the broadest sense, these findings are consistent
with the previous reports of morphologically similar fila-
mentous cyanobacteria in cones and mats (Walter et al.,
1976; Brock, 1978; Cady & Farmer, 1996; Jones et al.,
1998, 2002), and of morphologically more diverse cyano-
bacteria in the mats (Walter et al., 1976; Brock, 1978).
Unlike previous studies, the findings presented here sug-
gest that cyanobacteria responsible for the formation of
cones in YNP cannot be described as a single species (Wal-
ter et al., 1976), characterized by a single 16S rRNA
sequence from Subsection III (Lau et al., 2005), or by an
unchanging group of cyanobacterial 16S rRNA sequences
(Lau et al., 2005).
Cyanobacterial 16S rRNA sequences from coniform
mats around four different hot springs in Sentinel
Meadows in 2009, a single hot spring sampled in 2008
and 2009, and from another thermal area (Lau et al.,
2005) form clusters. As a whole, these clusters are well
represented across space and time. However, the diversity
of sequences within individual clusters and samples may, in
part, depend on the hydrological conditions. These
Net uptake (integrated 13CN-/12CN- pixels)
Biomass (integrated pixels with 13CN-/12CN- > 0.1)
13CN-/12CN-
C
A
B
Fig. 8 Uptake profiles of labeled carbon in a cone and a mat as a function
of depth. Data points from the cone are indicated by black circles and those
from the mat are indicated by open circles. The uptake of labeled carbon
was determined using high-resolution Nano-SIMS on a 60 lm 9 60 lm,
256 9 256 pixels survey map (see Fig. S2 for examples). (A) Integrated
pixel values of in cones and adjacent mat as a proxy for the net uptake of
carbon. Only pixels with 13CN�/12CN� values > 1.25% were integrated.
(B) Biomass (integrated pixels with 13CN�/12CN�values > 0.1) in the cone
and the mat. (C) Profile of average 13CN/12CN� ratios in individual fila-
ments (N = 10–30 cells per data point) from the tip to the interior of the
cone and the mat (N = 3 cells per data point, where the section allowed
recognition of enough filaments).
© 2012 Blackwell Publishing Ltd
Cyanobacteria in hot spring coniform mats 395

conditions would stress communities in ponds with oscil-
lating or rather low temperatures (Tables 1 and 2) and
communities in temporarily exposed mats (Rothrock &
Garcia-Pichel, 2005). Coniform mats are generally absent
from ponds colder than approximately 30 °C and warmer
than approximately 55 °C (e.g., Walter et al., 1976; Jones
et al., 2002) and Synechococcus-like unicells are the domi-
nant cyanobacterial ecotypes above approximately 48 °C(Ferris & Ward, 1997). Therefore, one may expect differ-
ent cyanobacterial populations in coniform mats exposed
to temperatures below 30 °C and above 45 °C than in
coniform mats growing permanently within this tempera-
ture range. Our current dataset does not support statisti-
cally significant relationships of any OTUs with
temperature within the observed range (22–51 °C). Some
possible differences among samples at the lower and the
higher end of this temperature range include the presence
of three unique OTUs from Subsection III in the coldest
pond (Table 2), the absence of cone-specific and ubiqui-
tous OTU1 at the lowest and the highest temperatures,
respectively, and the absence of otherwise ubiquitous
OTUs 20, 21, 23, 24 from the warmest pond (Table 2,
Fig. S5). At present, these differences remain speculative
because the dataset contains samples from only one pond
below 30 °C and from only one pond above 47 °C,respectively. Analyses of more samples from temperatures
higher than 48 °C and lower than 30 °C, and from more
hydrologically stable hot springs elsewhere in YNP could
test these suggested trends in a statistically meaningful
manner.
The sampling and processing methods used here average
the cyanobacterial diversity over entire cones and entire
mats, painting a picture in which cyanobacteria with similar
or identical 16S rRNA sequences exhibit measurable
topography-dependent differences in growth, activity and
aggregation (Figs 8 and S6). This picture is consistent with
laboratory observations of cone formation in the cultures
of filamentous cyanobacteria that were enriched from field
cones (XAN-1 and XAN-12 in Fig. 6). These cyanobacteria
grow at different rates in cone tips, between mm- to cm-
tall cones and on cone sides (Petroff et al., 2011), giving
rise to laminated pinnacles in highly enriched laboratory
cultures. Other thin and motile filamentous cyanobacteria
enriched from field cones appear to be incapable of initiat-
ing cone formation under identical growth conditions
(XAN-8 in Fig. 6), although their 16S rRNA sequences
are very similar to those of known cone formers (XAN-1)
and various field OTUs (Fig. 5). Therefore, the diversity of
field OTUs likely reflects a number of cyanobacteria capa-
ble of cone formation, as well as some that cannot initiate
this process but can aggregate into rather flat, tightly
woven mats (XAN-8 in Fig. 6), or into thin tubular struc-
tures and finely woven floating films (FYG in Fig. 6, after
‘filamentous yellow glider’, Bosak et al., 2009, 2010).
These organisms may contribute to the complex morpho-
logies of coniform mats in the field, which often include
filmy, draping, laminated bridges.
Three ‘filamentous’ cyanobacterial OTUs from YNP
cones are cone-specific and one ‘unicellular’ OTU is mat-
specific, suggesting that some cyanobacteria are uniquely
adapted to microenvironments within macroscopic cones
and mats. Adaptations to the varying intensities and quali-
ties of light and different aggregation behaviors also may
underpin the diversity of the four co-occurring OTUs
found in many, but not all, cones and mats (OTU 20, 21,
23, 24). Alternatively, this diversity may arise from random
fluctuations within the rapidly growing thin layers (Figs 7
and 8) that maintain sectors populated by like individuals
even when these individuals carry neutral mutations (Hal-
latschek & Nelson, 2010; Mitri et al., 2011). Given that
16S rRNA sequences are but a limited measure of the
underlying genetic and the physiological diversity (e.g.,
Moore et al., 1998; Ward et al., 2006), the differences
among cyanobacteria from Subsection III in coniform mats
may be better resolved by examining longer 16S rRNA
sequences, amplifying various functional genes, and analyz-
ing the distribution of OTUs at finer spatial scales within
cones and mats.
Thin filamentous cyanobacteria are commonly thought
to be conditio sine qua non for the formation of cones, but
these structures also contain metabolically active and abun-
dant unicellular cyanobacteria (Figs 4 and 5) and thin fila-
ments that may belong to Chloroflexus- and Roseiflexus-like
photosynthetic bacteria (Figs 4E and S4). Our analyses do
not identify any of the unicellular cyanobacterial OTUs as
cone-specific, in contrast to previous suggestions (Lau
et al., 2005). Instead, these OTUs vary among hot
springs, ponds, among samples from individual ponds and
in time (Figs 5 and S6). This variation may arise as a result
of the occasional colonization of coniform surfaces by
cyanobacteria from other areas in hot springs. These colo-
nizers may form patchily distributed small populations
(Papke & Ward, 2004). The common occurrence of sau-
sage-shaped cyanobacteria in old, decaying coniform mats
in the laboratory further points to the ability of these
organisms to grow when cone-forming filamentous cyano-
bacteria do not. Different abundances of individual unicel-
lular OTUs are thus to be expected in actively growing,
lithifying, or decaying coniform mats. Samples from more
points in time and space would also help distinguish organ-
isms that actively shape coniform mats from organisms that
colonize previously formed topography, but are unable to
either initiate or maintain cones and the depressions
between cones over longer timescales. Such colonization
may account for the abundance of sausage-shaped cells in
the tips of lightly submerged cones sampled in Mound
Spring in 2009 (Fig. 3D), given that mainly thin filamen-
tous cyanobacteria could be identified in the tips of fully
© 2012 Blackwell Publishing Ltd
396 T. BOSAK et al.

submerged cones from Mound Spring sampled in 2008
(Fig. 3B).
Thin filaments of Chloroflexus- or Roseiflexus-like organ-
isms are commonly seen in field cones (Fig. 4E), but are
generally absent from laboratory cultures. When growing
in cyanobacterial mats, these organisms can be photohet-
erotrophic or photoautotrophic (e.g., van der Meer et al.,
2003, 2005) and can contribute to the formation of lami-
nae (Doemel & Brock, 1974). Their contribution to the
uptake of inorganic carbon in YNP cones is thought to be
small (Walter et al., 1976; Brock, 1978). Indeed, Nano-
SIMS maps and the accompanying TEM images reveal lit-
tle labeled carbon in the thin filaments in field cones, even
when these filaments are surrounded by highly enriched
cyanobacterial cells (Fig. S4). Thin filamentous photo-
trophs are thus not the main loci of primary production
during the main photosynthetic period, but our current
data cannot distinguish between their slow autotrophy and
photoheterotrophic uptake of labeled cyanobacterial
exudates produced during the 60-min incubation.
Metabolic potential and function of these thin filaments in
coniform mats can be probed in more detail by tracking
the distribution of labeled carbon over longer times
through high-resolution ultrastructural and NanoSIMS
maps (Fig. S4B,C). These measurements should be accom-
panied by measurements of bulk dissolved organic carbon
and 13C-labeled glycolate and should be conducted at
different times of day, including periods of low light (van
der Meer et al., 2005).
Carbon uptake and cone growth
Measurements of 13CN� allow comparisons of the uptake
of inorganic carbon among different cells within the same
layer of the mat. This method underestimates the rate of
the uptake of inorganic carbon because it does not account
for the supply of 12CN� produced by the remineralization
of unlabeled organic material. However, the recycling of
carbon should not affect the observed relationship between
cell densities and the position in the mat (Petroff et al.,
2011). Field cones (Fig. 8) and laboratory-grown cones
(Petroff et al., 2011) exhibit similar profiles of the uptake
of carbon with depth. These profiles match the model pre-
dictions for biofilms whose growth is limited by the diffu-
sion of nutrients from the overlying stratified solution
(Petroff et al., 2011). This model predicts the highest den-
sity of active cells in cone tips, because these areas are the
closest to the overlying source of nutrients (or light) and
are curved. More filaments thus compete for nutrients (or
light) in areas of high cell density (cone tips). The YNP
cones, which grow at high light intensities
(>1500 lE m�2 s�1), depart from the light-limited or
nutrient-limited model in the uppermost approximately
100-lm-thick layer (Fig. 8A). This region contains fewer
cells and individual filaments there take up less carbon than
those in the dense active layer below the upper 100 lm.
In contrast, the uptake of labeled carbon in laboratory
cones grown at 200 lE m�2 s�1 is the highest at the very
surface (Petroff et al., 2011). The somewhat lower activity
of filaments at the surface of field cones may be attributed to
photorespiration and the faster recycling of organic carbon,
but it does not support the migration of light-limited
growth phototactic cyanobacteria toward topographic
highs (Walter et al., 1976). Because the very tip contains
few degraded cells and ghosts, the faster recycling of
carbon in this region should stem primarily from the
microbial degradation of extracellular substances and
photorespiration (Bateson & Ward, 1988), rather than
from the lysis of inactive cells.
Small-scale isotopic labeling and mapping reveals dif-
ferences in cyanobacterial responses to the influx of inor-
ganic carbon and nitrogen, potentially limiting nutrients
within YNP cones (Wiegert & Fraleigh, 1972; Jahnke
et al., 2004; Lolacono et al., 2012). Not only are fila-
mentous cyanobacteria in cones able to extend across
diffusive gradients and access nutrients in the overlying
solution, but these organisms in cones and mats also
concentrate carbon and nitrogen in approximately 300–
750 nm large granules (e.g., polysaccharides or cyano-
phycin). The ability to concentrate carbon and nitrogen
may confer an advantage during growth under nutrient-
limiting conditions (Shibata et al., 2001; McGinn et al.,
2003). The large round photosynthetic cells below the
surface of the horizontal mats respond to the influx of
carbon and nutrients faster than the filamentous and sau-
sage-shaped cyanobacteria, have a laterally discontinuous
distribution, and occur below the upper 150 lm of the
mat. These observations suggest that the oval cells grow
sporadically during nutrient pulses and are adaptated to
lower light intensities. Our current experiments track the
initial incorporation and distribution of labeled inorganic
carbon in the cells of primary producers, but do not
determine the longer-term fate of the newly synthesized
organic carbon. The latter may critically influence the
preservation of coniform mats and their robustness because
the abundance of excreted substances (i.e., extracellular
biomass) may distinguish the sturdy, cohesive cones in the
field from the often filmy, internally porous, transparent
structures in the highly enriched laboratory cultures
(Fig. 6). The extracellular compounds contain less nitro-
gen and sulfur relative to cellular biomass and, with the
possible exception of cyanobacterial sheaths (Fig. S7), may
not be detectable as CN� ions by NanoSIMS (Figs 4 and
S2). Future studies can investigate these processes by fol-
lowing the production and distribution of new cellular
biomass and exopolymeric substances, the flow of carbon
from primary producers to other organisms, and total
microbial diversity in coniform mats.
© 2012 Blackwell Publishing Ltd
Cyanobacteria in hot spring coniform mats 397

Growth and preservation of cones by silicification
The topography-dependent and temporally variable
growth of coniform mats in modern hot springs leads to
the formation of porous and dense laminae, textural dif-
ferences between cones and mats, and distinct macro-
scopic topography. Cones contain more porous laminae
formed by filaments that are oriented randomly or are
perpendicular with respect to the growth surface. Recent
studies report that these orientations occur primarily in
actively photosynthesizing, diffusion-limited mats (Petroff
et al., 2010). Structures that form under light-limited
conditions, where diffusion limitation should be less pro-
nounced, contain thin, dense laminae of mutually aligned
prostrate filaments (Bosak et al., 2009). Thus, the higher
availability of nutrients at cone tips in stratified solutions
(Jorgensen & DesMarais, 1990) and the depletion of
these nutrients within the mat (Petroff et al., 2011) may
promote the growth of cone tips and lead to the forma-
tion of porous laminae characterized by less abundant
cells and more abundant exopolymeric substances (Fig.
S7). Textural record of these topography-dependent and
time-dependent processes can be preserved by precipitat-
ing silica. In some flat laminated microbialites, actively
growing microbes outpace silicification, giving rise to
porous laminae encrusted by silica, whereas biomass-poor
and silica-rich laminae form in autumn/winter when the
growth is slow and microbes are unable to outpace silic-
ification (Konhauser et al., 2001, 2004). In keeping
with this model, the sparse and more heavily encrusted
cells in the topographic lows of coniform mats may be
attributed to the slower accumulation of biomass in
topographic lows relative to mineral precipitation. Con-
versely, the fast accumulation of biomass in actively
growing cone tips outpaces mineral precipitation and
results in unmineralized or only lightly mineralized cells.
These preservational mechanisms in coniform mats can
give rise not only to the alternating cell-rich and cell-
poor laminae driven by seasonal variations in growth, as
is the case in stratiform microbialites (Konhauser et al.,
2001), but also to the laminae produced by the more
rapidly varying orientation of cyanobacterial filaments in
cones (e.g., Walter et al., 1976; Petroff et al., 2010).
All cones shown and analyzed in this study were, at
best, lightly mineralized, and their fine organic laminae
may not be preserved by silicification. This does not
diminish the value of these coniform mats as model sys-
tems in which to study biological aspects of stromatolite
morphogenesis, as faster silicification has the potential to
preserve small-scale textures in cones from some less
accessible localities in YNP (e.g., Fig S3A–C in Bosak
et al., 2009). A more critical difference between modern
coniform mats and ancient conical stromatolites is min-
eralogical: most modern small cones are preserved by
silicification, but ancient cones were preserved primarily
by calcium carbonate. Therefore, direct insights into
stromatolites as records of past chemical conditions and
possible influences of microbial metabolisms on carbon-
ate precipitation require more studies of the growth and
preservation of coniform mats in carbonate-precipitating
environments.
CONCLUSIONS
Filamentous cyanobacteria build the vertical scaffolding
of conical microbialites that grow in the shallow pools of
modern alkaline hot springs. These organisms are present
throughout the cones and the adjacent horizontal mats,
and most of their 16S rRNA gene sequences are not
specific to either cones or mats. Field sequences of fila-
mentous cyanobacteria in coniform mats belong to two
principal clusters and have cultured representatives that
form vertical structures in highly enriched laboratory cul-
tures. Cyanobacterial sequences vary among different hot
springs, among ponds in the same hot spring, and even
in one location between two sampling years. Therefore,
the growth of modern conical microbialites depends on
a number of genetically distinct filamentous cyanobacteria
rather than a single organism or an unchanging group
of organisms. Unicellular sequences in coniform mats
vary even among samples from the same pond and are
often undetectable, although photosynthetically active
Synechococcus-like cyanobacteria are present in cones.
Most new cellular biomass in cones grows in the tips,
but not at the very surface. In mats, the very surface is
both the densest and the most active growth layer, while
organic degradation is prevalent in the mat interior.
There, cyanobacteria in hot spring coniform mats mor-
phologically diverse and photosynthetically active unicel-
lular cyanobacteria quickly respond to nutrient pulses,
but are unable to extend across diffusive gradients and
form cohesive porous laminae.
ACKNOWLEDGMENTS
We thank G. Geesey (U. Montana), S. Gunther (NPS),
J. Thompson (MIT), L. Casillas (Univ. PR), D. Newman
Lab (MIT), J. Holz and N. Watson (Keck Biological Imag-
ing Facility, Whitehead Institute, MIT), members of the
MIT Laboratory for Geomicrobiology and Microbial Sedi-
mentology and Dr. S. K. Sears (McGill Univ.). H.V.
acknowledges financial support from the Natural Sciences
and Engineering Research Council (NSERC) of Canada.
We also thank the PICT-IBiSA imaging facility in the
Institut Curie for NanoSIMS analyses. Thoughtful
comments by three anonymous reviewers improved the
manuscript.
© 2012 Blackwell Publishing Ltd
398 T. BOSAK et al.

REFERENCES
Agresti A (1990) Categorical Data Analysis. John Wiley & Sons,
Inc., Hoboken, NJ, USA.Altschul SF, Madden TL, Schaffer AA, Zhang J, Zhang Z, Miller
W, Lipman DJ (1997) Gapped BLAST and PSI-BLAST: a new
generation of protein database search programs. Nucleic AcidsResearch 25, 3389–3402.
Bartley JK, Grotzinger JP, Knoll AH, Sergeev VN (2000)
Lithification and fabric genesis in precipitated stromatolites and
associated peritidal carbonates, Mesoproterozoic Billyakh Group,Siberia. In Carbonate Sedimentation and Diagenesis in theEvolving Precambrian World (eds Grotzinger JP, James NP).
SEPM Special Publications, Tulsa, OK, pp. 59–73.Bateson MM, Ward DM (1988) Photoexcretion and fate ofglycolate in a hot spring cyanobacterial mat. Applied andEnvironment Microbiology 54, 1738–1743.
Benson D (2003) HSI ratio method. Multi-Isotope Imaging Mass
Spectrometry Workshop, Cambridge, Massachusetts, http://www.nrims.harvard.edu/slides/NRIMS_-
_BensonWorkshop2003.pdf.
Beukes NJ, Lowe DR (1989) Environmental controls on diversestromatolite morphologies in the 3000 Myr Pongola
Supergroup, South Africa. Sedimentology 36, 383–397.Boomer SM, Noll KL, Geesey GG, Dutton BE (2009)
Formation of multilayered photosynthetic biofilms in analkaline thermal spring in Yellowstone National Park,
Wyoming. Applied and Environment Microbiology 75, 2464–2475.
Bosak T, Liang B, Sim MS, Petroff APP (2009) Morphologicalrecord of oxygenic photosynthesis in conical stromatolites.
Proceedings of the National Academy of Sciences of the USA 106,10939–10943.
Bosak T, Bush J, Flynn M, Liang B, Ono S, Petroff APP, Sim MS
(2010) Formation and stability of oxygen-rich bubbles that
shape photosynthetic mats. Geobiology 8, 45–55.Brock TD (1978) Thermophilic Microorganisms and Life atHigh Temperatures. Springer-Verlag, Berlin, Germany,
pp 465.
Buick R (1992) The antiquity of oxygenic photosynthesis:
evidence from stromatolites in sulphate-deficient Archaean lakes.Science 255, 74–77.
Burton S, Lee J (1978) Improved enrichment and isolation
procedures for obtaining pure cultures of Beggiatoa. Appliedand Environment Microbiology 35, 614–617.
Cady SL, Farmer JD (1996) Fossilization processes in siliceous
thermal springs: trends in preservation long thermal gradients.
In: Evolution of Hydrothermal Ecosystems on Earth (and Mars?)(eds Bock GR, Goode JA). John Wiley & Sons Ltd, Chichester,
pp. 150–173.Cannon GC, Bradburne CE, Aldrich HC, Baker SH, Heinhorst S,
Shively JM (2001) Microcompartments in Prokaryotes:Carboxysomes and related polyhedra. Applied and EnvironmentMicrobiology 67, 5351–5361.
Castenholz RW (1988) Cyanobacteria. Academic Press, San
Diego.Castenholz RW (2001) Cyanobacteria. In: Bergey’s Manual ofSystematic Bacteriology, 2nd edn, Vol. 1, (eds Boone DR,
Castenholz RW, Garrity GM) The Archaea and the DeeplyBranching and Phototrophic Bacteria. Springer Verlag, NY. pp.
473-599.
Davis JP, Youssef NH, Elshahed MS (2009) Assessment of the
diversity, abundance, and ecological distribution of members ofcandidate division SR1 reveals a high level of phylogenetic
diversity but limited morphotypic diversity. Applied andEnvironment Microbiology 75, 4139–4148.
DeSantis TZ, Hugenholtz N, Larsen N, Rojas M, Brodie EL,
Keller K, Huber T, Dalevi D, Hu P, Andersen G (2006a)Greengenes, a Chimera-Checked 16S rRNA Gene Database and
Workbench Compatible with ARB. Applied and EnvironmentMicrobiology 72, 5069–5072.
DeSantis TZ Jr, Hugenholtz P, Keller K, Brodie EL, Larsen N,Piceno YM, Phan R, Andersen GL (2006b) NAST: a multiple
sequence alignment server for comparative analysis of 16S rRNA
genes. Nucleic Acids Research 34, W394–W399.Doemel WN, Brock TD (1974) Bacterial stromatolites: origins of
laminations. Science 184, 1083–1086.Ferris MJ, Ward DM (1997) Seasonal distributions of dominant
16S rRNA-defined populations in a hot spring microbial matexamined by denaturing gradient gel electrophoresis. Appliedand Environment Microbiology 63, 1375–1381.
Ferris MJ, Kuhl M, Wieland A, Ward DM (2003) Cyanobacterial
ecotypes in different optical microenvironments of a 68˚ C hotspring mat community revealed by 16S-23S rRNA internal
transcribed spacer region variation. Applied and EnvironmentMicrobiology 69, 2893–2898.
Foster JS, Green SJ, Ahrendt SR, Golubic S, Reid RP,Hetherington KL, Bebout L (2009) Molecular and
morphological characterization of cyanobacterial diversity in
the stromatolites of Highborne Cay, Bahamas. ISME Journal3, 573–587.
Grey K (1980) Small conical stromatolites from the Archean near
Kanowna, Western Australia. Annu Report Geol Surv Western
Australia, Perth, pp. 90–94.Grotzinger JP, Knoll AH (1999) Stromatolites in Precambrian
carbonates: evolutionary mileposts or environmental dipsticks?
Annual Review of Earth and Planetary Sciences 27, 313–358.Grotzschel S, de Beer D (2002) Effect of oxygen concentrationon photosynthesis and respiration in two hypersaline microbial
mats. Microbial Ecology 44, 208–216.Guerquin-Kern JL, Wu TD, Quintana C, Croisy A (2005)Progress in analytical imaging of the cell by dynamic secondary
ion mass spectrometry (SIMS microscopy). Biochimica etBiophysica Acta 1724, 228–238.
Hallatschek O, Nelson DR (2010) Life at the front of anexpanding population. Evolution 64, 193–206.
Hanada S, Takaichi S, Matsuura K, Nakamura K (2002)
Roseiflexus castenholzii gen. nov., sp. nov., a thermophilic,
filamentous, photosynthetic bacterium that lacks chlorosomes.International Journal of Systematic and EvolutionaryMicrobiology 52, 187–193.
Hofmann HJ, Jackson GD (1987) Proterozoic ministromatoliteswith radial-fibrous fabric. Sedimentology 34, 963–971.
Huber T, Faulkner G, Hugenholtz P (2004) Bellerophon: a
program to detect chimeric sequences in multiple sequence
alignments. Bioinformatics 20, 2317–2319.Jahnke LL, Embaye T, Hope J, Turk KA, Van Zuilen M, Des
Marais DJ, Farmer JD, Summons RE (2004) Lipid biomarker
and carbon isotopic signatures for stromatolite-forming,
microbial mat communities and Phormidium cultures fromYellowstone National Park. Geobiology 2, 31–47.
Jones B, Renaut RW, Rosen MR (1998) Microbial biofacies in
hot-spring sinters; a model based on Ohaaki Pool, North
Island, New Zealand. Journal of Sedimentary Research 68,413–434.
Jones E, Oliphant T, Peterson P (2001) SciPy: open source
scientific tools for Python. http://www.scipy.org/ (accessed on6 June 2012).
© 2012 Blackwell Publishing Ltd
Cyanobacteria in hot spring coniform mats 399
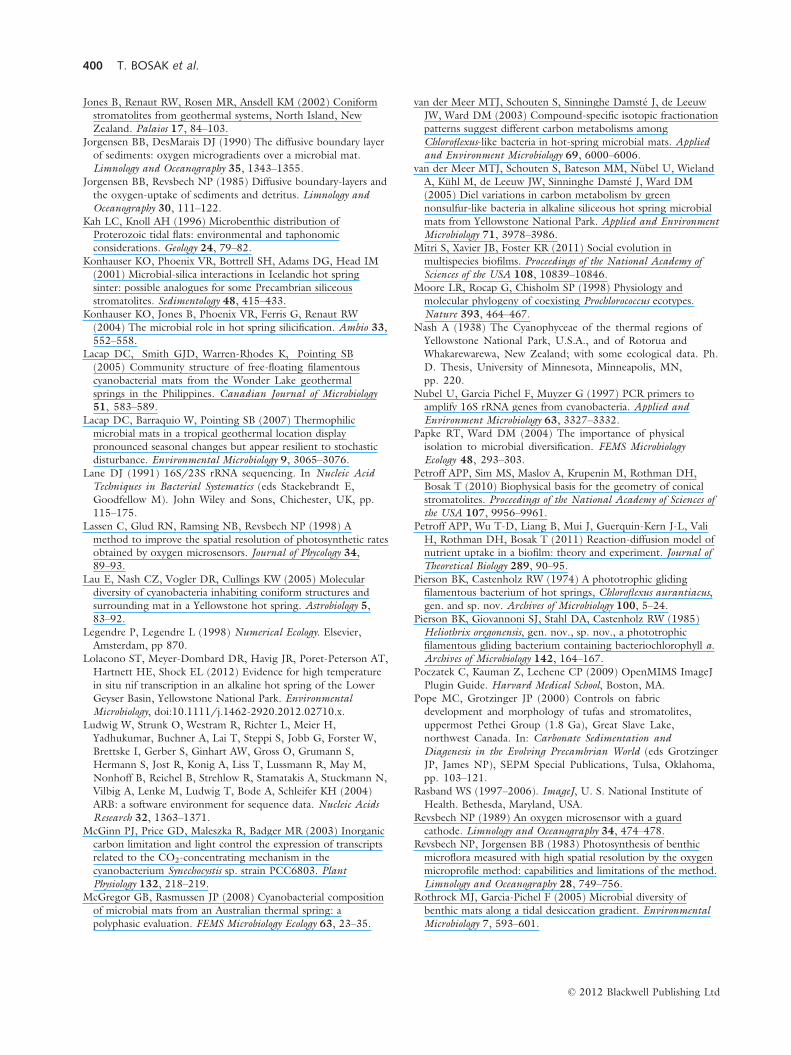
Jones B, Renaut RW, Rosen MR, Ansdell KM (2002) Coniform
stromatolites from geothermal systems, North Island, New
Zealand. Palaios 17, 84–103.Jorgensen BB, DesMarais DJ (1990) The diffusive boundary layerof sediments: oxygen microgradients over a microbial mat.
Limnology and Oceanography 35, 1343–1355.Jorgensen BB, Revsbech NP (1985) Diffusive boundary-layers and
the oxygen-uptake of sediments and detritus. Limnology andOceanography 30, 111–122.
Kah LC, Knoll AH (1996) Microbenthic distribution of
Proterozoic tidal flats: environmental and taphonomicconsiderations. Geology 24, 79–82.
Konhauser KO, Phoenix VR, Bottrell SH, Adams DG, Head IM
(2001) Microbial-silica interactions in Icelandic hot spring
sinter: possible analogues for some Precambrian siliceousstromatolites. Sedimentology 48, 415–433.
Konhauser KO, Jones B, Phoenix VR, Ferris G, Renaut RW
(2004) The microbial role in hot spring silicification. Ambio 33,552–558.
Lacap DC, Smith GJD, Warren-Rhodes K, Pointing SB
(2005) Community structure of free-floating filamentous
cyanobacterial mats from the Wonder Lake geothermal
springs in the Philippines. Canadian Journal of Microbiology51, 583–589.
Lacap DC, Barraquio W, Pointing SB (2007) Thermophilic
microbial mats in a tropical geothermal location displaypronounced seasonal changes but appear resilient to stochastic
disturbance. Environmental Microbiology 9, 3065–3076.Lane DJ (1991) 16S/23S rRNA sequencing. In Nucleic AcidTechniques in Bacterial Systematics (eds Stackebrandt E,Goodfellow M). John Wiley and Sons, Chichester, UK, pp.
115–175.Lassen C, Glud RN, Ramsing NB, Revsbech NP (1998) A
method to improve the spatial resolution of photosynthetic ratesobtained by oxygen microsensors. Journal of Phycology 34,89–93.
Lau E, Nash CZ, Vogler DR, Cullings KW (2005) Moleculardiversity of cyanobacteria inhabiting coniform structures and
surrounding mat in a Yellowstone hot spring. Astrobiology 5,83–92.
Legendre P, Legendre L (1998) Numerical Ecology. Elsevier,Amsterdam, pp 870.
Lolacono ST, Meyer-Dombard DR, Havig JR, Poret-Peterson AT,
Hartnett HE, Shock EL (2012) Evidence for high temperature
in situ nif transcription in an alkaline hot spring of the LowerGeyser Basin, Yellowstone National Park. EnvironmentalMicrobiology, doi:10.1111/j.1462-2920.2012.02710.x.
Ludwig W, Strunk O, Westram R, Richter L, Meier H,Yadhukumar, Buchner A, Lai T, Steppi S, Jobb G, Forster W,
Brettske I, Gerber S, Ginhart AW, Gross O, Grumann S,
Hermann S, Jost R, Konig A, Liss T, Lussmann R, May M,
Nonhoff B, Reichel B, Strehlow R, Stamatakis A, Stuckmann N,Vilbig A, Lenke M, Ludwig T, Bode A, Schleifer KH (2004)
ARB: a software environment for sequence data. Nucleic AcidsResearch 32, 1363–1371.
McGinn PJ, Price GD, Maleszka R, Badger MR (2003) Inorganiccarbon limitation and light control the expression of transcripts
related to the CO2-concentrating mechanism in the
cyanobacterium Synechocystis sp. strain PCC6803. PlantPhysiology 132, 218–219.
McGregor GB, Rasmussen JP (2008) Cyanobacterial composition
of microbial mats from an Australian thermal spring: a
polyphasic evaluation. FEMS Microbiology Ecology 63, 23–35.
van der Meer MTJ, Schouten S, Sinninghe Damste J, de Leeuw
JW, Ward DM (2003) Compound-specific isotopic fractionation
patterns suggest different carbon metabolisms among
Chloroflexus-like bacteria in hot-spring microbial mats. Appliedand Environment Microbiology 69, 6000–6006.
van der Meer MTJ, Schouten S, Bateson MM, Nubel U, Wieland
A, Kuhl M, de Leeuw JW, Sinninghe Damste J, Ward DM
(2005) Diel variations in carbon metabolism by greennonsulfur-like bacteria in alkaline siliceous hot spring microbial
mats from Yellowstone National Park. Applied and EnvironmentMicrobiology 71, 3978–3986.
Mitri S, Xavier JB, Foster KR (2011) Social evolution in
multispecies biofilms. Proceedings of the National Academy ofSciences of the USA 108, 10839–10846.
Moore LR, Rocap G, Chisholm SP (1998) Physiology andmolecular phylogeny of coexisting Prochlorococcus ecotypes.Nature 393, 464–467.
Nash A (1938) The Cyanophyceae of the thermal regions of
Yellowstone National Park, U.S.A., and of Rotorua andWhakarewarewa, New Zealand; with some ecological data. Ph.
D. Thesis, University of Minnesota, Minneapolis, MN,
pp. 220.
Nubel U, Garcia Pichel F, Muyzer G (1997) PCR primers toamplify 16S rRNA genes from cyanobacteria. Applied andEnvironment Microbiology 63, 3327–3332.
Papke RT, Ward DM (2004) The importance of physicalisolation to microbial diversification. FEMS MicrobiologyEcology 48, 293–303.
Petroff APP, Sim MS, Maslov A, Krupenin M, Rothman DH,
Bosak T (2010) Biophysical basis for the geometry of conicalstromatolites. Proceedings of the National Academy of Sciences ofthe USA 107, 9956–9961.
Petroff APP, Wu T-D, Liang B, Mui J, Guerquin-Kern J-L, Vali
H, Rothman DH, Bosak T (2011) Reaction-diffusion model ofnutrient uptake in a biofilm: theory and experiment. Journal ofTheoretical Biology 289, 90–95.
Pierson BK, Castenholz RW (1974) A phototrophic glidingfilamentous bacterium of hot springs, Chloroflexus aurantiacus,gen. and sp. nov. Archives of Microbiology 100, 5–24.
Pierson BK, Giovannoni SJ, Stahl DA, Castenholz RW (1985)
Heliothrix oregonensis, gen. nov., sp. nov., a phototrophicfilamentous gliding bacterium containing bacteriochlorophyll a.Archives of Microbiology 142, 164–167.
Poczatek C, Kauman Z, Lechene CP (2009) OpenMIMS ImageJ
Plugin Guide. Harvard Medical School, Boston, MA.Pope MC, Grotzinger JP (2000) Controls on fabric
development and morphology of tufas and stromatolites,
uppermost Pethei Group (1.8 Ga), Great Slave Lake,northwest Canada. In: Carbonate Sedimentation andDiagenesis in the Evolving Precambrian World (eds Grotzinger
JP, James NP), SEPM Special Publications, Tulsa, Oklahoma,
pp. 103–121.Rasband WS (1997–2006). ImageJ, U. S. National Institute of
Health. Bethesda, Maryland, USA.
Revsbech NP (1989) An oxygen microsensor with a guard
cathode. Limnology and Oceanography 34, 474–478.Revsbech NP, Jorgensen BB (1983) Photosynthesis of benthic
microflora measured with high spatial resolution by the oxygen
microprofile method: capabilities and limitations of the method.
Limnology and Oceanography 28, 749–756.Rothrock MJ, Garcia-Pichel F (2005) Microbial diversity of
benthic mats along a tidal desiccation gradient. EnvironmentalMicrobiology 7, 593–601.
© 2012 Blackwell Publishing Ltd
400 T. BOSAK et al.

Semikhatov MA, Gebelein CD, Cloud PE, Awramik SM, Benmore
WC (1979) Stromatolite morphogenesis-progress and problems.
Canadian Journal of Earth Sciences 16, 992–1015.Shibata M, Ohkawa H, Kaneko T, Fukuzawa H, Tabata S,Kaplan A, Ogawa T (2001) Distinct constitutive and
low-CO2-induced CO2 uptake systems in cyanobacteria:
genes involved and their phylogenetic relationship with
homologous genes in other organisms. Proceedings ofthe National Academy of Sciences of the USA 98, 11789–11794.
Stamatakis A, Hoover P, Rougemont J (2008) A rapid bootstrapalgorithm for the RAxML web servers. Systematic Biology 57,758–771.
Vaara T, Vaara M, Niemela S (1979) Two improved methods for
obtaining axenic cultures of cyanobacteria. Applied andEnvironment Microbiology 38, 1011–1014.
Walter MR, Bauld J, Brock TD (1972) Siliceous algal and
bacterial stromatolites in hot spring and geyser effluents of
Yellowstone National Park. Science 178, 402–405.Walter MR, Bauld J, Brock TD (1976) Microbiology and
morphogenesis of columnar stromatolites (Conophyton,Vacerrilla) from hot springs in Yellowstone National Park. In
Developments in Sedimentology, Stromatolites (ed. Walter MR).Elsevier, Amsterdam, pp. 273–310.
Ward DM, Bateson MM, Ferris MJ, Kuhl M, Wieland A,
Koeppel A, Cohan FM (2006) Cyanobacterial ecotypes in themicrobial mat community of Mushroom Spring (Yellowstone
National Park, Wyoming) as species-like units linking
microbial community composition, structure and function.
Philosophical Transactions of the Royal Society of London. SeriesB, Biological Sciences 361, 1997–2008.
Weller D, Doemel W, Brock TD (1975) Requirement of low
oxidation-reduction potential for photosynthesis in a
blue-green alga (Phormidium sp.). Archives of Microbiology104, 7–13.
Wiegert RG, Fraleigh PC (1972) Ecology of Yellowstone thermal
effluent systems: net primary production and species diversity of
a successional blue-green algal mat. Limnology andOceanography 17, 215–228.
SUPPORTING INFORMATION
Additional Supporting Information may be found in the
online version of this article:
Fig. S1 Lithification in cones and mats.
Fig. S2 Cone-mat sample (photograph, scale in mm) incubated with labeled
carbon for 60 minutes showing the distribution of 60 lm 9 60 lm Nano-
SIMS maps and high resolution maps showing different cell morphologies.
Fig. S3 NanoSIMS analysis of a cone (A) and a mat (B) incubated for
60 min in labeled inorganic carbon in 2008.
Fig. S4 Distribution of unlabeled and labeled carbon in thin filaments in the
cone incubated with labeled inorganic carbon for 60 min.
Fig. S5 Spatial distribution of OTUs in the samples of cones and mats from
four different springs.
Fig. S6 Distribution of OTUs in cones and mats from four different springs
in 2009.
Fig. S7 NanoSIMS maps of YNP cones showing possible cyanobacterial
sheaths.
Please note: Wiley-Blackwell are not responsible for the
content or functionality of any supporting materials sup-
plied by the authors. Any queries (other than missing
material) should be directed to the corresponding author
for the article.
© 2012 Blackwell Publishing Ltd
Cyanobacteria in hot spring coniform mats 401
Copyright © 2022 FDOKUMEN