Kinetics of reactions between chlorine and the cyanobacterial toxins microcystins
Upload
independentCategory
view
0download
0
AQUATIC MICROBIAL ECOLOGYAquat Microb Ecol
Vol. 53: 129–140, 2008doi: 10.3354/ame01228
Printed September 2008Published online September 18, 2008
INTRODUCTION
Shifts in the relative abundance of microalgae withinphytoplankton communities define seasonal succes-sions of organisms belonging to different taxa. Phyto-plankton successions in natural waters of temperateregions have been well documented for decades
(Hutchinson 1967, Smetacek 1985, Cloern 1996). Whilea great variety of eukaryotic microalgae and cyano-bacteria usually coexist in the same water body in latespring and early summer, this diversity may dropdrastically towards the end of summer, giving way tothe mass development of cyanobacterial populations(Hutchinson 1961, Rocha et al. 2002).
© Inter-Research 2008 · www.int-res.com*Email: [email protected]
Cyanobacterial blooms in natural waters insouthern Portugal: a water management perspective
Helena M. Galvão1,*, Margarida P. Reis1, Elisabete Valério2, Rita B. Domingues1, Cristina Costa1, Dulce Lourenço3, Sílvia Condinho3, Rute Miguel1, Ana Barbosa1,
Conceição Gago4, Natália Faria2, Sérgio Paulino2, Paulo Pereira2
1Faculdade de Ciências do Mar e do Ambiente (FCMA), Universidade do Algarve, Campus de Gambelas, 8005-139 Faro, Portugal2National Health Institute Dr. Ricardo Jorge, Av. Padre Cruz, 1649-016 Lisboa, Portugal
3Águas do Algarve, S.A., Rua do Repouso n° 10, 8000-302 Faro, Portugal4CCDR Algarve (Ambiente e Ordenamento), R. Dr. José de Matos n° 13, 8000-503 Faro, Portugal
ABSTRACT: This synthesis of 3 studies from 2 regions of southern Portugal (Alentejo and Algarve)was part of a workshop focusing on cyanobacteria held at the SAME 10. The first study monitoredimpacts of the large Alqueva dam on the Guadiana estuary since 1996, revealing changes insediment load, nutrient regime and phytoplankton succession. Prior to dam construction, densecyanobacterial blooms occurred in the upper estuary during summer and fall. After dam construction,chlorophyll concentration, phytoplankton diversity and abundances of cyanobacteria decreased,contrary to predictions. Mycrocystins remained at low levels in the seston and undetectable in watersamples, except during summer 2003 when the particulate fraction contained 1 µg l–1, whilechlorophyll concentrations and abundances of potentially toxic cyanobacteria remained low. Algarvereservoirs studied since 2001 revealed differences in phytoplankton dynamics. In the westernmesotrophic reservoirs (Bravura and Funcho), 40 to 50% of surface samples contained cyanobacter-ial concentrations of ≥2000 cells ml–1, while over 80% of samples from the eastern oligotrophicreservoirs (Odeleite and Beliche) exceeded this value. Spring blooms were dominated by Oscillatori-ales in Odeleite and Beliche and by Chroococcales in Bravura and Funcho. Bloom compositionseemed to depend on water temperature and management strategies, while toxin concentrationsreflected the increased biomass of toxic species. Finally, phytoplankton communities and microcystinproduction in 5 Alentejo freshwater reservoirs were studied from May to December 2005 and April toJuly 2006. Cyanobacterial blooms occurred, with varying intensities, not only during summer but alsooccasionally in winter. Microcystins were detected in 23% of the samples (n = 51), but withoutcorrelation with cyanobacterial biomass. Although Microcystis aeruginosa seemed to be the majorproducer of microcystins, other potentially toxic species were found. In summary, the varying patternof cyanobacterial bloom occurrence and toxicity requires a systematic approach to monitoringprograms for adequate risk assessment.
KEY WORDS: Cyanobacteria · Microcystins · Phytoplankton · Estuary · Freshwater reservoirs
Resale or republication not permitted without written consent of the publisher
Contribution to AME Special 1 ‘Progress and perspectives in aquatic microbial ecology’ OPENPEN ACCESSCCESS

Aquat Microb Ecol 53: 129–140, 2008
Alhough this pattern of seasonal succession can beassumed to be a general trend, phytoplankton dynam-ics are affected by a more complex scenario of internaland external driving factors, in which different speciesinteract not only with each other but also with theenvironment, rendering any attempt at prediction ormodeling particularly challenging. In the last fewdecades, a lot of effort has been invested in discerningwhich environmental factors control bloom formation,especially with respect to toxic species such as cyano-bacteria. Understanding the conditions that triggertoxic blooms of cyanobacteria in lakes, reservoirs andrivers is a complex quest, hindered by the lack ofinformation on natural ecological relationships be-tween plankton populations.
Blooms of cyanobacteria have been repeatedly asso-ciated with eutrophication processes (Berg et al. 1987,Carmichael et al. 1988, Druvietis 1997, Pinckney et al.1998, Codd 2000, Chorus 2005). Factors such as highwater retention time in lakes and reservoirs, increasedtemperature, low N:P ratio, as well as surface radiationand wind conditions have been reported to influencebloom development (Carmichael 1996, Kononen et al.1996, Kawara et al. 1998, Chorus & Bartram 1999).Most species preferentially occur in stable, wellstratified water bodies that provide optimal conditionsfor their vertical migration. Species like Microcystisaeruginosa and Anabaena spp. contain intracellulargas vesicles and become buoyant, accumulating on thewater surface where they can be blown around by thewind, forming very dense stable scums that are easilydetected by simple observation of the water reservoirfrom above (Dittmann & Wiegand 2006). In contrast,other species like Planktothrix spp. and Oscillatoriaspp. are more sensitive to high light conditions andusually tend to accumulate in deeper water layersor disperse homogeneously in the water column(Dittmann & Wiegand 2006).
Cyanobacterial blooms can be harmful to humansdue to the ability of several bloom-forming species tosynthesize highly toxic secondary metabolites: cyano-toxins (Dittmann & Wiegand 2006). Hepatotoxic micro-cystins are the most commonly found and widespreadcyanotoxins. They are associated with several bloom-forming genera of cyanobacteria, including Microcys-tis, Anabaena, Anabaenopsis, Planktothrix, Nostoc,Hapalosiphon, Snowella, Woronichinia, and Oscillato-ria (Codd et al. 2005, Falconer 2005). However, not allcyanobacteria are capable of toxin production. Differ-ent strains may produce different types of toxins in dif-ferent quantities and at different rates along theirgrowth cycle, while others are non-toxigenic (Sivonen& Jones 1999, Codd et al. 2005). These characteristicsexplain why the occurrence of toxic blooms in naturalenvironments is, apparently, unpredictable.
Current awareness of hazards from toxic cyanobac-teria in different countries has made considerableprogress due to cooperative programs between coun-tries and regions that are aimed towards implementingexisting regulations (Chorus 2005). The prevention ofharmful cyanobacterial blooms has been based on theassessment and minimization of eutrophication condi-tions, thus falling within the scope of the EU WaterFramework Directive, which calls for a ‘good ecologi-cal status’ of public water resources by 2015.
A general picture of the extent of cyanobacterial andcyanotoxin occurrence is emerging from scientificresearch, preliminary surveys and on-going monitor-ing in many countries (Chorus 2005). In Portugal,awareness of potential health risks has led to severalresearch projects on freshwater and estuarine micro-bial ecology in the southern regions of Alentejo andAlgarve. Furthermore, a working group, coordinatedby the Portuguese General Directorate for Health, wasformed in 1995–1996 to present a proposal for anational monitoring program of cyanobacteria andcyanotoxins in freshwater reservoirs. Since then, vari-ous laboratories have been carrying out regularscreening of cyanobacteria in many freshwater reser-voirs, alerting environmental and water managementagencies to the more serious toxic occurrences andassessing the efficiency of water treatment processesin removing cyanobacteria and associated toxins.
The southwest region of the Iberian Peninsula is asemi-arid region with a Mediterranean climate wherethe dry season usually extends from May to Septemberand annual precipitation averages ca. 500 mm. Theconcentration of rainy days defines a torrential regime,where years of extended droughts alternate with yearsof intense rain and floods. Water reservoir manage-ment is strongly limited by water availability, leadingto several situations of high hydraulic residence timewhile new dam construction further restricts river flow.All these conditions influence the development ofcyanobacterial blooms and aggravate their environ-mental and economic impact.
This paper presents 3 different case studies fromAlentejo and Algarve. The studies were presented at aworkshop on harmful algal blooms, focusing primarilyon cyanobacteria, organized within the SAME 10 heldin September 2007 in Faro, Portugal. The first studyfocuses on the Guadiana River estuary, which runsthrough both regions. The second study comparescyanobacterial dynamics in 4 freshwater reservoirs ofthe Algarve region (Bravura, Funcho, Odeleite andBeliche), and the third relates microcystin productionwith the community composition of cyanobacteria in 5reservoirs from the Alentejo region (Alqueva, Alvito,Enxoé, Odivelas and Roxo). Although describing dif-ferent situations in terms of cyanobacterial occurrence
130

Galvão et al.: Cyanobacterial blooms in southern Portugal
and toxicity, these 3 case studies represent comple-mentary approaches to understanding the complexityof cyanobacterial blooms in Portuguese environments.
IMPACT OF DAM CONSTRUCTION ON THEGUADIANA ESTUARY
The Guadiana River, running along the southernborder between Portugal and Spain (Fig. 1), has thefourth largest drainage basin of all Iberian rivers(67 840 km2), but a series of dams have severelyrestricted its freshwater flow by ca. 75%, and theconstruction of the large Alqueva dam increased flowregulation to up to 81% of the total catchment area(55 000 km2) starting in 2003.
Cyanobacterial blooms have been reported in theGuadiana River in association with seasons and/oryears of low freshwater flow (Cabeçadas & Brogueira1981, Oliveira 1985, 1991). Microbial ecology studiescarried out from 1996 to 1998 showed a well-definedchlorophyll maximum in the upper estuary (Fig. 2), ca.30 km upstream from the mouth of the river (Rocha etal. 2002, Domingues et al. 2005). This observation hasbeen made in many temperate estuaries where estuar-ine circulation leads to the development of a maximumturbidity zone at the toe of the salt-wedge, upstreamof which phytoplankton find optimal conditions forgrowth (Cloern 1987, 1996, 1999). Moreover, Rocha etal. (2002) indicated that high winter loads of nitrogenand phosphorus in the upper estuary were followed bysilicate depletion during early spring caused by springdiatom blooms. This nutrient regime determined thephytoplankton succession from diatoms in early springto chlorophytes, followed by cyanobacteria during sum-mer and fall (Rocha et al. 2002, Domingues et al. 2005).
Changes in freshwater flow lead to alterations in waterquality and hydrography, thus affecting phytoplanktoncomposition and succession. River flow after completionof the Alqueva dam was severely restricted even duringwinter months with high rainfall (Fig. 3). During theperiod of dam construction (1999 to 2000), the sedimentload transported downstream increased dramatically,causing severe photolimitation for the phytoplanktonand resulting in the absence of blooms and very lowchlorophyll values throughout spring and summer. Oneexception occurred in April 2001, when chlorophyllreached a record high of 216 µg l–1 due to an unknownchain-forming centric diatom coinciding with a sharpdecrease in seston when dam construction was termi-nated (Fig. 4). Afterwards, during the filling period of thereservoir (2002 to 2003), nutrient concentrations as wellas cyanobacterial abundance increased, while diatomabundance remained low (Domingues et al. 2007). Afterthis period, total phytoplankton abundance and succes-
131
Fig. 1. Location of study sites: Guadiana estuary and freshwater reservoirs ofAlqueva, Alvito, Beliche, Bravura, Enxoé, Funcho, Odeleite, Odivelas and Roxo
0
10
20
30
Dis
tanc
e to
riv
er m
outh
(km
)
024681012141618202224262830323436
Sta
tions
N D J F M A M J J A S O N D J F
Chl a (µg l–1)
1996 1997 1998P123
4
5
67
8
910
Fig. 2. Interpolation plots showing the longitudinal and sea-sonal distribution of surface chl a concentrations at selectedstations in the Guadiana estuary (P: river mouth, 1: Vila Real
St. Antonio, 6: Odeleite Stream, 10: Alcoutim)

Aquat Microb Ecol 53: 129–140, 2008
sion followed the typical trend observed before damfilling. However, specific diversity and chlorophyll con-centrations decreased from 2002 to 2005 (Domingues &Galvão 2007).
Microcosm studies undertaken in 2005 to explain thephytoplankton community structure based on nutrientregime indicated that nitrogen limitation could haveinfluenced phytoplankton succession (R. B. Dominguesunpubl. data). However, this type of experiment wasnot designed to simulate an important factor, namelyestuarine circulation. In fact, the salinity regime in theestuary was affected during dam filling and construc-tion due to the salt-wedge intrusion reaching furtherupstream, causing saltwater to be detected in the nor-mally freshwater upper estuary (ca. 70 km upstreamfrom the river mouth). The phytoplankton communityfound in the upper estuary, including cyanobacteria,was composed strictly of freshwater species with lim-ited halotolerance. Therefore, an increase in salinity,particularly during late spring and early summer whenmaximum growth should occur, couldhave had a deleterious impact resultingin lower chlorophyll values and speciesnumbers after construction of theAlqueva dam.
Microcystins were detected in 1999,2000, 2002 (Caetano et al. 2001, Sobrino etal. 2004), 2004 and 2005 (H. M. Galvão un-publ. data) in concentrations well belowthe World Health Organization (WHO)guideline for drinking water of 1 µg l–1
(WHO 1998). Microcystin levels re-mained low, even during cyanobacterialblooms with abundances of potentiallytoxic species, such as Microcystis aerugi-nosa, reaching 106 to 108 cells ml–1
(Caetano et al. 2001, Rocha et al. 2002).Microcystin concentrations higher thanthe WHO guideline were detected onlyonce, on 25 July 2003, when values of1.2 µg l–1 were reached in Mértola (70 kmupstream from the river mouth) and6.8 µg l–1 upstream from Mértola (C. So-brino unpubl. data). Interestingly, thesehigher toxin levels were detected whiletotal cyanobacteria counts, determinedusing epifluorescence microscopy (Haas1982), were relatively low (maximum of6 × 105 cells ml–1) and potentially toxicgenera such as M. aeruginosa registeredlow abundance. However, these low totalcounts could have reflected a shift inpredominance from chroococcoid speciestowards filamentous forms such as Oscil-latoria and Anabaena spp. with higher
specific biomass and potential toxin production. Further-more, other samples taken on 30 July 2003 (M. R. Reisunpubl. data) contained high numbers of M. aeruginosa(>6 × 10⁵ cell ml–1) and potentially toxic filamentousforms (>1 × 10⁵ cells ml–1). Bathing and fishing in thisarea were forbidden by health authorities during Julyand August 2003 because high toxin concentrationspersisted for several weeks.
Cyanobacterial blooms in freshwater reservoirs inthe Algarve region
In the Algarve, strong demographic changesinduced by tourism have led to the building of severalfreshwater reservoirs in order to ensure the waterquantities required for activities such as agriculture,golf, landscaping and human consumption. Thus, from2000 onwards, there was a shift from groundwater tosurface water as a source of drinking water.
132
0
50
100
150
200
250
300
0
500
1000
1500
2000
2500
3000
3500
4000
4500
5000
Rai
nfal
l (m
m)
Riv
er fl
ow (m
3s–
1 )
River flow
Rainfall
1996 1997 1998 1999 2000 2001 2002 2003 2004 2005I I
Fig. 3. Monthly river flow volume (Pulo do Lobo upstream from Mértola, meanvalues) and total monthly rainfall (Alcoutim) from 1996 to 2005 in the upperGuadiana estuary (data source: www.inag.pt/SNIRH/). The arrow marks the
dam construction and filling period
Fig. 4. Seston and chl a concentrations in surface water samples from 1997 to2001 at the Alcoutim station in the upper Guadiana estuary. The arrow marksthe dam construction period. Gaps in the data reflect periods without regular
sampling

Galvão et al.: Cyanobacterial blooms in southern Portugal
In western Algarve, the main reservoir used fordrinking water production is Funcho (Fig. 1), whilewater removal from Bravura is seasonal, usuallyoccurring from May to October. The eastern Algarveis supplied by water from Beliche, which is connectedto the Odeleite reservoir by underwater sluices thatregulate the flow from Odeleite to Beliche and whichare usually opened in spring and closed in autumn.Basic information about location and dimension ofthe 4 main reservoirs in the Algarve is compiled inTable 1.
These reservoirs have been subject to standardphysical, chemical and microbiological water qualitymonitoring since 1996 and, since 2001, to simultaneousmonitoring of phytoplankton and cyanobacteria toxins.We organized all collected data into 2 types of data-base: one containing a long-term data series of physi-cal and chemical variables and one with a shorter dataseries, but including biological data and diversityindices like Shannon diversity, eveness, Berger-Parkerdominance (Berger & Parker 1970) and species rich-ness (Magurran 1988). For the present study, multivari-ate analysis of these data sets was carried out in orderto assess the main factors triggering cyanobacteriablooms.
Relative abundances of cyanobacteria and micro-cystin concentrations obtained over a 2.5 yr period inthe western and eastern Algarve are illustrated inFigs. 5 & 6, respectively. In the western reservoirs, 40to 50% of the water samples contained cyanobacterialconcentrations higher than the WHO alert level 1 forraw waters (≥2000 cells ml–1). However, more than80% of the samples in Odeleite and Beliche exceededthis alert level. Furthermore, 13 to 17% of all analyzedsamples presented concentrations of >20 000 cellsml–1, but WHO alert level 2 (≥100 000 cells ml–1) wasonly occasionally exceeded in Funcho in 2001, 2002and 2005, when Microcystis spp. reached >106 cellsml–1. Microcystin concentrations were always negligi-ble with respect to human health risk, only exceedingWHO guideline value of 1 µg l–1 in scums of a winterbloom detected in Funcho in 2002, and in bottom sam-ples of a spring bloom detected in Beliche in 2004.
Cyanobacterial blooms occurred during the dry aswell as during the rainy season, and no evident rela-tionship between weather conditions and bloom oc-currence was found. Data analyses of monthly watercolumn profiles for temperature and oxygen concen-trations revealed strong differences in the stratificationof the 4 reservoirs (M. R. Reis unpubl. data), probablyrelated to the different water management strategies.While Funcho reservoir behaved as a warm monomic-tic lake with winter destratification occurring only fromDecember to February, the Bravura water columntended to destratify 2 mo earlier and stratify 2 to 3 mo
133
Res
ervo
ir
Str
eam
W
ater
shed
C
atch
men
t L
atit
ud
eL
ong
itu
de
Yea
r of
Max
. wat
erT
otal
Flo
oded
Mea
n a
nu
alar
ea
(°N
)(°
W)
clos
ure
colu
mn
volu
me
surf
ace
pre
cip
itat
ion
(km
2 )h
eig
ht
(m)
(×10
6m
3 )(h
a)(m
m)
Alg
arve
Bra
vura
R
ibei
ra d
e O
diá
xere
R
ibei
ras
do
Alg
arve
76
.58
37°1
2’6’
’ 8°
41’5
2’’
1952
2335
285
821
Fu
nch
o A
rad
e A
rad
e 21
2.59
37
°15’
46’’
8°22
’57’
’ 19
9331
4836
074
4O
del
eite
R
ibei
ra d
e O
del
eite
G
uad
ian
a 34
7.51
37
°19’
52’’
7°29
’11’
’ 19
9630
130
720
722
Bel
ich
e R
ibei
ra d
e B
elic
he
Gu
adia
na
98.4
7 37
°16’
35’’
7°30
’33’
’ 19
8630
4829
264
4
Ale
nte
joA
lqu
eva
Gu
adia
na
Gu
adia
na
5528
9.00
38
°11’
50’’
7°29
’43’
’ 20
0222
4150
2500
059
3A
lvit
o R
ibei
ra d
o A
lvit
o S
ado
210.
77
38°1
6’44
’’ 7°
54’3
7’’
1968
2513
214
8064
0O
div
elas
R
ibei
ra d
e O
div
elas
S
ado
431.
88
38°1
1’05
’’ 8°
06’5
5’’
1972
1296
973
622
En
xoé
Rib
eira
de
En
xoé
Gu
adia
na
61.1
5 37
°59’
38’’
7°27
’55’
’ 19
9810
10–
555
Rox
oR
ibei
ra d
o R
oxo
Sad
o35
1.1
37°5
5’47
’’8°
04’5
5’’
1967
1496
1378
559
Tab
le 1
. Loc
atio
n a
nd
dim
ensi
ons
of A
lgar
ve a
nd
Ale
nte
jo f
resh
wat
er r
eser
voir
s

Aquat Microb Ecol 53: 129–140, 2008
later. This difference could only be explained bythe artificial reinforcement of the Funcho ther-mocline, caused by year-round cold waterremoval from the hypolimnion for drinkingwater production.
Concerning the 2 eastern reservoirs, manage-ment of the underground channel betweenOdeleite and Beliche artificially induced apolymictic behavior that can also be associatedwith conditions favouring blooms of filamentouscyanobacteria through the resuspension of bot-tom sediment and nutrients. This hydraulic reg-ulation may also have caused differences in theobserved phytoplankton succession. The easternreservoirs (Odeleite and Beliche) systematicallydeveloped mixed cyanobacterial blooms of Nos-tocales and Oscillatoriales in late spring, whichwere then gradually replaced by Chroococcales.However, in 2005, the channel between Odeleiteand Beliche was opened earlier because of asevere drought. Nutrients and akinetes wereresuspended in cold waters unfavourable forNostocales blooms. During this drought, Chro-ococcales dominated spring blooms even in theeastern reservoirs.
Based on the dominance of cyanobacteria, all 4reservoirs could be considered eutrophic, butbased on soluble reactive phosphorus (SRP) anddissolved inorganic nitrogen (DIN) concentra-tions, the western reservoirs (Bravura and Fun-cho) would be classified as slightly mesotrophicand the eastern (Odeleite and Beliche) as oligo-trophic. Frequent cyanobacterial blooms occur-ring in oligotrophic reservoirs are in contra-diction with most published reports, which cor-relate bloom formation with eutrophication orlow N:P ratios (Chorus 2001).
Fig. 7 illustrates how blooms and associatedDIN:SRP ratios in Funcho were related to theRedfield ratio of 16N:1P. In fact, DIN neverexceeded the desirable limit for a lake in an aridregion (US Environmental Protection Agencystandard, www.epa.gov/waterscience/criteria/nutrient) in the eastern reservoirs. In the westernreservoirs, this value was only exceeded occa-sionally in winter. In view of potential SRP-limita-tion, cyanobacterial blooms during summer weregenerally not linked to SRP levels, except for the2002 winter bloom.
134
Fig. 5. Relative abundances of cyanobacteria in the Western Algarvereservoirs, (a) Bravura and (b) Funcho. Arrows show samples positivefor microcystins; values beside arrows represent microcystin
concentrations (ng l–1)
Fig. 6. Relative abundances of cyanobacteria in theEastern Algarve reservoirs (a) Odeleite and (b)Beliche. Arrows show samples positive for micro-cystins; values beside arrows represent microcystin
concentrations (ng l–1)

Galvão et al.: Cyanobacterial blooms in southern Portugal
Exclusive use of physical and chemical data in multi-variate analysis of bloom dynamics was not sufficient todiscriminate bloom conditions (Reis 2005). This led to theinclusion of biological variables in multivariate analysisof bloom dynamics. Using methods such as distancebased redundancy analysis (db-RDA), summer Chro-ococcales blooms could be associated with increasedtemperature while the winter Aphanizomenon flos-aquae bloom was associated with increased SRP. Trendanalysis through dynamic factor analysis (Zuur et al.2003) applied to biological variables revealed no sea-sonal pattern and a tendency towards decreasing fre-quency and density of cyanobacterial blooms. This couldbe related to the fact that these reservoirs are relativelyyoung water bodies that have not yet developed a stablefood web with effective top-down control (Reis 2005).
Cyanobacterial blooms and associated microcystinsin freshwater reservoirs in the Alentejo region
The occurrence of microcystins in Portuguese fresh-water resources has been mostly associated withblooms of Microcystis aeruginosa, although otherpotentially toxic species also occur (Vasconcelos 1993,1994, 2001, Vasconcelos et al. 1996, Pereira et al. 2001,Vasconcelos & Pereira 2001, Moreno et al. 2003, Sakeret al. 2005). A wide range of microcystin concentra-tions have been encountered in many Portugueserivers and reservoirs, though most reports are based onthe sporadic analysis of environmental samples takenat the time of a bloom event, rather than on a system-atic survey of aquatic ecosystems.
In this study, cyanobacteria and micro-cystins were monitored in 5 Portuguesefreshwater reservoirs over 2 consecutivetime periods, from May to December of2005 and from April to July of 2006. Thiswas intended to evaluate changes inmicrocystin concentrations and persis-tence with respect to variations incyanobacterial assemblages and bio-mass throughout the sampling period.Table 1 lists some basic informationabout each of the 5 reservoirs includedin the study (Alqueva, Alvito, Enxoé,Odivelas and Roxo), while Fig. 1 showstheir location.
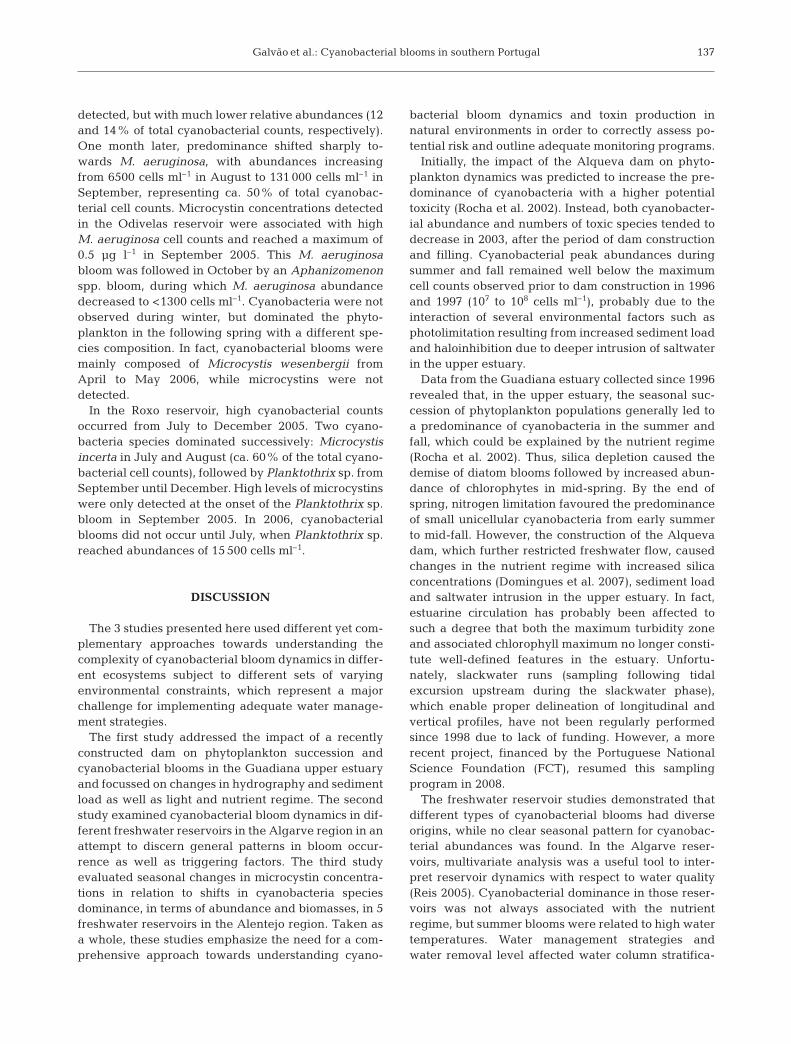
Results concerning phytoplanktonabun dance and microcystin concen-trations found in each reservoir duringthe monitoring period are shown inFig. 8. The occurrence of cyanobacteriaseemed to follow a seasonal pattern inmost reservoirs, with major peaks
being detected during summer periods and lowercell densities during cold periods. Although thisappeared to be a general trend, the different reser-voirs also showed varying patterns in terms ofbloom-forming species abundance, biomass and toxi-city. In Alqueva, a noticeable shift in phytoplanktoncomposition towards cyanobacterial dominance wasobserved from July to October 2005. After beingreplaced by chlorophytes and cryptophytes duringspring 2006, cyanobacteria dominated the phyto-plankton again in July 2006. Microcystis aeruginosaand Anabaena circinalis were the predominantbloom-forming species, accounting for 11 to 100%and 3 to 58% of total cyanobacterial biomass, respec-tively. However, although both potentially toxic spe-cies reached high cell densities, microcystins werenot detected throughout the sampling period.
A different pattern was observed in the Alvito reser-voir, where microcystins were detected in severalsamples containing high counts of cyanobacteria. Al-though different bloom-forming species were found,toxin concentrations were better correlated with Mi-crocystis aeruginosa biomass than with total cyanobac-terial biomass. In fact, Anabaena circinalis dominatedthe cyanobacterial assemblage from July to August2005, subsequently being replaced as a dominant spe-cies by Aphanizomenon flos-aquae, which formed anextremely dense bloom in September. During this pe-riod, the relative contribution of M. aeruginosa to theoverall cyanobacterial community never exceeded 4%of total cell counts, and microcystins remained below1.10 µg l–1. However, an increase in toxin concentra-tion in October was associated with a change in bloom
135
05
101520253035404550
0.00 0.25 0.50 0.75 1.00 1.25 1.50SRP (µmol l–1)
Samples with >10 000 cyanobacterial cells ml–1
Samples with >1000 and <10 000 cyanobacterial cells ml–1
Samples with <1000 cyanobacterial cells ml–1
Redfield N:P ratio
DIN
(µm
ol l–
1 )
Fig. 7. Relation between cyanobacterial cell concentration and molar propor-tions of dissolved inorganic nitrogen (DIN) to soluble reactive phosphorus(SRP) in the Funcho reservoir in western Algarve (July 2001 to June 2004).
The line indicates the 16N:1P Redfield ratio

Aquat Microb Ecol 53: 129–140, 2008
composition, with abundances shifting towards M.aeruginosa dominance. Although cyanobacteria werepresent in much lower total cell counts, microcystinsreached a maximum of 2.58 µg l–1 during this period.
In Enxoé, 2 phytoplankton blooms were observedthroughout the sampling period. The first one occurredin September 2005, following a steady increase incyanobacterial biomass throughout the summerperiod. The second bloom occurred in May 2006, whenan extremely high abundance of cyanobacteriaoccurred after a period of low cell counts during win-ter. Both blooms were dominated by Planktothrix spp.However, microcystins were only detected during thesecond bloom. Interestingly, no cyanobacteria were
found in June 2006, just one month after the majorpeak in toxic cyanobacteria. Subsequently, Plankto-thrix spp. dominated again in July and microcystinswere below detection limits, similar to the patternobserved in the previous year. In fact, microcystin con-centrations did not even co-vary with Planktothrix spp.cell counts during the 2006 toxic bloom, when no otherpotentially toxic species were found.
In Odivelas, 2 distinct cyanobacterial blooms alsooccurred, but with a different species composition. InAugust 2005, 3 different species of Aphanizomenonspp. predominated, contributing ca. 40% of the totalcyanobacterial counts. Other species, such as Ana-baena spp. and Microcystis aeruginosa, were also
136
Fig. 8. Phytoplankton abundances and microcystin con-centrations in the 5 Alentejo reservoirs. Values above arrows
represent microcystin concentrations (ng l–1)
Galvão et al.: Cyanobacterial blooms in southern Portugal
detected, but with much lower relative abundances (12and 14% of total cyanobacterial counts, respectively).One month later, predominance shifted sharply to-wards M. aeruginosa, with abundances increasingfrom 6500 cells ml–1 in August to 131 000 cells ml–1 inSeptember, representing ca. 50% of total cyanobac-terial cell counts. Microcystin concentrations detectedin the Odivelas reservoir were associated with highM. aeruginosa cell counts and reached a maximum of0.5 µg l–1 in September 2005. This M. aeruginosabloom was followed in October by an Aphanizomenonspp. bloom, during which M. aeruginosa abundancedecreased to <1300 cells ml–1. Cyanobacteria were notobserved during winter, but dominated the phyto-plankton in the following spring with a different spe-cies composition. In fact, cyanobacterial blooms weremainly composed of Microcystis wesenbergii fromApril to May 2006, while microcystins were notdetected.
In the Roxo reservoir, high cyanobacterial countsoccurred from July to December 2005. Two cyano-bacteria species dominated successively: Microcystisincerta in July and August (ca. 60% of the total cyano-bacterial cell counts), followed by Planktothrix sp. fromSeptember until December. High levels of microcystinswere only detected at the onset of the Planktothrix sp.bloom in September 2005. In 2006, cyanobacterialblooms did not occur until July, when Planktothrix sp.reached abundances of 15 500 cells ml–1.
DISCUSSION
The 3 studies presented here used different yet com-plementary approaches towards understanding thecomplexity of cyanobacterial bloom dynamics in differ-ent ecosystems subject to different sets of varyingenvironmental constraints, which represent a majorchallenge for implementing adequate water manage-ment strategies.
The first study addressed the impact of a recentlyconstructed dam on phytoplankton succession andcyanobacterial blooms in the Guadiana upper estuaryand focussed on changes in hydrography and sedimentload as well as light and nutrient regime. The secondstudy examined cyanobacterial bloom dynamics in dif-ferent freshwater reservoirs in the Algarve region in anattempt to discern general patterns in bloom occur-rence as well as triggering factors. The third studyevaluated seasonal changes in microcystin concentra-tions in relation to shifts in cyanobacteria speciesdominance, in terms of abundance and biomasses, in 5freshwater reservoirs in the Alentejo region. Taken asa whole, these studies emphasize the need for a com-prehensive approach towards understanding cyano-
bacterial bloom dynamics and toxin production innatural environments in order to correctly assess po-tential risk and outline adequate monitoring programs.
Initially, the impact of the Alqueva dam on phyto-plankton dynamics was predicted to increase the pre-dominance of cyanobacteria with a higher potentialtoxicity (Rocha et al. 2002). Instead, both cyanobacter-ial abundance and numbers of toxic species tended todecrease in 2003, after the period of dam constructionand filling. Cyanobacterial peak abundances duringsummer and fall remained well below the maximumcell counts observed prior to dam construction in 1996and 1997 (107 to 108 cells ml–1), probably due to theinteraction of several environmental factors such asphotolimitation resulting from increased sediment loadand haloinhibition due to deeper intrusion of saltwaterin the upper estuary.
Data from the Guadiana estuary collected since 1996revealed that, in the upper estuary, the seasonal suc-cession of phytoplankton populations generally led toa predominance of cyanobacteria in the summer andfall, which could be explained by the nutrient regime(Rocha et al. 2002). Thus, silica depletion caused thedemise of diatom blooms followed by increased abun-dance of chlorophytes in mid-spring. By the end ofspring, nitrogen limitation favoured the predominanceof small unicellular cyanobacteria from early summerto mid-fall. However, the construction of the Alquevadam, which further restricted freshwater flow, causedchanges in the nutrient regime with increased silicaconcentrations (Domingues et al. 2007), sediment loadand saltwater intrusion in the upper estuary. In fact,estuarine circulation has probably been affected tosuch a degree that both the maximum turbidity zoneand associated chlorophyll maximum no longer consti-tute well-defined features in the estuary. Unfortu-nately, slackwater runs (sampling following tidalexcursion upstream during the slackwater phase),which enable proper delineation of longitudinal andvertical profiles, have not been regularly performedsince 1998 due to lack of funding. However, a morerecent project, financed by the Portuguese NationalScience Foundation (FCT), resumed this samplingprogram in 2008.
The freshwater reservoir studies demonstrated thatdifferent types of cyanobacterial blooms had diverseorigins, while no clear seasonal pattern for cyanobac-terial abundances was found. In the Algarve reser-voirs, multivariate analysis was a useful tool to inter-pret reservoir dynamics with respect to water quality(Reis 2005). Cyanobacterial dominance in those reser-voirs was not always associated with the nutrientregime, but summer blooms were related to high watertemperatures. Water management strategies andwater removal level affected water column stratifica-
137

Aquat Microb Ecol 53: 129–140, 2008
tion, thus affecting phytoplankton dynamics andcyanobacterial blooms. In the western reservoirs, theenhancement of water column stratification, caused bythe removal of cold water from the hypolimnion, led tothe export of nutrients and produced a chemostat-likesystem for the growth of Chroococcales. In fact, themaintainenance of a warm water surface layer posi-tively selected for cyanobacteria and produced pro-longed summer blooms. In the eastern reservoirs, mix-ing of artificial spring water caused by water levelmanagement strategies was associated with late springblooms of Nostocales and Oscillatoriales, probably dueto nutrients and akinete resuspension.
Meteorological conditions such as temperature andradiation could not be associated with total cyano-bacterial abundances but only with particular bloom-forming species. Furthermore, trend analyses revealedthat the abundance of bloom species decreased in botholigotrophic and mesotrophic reservoirs, perhaps dueto increased top-down control. Finally, SRP limitationdid not seem to affect summer blooms of cyanobac-teria. Time series analyses (Legendre et al. 1985, Zuuret al. 2003) could be a useful tool for determiningselective mechanisms which affect phytoplanktoncomposition and dominance of cyanobacterial species.However, existing time series lack important ecologi-cal data such as competition, viral abundance, preda-tion rates and selective predator abundance, whichhinders the predictive accuracy of models for phyto-plankton dynamics.
Independent of environmental constraints, the Alen-tejo reservoir study showed that microcystin concen-trations in natural waters were not always related tocyanobacterial biomass or even to the abundance ofpotencially toxic species. Microcystin concentrationsfound in Alvito and Odivelas, for example, wererelated to Microcystis aeruginosa cell counts, suggest-ing that primarily this species was responsible for toxinproduction in these reservoirs. However, no micro-cystins were detected in Alqueva, despite the presenceof M. aeruginosa. In Roxo, microcystins were onlydetected in high levels during the onset of the Plank-tothrix sp. bloom in September 2005. However, nomicrocystins were found in the following months,despite the prevalence of high abundances of Plank-tothrix sp. In Enxoé, microcystins were only detectedin one Planktothrix sp. bloom, yet toxin concentrationsdid not follow Planktothrix sp. cell counts during thebloom.
Variations in toxin production between and withincyanobacterial species are well known from laboratorystudies based on isolated strains (Rapala et al. 1997,Kameyama et al. 2004, Welker et al. 2004, Saker et al.2005). Furthermore, blooms may be composed ofcyanobacterial assemblages producing different toxins
at different rates, while the same bloom-forming spe-cies can occur as both toxic and non-toxic forms, whichare impossible to differentiate based on morphologicalexamination. In fact, all reservoirs included in thisstudy showed very sharp changes in cyanobacterialabundance, whereas marked differences in toxicitywere observed both between blooms and within thesame bloom. These observations emphasize the irreg-ular pattern of cyanobacterial blooms and cyanotoxinproduction. Consequently, there is a pressing need forthe implementation of systematic monitoring programsof cyanobacteria and cyanotoxins in natural waters inorder to minimize potential health risks to animal andhuman populations resulting from exposure throughdrinking water and recreational activities.
CONCLUSIONS
The need for better integration of ecological aspectsin water quality assessment is generally accepted, butthe European Union Directive (http://ec.europa.eu/environment/water/water-framework/) that encom-passes measures for protection of the ecological qualityof waters is far from being fully implemented. System-atic approaches to reservoir ecology should lead to theestablishment of ecological water quality criteria,which in turn should help to outline adequate monitor-ing programs with specific time-scale adjustments,depending on the ecosystem. Ecological water qualitycriteria should be useful not only in promoting envi-ronmental conservation and rehabilitation but also as atool for raw water management, allowing, for instance,drinking water treatment plants to more efficientlyadjust their technologies for the removal of Cyanobac-teria and cyanotoxins.
Acknowledgements. The Guadiana estuary monitoring wasfunded by a series of projects 16/REGII/6/96 and 15/REGII/6/96 (INTERREGII program), EMERGE (ODIANA re-gional program), project nr. 45 (Risk evaluation of toxic bloomsin lower Guadiana) from LEADER+ program. We also thank A.Matthiensen, C. Rocha, and C. Sobrino for contributing to dif-ferent parts of this study at different times. R. Domingues ac-knowledges PhD Grant SFRH/BD/27536/2006 and E. ValérioPhD Grant SFRH/BD/8272/2002 from the Portuguese Scienceand Technology Foundation (FCT). Algarve reservoirs werestudied within the framework of 4 research projects, namelyCIANOTOX (2001 to 2004), funded by the regional watermanagement company Águas do Algarve, S.A., andCIANOALERTA I, II and III (2003 to 2008) funded through IN-TERREG IIIA, contracts n° SP5/P35/01, SP5/P19/02 andSP5/P138/03 in collaboration with Águas do Algarve, the re-gional coordination commission CCDR-Algarve (Portugal),University of Huelva and the Southern Spain water manage-ment company GIAHSA (Spain). H.M.G., M.P.R. and P.P. coor-dinated the composition of the manuscript. H.M.G. coordi-nated and A.B., S.C., R.B.D., R.M. and M.P.R. participated in
138

Galvão et al.: Cyanobacterial blooms in southern Portugal
the Guadiana estuary study. M.P.R. coordinated the researchand D.L., S.C., R.M., C.C. and C.G. participated in the Algarvereservoir study. P.P. coordinated and E.V., N.F. and S.P. partic-ipated in the Alentejo reservoir study.
LITERATURE CITED
Berg K, Carmichael WW, Skulberg OM, Benestad C, Under-dal B (1987) Investigation of a toxic-water bloom of Micro-cystis aeruginosa (Cyanophyceae) in Lake Akersvatn,Norway. Hydrobiologia 144:97–103
Berger WH, Parker FL (1970) Diversity of planktonic Forami-nifera in deep sea sediments. Science 168:1345–1347
Cabeçadas G, Brogueira MJ (1981) Notas sobre a qualidadeda água do Rio Guadiana. Instituto Nacional de Investi-gação das Pescas e do Mar, Lisboa (in portuguese)
Caetano S, Miguel R, Mendes P, Galvão H, Barbosa A (2001)Cyanobacteria blooms and cyanotoxin occurrence in theGuadiana (SE-Portugal) — Preliminary results. EcotoxEnviron Restor 4:53–59
Carmichael WW (1996) Toxic Microcystis and the environ-ment. In: Watanabe MF, Harada KI, Carmichael WW,Fujiki H (eds) Toxic microcystis. CRC Press, Boca Raton,FL, p 1–11
Carmichael WW, Min-Juan Y, Zheng-Rong H, Jia-Wan H,Jia-Lu Y (1988) Occurrence of the toxic cyanobacterium(blue-green alga) Microcystis aeruginosa in central China.Arch Hydrobiol 114:21–30
Chorus I (2001) Cyanotoxins: occurrence, causes, conse-quences. Springer Verlag, Berlin
Chorus I (2005) Current approaches to cyanotoxin riskassessment, risk management and regulations in differentcountries. Federal Environmental Agency, Dessau-Roßlau
Chorus I, Bartram J (1999) Toxic cyanobacteria in water — aguide to their public health consequences, monitoring andmanagement. E & FN Spon, London
Cloern JE (1987) Turbidity as a control on phytoplanktonbiomass and productivity in estuaries. Cont Shelf Res 7:1367–1381
Cloern JE (1996) Phytoplankton bloom dynamics in coastalecosystems: a review with some general lessons from sus-tained investigation of San Francisco Bay, California. RevGeophys 34:127–168
Cloern JE (1999) The relative importance of light and nutrientlimitation of phytoplankton growth: a simple index ofcoastal ecosystem sensitivity to nutrient enrichment.Aquat Ecol 33:3–16
Codd GA (2000) Cyanobacterial toxins, the perception ofwater quality, and the prioritisation of eutrophicationcontrol. Ecol Eng 16:51–60
Codd GA, Morrison LF, Metcalf JS (2005) Cyanobacterialtoxins: risk management for health protection. ToxicolAppl Pharmacol 203:264–272
Dittmann E, Wiegand C (2006) Cyanobacterial toxins —occurrence, biosynthesis and impact on human affairs.Mol Nutr Food Res 50:7–17
Domingues RB, Galvão H (2007) Phytoplankton and environ-mental variability in a dam regulated temperate estuary.Hydrobiologia 586:117–134
Domingues RB, Barbosa A, Galvão H (2005) Nutrients, lightand phytoplankton succession in a temperate estuary (theGuadiana, south-western Iberia). Estuar Coast Shelf Sci64:249–260
Domingues RB, Sobrino C, Galvão H (2007) Effects of reser-voir filling on phytoplankton succession and cyanobacte-ria blooms in a temperate estuary. Estuar Coast Shelf Sci
74:31–43Druvietis I (1997) Observations on cyanobacterial blooms in
Latvia’s Inland. In: Reguera B, Blanco J, Fernández ML,Wyatt T (eds) Harmful algae. Xunta de Galicia, Intergov-ernamental Oceanographic Commision of UNESCO,Vigo, p 35–36
Falconer IR (2005) Cyanobacterial toxins of drinking watersupplies—cylindrospermopsins and microcystins. CRCPress, Boca Raton, FL
Haas LW (1982) Improved epifluorescence microscopy forobserving planktonic microorganisms. Ann Inst Oceanogr58:261–266
Hutchinson GE (1961) The paradox of the plankton. Am Nat95:137–145
Hutchinson GE (1967) A treatise on limnology. John Wiley &Sons, New York
Kameyama K, Sugiura N, Inamori Y, Maekawa T (2004)Characteristics of microcystin production cell cycle ofMicrocystis viridis. Environ Toxicol 19:20–25
Kawara O, Yura E, Fujii S, Matsumoto T (1998) A study on therole of hydraulic retention time in eutrophication of theAsahi river dam reservoir. Water Sci Technol 37: 245–252
Kononen K, Kuparinen J, Makela K, Laanemets J, Pavelson J,Nömmann S (1996) Initiation of cyanobacterial blooms in afrontal region at the entrance to the Gulf on Finland, BalticSea. Limnol Oceanogr 41:98–112
Legendre P, Dallot S, Legendre L (1985) Succession of specieswithin a community: chronological clustering, with appli-cations to marine and freshwater zooplankton. Am Nat125:257–288
Magurran A (1988) Ecological diversity and its measurement.Princeton University Press, Princeton, NJ
Moreno I, Cameán A, Tavares MJ, Pereira P, Franca S (2003)Toxicity of cyanobacteria isolated from the GuadianaRiver. Aquat Ecosyst Health Manag 6:409–413
Oliveira MR (1985) Relatório dos estudos biológicos realiza-dos no Rio Guadiana e na estação. de tratamento de águasda vila de Mértola. Relatório Técnico e Científico do IPIMAR, Lisboa (in portuguese)
Oliveira MR (1991) Eutrofização do Rio Guadiana. Blooms decyanophyceae e influência na ictiofauna. RelatórioTécnico e Científico do INIP, Lisboa (in portuguese)
Pereira P, Onodera H, Andinolo D, Franca S, Araújo F, LagosN, Oshima Y (2001) Co-occurrence of PSP toxins andmicrocystins in Montargil freshwater reservoir, Portugal.In: Hallegraeff GM, Blackburn SI, Bolch CJ, Lewis RJ(eds) Harmful algal blooms 2000. IOC, UNESCO, Parisp 108–111
Pinckney JL, Paerl HW, Harrington MB, Howe KE (1998)Annual cycles of phytoplankton community-structure andbloom dynamics in the Neuse River Estuary, NorthCarolina. Mar Biol 131:371–381
Rapala J, Sivonen K, Lyra C, Niemelä SI (1997) Variation ofmicrocystins, cyanobacterial hepatotoxins, in Anabaenaspp. as a function of growth stimuli. Appl Environ Micro-biol 63:2206–2212
Reis MP (2005) Dynamics of cyanobacteria blooms in Funchoreservoir (Algarve-Portugal) — a multivariate analysis.PhD Thesis, Universidade do Algarve, Faro, Portugal
Rocha C, Galvão H, Barbosa A (2002) Role of transient siliconlimitation in the development of cyanobacteria blooms inthe Guadiana estuary, south-western Iberia. Mar EcolProg Ser 228:35–45
Saker ML, Fastner J, Dittmann E, Christiansen G, Vasconce-los VM (2005) Variation between strains of the cyanobac-terium Microcystis aeruginosa isolated from a Portugueseriver. J Appl Microbiol 99:749–757
139

Aquat Microb Ecol 53: 129–140, 2008
Sivonen K, Jones GJ (1999) Cyanobacterial toxins. In: ChorusI, Bartram J (eds) Toxic cyanobacteria in water. A guide totheir public health consequences, monitoring and man-agement. WHO. E & FN Spon, London, p 41–111
Smetacek V (1985) The annual cycle of Kiel Bight plankton: along term analysis. Estuaries 8:145–157
Sobrino C, Matthiensen A, Vidal S, Galvão H (2004)Occurrence of microcystins along the Guadiana estuary.Limnetica 23:133–143
Vasconcelos VM (1993) Toxicity of cyanobacteria in lakes ofNorth and Central Portugal. Ecological implications. VerhInternat Verein Limnol 25: 694–697
Vasconcelos VM (1994) Toxic cyanobacteria (blue-greenalgae) in Portuguese fresh waters. Arch Hydrobiol 130:439–451
Vasconcelos VM (2001) Freshwater cyanobacteria and theirtoxins in Portugal. In: Chorus I (ed) Cyanotoxins: occur-rence, causes, consequences. Springer Verlag, Heidelbergp 62–67
Vasconcelos VM, Pereira E (2001) Cyanobacteria diversityand toxicity in a wastewater treatment plant (Portugal).Water Res 35:1354–1357
Vasconcelos VM, Sivonen K, Evans WR, Carmichael WW,Namikoshi M (1996) Hepatotoxic microcystin diversity incyanobacterial blooms collected in Portuguese fresh-waters. Water Res 30:2377–2384
Welker M, Brunke M, Preussel K, Lippert I, von Döhren H(2004) Diversity and distribution of Microcystis (Cyano-bacteria) oligopeptide chemotypes from natural communi-ties studied by single-colony mass spectrometry. Micro-biology 150:1785–1796
WHO (World Health Organization) (1998) Cyanobacterialtoxins: Microcystin-LR. In: Guidelines for drinking-waterquality. World Health Organization, Geneva, p 95–110
Zuur AF, Fryer RJ, Jollife IT, Dekkere R, Beukema JJ (2003)Estimating common trends in multivariate time seriesusing dynamic factor analysis. Environmetrics 14:665–685
140
Submitted: M;arch 3, 2008; Accepted: August 5, 2008 Proofs received from author(s): September 14, 2008
Copyright © 2022 FDOKUMEN