Effect of pH, EDTA, and Anions on Heavy Metal Toxicity Toward a Bioluminescent Cyanobacterial...
11
Effect of pH, EDTA, and Anions on Heavy Metal Toxicity Toward a Bioluminescent Cyanobacterial Bioreporter Ismael Rodea-Palomares Coral Gonza ´lez-Garcı ´a Francisco Legane ´s Francisca Ferna ´ndez-Pin ˜as Received: 20 November 2008 / Accepted: 22 December 2008 / Published online: 24 January 2009 Ó Springer Science+Business Media, LLC 2009 Abstract The bioavailability and therefore toxicity of a metal depends on the chemical species present in a par- ticular environment. We evaluated the effect of a series of factors that could potentially modify metal speciation on the toxicity of Hg, Cu, Zn, and Cd toward a recombinant strain of the freshwater cyanobacterium Anabaena sp. PCC 7120 with cloned lux operon of luminescent terrestrial bacterium Photorhabdus luminescens. The strain, denoted as Anabaena CPB4337, showed a high constitutive lumi- nescence with no need to add exogenous aldehyde. The tested factors were pH, EDTA (as organic ligand), and anions PO 4 3– , CO 3 2– , and Cl – . Chemical modeling and correlation analyses were used to predict metal speciation and link it with toxicity. In general, metal toxicity signif- icantly correlated to the predicted metal free-ion concentration, although Zn–EDTA complexes and certain Hg chloro-complexes could also exhibit some toxicity to cyanobacteria. An interesting feature of metal toxicity to strain Anabaena CPB4337 was that low amounts of PO 4 3– and CO 3 2– increased metal toxicity; this effect could not be related to significant changes in metal speciation and could be attributed to a modulating effect of these anions on metal/uptake toxicity. The combination of toxicity studies that take into account a range of factors that might mod- ulate metal toxicity with chemical modeling to predict changes in metal speciation might be useful for interpreting complex toxicity data. Finally, this cyanobacterial biore- porter, due to its ecological relevance as a primary producer, could be used as a tool for toxicity assessment in freshwater environments. Available freshwater resources are polluted by industrial effluents, domestic and commercial sewage, as well as mine drainage, agricultural runoff and litter. Among water pollutants, heavy metals are priority toxicants that pose potential risks to human health and the environment. The evaluation of heavy metal contamination traditionally relies on highly sensitive and specific physical and chem- ical techniques such as atomic absorption spectroscopy or mass spectrometry; however, such methods are not able to distinguish between available (potentially hazardous to biological systems) and nonavailable (potentially nonhaz- ardous) fractions of metals that exist in the environment in inert or complexed forms. Toxicity bioassays and biosen- sors might complement physical and chemical methods by detecting the toxicity related with bioavailable metals in environmental samples, effectively integrating the com- plexity of environmental factors (pH, redox potential, exchangeable cations, biological activity, etc.) that con- tribute to bioavailability (Ko ¨hler et al. 2000). Bioavailability is strongly affected by the speciation of a metal in a particular environment. Water chemistry parameters such as alkalinity, pH, salinity, hardness, phosphates, or ionic strength (Cook et al. 2000; Ho et al. I. Rodea-Palomares and C. Gonza ´lez-Garcı ´a contributed equally to this work. I. Rodea-Palomares C. Gonza ´lez-Garcı ´a F. Legane ´s F. Ferna ´ndez-Pin ˜as (&) Departamento de Biologı ´a, Facultad de Ciencias, Universidad Auto ´noma de Madrid, Cantoblanco, 28049 Madrid, Spain e-mail: [email protected] Present Address: C. Gonza ´lez-Garcı ´a Instituto de Salud Carlos III, Centro Nacional de Microbiologı ´a, Regulacio ´n Ge ´nica, Crta de Majadahonda-Pozuelo Km 2, 28220 Madrid, Spain 123 Arch Environ Contam Toxicol (2009) 57:477–487 DOI 10.1007/s00244-008-9280-9
Transcript of Effect of pH, EDTA, and Anions on Heavy Metal Toxicity Toward a Bioluminescent Cyanobacterial...
Effect of pH, EDTA, and Anions on Heavy Metal Toxicity Towarda Bioluminescent Cyanobacterial Bioreporter
Ismael Rodea-Palomares Æ Coral Gonzalez-Garcıa ÆFrancisco Leganes Æ Francisca Fernandez-Pinas
Received: 20 November 2008 / Accepted: 22 December 2008 / Published online: 24 January 2009
� Springer Science+Business Media, LLC 2009
Abstract The bioavailability and therefore toxicity of a
metal depends on the chemical species present in a par-
ticular environment. We evaluated the effect of a series of
factors that could potentially modify metal speciation on
the toxicity of Hg, Cu, Zn, and Cd toward a recombinant
strain of the freshwater cyanobacterium Anabaena sp. PCC
7120 with cloned lux operon of luminescent terrestrial
bacterium Photorhabdus luminescens. The strain, denoted
as Anabaena CPB4337, showed a high constitutive lumi-
nescence with no need to add exogenous aldehyde. The
tested factors were pH, EDTA (as organic ligand), and
anions PO43–, CO3
2–, and Cl–. Chemical modeling and
correlation analyses were used to predict metal speciation
and link it with toxicity. In general, metal toxicity signif-
icantly correlated to the predicted metal free-ion
concentration, although Zn–EDTA complexes and certain
Hg chloro-complexes could also exhibit some toxicity to
cyanobacteria. An interesting feature of metal toxicity to
strain Anabaena CPB4337 was that low amounts of PO43–
and CO32– increased metal toxicity; this effect could not be
related to significant changes in metal speciation and could
be attributed to a modulating effect of these anions on
metal/uptake toxicity. The combination of toxicity studies
that take into account a range of factors that might mod-
ulate metal toxicity with chemical modeling to predict
changes in metal speciation might be useful for interpreting
complex toxicity data. Finally, this cyanobacterial biore-
porter, due to its ecological relevance as a primary
producer, could be used as a tool for toxicity assessment in
freshwater environments.
Available freshwater resources are polluted by industrial
effluents, domestic and commercial sewage, as well as
mine drainage, agricultural runoff and litter. Among water
pollutants, heavy metals are priority toxicants that pose
potential risks to human health and the environment. The
evaluation of heavy metal contamination traditionally
relies on highly sensitive and specific physical and chem-
ical techniques such as atomic absorption spectroscopy or
mass spectrometry; however, such methods are not able to
distinguish between available (potentially hazardous to
biological systems) and nonavailable (potentially nonhaz-
ardous) fractions of metals that exist in the environment in
inert or complexed forms. Toxicity bioassays and biosen-
sors might complement physical and chemical methods by
detecting the toxicity related with bioavailable metals in
environmental samples, effectively integrating the com-
plexity of environmental factors (pH, redox potential,
exchangeable cations, biological activity, etc.) that con-
tribute to bioavailability (Kohler et al. 2000).
Bioavailability is strongly affected by the speciation of a
metal in a particular environment. Water chemistry
parameters such as alkalinity, pH, salinity, hardness,
phosphates, or ionic strength (Cook et al. 2000; Ho et al.
I. Rodea-Palomares and C. Gonzalez-Garcıa contributed equally to
this work.
I. Rodea-Palomares � C. Gonzalez-Garcıa � F. Leganes �F. Fernandez-Pinas (&)
Departamento de Biologıa, Facultad de Ciencias, Universidad
Autonoma de Madrid, Cantoblanco, 28049 Madrid, Spain
e-mail: [email protected]
Present Address:C. Gonzalez-Garcıa
Instituto de Salud Carlos III, Centro Nacional de Microbiologıa,
Regulacion Genica, Crta de Majadahonda-Pozuelo Km 2,
28220 Madrid, Spain
123
Arch Environ Contam Toxicol (2009) 57:477–487
DOI 10.1007/s00244-008-9280-9
1999) might influence metal ion toxicity either directly by
lowering free metal ion concentration or indirectly through
synergistic or antagonistic effects. Furthermore, bioavail-
able concentrations of metals in the environment can be
altered by chelating substances from natural (humic and
fulvic acids) or anthropogenic sources (EDTA or poly-
phosphates). Most studies have found that toxicity is
usually a function of the free metal ion because this species
is generally the most bioavailable one (Campbell 1995);
however, there are many other reports that showed that the
toxic response does not always conform to the free-ion
model and that organic complexing agents and/or inorganic
hydroxyl or carbonate complexes might also exhibit some
toxicity to target organisms (Allen and Hansen 1996;
Campbell et al. 2000; Deheyn et al. 2004; Fernandez-Pinas
et al. 1991; Parent et al. 1996).
Cyanobacteria are the only prokaryotic organisms car-
rying out an oxygen-evolving photosynthesis. They
originated during the Precambrian era (2.8 9 109 years
ago), and as a group they are known to survive a wide
spectrum of environmental stresses. As primary producers
with a key role in the N and C cycles, they are a dominant
component of marine and freshwater phytoplankton and
any detrimental effect on this group might have a negative
impact in nutrient availability to organisms of higher tro-
phic level.
In this study, we report the effect of potential modifying
factors on metal speciation such as pH, complexing agent
EDTA, and anions PO43–, CO3
2–, and Cl– on the toxicity of
Cu, Zn, Hg, and Cd toward a self-luminescent recombinant
strain of the freshwater cyanobacterium Anabaena sp. PCC
7120. As luminescence is directly proportional to the
metabolic status of the cell and any inhibition of cellular
activity is reflected in a decrease of bioluminescence;
toxicity was measured as luminescence inhibition caused
by biologically available metal species. We used chemical
modeling (Visual MINTEQ and PHREEQC programs) and
correlation analyses in an attempt to link toxicity with
metal speciation.
Methods and Materials
Strain and Culture Conditions
Anabaena sp. PCC 7120 strain CPB4337 (hereinafter
Anabaena CPB4337), which bears in the chromosome a
Tn5 derivative with luxCDABE from the luminescent ter-
restrial bacterium Photorhabdus luminescens (formerly
Xenorhabdus luminescens), was used in this study as a
bioreporter of metal toxicity. This strain shows a high
constitutive self-luminescence with no need to add exog-
enous aldehyde; also, cell viability is not significantly
affected by the Tn5 insertion and the endogenous genera-
tion of aldehyde (Fernandez-Pinas and Wolk 1994).
Luminescence was shown to be high in this strain in a
range of temperatures between 20�C and 30�C, in accord
with Photorhabdus luminescens luciferase having the
greatest thermal stability (Fernandez-Pinas et al. 2000;
Szittner and Meighen 1990). Anabaena CPB4337 was
routinely grown at 28�C in the light, Ca.65 lmol photons
m2/s on a rotary shaker in 50 mL AA/8 medium (Allen and
Arnon 1955) supplemented with nitrate (5 mM) in 125-mL
Erlenmeyer flasks. The strain was grown in liquid cultures
with 10 lg of neomycin sulfate (Nm) per mL.
Heavy Metal Toxicity Assays
Toxicity response of the cyanobacterium was estimated as
EC50 values, the median effective concentration of the
metal that causes a 50% bioluminescence inhibition with
respect to a nontreated control. Standard metal solutions of
Hg, Cu, Zn, and Cd were serially diluted (five to eight
serial dilutions) for the EC50 determinations and were
buffered with 2 mM MES [2-(N-morpholino) ethanesul-
fonic acid] and adjusted to pH 5.8. The use of most buffers
(like Tris or Tricine) might not be appropriate, as precip-
itation and complexation of metals might occur
(Fernandez-Pinas et al. 1991) and the alkylsulfonate
derivatives of morpholine, like MES, are reported to be
noncomplexing for metals (Kandegedara and Rorabacher
1999). Previous experiments in the current study showed
the following: luminescence of strain Anabaena CPB4337
was high in a pH range from 5.8 to 8 (not shown); pH 5.8
was finally chosen for the toxicity bioassays because most
metals are biologically available; according to Visual
MINTEQ and PHREEQC calculations, the free-ion species
of Cu, Zn, and Cd ranged between 95% and 99.99% of the
total metal species present at pH 5.8 (Table 1); however, in
the case of Hg, chemical modeling predicted that for pH
values between 1 and 9, in the range of Hg concentrations
used in the study, less than 0.001% was present as free ion
Hg2?.
Toxicity bioassays were as follows: 160 lL from the
serial dilutions of each heavy metal plus a control [double
distilled water (ddH2O) buffered with 2 mM MES at pH
5.8] were disposed in an opaque white 96-well microtiter
plates. Cells, grown as described, were washed twice and
resuspended in ddH2O buffered with 2 mM MES at pH 5.8
and were added to the microtiter plate wells to reach a final
cell density of 0.5 at optical density (OD) 750 nm. Lumi-
nescence of each sample was recorded every 5 min in a
Centro LB 960 luminometer up to 30 min. Three inde-
pendent experiments with quadruplicate samples were
conducted.
478 Arch Environ Contam Toxicol (2009) 57:477–487
123

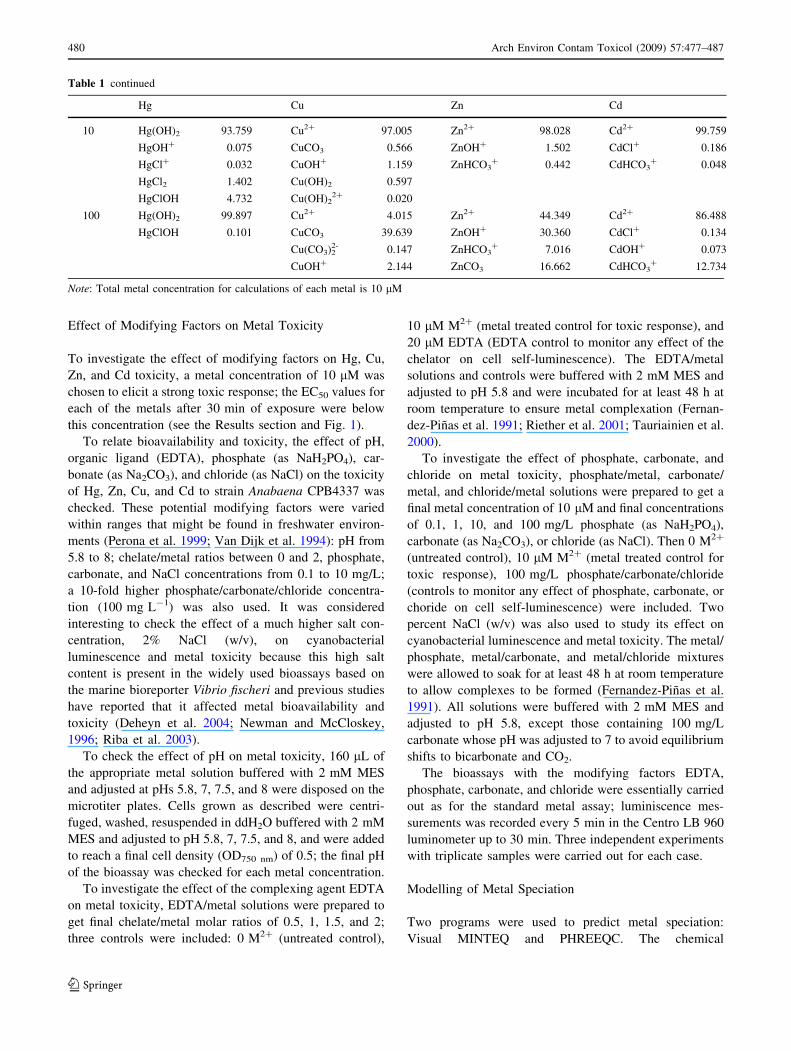
Table 1 Predicted percentages of the total concentration of metal present as free-ion and dominant forms of metal complexes in the aqueous
phase at increasing pH values and increasing phosphate and carbonate concentrations as calculated by Visual MINTEQ
Hg Cu Zn Cd
pH
5.8 Hg(OH)2 93.674 Cu2? 98.117 Zn2? 98.436 Cd2? 99.806
HgOH? 0.148 CuSO4 0.011 ZnOH? 1.558 CdCl? 0.187
HgCl2 1.395 CuOH? 1.227
HgClOH 4.719 Cu(OH)2 0.643
7 Hg(OH)2 99.871 Cu2? 35.092 Zn2? 79.826 Cd2? 99.705
HgClOH 0.123 CuOH? 6.969 ZnOH? 20.046 CdCl? 0.187
Cu(OH)2 57.880 Zn(OH)2 0.123 CdOH? 0.097
Cu2(OH)22? 0.054
7.5 Hg(OH)2 99.959 Cu2? 5.514 Zn2? 55.228 Cd2? 99.474
HgClOH 0.039 CuOH? 3.465 ZnOH? 43.912 CdCl? 0.187
Cu(OH)2 91.007 Zn(OH)2 0.856 CdOH? 0.305
Cu2(OH)22? 0.013
8 Hg(OH)2 99.987 Cu2? 0.595 Zn2? 27.222 Cd2? 98.749
HgClOH 0.012 CuOH? 1.183 ZnOH? 68.548 CdCl? 0.185
Cu(OH)2 98.219 Zn(OH)2 4.226 CdOH? 0.959
PO43- (mg/L1)
0.1 Hg(OH)2 96.180 Cu2? 94.943 Zn2? 97.530 Cd2? 99.792
HgCl? 0.013 CuHPO4 0.012 ZnOH? 2.445 CdCl? 0.187
HgCl2 0.606 CuOH ? 2.332 ZnHPO4 0.013 CdHPO4 0.010
HgClOH 3.152 Cu(OH)2 2.423
1 Hg(OH)2 96.188 Cu2? 96.193 Zn2? 97.403 Cd2? 99.701
HgOH? 0.048 CuH2PO4? 0.039 ZnOH? 2.432 CdCl? 0.186
HgCl? 0.013 CuHPO4 0.098 ZnH2PO4? 0.038 CdHPO4 0.102
HgCl2 0.604 CuOH? 1.869 ZnHPO4 0.120
HgClOH 3.146 Cu(OH)2 1.541
10 Hg(OH)2 96.226 Cu2? 95.173 Zn2? 96.083 Cd2? 98.840
HgCl? 0.013 CuH2PO4? 0.369 ZnOH ? 2.340 CdCl? 0.178
HgCl2 0.593 CuHPO4 0.933 ZnH2PO4? 0.382 CdHPO4 0.971
HgClOH 3.119 CuOH? 1.806 ZnHPO4 1.188
Cu(OH)2 1.477
100 Hg(OH)2 93.950 Cu2? 92.786 Zn2? 89.383 Cd2? 94.679
HgCl? 0.032 CuH2PO4? 3.333 ZnOH ? 1.257 CdCl? 0.152
HgCl2 1.328 CuHPO4 2.971 ZnH2PO4? 3.220 CdHPO4 5.163
HgClOH 4.611 CuOH? 0.586 ZnHPO4 6.135
Cu(OH)2 0.169
CO32- (mg/L)
0.1 Hg(OH)2 93.677 Cu2? 97.921 Zn2? 98.432 Cd2? 99.801
HgCl2 1.433 CuOH? 1.205 ZnOH? 1.557 CdCl? 0.187
HgClOH 4.783 Cu(OH)2 0.628
1 Hg(OH)2 93.692 Cu2? 97.838 Zn2? 98.396 Cd2? 99.759
HgOH? 0.074 CuOH? 0.059 ZnOH? 1.549 CdCl? 0.186
HgCl? 0.032 Cu(OH)2 1.199 ZnHCO3? 0.046 CdHCO3
? 0.048
HgCl2 1.428
HgClOH 4.774
Arch Environ Contam Toxicol (2009) 57:477–487 479
123
Effect of Modifying Factors on Metal Toxicity
To investigate the effect of modifying factors on Hg, Cu,
Zn, and Cd toxicity, a metal concentration of 10 lM was
chosen to elicit a strong toxic response; the EC50 values for
each of the metals after 30 min of exposure were below
this concentration (see the Results section and Fig. 1).
To relate bioavailability and toxicity, the effect of pH,
organic ligand (EDTA), phosphate (as NaH2PO4), car-
bonate (as Na2CO3), and chloride (as NaCl) on the toxicity
of Hg, Zn, Cu, and Cd to strain Anabaena CPB4337 was
checked. These potential modifying factors were varied
within ranges that might be found in freshwater environ-
ments (Perona et al. 1999; Van Dijk et al. 1994): pH from
5.8 to 8; chelate/metal ratios between 0 and 2, phosphate,
carbonate, and NaCl concentrations from 0.1 to 10 mg/L;
a 10-fold higher phosphate/carbonate/chloride concentra-
tion (100 mg L-1) was also used. It was considered
interesting to check the effect of a much higher salt con-
centration, 2% NaCl (w/v), on cyanobacterial
luminescence and metal toxicity because this high salt
content is present in the widely used bioassays based on
the marine bioreporter Vibrio fischeri and previous studies
have reported that it affected metal bioavailability and
toxicity (Deheyn et al. 2004; Newman and McCloskey,
1996; Riba et al. 2003).
To check the effect of pH on metal toxicity, 160 lL of
the appropriate metal solution buffered with 2 mM MES
and adjusted at pHs 5.8, 7, 7.5, and 8 were disposed on the
microtiter plates. Cells grown as described were centri-
fuged, washed, resuspended in ddH2O buffered with 2 mM
MES and adjusted to pH 5.8, 7, 7.5, and 8, and were added
to reach a final cell density (OD750 nm) of 0.5; the final pH
of the bioassay was checked for each metal concentration.
To investigate the effect of the complexing agent EDTA
on metal toxicity, EDTA/metal solutions were prepared to
get final chelate/metal molar ratios of 0.5, 1, 1.5, and 2;
three controls were included: 0 M2? (untreated control),
10 lM M2? (metal treated control for toxic response), and
20 lM EDTA (EDTA control to monitor any effect of the
chelator on cell self-luminescence). The EDTA/metal
solutions and controls were buffered with 2 mM MES and
adjusted to pH 5.8 and were incubated for at least 48 h at
room temperature to ensure metal complexation (Fernan-
dez-Pinas et al. 1991; Riether et al. 2001; Tauriainien et al.
2000).
To investigate the effect of phosphate, carbonate, and
chloride on metal toxicity, phosphate/metal, carbonate/
metal, and chloride/metal solutions were prepared to get a
final metal concentration of 10 lM and final concentrations
of 0.1, 1, 10, and 100 mg/L phosphate (as NaH2PO4),
carbonate (as Na2CO3), or chloride (as NaCl). Then 0 M2?
(untreated control), 10 lM M2? (metal treated control for
toxic response), 100 mg/L phosphate/carbonate/chloride
(controls to monitor any effect of phosphate, carbonate, or
choride on cell self-luminescence) were included. Two
percent NaCl (w/v) was also used to study its effect on
cyanobacterial luminescence and metal toxicity. The metal/
phosphate, metal/carbonate, and metal/chloride mixtures
were allowed to soak for at least 48 h at room temperature
to allow complexes to be formed (Fernandez-Pinas et al.
1991). All solutions were buffered with 2 mM MES and
adjusted to pH 5.8, except those containing 100 mg/L
carbonate whose pH was adjusted to 7 to avoid equilibrium
shifts to bicarbonate and CO2.
The bioassays with the modifying factors EDTA,
phosphate, carbonate, and chloride were essentially carried
out as for the standard metal assay; luminiscence mes-
surements was recorded every 5 min in the Centro LB 960
luminometer up to 30 min. Three independent experiments
with triplicate samples were carried out for each case.
Modelling of Metal Speciation
Two programs were used to predict metal speciation:
Visual MINTEQ and PHREEQC. The chemical
Table 1 continued
Hg Cu Zn Cd
10 Hg(OH)2 93.759 Cu2? 97.005 Zn2? 98.028 Cd2? 99.759
HgOH? 0.075 CuCO3 0.566 ZnOH? 1.502 CdCl? 0.186
HgCl? 0.032 CuOH? 1.159 ZnHCO3? 0.442 CdHCO3
? 0.048
HgCl2 1.402 Cu(OH)2 0.597
HgClOH 4.732 Cu(OH)22? 0.020
100 Hg(OH)2 99.897 Cu2? 4.015 Zn2? 44.349 Cd2? 86.488
HgClOH 0.101 CuCO3 39.639 ZnOH? 30.360 CdCl? 0.134
Cu(CO3)22- 0.147 ZnHCO3
? 7.016 CdOH? 0.073
CuOH? 2.144 ZnCO3 16.662 CdHCO3? 12.734
Note: Total metal concentration for calculations of each metal is 10 lM
480 Arch Environ Contam Toxicol (2009) 57:477–487
123
equilibrium model Visual MINTEQ (http://www.lwr.
kth.se/English/OurSoftware/vminteq/index.htm) is based
on the program PC MINTEQA2 version 4.0 (Allison et al.
1991). Assumptions of a fixed pH, fixed potential redox
(Eh), closed system, and no precipitation of solid phases
were made during computations. The geochemical model
PHREEQC version 2 (Parkhurst and Appelo 1999) was
used with the aid of the graphical user interface PHRE-
EQCI (version 2) http://wwwbrr.cr.usgs.gov/projects/
GWC_coupled/phreeqc/index.html). These chemical mod-
els have proved very useful for linking speciation to metal
toxicity and biosorption processes in a number of organ-
isms (Campbell et al. 2000; Deheyn et al. 2004; Herrero
et al. 2005; Newman and McCloskey 1996). Both model
calculations were very similar and, to simplify, only
dominant metal species for each tested condition as cal-
culated by Visual MINTEQ are shown in Tables 1 and 3.
Analysis of Results
The toxic response of Anabaena CPB4337 as EC50 values
was estimated by fitting the experimental luminescence
inhibition data to a three-parameter logarithmic function:
f ¼ a= 1þ exp � x� x0ð Þ=b½ �f g;
where f is the percentage of bioluminescence inhibition, x
is the logarithm of metal concentration, a, b, and x0 are the
parameters of the equation estimated by the model.
% lu
min
esce
nce
inhi
bitio
n
0
20
40
60
80
Experimental data
Sigmoidal fit R2=0.96
EC50-30min= 6.76 ± 1.21 µM
Cd2+
log metal concentration
% lu
min
esce
nce
inhi
bitio
n
0
20
40
60
80
100
120
EC50-30min=1.52 ± 0.1 µM
Experimental data
Sigmoidal fit R2=0.99
Cu2+
Experimental data
Sigmoidal fit. R2=0.99
EC50-30min= 3.94 ± 0.19 µM
% lu
min
esce
nce
inhi
bitio
n
0
20
40
60
80
100
Zn2+
Experimental data
Sigmoidal fit R2= 0.97
EC50-30min = 1.99 ± 0.29 µM
log metal concentration-8 -6 -4 -2 0 2 4
log metal concentration-8 -6 -4 -2 0 2 4
-8 -6 -4 -2 0 2 4
log metal concentration-8 -6 -4 -2 0 2 4
% lu
min
isce
nce
inhi
bitio
n
0
20
40
60
80
100
120
Hg2+
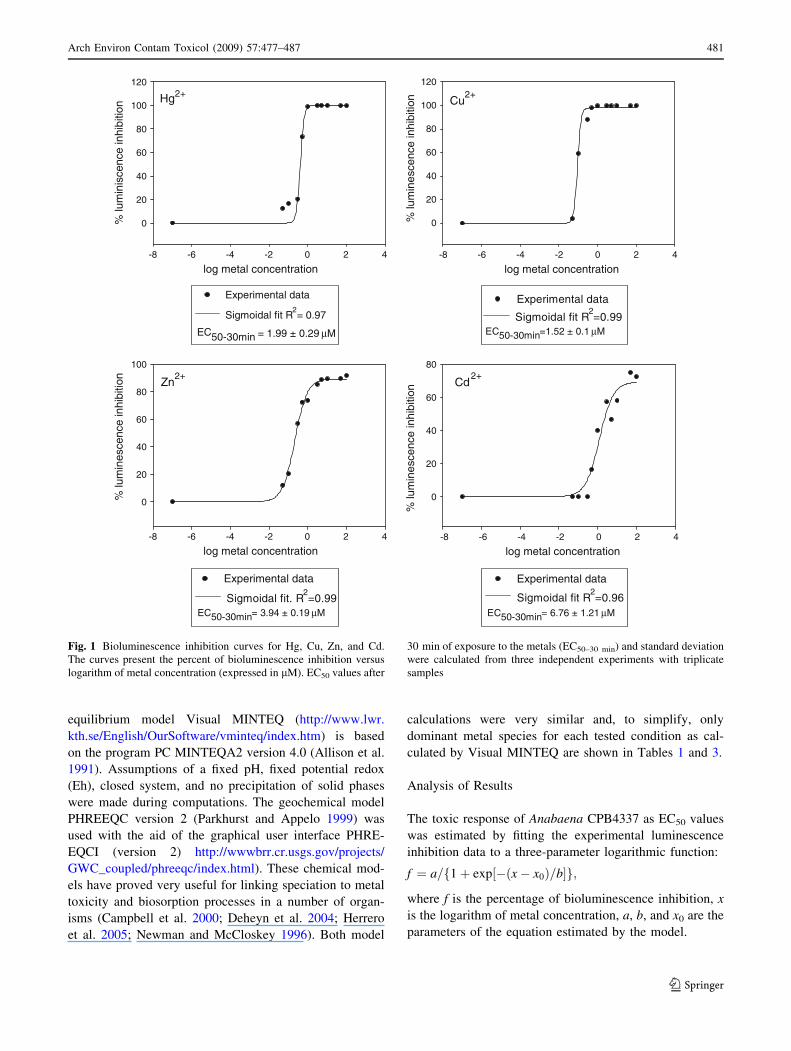
Fig. 1 Bioluminescence inhibition curves for Hg, Cu, Zn, and Cd.
The curves present the percent of bioluminescence inhibition versus
logarithm of metal concentration (expressed in lM). EC50 values after
30 min of exposure to the metals (EC50–30 min) and standard deviation
were calculated from three independent experiments with triplicate
samples
Arch Environ Contam Toxicol (2009) 57:477–487 481
123
One-way analyses of variance (ANOVA) and linear
regression analyses were computed using MINITAB
Release 14 for Windows (Minitab Inc., USA).
Results
Toxicity Assays of Heavy Metals to Strain Anabaena
CPB4337
For each metal treatment, a concentration–response curve
could be established from which the EC50 values were
derived (Fig. 1). The bioluminescent cyanobacterium
responded sensitively to the four metals tested; the 30-min
EC50 values and 95% confidence intervals calculated for
each of the metals were as follows: Hg, 1.99 ± 0.29 lM
(1.41–2.57); Cu, 1.52 ± 0.10 lM (1.32–1.72); Zn;
3.94 ± 0.19 lM (3.56–4.32); Cd, 6.76 ± 1.21 lM (4.34–
9.18). Based on these values, the order of sensitivity of
Anabaena CPB4337 toward the tested metals was
Cu C Hg [ Zn [ Cd.
Effect of Modifying Factors on Metal Toxicity
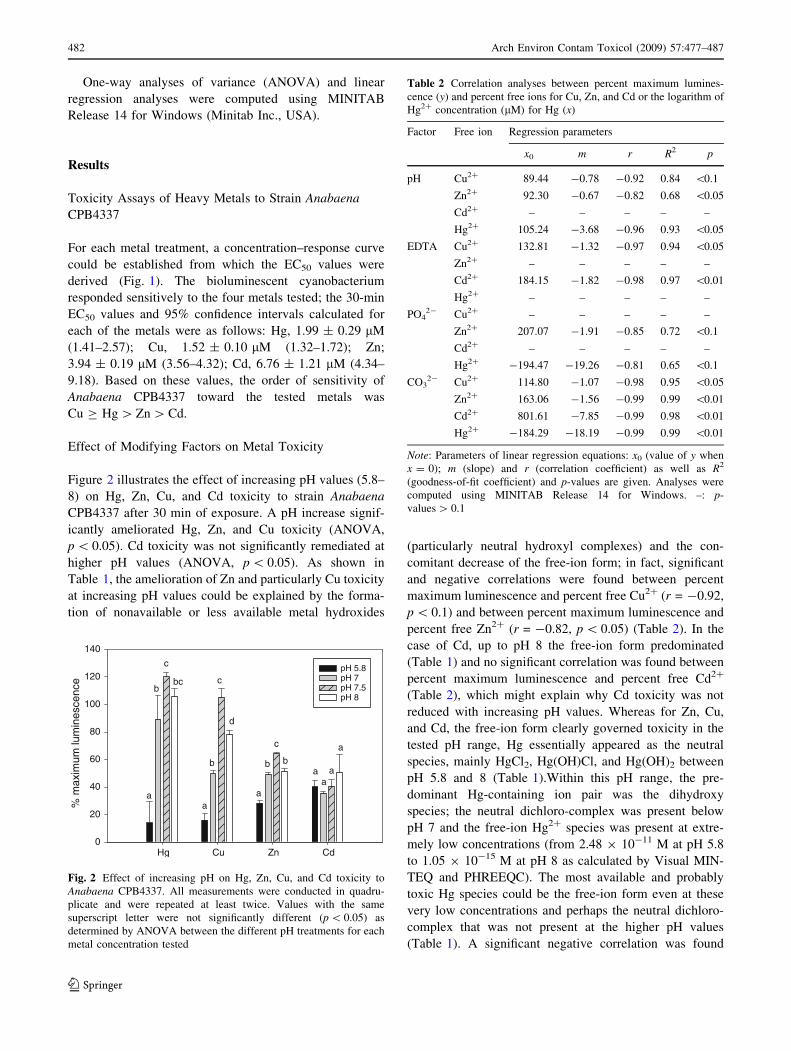
Figure 2 illustrates the effect of increasing pH values (5.8–
8) on Hg, Zn, Cu, and Cd toxicity to strain Anabaena
CPB4337 after 30 min of exposure. A pH increase signif-
icantly ameliorated Hg, Zn, and Cu toxicity (ANOVA,
p \ 0.05). Cd toxicity was not significantly remediated at
higher pH values (ANOVA, p \ 0.05). As shown in
Table 1, the amelioration of Zn and particularly Cu toxicity
at increasing pH values could be explained by the forma-
tion of nonavailable or less available metal hydroxides
(particularly neutral hydroxyl complexes) and the con-
comitant decrease of the free-ion form; in fact, significant
and negative correlations were found between percent
maximum luminescence and percent free Cu2? (r = -0.92,
p \ 0.1) and between percent maximum luminescence and
percent free Zn2? (r = -0.82, p \ 0.05) (Table 2). In the
case of Cd, up to pH 8 the free-ion form predominated
(Table 1) and no significant correlation was found between
percent maximum luminescence and percent free Cd2?
(Table 2), which might explain why Cd toxicity was not
reduced with increasing pH values. Whereas for Zn, Cu,
and Cd, the free-ion form clearly governed toxicity in the
tested pH range, Hg essentially appeared as the neutral
species, mainly HgCl2, Hg(OH)Cl, and Hg(OH)2 between
pH 5.8 and 8 (Table 1).Within this pH range, the pre-
dominant Hg-containing ion pair was the dihydroxy
species; the neutral dichloro-complex was present below
pH 7 and the free-ion Hg2? species was present at extre-
mely low concentrations (from 2.48 9 10-11 M at pH 5.8
to 1.05 9 10-15 M at pH 8 as calculated by Visual MIN-
TEQ and PHREEQC). The most available and probably
toxic Hg species could be the free-ion form even at these
very low concentrations and perhaps the neutral dichloro-
complex that was not present at the higher pH values
(Table 1). A significant negative correlation was found
Hg Cu Zn Cd
% m
axim
um lu
min
esce
nce
0
20
40
60
80
100
120
140
pH 5.8 pH 7 pH 7.5 pH 8
a
b
c
bc
a
b
c
d
a
b
c
ba
aa
a
Fig. 2 Effect of increasing pH on Hg, Zn, Cu, and Cd toxicity to
Anabaena CPB4337. All measurements were conducted in quadru-
plicate and were repeated at least twice. Values with the same
superscript letter were not significantly different (p \ 0.05) as
determined by ANOVA between the different pH treatments for each
metal concentration tested
Table 2 Correlation analyses between percent maximum lumines-
cence (y) and percent free ions for Cu, Zn, and Cd or the logarithm of
Hg2? concentration (lM) for Hg (x)
Factor Free ion Regression parameters
x0 m r R2 p
pH Cu2? 89.44 -0.78 -0.92 0.84 \0.1
Zn2? 92.30 -0.67 -0.82 0.68 \0.05
Cd2? – – – – –
Hg2? 105.24 -3.68 -0.96 0.93 \0.05
EDTA Cu2? 132.81 -1.32 -0.97 0.94 \0.05
Zn2? – – – – –
Cd2? 184.15 -1.82 -0.98 0.97 \0.01
Hg2? – – – – –
PO42- Cu2? – – – – –
Zn2? 207.07 -1.91 -0.85 0.72 \0.1
Cd2? – – – – –
Hg2? -194.47 -19.26 -0.81 0.65 \0.1
CO32- Cu2? 114.80 -1.07 -0.98 0.95 \0.05
Zn2? 163.06 -1.56 -0.99 0.99 \0.01
Cd2? 801.61 -7.85 -0.99 0.98 \0.01
Hg2? -184.29 -18.19 -0.99 0.99 \0.01
Note: Parameters of linear regression equations: x0 (value of y when
x = 0); m (slope) and r (correlation coefficient) as well as R2
(goodness-of-fit coefficient) and p-values are given. Analyses were
computed using MINITAB Release 14 for Windows. –: p-
values [ 0.1
482 Arch Environ Contam Toxicol (2009) 57:477–487
123
between percent maximum luminescence and the logarithm
of free Hg2? concentration (r = -0.96, p \ 0.05), which
could explain most of the observed Hg toxicity variation.
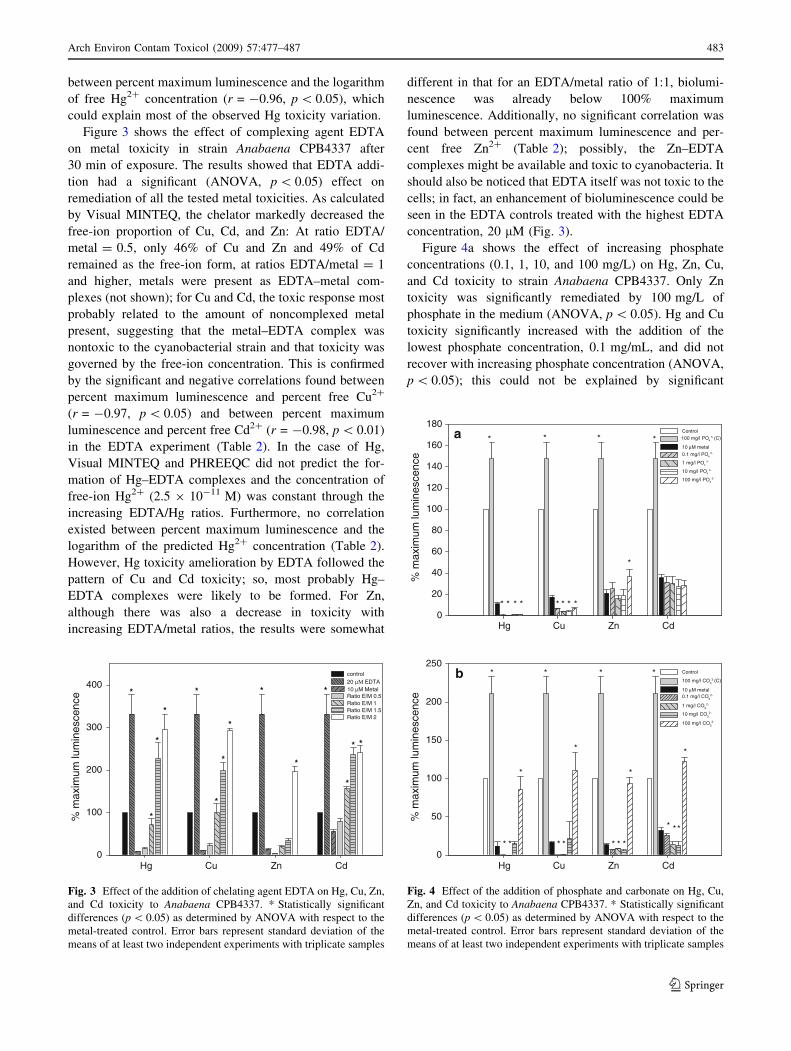
Figure 3 shows the effect of complexing agent EDTA
on metal toxicity in strain Anabaena CPB4337 after
30 min of exposure. The results showed that EDTA addi-
tion had a significant (ANOVA, p \ 0.05) effect on
remediation of all the tested metal toxicities. As calculated
by Visual MINTEQ, the chelator markedly decreased the
free-ion proportion of Cu, Cd, and Zn: At ratio EDTA/
metal = 0.5, only 46% of Cu and Zn and 49% of Cd
remained as the free-ion form, at ratios EDTA/metal = 1
and higher, metals were present as EDTA–metal com-
plexes (not shown); for Cu and Cd, the toxic response most
probably related to the amount of noncomplexed metal
present, suggesting that the metal–EDTA complex was
nontoxic to the cyanobacterial strain and that toxicity was
governed by the free-ion concentration. This is confirmed
by the significant and negative correlations found between
percent maximum luminescence and percent free Cu2?
(r = -0.97, p \ 0.05) and between percent maximum
luminescence and percent free Cd2? (r = -0.98, p \ 0.01)
in the EDTA experiment (Table 2). In the case of Hg,
Visual MINTEQ and PHREEQC did not predict the for-
mation of Hg–EDTA complexes and the concentration of
free-ion Hg2? (2.5 9 10-11 M) was constant through the
increasing EDTA/Hg ratios. Furthermore, no correlation
existed between percent maximum luminescence and the
logarithm of the predicted Hg2? concentration (Table 2).
However, Hg toxicity amelioration by EDTA followed the
pattern of Cu and Cd toxicity; so, most probably Hg–
EDTA complexes were likely to be formed. For Zn,
although there was also a decrease in toxicity with
increasing EDTA/metal ratios, the results were somewhat
different in that for an EDTA/metal ratio of 1:1, biolumi-
nescence was already below 100% maximum
luminescence. Additionally, no significant correlation was
found between percent maximum luminescence and per-
cent free Zn2? (Table 2); possibly, the Zn–EDTA
complexes might be available and toxic to cyanobacteria. It
should also be noticed that EDTA itself was not toxic to the
cells; in fact, an enhancement of bioluminescence could be
seen in the EDTA controls treated with the highest EDTA
concentration, 20 lM (Fig. 3).
Figure 4a shows the effect of increasing phosphate
concentrations (0.1, 1, 10, and 100 mg/L) on Hg, Zn, Cu,
and Cd toxicity to strain Anabaena CPB4337. Only Zn
toxicity was significantly remediated by 100 mg/L of
phosphate in the medium (ANOVA, p \ 0.05). Hg and Cu
toxicity significantly increased with the addition of the
lowest phosphate concentration, 0.1 mg/mL, and did not
recover with increasing phosphate concentration (ANOVA,
p \ 0.05); this could not be explained by significant
Hg Cu Zn Cd
% m
axim
um lu
min
esce
nce
0
100
200
300
400control20 µΜ EDTA10 µM MetalRatio E/M 0.5Ratio E/M 1Ratio E/M 1.5Ratio E/M 2
*
*
*
*
*
*
*
*
*
*
*
*
* *
Fig. 3 Effect of the addition of chelating agent EDTA on Hg, Cu, Zn,
and Cd toxicity to Anabaena CPB4337. * Statistically significant
differences (p \ 0.05) as determined by ANOVA with respect to the
metal-treated control. Error bars represent standard deviation of the
means of at least two independent experiments with triplicate samples
Hg Cu Zn Cd
% m
axim
um lu
min
esce
nce
0
50
100
150
200
250
* *
*
* *
*
* * *
*
* **
*
Control
100 mg/l CO3
2-(C)
10 µM metal0.1 mg/l CO
32-
1 mg/l CO3
2-
10 mg/l CO3
2-
100 mg/l CO3
2-
b
Hg Cu Zn Cd
% m
axim
um lu
min
esce
nce
0
20
40
60
80
100
120
140
160
180Control100 mg/l PO4
3- (C)
10 µM metal
0.1 mg/l PO4 3-
1 mg/l PO4 3-
10 mg/l PO4 3-
100 mg/l PO4 3-
a * * * *
*
**** ** * *
* * * *
Fig. 4 Effect of the addition of phosphate and carbonate on Hg, Cu,
Zn, and Cd toxicity to Anabaena CPB4337. * Statistically significant
differences (p \ 0.05) as determined by ANOVA with respect to the
metal-treated control. Error bars represent standard deviation of the
means of at least two independent experiments with triplicate samples
Arch Environ Contam Toxicol (2009) 57:477–487 483
123

changes in metal speciation (Table 1). Cd toxicity did not
change with the addition of phosphate at the tested con-
centrations. The Visual MINTEQ program predicted that
the free-ion form predominated for Cu, Zn, and Cd at the
four tested phosphate concentrations (Table 1); however,
for 100 mg/L of added phosphate, the Zn2? free-ion spe-
cies was the lowest of the free-ion species of the four
metals. Additionally, the program predicted the formation
of neutral monohydrogen phosphate and charged dihydro-
gen phosphate with Cu, Zn, and Cd, but the amount of
ZnHPO4 formed accounted for a higher percentage than the
monohydrogen phosphates formed with the other three
metals; in fact, only for Zn, a significant correlation
between percent maximum luminescence and percent free
ion (r = -0.85, p \ 0.1) was found (Table 2), which
would explain, at least partially, the observed remediation
of Zn toxicity by a decrease of free Zn2? ions at 100 mg/L
of added phosphate. In the case of Hg, phosphate addition
did not substantially changed Hg speciation (Table 1): The
neutral dihydroxy species was the predominant form in the
tested phosphate range, the free-ion form slightly
increased, as calculated by Visual MINTEQ and PHRE-
EQC, from 2.84 9 10-11 M at 0 mg/mL phosphate to
7.07 9 10-11 M at 100 mg/mL added phosphate; this
slight increase along with the increase of the neutral
dichloro-complex from 0.6% to 1.32% (Table 1) might
partially explain the observed Hg toxicity increase
(Fig. 4a). In fact, a negative and significant correlation was
found between percent maximum luminescence and the
logarithm of predicted Hg2? concentration, (r = -0.81,
p \ 0.1) (Table 2). The observed increase of Cu toxicity
could not be explained by changes in speciation (Table 1);
additionally, no significant correlation was found between
percent maximum luminescence and percent free Cu2?
(Table 2). Finally, 100 mg/L phosphate, on its own,
increased luminescence.
Figure 4b shows the effect of increasing carbonate (0.1,
1, 10, and 100 mg/L) on Hg, Cu, Zn, and Cd toxicity to
strain Anabaena CPB4337. The addition of 100 mg/L
carbonate significantly ameliorated metal toxicity
(ANOVA, p \ 0.05). Similar to the results with phosphate,
there was increased toxicity of the four metals with lower
carbonate concentrations (up to 10 mg/L); this could not be
explained by significant changes in metal speciation in this
range of carbonate concentrations (Table 1). In the case of
Cu, Zn, and Cd, the chemical modeling program predicted
that the free-ion form predominated up to 10 mg/L of
added carbonate, whereas at 100 mg/L, the free-ion form
significantly decreased due to the formation of bicarbonate
and carbonate complexes (Table 1) that might be non-
available or less available than the free-ion form and thus
less toxic; this might explain the observed significant
(ANOVA, p \ 0.05) remediation of Cu, Zn, and Cd
toxicity with 100 mg/L of added carbonate. Regarding Hg,
the neutral dihydroxy complex predominated and its pro-
portion increased with increasing carbonate concentrations.
The neutral dichloro-complex significantly decreased at
10 mg/L added carbonate and was no longer present at
100 mg/L (Table 1); the free-ion form concentration, as
calculated by Visual MINTEQ and PHREEQC, signifi-
cantly decreased with increasing carbonate concentrations
(from 2.84 9 10-11 M at 0 mg/L to 1.29 9 10-15 M at
100 mg/L added carbonate). The decrease of free-ion Hg2?
and HgCl2 at 100 mg/L added carbonate might account for
the observed amelioration of Hg toxicity. In agreement
with the toxicity results at higher carbonate concentrations,
a significant and negative correlation existed between
percent maximum luminescence and percent Cu2? (r = -
0.98, p \ 0.05), percent Zn2? (r = -0.99, p \ 0.01), per-
cent Cd2? (r = -0.99, p \ 0.01) and the logarithm of
predicted Hg2? concentration (r = -0.99, p \ 0.01)
(Table 2). Finally, the addition of 100 mg/L carbonate, on
its own, increased luminescence significantly (ANOVA,
p \ 0.05).
The addition of NaCl up to 100 mg/L did not have any
significant effect on metal toxicity or speciation (not
shown); however, the addition of 2% NaCl, the salt con-
centration needed for Vibrio fischeri-based bioassays, had a
significant effect on cyanobacterial cell luminescence,
metal toxicity, and speciation of the four metals. As shown
in Fig. 5, 2% NaCl, on its own, significantly (ANOVA,
p \ 0.05) inhibited cell luminescence (50% inhibition) of
the strain Anabaena CPB4337; furthermore, high salt
induced substantial metal speciation changes (Table 3) and
also affected metal toxicity. In the case of Hg, the addition
Hg Cu Zn Cd
% m
axim
um lu
min
esce
nce
0
20
40
60
80
100
120Control2 % NaCl
10 µM metal 10 µM metal + 2% NaCl
*
*
*
*
Fig. 5 Effect of the addition of 2% NaCl on Hg, Cu, Zn, and Cd
toxicity to Anabaena CPB4337. * Statistically significant differences
(p \ 0.05) as determined by ANOVA with respect to the metal-
treated control. The 2% NaCl control was significantly (ANOVA,
p \ 0.05) different with respect to the cell luminescence control.
Error bars represent standard deviation of the means of at least two
independent experiments with triplicate samples
484 Arch Environ Contam Toxicol (2009) 57:477–487
123

of 2% NaCl significantly (ANOVA, p \ 0.05) increased
toxicity (Fig. 5) and substantially changed speciation
(Table 3), the hydroxyl complexes were no longer present,
and the charged chloro-complex HgCl42– clearly predom-
inated (53.37%); the free-ion form, Hg2?, was present at
extremely low amounts (5.33 9 10-18 M), as calculated
by Visual MINTEQ and PHREEQC. As the free-ion form
concentration was negligible, the toxic metal species could
be HgCl42– and, to some extent, the neutral dichloro-
complex HgCl2. On the other hand, 2% NaCl significantly
(ANOVA, p \ 0.05) ameliorated Cu, Zn, and Cd toxicity
to the strain Anabaena CPB4337 (Fig. 5). This might be
explained by changes in metal speciation (Table 3); the
addition of 2% NaCl decreased the available and toxic free-
ion forms Cu2? and Zn2? by 20% and Cd2? by almost
95%, with the concomitant increase of chloro-complexes
that might be nonavailable and nontoxic.
Discussion
One important characteristic of whole-cell bioreporters is
that they reflect the real physiological impact of toxic
compounds, as they report on the bioavailable fraction of
toxicants. Bioavailability and toxicity of metals depends on
their speciation in aqueous environments (Allen and Han-
sen 1996). Of the possible chemical forms of a metal, the
free ion is usually the most toxic one (Campbell 1995);
however, that does not necessarily mean that the free metal
ion is the only toxic species (Allen and Hansen 1996;
Campbell et al. 2000; Fernandez-Pinas et al. 1991).
The study of the effect of modifying factors indicated
that, in general, cyanobacterial toxicity correlated with free
metal ion concentration (Table 2); chemical modeling
predicted that any decrease in the free-ion concentration
generally correlated with the corresponding formation of
neutral and charged metal hydroxides, metal phosphate,
carbonate, and chloride species, and EDTA complexes.
The formation of all of these metal complexes, with some
exceptions, correlated with toxicity amelioration, implying
that they were not toxic probably due to low or no bio-
availability to the cyanobacterial cells. One exception was
the observed toxicity of the Zn–EDTA complexes at a ratio
EDTA/Zn 1:1 (Fig. 3). These complexes could be toxic to
the cyanobacteria either by direct uptake or by the ability
of the cyanobacterial strains to actively release Zn from the
complex, as already pointed out by Paton et al. (1997) in
their study with a bioluminescent strain of Pseudomonas
fluorescens. Campbell et al. (2000) found a similar
behavior in the toxicity of Zn and Cd to a bioluminescent
construct of Escherichia coli in the presence of EDTA and
fulvic acid. These authors also reported an stimulatory
effect of EDTA on cell luminescence; they suggested that
this stimulatory effect could be due to a surface perme-
ability effect or uptake/metabolism of EDTA by E. coli
cells.
Mercury also represented an exception due to the fact
that chemical modeling of Hg speciation predicted that,
under almost all the tested conditions, the predominant
species (more than 98%) were the neutral Hg(OH)2,
Hg(OH)Cl, and HgCl2 while the amount of free Hg2? ion
was very low, almost negligible; so, it was not easy to
determine which was the toxic mercury species to cyano-
bacteria. However, the very low concentration of free Hg2?
ion decreased even more with increasing pH, phosphate,
and carbonate and this correlated with the observed
remediation of toxicity (Table 2). If free-ion Hg2? is the
main toxic species, the EC50 calculated for Hg (Fig. 1) is
actually much lower, with a value of 6.27 9 10-12 M, as
calculated by Visual MINTEQ and PHREEQC; thus, in
terms of free-ion concentration, Hg2? appears to be more
toxic than Cu2?, Zn2?, or Cd2? to Anabaena CPB4337.
However, we cannot discard that the neutral species HgCl2might also show some toxicity under certain conditions, as
Table 3 Predicted percentages of the total concentration of metal present as free-ion and dominant forms of metal complexes in the aqueous
phase at 2% NaCl as calculated by Visual MINTEQ
NaCl Hg Cu Zn Cd
0% Hg(OH)2 93.674 Cu2? 98.117 Zn2? 98.436 Cd2? 99.806
HgOH? 0.148 CuSO4 0.011 ZnOH? 1.558 CdCl? 0.187
HgCl2 1.395 CuOH? 1.227
HgClOH 4.719 Cu(OH)2 0.643
2% HgCl2 12.353 Cu2? 77.080 Zn2? 75.323 Cd2? 5.498
HgCl3- 34.272 CuCl? 20.585 ZnCl? 21.245 CdCl? 48.748
HgCl42- 53.373 CuCl2 1.026 ZnCl2 1.277 CdCl2 32.845
CuOH? 0.747 ZnCl3- 1.428 CdCl3
- 7.530
Cu(OH)2 0.525 ZnCl42- 0.443 CdCl4
2- 5.364
Note: Total metal concentration for calculations of each metal is 10 lM
Arch Environ Contam Toxicol (2009) 57:477–487 485
123
an increase in pH or carbonate concentration clearly
diminished toxicity and the concentration of this species; in
this regard, Newman and McCloskey (1996) also consid-
ered HgCl2 to be bioavailable due to its lipophilicity
(Simkiss 1983). Herrero et al. (2005) also found that the
macroalga Cystoseira baccata accumulated Hg mainly as
HgCl2. In addition, 2% NaCl had a significant effect on Hg
speciation, with HgCl42– as the predominant form, and a
further decrease in the concentration of the free-ion form,
Hg2?, which reached 5.33 9 10-18 M—a value almost
identical to that reported by Deheyn et al. (2004) in their
Microtox assay medium— indicating that our speciation
calculations by Visual MINTEQ and PHREEQC were also
accurate for Hg. In spite of the negligible free Hg2? con-
centration, this high salt concentration increased Hg
toxicity to the strain Anabaena CPB4337, suggesting that
the charged chloro-complex HgCl42– might also be toxic
species to cyanobacteria.
An interesting feature of metal toxicity to the strain
Anabaena CPB4337 is that low amounts of anions such as
phosphate and carbonate increased metal toxicity; this
could not be related to significant changes in metal speci-
ation (Table 1) but could be due to a modulating effect of
these anions, both nutrients for cyanobacteria (Rippka
1988), on metal uptake/toxicity. Heijerick et al. (2003) also
found that low hardness levels (as CaCO3) increased Zn
toxicity to Daphnia magna; Herrero et al. (2005) reported a
slight increase in Hg uptake with background salt con-
centrations as nitrate but not as chloride salts. Deryabin and
Aleshina (2008) recently reported that carbonates and hy-
drocarbonates had a pronounced inhibitory effect on the
bioluminescence of Photobacterium phosphoreum and a
recombinant luminescent E. coli strain. As these low anion
concentrations can be found in natural waters and they
could affect the performance of other bioreporters in a
similar way, laboratory tests should be done before
assaying environmental samples in order to fully under-
stand ecotoxicity data.
Finally, the point of ecological relevance/significance is
important when assessing the performance of bacterial
bioreporters. The assays based on marine luminescent
bacteria such as Vibrio fischeri might not be very appro-
priate for soil and freshwater ecotoxicity testing because
sample filtration is required and they work only in saline
solution (2% NaCl) (Villaescusa et al. 1996). Because of
the salinity, the insolubility of some organic substances that
might be present in the environmental sample is enhanced,
producing turbid solution. As discussed earlier and similar
to other authors (Deheyn et al. 2004; Newman and
McCloskey 1996), we have found that 2% NaCl substan-
tially changed metal speciation (Table 3); this high salt
concentration significantly increased the proportion of
chloro-complexes while significantly decreasing the
proportion of free ions, which, as discussed earlier, are
usually the most toxic forms of a metal. For this reason, the
bioassays based on marine luminescent bacteria might
underestimate metal toxicity in freshwater simples, as
already suggested (Deheyn et al. 2004). In this report, we
present an application of a recombinant self-luminescent
cyanobacterial bioreporter to assess heavy metal toxicity;
this organism is a derivative of a freshwater cyanobacte-
rium, and due to its ecological relevance as a primary
producer, it could be used as a potential tool for toxicity
assessment in freshwater environments (rivers, effluents,
lakes, groundwater, etc.).
Conclusion
We report an application of an ecologically relevant self-
luminescent cyanobacterial bioreporter for the assessment
of metal toxicity and its modulation in the presence of a
range of potential modifying factors. Chemical modeling
and correlation analyses proved very useful for linking
toxicity and bioavailability. In general, there was a good
correlation between the observed toxic effects and free-ion
metal concentration. Low concentrations of phosphate and
carbonate increased heavy metal toxicity toward the cya-
nobacterium. This approach of combining toxicity studies
with chemical modeling to predict changes in metal spe-
ciation might help to interpret complex toxicity data when
testing real environmental samples.
Acknowledgments This work was funded by Comunidad de
Madrid grants 07M/0052/2002, GR/AMB/0084/2004, and S-0505/
AMB/0321. Ismael Rodea-Palomares is the recipient of a Ph.D.
research contract from Comunidad de Madrid.
References
Allen MB, Arnon DI (1955) Studies on nitrogen-fixing blue grenn
algae. I Growth and nitrogen fixation byAnabaena cylindricaLemm. Plant Physiol 30:366–372. doi:10.1104/pp.30.4.366
Allen HE, Hansen DJ (1996) The importance of trace metal speciation
to water quality criteria. Water Environ Res 68:42–54. doi:
10.2175/106143096X127307
Allison JD, Brown DS, Novo-Gradac KJ (1991) MINTEQA2/
PRODEFA2, a geochemical assessment model for environmen-
tal systems: Version 3.0 User’ manual. EPA/600/3-91/021. US
Environmental Protection Agency, Office of Research and
Development, Washington, DC
Campbell CD, Hird M, Lumsdon DG, Meeussen JCL (2000) The
effect of EDTA and fulvic acid on Cd, Zn and Cu toxicity to a
bioluminescent construct (pUCD607) of Escherichia coli. Che-
mosphere 40:319–325. doi:10.1016/S0045-6535(99)00302-1
Campbell PG (1995) Interactions between trace metals and aquatic
organisms: a critique of the free-ion activity model. In: Tessier
A, Turner DR (eds) Metal speciation and bioavailability in
aquatic systems. Wiley, New York, pp 45–103
486 Arch Environ Contam Toxicol (2009) 57:477–487
123
Cook SV, Chu A, Goodman RH (2000) Influence of salinity on Vibriofischeri and lux-modified Pseudomonas fluorescens toxicity
bioassays. Environ Toxicol Chem 19:2474–2477. doi:10.1897/
1551-5028(2000)019\2474:IOSOVF[2.3.CO;2
Deheyn DD, Bencheikh-Latmani R, Latz MI (2004) Chemical
speciation and toxicity of metals assessed by three biolumines-
cence-based assays using marine organisms. Environ Toxicol
19:161–178. doi:10.1002/tox.20009
Deryabin DG, Aleshina ES (2008) Effect of salts on luminescence of
natural and recombinant luminescent bacterial biosensors. Appl
Biochem Microbiol 44:292–296. doi:10.1134/S0003683808
030113
Fernandez-Pinas F, Wolk CP (1994) Expression of luxCD-E in
Anabaena sp. can replace the use of exogenous aldehyde for in
vivo localization of transcription by luxAB. Gene 150:169–174
Fernandez-Pinas F, Mateo P, Bonilla I (1991) Binding of cadmium by
cyanobacterial growth media: free ion concentration as a toxicity
index to the cyanobacterium Nostoc UAM208. Arch Environ
Contam Toxicol 21:425–431. doi:10.1007/BF01060366
Fernandez-Pinas F, Leganes F, Wolk CP (2000) Bacterial lux gene as
reporters in cyanobacteria. Methods Enzymol 305:513–527
Heijerick DG, Janssen CR, De Coen WM (2003) The combined
effects of hardness, pH, and dissolved organic carbon on the
chronic toxicity of Zn to D. magna: development of a surface
response model. Arch Environ Contam Toxicol 44:210–217
Herrero R, Lodeiro P, Rey-Castro C, Vilarino T, Sastre de Vicente
ME (2005) Removal of inorganic mercury from aqueous
solutions by biomass of the marine macroalga Cystoseirabaccata. Water Res 39:3199–3210
Ho KT, Kuhn A, Pelletier MC, Hendricks TL, Helmstetter A (1999)
pH dependent toxicity of five metals to three marine organisms.
Environ Toxicol 14:235–240
Kandegedara A, Rorabacher DB (1999) Noncomplexing tertiary
amines as better buffers covering the range of pH 3–11.
Temperature dependence of their dissociation contants. Anal
Chem 71:3140–3144
Kohler S, Belkin S, Schmid RD (2000) Reporter gene bioassays in
environmental analysis. Fresenius J Anal Chem 366:769–779
Newman MC, McCloskey JT (1996) Predicting relative toxicity and
interaction of divalent metal ions: Microtox� bioluminescence
assay. Environ Toxicol Chem 15:75–281
Parent L, Twiss MR, Campbell PG (1996) Influences of natural
dissolved organic matter on the interaction of aluminium with
the microalga Chlorella: a test of the free-ion model of trace-
metal toxicity. Environ Sci Technol 30:1713–1720
Parkhurst DL, Appelo CAJ (1999) User’s guide to PHREEQC
(Version 2): A computer program for speciation, batch-reaction.
One-dimensional transport and inverse geochemical calcula-
tions: US Geological Survey Water-Resources Investigations
Report 99–4259. US Geological Survey
Paton GI, Rattray EAS, Campbell CD, Cresser MS, Glover LA,
Meeussen JCL, Killham K (1997) Use of genetically modified
microbial biosensors for soil ecotoxicity testing. In: Pankhurst
CF, Doube BM, Gupta VVSR et al (eds) Biological indicators of
soil health. CAB International Press, Oxford, pp 394–418
Perona E, Bonilla I, Mateo P (1999) Spatial and temporal changes in
water quality in a Spanish river. Sci Total Environ 241:75–90
Riba F, Garcia-Luque E, Blasco J, Del Valls TA (2003) Bioavail-
ability of heavy metals bound to estuarine sediments as a
function of pH and salinity. Chem Spec Bioavail 15:101–114
Riether KB, Dollard MAD, Billard P (2001) Assesment of heavy
metal bioavailability using Escherichia coli ZntAP::lux and
CopAP::lux-based biosensors. Appl Microbiol Biotechnol
57:712–716
Rippka R (1988) Isolation and purification of cyanobacteria. Methods
Enzymol 167:3–27
Simkiss K (1983) Lipid solubility of heavy metals in saline solutions.
J Marine Biol Assoc UK 63:1–7
Szittner R, Meighen E (1990) Nucleotide sequence, expression and
properties of luciferase coded by lux genes of a terrestrial
bacterium. J Biol Chem 265:16581–16587
Tauriainien SM, Virta MPJ, Karp MT (2000) Detecting bioavailable
toxic metals and metalloids from natural water samples using
luminescent sensor bacteria. Water Res 34:2661–2666
van Dijk GM, Van Liere L, Admiraal W, Bannik BA, Cappon JJ
(1994) Present state of the water quality of European rivers and
implications for management. Sci Total Environ 145:187–195
Villaescusa I, Martinez M, Pilar M, Murat JC, Hosta C (1996)
Toxicity of cadmium species on luminescent bacteria. Fresenius
J Anal Chem 354:566–570
Arch Environ Contam Toxicol (2009) 57:477–487 487
123