Non-Invasive Detection of a Small Number of Bioluminescent Cancer Cells In Vivo
9
Non-Invasive Detection of a Small Number of Bioluminescent Cancer Cells In Vivo Jae-Beom Kim 1 *, Konnie Urban 1 , Edward Cochran 3 , Steve Lee 1 , Angel Ang 1 , Bradley Rice 1 , Adam Bata 2 , Kenneth Campbell 2 , Richard Coffee 2 , Alex Gorodinsky 2 , Zhan Lu 2 , He Zhou 3 , Takashi Kei Kishimoto 3 , Peter Lassota 1 * 1 Caliper Life Sciences Inc., Alameda, California, United States of America, 2 Caliper Life Sciences Inc., Cranbury, New Jersey, United States of America, 3 Momenta Pharmaceuticals Inc., Cambridge, Massachusetts, United States of America Abstract Early detection of tumors can significantly improve the outcome of tumor treatment. One of the most frequently asked questions in cancer imaging is how many cells can be detected non-invasively in a live animal. Although many factors limit such detection, increasing the light emission from cells is one of the most effective ways of overcoming these limitations. Here, we describe development and utilization of a lentiviral vector containing enhanced firefly luciferase (luc2) gene. The resulting single cell clones of the mouse mammary gland tumor (4T1-luc2) showed stable light emission in the range of 10,000 photons/sec/cell. In some cases individual 4T1-luc2 cells inserted under the skin of a nu/nu mouse could be detected non-invasively using a cooled CCD camera in some cases. In addition, we showed that only few cells are needed to develop tumors in these mice and tumor progression can be monitored right after the cells are implanted. Significantly higher luciferase activity in these cells allowed us to detect micrometastases in both, syngeneic Balb/c and nu/nu mice. Citation: Kim J-B, Urban K, Cochran E, Lee S, Ang A, et al. (2010) Non-Invasive Detection of a Small Number of Bioluminescent Cancer Cells In Vivo. PLoS ONE 5(2): e9364. doi:10.1371/journal.pone.0009364 Editor: Alexander Swarbrick, Garvan Institute of Medical Research, Australia Received May 12, 2009; Accepted January 2, 2010; Published February 23, 2010 Copyright: ß 2010 Kim et al. This is an open-access article distributed under the terms of the Creative Commons Attribution License, which permits unrestricted use, distribution, and reproduction in any medium, provided the original author and source are credited. Funding: This work was funded internally at Caliper Life Sciences and Momenta Pharmaceuticals. The funders provided reagents, research space, and resources for this study. However, authors are solely involved in study design, data collection and analyses, or preparation of the manuscript. Caliper Life Sciences and Momenta Biopharma agreed to publish these data in a scientific journal. The funders had no role in study design, data collection and analysis, decision to publish, or preparation of the manuscript. Competing Interests: Jae-Beom Kim, Konnie Urban, Steve Lee, Bradley Rice, Adam Bata, Kenneth Campbell, Richard Coffee, Alex Gorodinsky, Zhan Lu and Peter Lassota are employees of Caliper Life Sciences. He Zhou, Edward Cochran and Takashi Kei Kishimoto are employees of Momenta Pharmaceuticals Inc. The authors agree to PLoS One Policy on data sharing policies. There is no patent application filed using the data obtained from this study. * E-mail: [email protected] (J-BK); [email protected] (PL) Introduction Detection of tumors at early stages is critical for effective tumor treatment and for studying tumorigenesis[1,2,3]. Traditionally, tumor growth was assessed by using mechanical or electronic calipers to take physical measurements of subcutaneous human tumors growing in immunocompromised mice[4]. This method is suitable, however, only for palpable tumors growing under the skin of the animals. Deeper tumor masses, such as osteosarcomas encapsulated by the bone, are not amenable to direct physical measurements. Even in subcutaneous models, tumor burdens may not be accurately quantified using physical measurements because edema and necrotic centers will contribute to the increase in tumor size[5]. Orthotopic solid tumor models circumvent these obstacles and allow fairly accurate assessment of tumor burdens by weighing the excised, ‘‘cleaned’’ tumors after the animals are sacrificed. Classical orthotopic models are impractical for evaluation of compounds’ efficacy since they require large numbers of animals to be sacrificed at each time point. Similarly, identification of tumors and quantification of tumor burden in models of metastasis demand exhaustive and tedious histological analyses[6,7,8]. Non-invasive whole body bioluminescence imaging (BLI) allows repeated, real-time in vivo monitoring of tumor growth in experimental animals, regardless of tumor locations. In contrast to fluorescence, BLI exhibits minimal background signals from the animal tissues[9]. Therefore, BLI can detect relatively weak signals with high signal to background ratio. Due to its versatility, BLI has been adopted to study preclinical efficacy of drug candi- dates[10,11,12,13] as well as various aspects of mammalian biology via reporter assays[14,15]. Recently, firefly (Photinus pyralis) luciferase was re-engineered to further optimize its expression in mammalian cells. Compared to previous generations of luciferase, the new version (luc2) delivers more than a four-fold increase in light emission which was achieved by codon optimization and removal of potential transcription factor binding sites[16]. We postulated that individ- ual cancer cells could be detected in vivo by harnessing the increased bioluminescence of luc2. To that end, we engineered a lentiviral vector where luc2 expression is driven via the human ubiquitin C promoter[17]. The construct was then stably transfected into the 4T1 mouse mammary tumor cell line[18,19]. Several stable, single-cell clones (4T1-luc2) were subsequently isolated with light emission in the range of 10,000 photons/sec/ cell. Here, we report that, at least in some cases, detection of a single cancer cell in vivo using one of these luc-2 labeled clones was achieved. We also show development of tumors from only few cells implanted into nu/nu mice and detection of metastases in syngeneic Balb/c mice. To our best knowledge, this is the first report of detection of a single bioluminescent cell in vivo using a PLoS ONE | www.plosone.org 1 February 2010 | Volume 5 | Issue 2 | e9364
-
Upload
independent -
Category
Documents
-
view
1 -
download
0
Transcript of Non-Invasive Detection of a Small Number of Bioluminescent Cancer Cells In Vivo
Non-Invasive Detection of a Small Number ofBioluminescent Cancer Cells In VivoJae-Beom Kim1*, Konnie Urban1, Edward Cochran3, Steve Lee1, Angel Ang1, Bradley Rice1, Adam Bata2,
Kenneth Campbell2, Richard Coffee2, Alex Gorodinsky2, Zhan Lu2, He Zhou3, Takashi Kei Kishimoto3,
Peter Lassota1*
1 Caliper Life Sciences Inc., Alameda, California, United States of America, 2 Caliper Life Sciences Inc., Cranbury, New Jersey, United States of America, 3 Momenta
Pharmaceuticals Inc., Cambridge, Massachusetts, United States of America
Abstract
Early detection of tumors can significantly improve the outcome of tumor treatment. One of the most frequently askedquestions in cancer imaging is how many cells can be detected non-invasively in a live animal. Although many factors limitsuch detection, increasing the light emission from cells is one of the most effective ways of overcoming these limitations.Here, we describe development and utilization of a lentiviral vector containing enhanced firefly luciferase (luc2) gene. Theresulting single cell clones of the mouse mammary gland tumor (4T1-luc2) showed stable light emission in the range of10,000 photons/sec/cell. In some cases individual 4T1-luc2 cells inserted under the skin of a nu/nu mouse could be detectednon-invasively using a cooled CCD camera in some cases. In addition, we showed that only few cells are needed to developtumors in these mice and tumor progression can be monitored right after the cells are implanted. Significantly higherluciferase activity in these cells allowed us to detect micrometastases in both, syngeneic Balb/c and nu/nu mice.
Citation: Kim J-B, Urban K, Cochran E, Lee S, Ang A, et al. (2010) Non-Invasive Detection of a Small Number of Bioluminescent Cancer Cells In Vivo. PLoS ONE 5(2):e9364. doi:10.1371/journal.pone.0009364
Editor: Alexander Swarbrick, Garvan Institute of Medical Research, Australia
Received May 12, 2009; Accepted January 2, 2010; Published February 23, 2010
Copyright: � 2010 Kim et al. This is an open-access article distributed under the terms of the Creative Commons Attribution License, which permits unrestricteduse, distribution, and reproduction in any medium, provided the original author and source are credited.
Funding: This work was funded internally at Caliper Life Sciences and Momenta Pharmaceuticals. The funders provided reagents, research space, and resourcesfor this study. However, authors are solely involved in study design, data collection and analyses, or preparation of the manuscript. Caliper Life Sciences andMomenta Biopharma agreed to publish these data in a scientific journal. The funders had no role in study design, data collection and analysis, decision to publish,or preparation of the manuscript.
Competing Interests: Jae-Beom Kim, Konnie Urban, Steve Lee, Bradley Rice, Adam Bata, Kenneth Campbell, Richard Coffee, Alex Gorodinsky, Zhan Lu and PeterLassota are employees of Caliper Life Sciences. He Zhou, Edward Cochran and Takashi Kei Kishimoto are employees of Momenta Pharmaceuticals Inc. The authorsagree to PLoS One Policy on data sharing policies. There is no patent application filed using the data obtained from this study.
* E-mail: [email protected] (J-BK); [email protected] (PL)
Introduction
Detection of tumors at early stages is critical for effective tumor
treatment and for studying tumorigenesis[1,2,3]. Traditionally,
tumor growth was assessed by using mechanical or electronic
calipers to take physical measurements of subcutaneous human
tumors growing in immunocompromised mice[4]. This method is
suitable, however, only for palpable tumors growing under the skin
of the animals. Deeper tumor masses, such as osteosarcomas
encapsulated by the bone, are not amenable to direct physical
measurements. Even in subcutaneous models, tumor burdens may
not be accurately quantified using physical measurements because
edema and necrotic centers will contribute to the increase in
tumor size[5]. Orthotopic solid tumor models circumvent these
obstacles and allow fairly accurate assessment of tumor burdens by
weighing the excised, ‘‘cleaned’’ tumors after the animals are
sacrificed. Classical orthotopic models are impractical for
evaluation of compounds’ efficacy since they require large
numbers of animals to be sacrificed at each time point. Similarly,
identification of tumors and quantification of tumor burden in
models of metastasis demand exhaustive and tedious histological
analyses[6,7,8].
Non-invasive whole body bioluminescence imaging (BLI) allows
repeated, real-time in vivo monitoring of tumor growth in
experimental animals, regardless of tumor locations. In contrast
to fluorescence, BLI exhibits minimal background signals from the
animal tissues[9]. Therefore, BLI can detect relatively weak signals
with high signal to background ratio. Due to its versatility, BLI has
been adopted to study preclinical efficacy of drug candi-
dates[10,11,12,13] as well as various aspects of mammalian
biology via reporter assays[14,15].
Recently, firefly (Photinus pyralis) luciferase was re-engineered to
further optimize its expression in mammalian cells. Compared to
previous generations of luciferase, the new version (luc2) delivers
more than a four-fold increase in light emission which was
achieved by codon optimization and removal of potential
transcription factor binding sites[16]. We postulated that individ-
ual cancer cells could be detected in vivo by harnessing the
increased bioluminescence of luc2. To that end, we engineered a
lentiviral vector where luc2 expression is driven via the human
ubiquitin C promoter[17]. The construct was then stably
transfected into the 4T1 mouse mammary tumor cell line[18,19].
Several stable, single-cell clones (4T1-luc2) were subsequently
isolated with light emission in the range of 10,000 photons/sec/
cell. Here, we report that, at least in some cases, detection of a
single cancer cell in vivo using one of these luc-2 labeled clones was
achieved. We also show development of tumors from only few cells
implanted into nu/nu mice and detection of metastases in
syngeneic Balb/c mice. To our best knowledge, this is the first
report of detection of a single bioluminescent cell in vivo using a
PLoS ONE | www.plosone.org 1 February 2010 | Volume 5 | Issue 2 | e9364
non-invasive imaging method. Such bright cells can be effectively
used to monitor efficacy of drug candidates in models of metastasis
and orthotopic tumor models, to track metastatic migration of
cancer cells, and can be also utilized to accurately ascertain
whether any residual disease remains following the treatment.
Results
Generation of a Lentiviral Vector System and Stable4T1-luc2 Cell Lines
A lentiviral vector containing the firefly luc2 gene conjugated to
a human ubiquitin C promoter was constructed to generate stable
bioluminescent cancer cell lines[16,17,18]. Mouse mammary
tumor 4T1 cells were then transfected with the lentiviral vector
and stable clones were selected using puromycin (4T1-luc2). Eight
clones were chosen for further analyses and their luciferase
activities were monitored for four weeks without selection marker.
Although there were variations among the clones, the majority of
them clones emitted more than 3,000 photons/sec/cell of light.
Considering that most cell lines labeled with previous generations
of luciferase emit less than 250 photons/sec/cell, our luc2 clones
exhibited considerably higher level of light emission[20]. Surpris-
ingly, one clone (C26) initially emitted as much as 52,000
photons/sec/cell but its light emission decreased to 6,400
photons/sec/cell after four weeks (Figure S1A). To confirm that
no alteration of cellular physiology occurred during the labeling/
cloning process, we compared the clones to the original parental
4T1 cells on several different levels. First, we examined growth
patterns. From the eight initially selected clones, we chose two
lines (C27 and C38) and compared their growth patterns to the
parental 4T1 cells. Both lines had similar doubling times to the
parental cells (12.6 hour doubling time for both clones, versus 12.0
hours for the original 4T1 cells).
We also examined other critical parameters of cellular
physiology, including effects of ATP consumption. Since luciferase
uses one molecule of ATP to produce each photon of light, high
levels of light emission could be detrimental to the cell’s
metabolism due to the depletion of the its ATP pool. To test
whether the high light production affects cell physiology, we
observed cell growth for four days in the presence of high
concentrations of the luciferase substrate, D-luciferin (150 and
300 mg/ml/day). The results demonstrated that, in the presence of
D-luciferin, 4T1-luc2 clones showed similar growth patterns to
those of cells cultured without D-luciferin and to the parental 4T1
cells (Figure S1B,C,D). This suggests that 4T1-luc2 cells can
endure consumption of the ATP required for the high light
emission without a significant effect on the cell’s ATP pool.
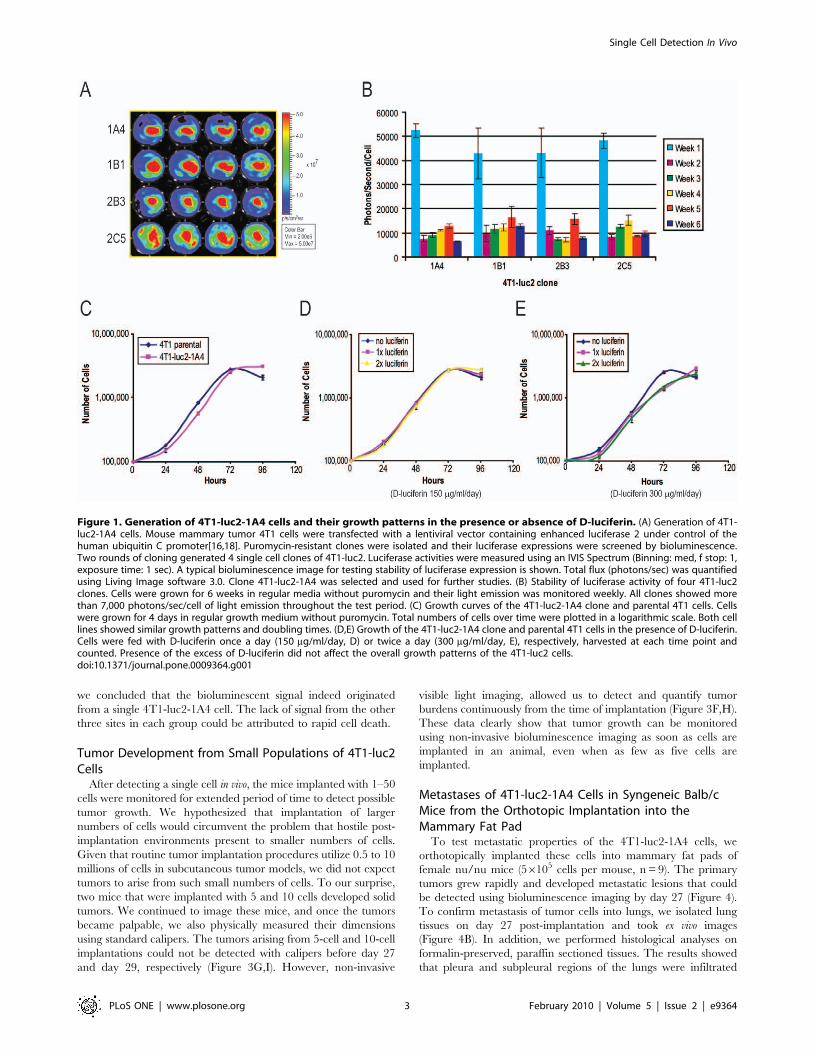
Since clone C26 showed decreasing luciferase activity over time,
we attempted the second round of limited dilution single cell
cloning from the original mixed population. Four bright clones
were selected and their luciferase activities (light emission) were
monitored for six weeks without selection pressure (Figure 1A,B).
All clones initially produced more than 40,000 photons/sec/cell;
then the light emission declined to 10,000 photons/sec/cell, and
stabilized at that level. It remained stable for four weeks in the
absence of puromycin (Figure 1B). From these clones, the 1A4
clone (4T1-luc2-1A4) was selected for further studies. The growth
pattern of the 4T1-luc2-1A4 was comparable to that of the
parental 4T1 cells in the presence, or absence of D-luciferin
(Figure 1C,D,E). To address the cause of the initial decrease of
light emission in 4T1-luc2-1A4 clone, we performed limited
dilution culture in 96-well plates. When cells grew to about 25%
confluency, we examined luciferase expression by bioluminescent
imaging. Every well containing cells showed luciferase activity.
These results indicate that the initial decrease of luciferase activity
was not due to the loss of luciferase expression in some cells of the
clone (Figure S2).
Non-Invasive Detection of Small Numbers of Cells innu/nu Mice
Because 4T1-luc2 cells showed extremely high light emission,
we next attempted to detect small numbers of these cells in vivo.
Initially, the 4T1-luc2-1A4 cells were prepared using a serial
dilution method and were implanted into both flanks of the female
nu/nu mice (Figure 2). Different numbers of cells were implanted
at each implantation sites. Six implantations were performed for
each number of cells (3, 5, 10, and 50 cells). Bioluminescence
images were taken immediately after the implantations. Using a
highly sensitive cooled CCD camera, we were able to detect as few
as 3 cells in this experiment (Figure 2A-D, red dotted circles). In
some instances, however, we did not detect any meaningful signals
from the sites of implantation (Fig 2A-D, yellow dotted circles).
This could be attributed to cell death immediately after implan-
tation or to inherent variability of the serial dilution method when
the intended number of cells is very small (Fig 2A-D, yellow
circles). Separately, we took PC3M-luc-C6 which was one of the
brightest cell lines (,250 photons/sec/cell) generated by us thus
far (using multiple rounds of transfections by pGL3) and compared
it with 4T1-luc2-1A4 cells, by implanting both into SCID-bg mice
(Figure S3). The results illustrate that the bioluminescent signals
from 102 4T1-luc2-1A4 cells in furry mice was easily detectable,
while no signal was detected from the same number of PC3M-luc-
C6 cells.
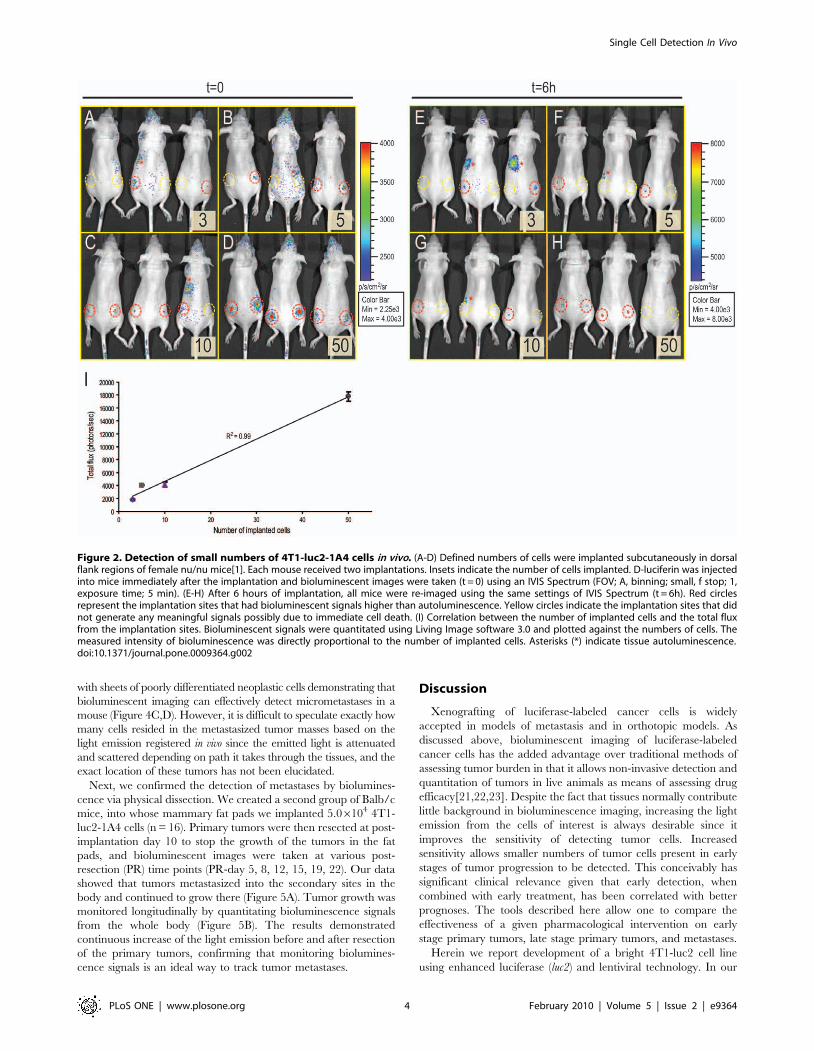
Six hours after the implantations, we re-imaged the same set of
animals (Fig 2E-H). As expected, based on the hostile post-
implantation environment, 4 sites of the 10- and 50 cell
implantation sites lost their initial bioluminescent signals
(Fig 2G,H). Surprisingly, however, we were able to detect signals
from 3- and 5 cell implantation sites (Figure 2E,F). Our analyses of
the images taken immediately after the implantation (t = 0)
indicate that total flux from the implantation sites was directly
proportional to the number of cells implanted (Fig 2I). This is
consistent with the other data (not shown) demonstrating linear
relationship between the light emission and the number of cells
plated in vitro. Based on these results, we demonstrated that
bioluminescence measurement is a plausible method to accomplish
non-invasive monitoring of the early tumor growth in vivo.
Detection of a Single Bioluminescent 4T1-luc2 Cell In VivoAfter confirming non-invasive detection of three cells in vivo, we
challenged ourselves to detect a single 4T1-luc2-1A4 cell after
subcutaneous implantation. To eliminate the experimental error
and to add accuracy to the determination of the number of
implanted cells, we used a micropipettor to implant a single 4T1-
luc-2-1A4 cell. First, the 4T1-luc2-1A4 cells were trypsinized and
plated on a cell culture dish. Next, individual cells were picked up
and implanted using a micropipettor into subcutaneous slots made
in the flank regions of mice. Mice were divided into two groups:
four mice were implanted with single cells, and four other mice
were implanted with 10 cells each (Figure S4C,D). Animals were
then subjected to bioluminescence imaging immediately after the
implantation. In some cases, we were able to detect a single 4T1-
luc2-1A4 cell (Figure 3A-C and Figure S4A,B). On each of the
three independent, sequential images of the same single cell we
registered a total flux ranging from 460 to 528 photons/sec. Line
profiling analyses of the registered flux from a single cell revealed a
signal to background ratio of 6 to 1, with the signal clearly
originating from the implantation site (Figure 3D,E). Therefore,
Single Cell Detection In Vivo
PLoS ONE | www.plosone.org 2 February 2010 | Volume 5 | Issue 2 | e9364
we concluded that the bioluminescent signal indeed originated
from a single 4T1-luc2-1A4 cell. The lack of signal from the other
three sites in each group could be attributed to rapid cell death.
Tumor Development from Small Populations of 4T1-luc2Cells
After detecting a single cell in vivo, the mice implanted with 1–50
cells were monitored for extended period of time to detect possible
tumor growth. We hypothesized that implantation of larger
numbers of cells would circumvent the problem that hostile post-
implantation environments present to smaller numbers of cells.
Given that routine tumor implantation procedures utilize 0.5 to 10
millions of cells in subcutaneous tumor models, we did not expect
tumors to arise from such small numbers of cells. To our surprise,
two mice that were implanted with 5 and 10 cells developed solid
tumors. We continued to image these mice, and once the tumors
became palpable, we also physically measured their dimensions
using standard calipers. The tumors arising from 5-cell and 10-cell
implantations could not be detected with calipers before day 27
and day 29, respectively (Figure 3G,I). However, non-invasive
visible light imaging, allowed us to detect and quantify tumor
burdens continuously from the time of implantation (Figure 3F,H).
These data clearly show that tumor growth can be monitored
using non-invasive bioluminescence imaging as soon as cells are
implanted in an animal, even when as few as five cells are
implanted.
Metastases of 4T1-luc2-1A4 Cells in Syngeneic Balb/cMice from the Orthotopic Implantation into theMammary Fat Pad
To test metastatic properties of the 4T1-luc2-1A4 cells, we
orthotopically implanted these cells into mammary fat pads of
female nu/nu mice (56105 cells per mouse, n = 9). The primary
tumors grew rapidly and developed metastatic lesions that could
be detected using bioluminescence imaging by day 27 (Figure 4).
To confirm metastasis of tumor cells into lungs, we isolated lung
tissues on day 27 post-implantation and took ex vivo images
(Figure 4B). In addition, we performed histological analyses on
formalin-preserved, paraffin sectioned tissues. The results showed
that pleura and subpleural regions of the lungs were infiltrated
Figure 1. Generation of 4T1-luc2-1A4 cells and their growth patterns in the presence or absence of D-luciferin. (A) Generation of 4T1-luc2-1A4 cells. Mouse mammary tumor 4T1 cells were transfected with a lentiviral vector containing enhanced luciferase 2 under control of thehuman ubiquitin C promoter[16,18]. Puromycin-resistant clones were isolated and their luciferase expressions were screened by bioluminescence.Two rounds of cloning generated 4 single cell clones of 4T1-luc2. Luciferase activities were measured using an IVIS Spectrum (Binning: med, f stop: 1,exposure time: 1 sec). A typical bioluminescence image for testing stability of luciferase expression is shown. Total flux (photons/sec) was quantifiedusing Living Image software 3.0. Clone 4T1-luc2-1A4 was selected and used for further studies. (B) Stability of luciferase activity of four 4T1-luc2clones. Cells were grown for 6 weeks in regular media without puromycin and their light emission was monitored weekly. All clones showed morethan 7,000 photons/sec/cell of light emission throughout the test period. (C) Growth curves of the 4T1-luc2-1A4 clone and parental 4T1 cells. Cellswere grown for 4 days in regular growth medium without puromycin. Total numbers of cells over time were plotted in a logarithmic scale. Both celllines showed similar growth patterns and doubling times. (D,E) Growth of the 4T1-luc2-1A4 clone and parental 4T1 cells in the presence of D-luciferin.Cells were fed with D-luciferin once a day (150 mg/ml/day, D) or twice a day (300 mg/ml/day, E), respectively, harvested at each time point andcounted. Presence of the excess of D-luciferin did not affect the overall growth patterns of the 4T1-luc2 cells.doi:10.1371/journal.pone.0009364.g001
Single Cell Detection In Vivo
PLoS ONE | www.plosone.org 3 February 2010 | Volume 5 | Issue 2 | e9364
with sheets of poorly differentiated neoplastic cells demonstrating that
bioluminescent imaging can effectively detect micrometastases in a
mouse (Figure 4C,D). However, it is difficult to speculate exactly how
many cells resided in the metastasized tumor masses based on the
light emission registered in vivo since the emitted light is attenuated
and scattered depending on path it takes through the tissues, and the
exact location of these tumors has not been elucidated.
Next, we confirmed the detection of metastases by biolumines-
cence via physical dissection. We created a second group of Balb/c
mice, into whose mammary fat pads we implanted 5.06104 4T1-
luc2-1A4 cells (n = 16). Primary tumors were then resected at post-
implantation day 10 to stop the growth of the tumors in the fat
pads, and bioluminescent images were taken at various post-
resection (PR) time points (PR-day 5, 8, 12, 15, 19, 22). Our data
showed that tumors metastasized into the secondary sites in the
body and continued to grow there (Figure 5A). Tumor growth was
monitored longitudinally by quantitating bioluminescence signals
from the whole body (Figure 5B). The results demonstrated
continuous increase of the light emission before and after resection
of the primary tumors, confirming that monitoring biolumines-
cence signals is an ideal way to track tumor metastases.
Discussion
Xenografting of luciferase-labeled cancer cells is widely
accepted in models of metastasis and in orthotopic models. As
discussed above, bioluminescent imaging of luciferase-labeled
cancer cells has the added advantage over traditional methods of
assessing tumor burden in that it allows non-invasive detection and
quantitation of tumors in live animals as means of assessing drug
efficacy[21,22,23]. Despite the fact that tissues normally contribute
little background in bioluminescence imaging, increasing the light
emission from the cells of interest is always desirable since it
improves the sensitivity of detecting tumor cells. Increased
sensitivity allows smaller numbers of tumor cells present in early
stages of tumor progression to be detected. This conceivably has
significant clinical relevance given that early detection, when
combined with early treatment, has been correlated with better
prognoses. The tools described here allow one to compare the
effectiveness of a given pharmacological intervention on early
stage primary tumors, late stage primary tumors, and metastases.
Herein we report development of a bright 4T1-luc2 cell line
using enhanced luciferase (luc2) and lentiviral technology. In our
Figure 2. Detection of small numbers of 4T1-luc2-1A4 cells in vivo. (A-D) Defined numbers of cells were implanted subcutaneously in dorsalflank regions of female nu/nu mice[1]. Each mouse received two implantations. Insets indicate the number of cells implanted. D-luciferin was injectedinto mice immediately after the implantation and bioluminescent images were taken (t = 0) using an IVIS Spectrum (FOV; A, binning; small, f stop; 1,exposure time; 5 min). (E-H) After 6 hours of implantation, all mice were re-imaged using the same settings of IVIS Spectrum (t = 6h). Red circlesrepresent the implantation sites that had bioluminescent signals higher than autoluminescence. Yellow circles indicate the implantation sites that didnot generate any meaningful signals possibly due to immediate cell death. (I) Correlation between the number of implanted cells and the total fluxfrom the implantation sites. Bioluminescent signals were quantitated using Living Image software 3.0 and plotted against the numbers of cells. Themeasured intensity of bioluminescence was directly proportional to the number of implanted cells. Asterisks (*) indicate tissue autoluminescence.doi:10.1371/journal.pone.0009364.g002
Single Cell Detection In Vivo
PLoS ONE | www.plosone.org 4 February 2010 | Volume 5 | Issue 2 | e9364
attempts to detect small numbers of cells, we initially used a serial
dilution method and could detect down to 3 cells in vivo.
Encouraged by these results, we challenged ourselves to detect a
single 4T1-luc2-1A4 cell after subcutaneous implantation via
microinjection. Because the signal from a cell was located in
proximity to the gut, which exhibits an intrinsic, albeit variable
auto-bioluminescence, our images of single cells contain both,
signals from the cell, as well as background from the gut
(Figure 3B). However, as shown on the images of 5- and 10-
cells, when the numbers of cells increased, the signals from the cells
quickly surpassed the background signals from the gut. During the
course of preparation of this manuscript, Rabinovich et al. showed
the detection of three engineered murine T lymphocytes in vivo in a
subcutaneous transplantation[24]. While application of the elegant
system described by Rabinovich et al. was developed to achieve
efficient transduction for a specific cell subtype, we have
engineered a simple, universal vector to transduce various types
of proliferating and non-proliferating cells. Moreover, to the best
of our knowledge, our report is the first one that shows detection of
a single bioluminescent cancer cell in vivo.
Because high level of luciferase expression increases the sensitivity
of cell detection in live animals, this technology can be directly
applied to primary cell and stem cell detection in vivo, including
cancer stem cells[25,26,27]. The lentivirus technology can conceiv-
ably prove useful for labeling stem cells since it can significantly
minimize handling and culturing of these cells. Our results showed
that as few as 5 and 10 cells can grow and form tumors in the
animals. These tumors can be monitored using bioluminescence
imaging from the day of implantation. Previously, 4T1 cells were
transformed with luciferase and their tumor metastases were
visualized using optical imaging[28]. While this study demonstrated
non-invasive monitoring of tumor metastases, the present study
enables earlier detection of tumor metastases, and allows following
the tumor formation process right from the cell implantation (Day 0
vs. 6 weeks). Furthermore, our results suggest that labeling and
tracking cancers growing from a single cancer stem cell is feasible. In
addition, this technology could also be applied more generally to
follow the fate of a single stem cell implanted into an animal.
Furthermore, the process of drug screening for either small
molecules or biologics which target cancer stem cells can be
significantly expedited since bioluminescence allows following
growth of tumors in vivo weeks before they become palpable.
Brightly luminescent cells also provide a better means of
detection of micrometastases in an animal, thus making models of
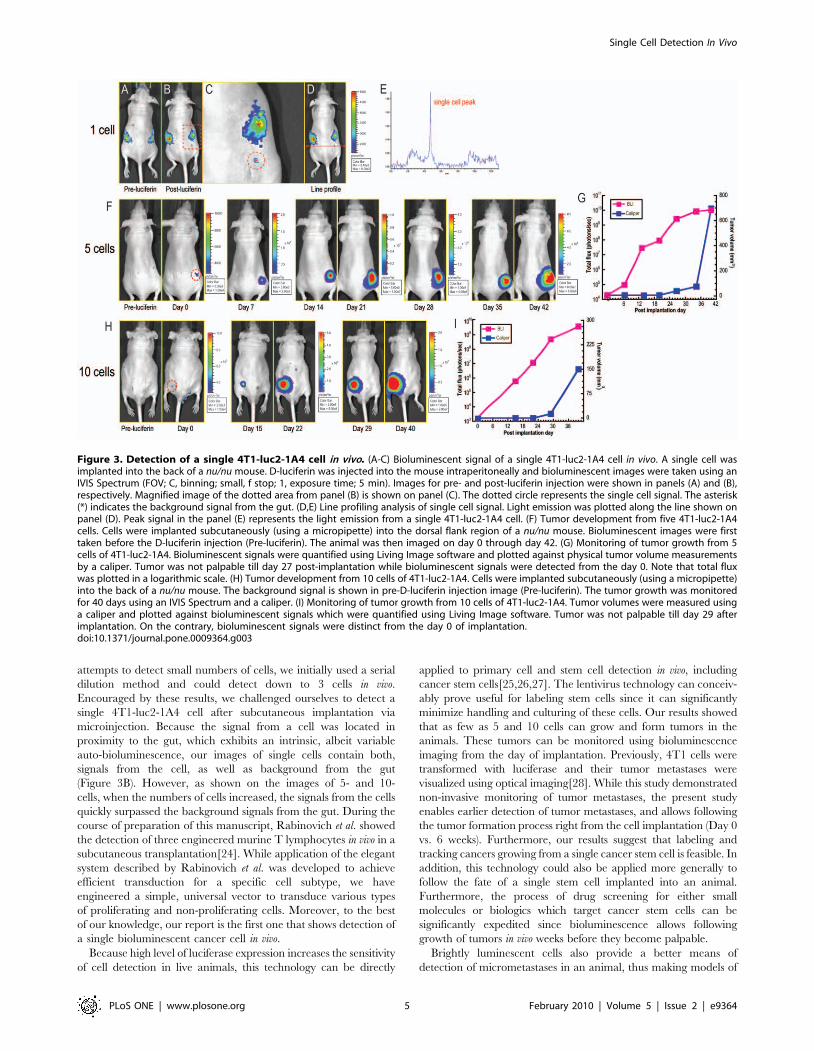
Figure 3. Detection of a single 4T1-luc2-1A4 cell in vivo. (A-C) Bioluminescent signal of a single 4T1-luc2-1A4 cell in vivo. A single cell wasimplanted into the back of a nu/nu mouse. D-luciferin was injected into the mouse intraperitoneally and bioluminescent images were taken using anIVIS Spectrum (FOV; C, binning; small, f stop; 1, exposure time; 5 min). Images for pre- and post-luciferin injection were shown in panels (A) and (B),respectively. Magnified image of the dotted area from panel (B) is shown on panel (C). The dotted circle represents the single cell signal. The asterisk(*) indicates the background signal from the gut. (D,E) Line profiling analysis of single cell signal. Light emission was plotted along the line shown onpanel (D). Peak signal in the panel (E) represents the light emission from a single 4T1-luc2-1A4 cell. (F) Tumor development from five 4T1-luc2-1A4cells. Cells were implanted subcutaneously (using a micropipette) into the dorsal flank region of a nu/nu mouse. Bioluminescent images were firsttaken before the D-luciferin injection (Pre-luciferin). The animal was then imaged on day 0 through day 42. (G) Monitoring of tumor growth from 5cells of 4T1-luc2-1A4. Bioluminescent signals were quantified using Living Image software and plotted against physical tumor volume measurementsby a caliper. Tumor was not palpable till day 27 post-implantation while bioluminescent signals were detected from the day 0. Note that total fluxwas plotted in a logarithmic scale. (H) Tumor development from 10 cells of 4T1-luc2-1A4. Cells were implanted subcutaneously (using a micropipette)into the back of a nu/nu mouse. The background signal is shown in pre-D-luciferin injection image (Pre-luciferin). The tumor growth was monitoredfor 40 days using an IVIS Spectrum and a caliper. (I) Monitoring of tumor growth from 10 cells of 4T1-luc2-1A4. Tumor volumes were measured usinga caliper and plotted against bioluminescent signals which were quantified using Living Image software. Tumor was not palpable till day 29 afterimplantation. On the contrary, bioluminescent signals were distinct from the day 0 of implantation.doi:10.1371/journal.pone.0009364.g003
Single Cell Detection In Vivo
PLoS ONE | www.plosone.org 5 February 2010 | Volume 5 | Issue 2 | e9364
metastasis more accurate and allowing predictive models to be used
for evaluation of drug candidates that aim to combat metastasis.
When 4T1-luc2-1A4 cells were implanted into syngeneic Balb/c
mice, we were able to detect multiple micrometastases in secondary
sites. When primary tumors were surgically removed at 27 days
after the implantation, we could follow the growth of small,
metastatic tumors in the absence of the dominating signal from the
primary tumor. Brighter cells can reduce the time and effort
required to identify tumor masses in an animal and can also be
valuable in studying tumor microenvironments, particularly when
combined with other non-invasive fluorescence-based readouts.
To date, we have labeled more than a dozen human and
murine tumor cell lines using the described lentiviral system (data
not shown). All labeled cell lines showed significantly higher
luciferase expression compared to the cell lines labeled with
previous generation of luciferase and conventional transfection
methods (data not shown). Another advantage of these newly
engineered cell lines is that no antibiotic selection is required to
maintain stable luciferase expression. In contrast to the popular
viral promoters such as SV40 or CMV, human ubiquitin C
promoter is more resistant to gene silencing in mammalian
cells[29]. We have used our technology to successfully label
adherent, as well as suspension cell lines, and we believe that it
constitutes a universal tool for efficient introduction of luciferase
into almost any cell. Since lentiviral vectors can introduce genes of
interest into dividing as well as non-dividing cells, our technology
can be easily applied to label not only stem cells, but practically
any cells derived from patients, which then can be used for
research, or for diagnostic purposes.
Materials and Methods
Generation of Lentivirus VectorEnhanced luciferase 2 (luc2) cDNA was from pGL4.20 vector
(Promega, WI)[16]. Luciferase 2 cDNA was excised with Hind III
& Xba I and ligated into pUB6-V5-HisB vector (Invitrogen, CA).
A fragment generated by Bgl II and BstB I digestion of pUB6-luc2
was ligated into a modified pLPCX vector (Clontech, CA). A
lentiviral vector that carries human ubiquitin C promoter and luc2
cDNA was generated by inserting Bgl II & EcoR I fragment from
above construct into Bcl I & EcoR I of the modified pLKO.1
vector (Sigma-Aldrich, MO)[18,19].
Cell CultureMouse mammary gland tumor cell line 4T1 was obtained from
the ATCC (Manassas, VA). Cells were grown in high glucose RPMI
1640 medium (ATCC). PC-3M-luc-C6 cells were grown in minimal
essential medium (ATCC) (For supplemental data)[30]. All media
was supplemented with 10% fetal bovine serum (Hyclone, UT)
without antibiotics. Growth curves were generated by seeding
50,000 cells in T25 flasks. At each time point, cells were trypsinized
and counted using an automatic cell counter (Nexcelom, MA). Total
numbers of cells were plotted in a logarithmic scale.
Transfection and Stable Cell Line GenerationThe lentiviral vector was transfected using a lipid based method
into 4T1 cells. Transfected cells were selected using puromycin
(2 mg/ml). Isolated clones were screened for their luciferase
activities using an IVIS Spectrum (Caliper Life Sciences, MA).
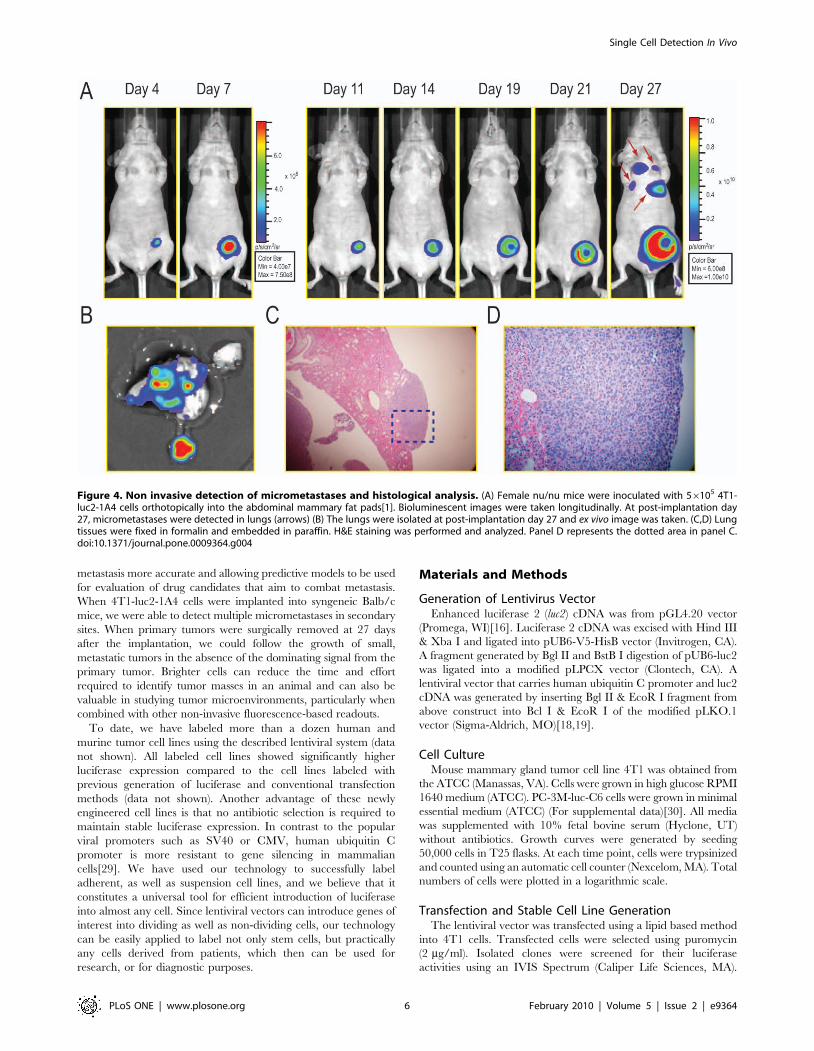
Figure 4. Non invasive detection of micrometastases and histological analysis. (A) Female nu/nu mice were inoculated with 56105 4T1-luc2-1A4 cells orthotopically into the abdominal mammary fat pads[1]. Bioluminescent images were taken longitudinally. At post-implantation day27, micrometastases were detected in lungs (arrows) (B) The lungs were isolated at post-implantation day 27 and ex vivo image was taken. (C,D) Lungtissues were fixed in formalin and embedded in paraffin. H&E staining was performed and analyzed. Panel D represents the dotted area in panel C.doi:10.1371/journal.pone.0009364.g004
Single Cell Detection In Vivo
PLoS ONE | www.plosone.org 6 February 2010 | Volume 5 | Issue 2 | e9364
To isolate single cell clones, cells were subjected to limited dilution.
Individual clones were screened for luciferase activity using an
IVISH Spectrum. Selected clones were maintained without
puromycin for 4 weeks and their light emission was monitored
every week.
Mice and Tumor Cell ImplantationAll procedures for animal care and tumor cell implantation
followed the approved animal protocols and guidelines of the
Institutional Animal Care and Use Committee at Caliper Life
Sciences and Momenta Pharmaceuticals. Prior to implantation, all
tumor cells tested negative for the presence of mycoplasma and
mouse pathogens. The orthotopic implantation of 4T1-luc2-1A4
cells into mammary fat pads of nu/nu or Balb/c mice was
performed while animals were under isoflurane anesthesia[1].
Subcutaneous implantations were done by injecting cells under the
skin in the dorsal flank regions. Single, and ten cell implantation
was performed using a customized glass capillary pipette with
manual aspiration. After the implantation, pipettes were examined
under the microscope to make sure that all cells were implanted.
Four implantations were done for each, one and ten cell
implantations. For the data shown on Figure 2, six implantations
were performed, three mice per each of the two groups.
In Vitro and In Vivo Bioluminescence ImagingFor in vitro luciferase assay, cells were plated on black walled
24-well plates at an initial concentration of 50,000 cells/well.
Cells were grown overnight with regular growth medium. After 24
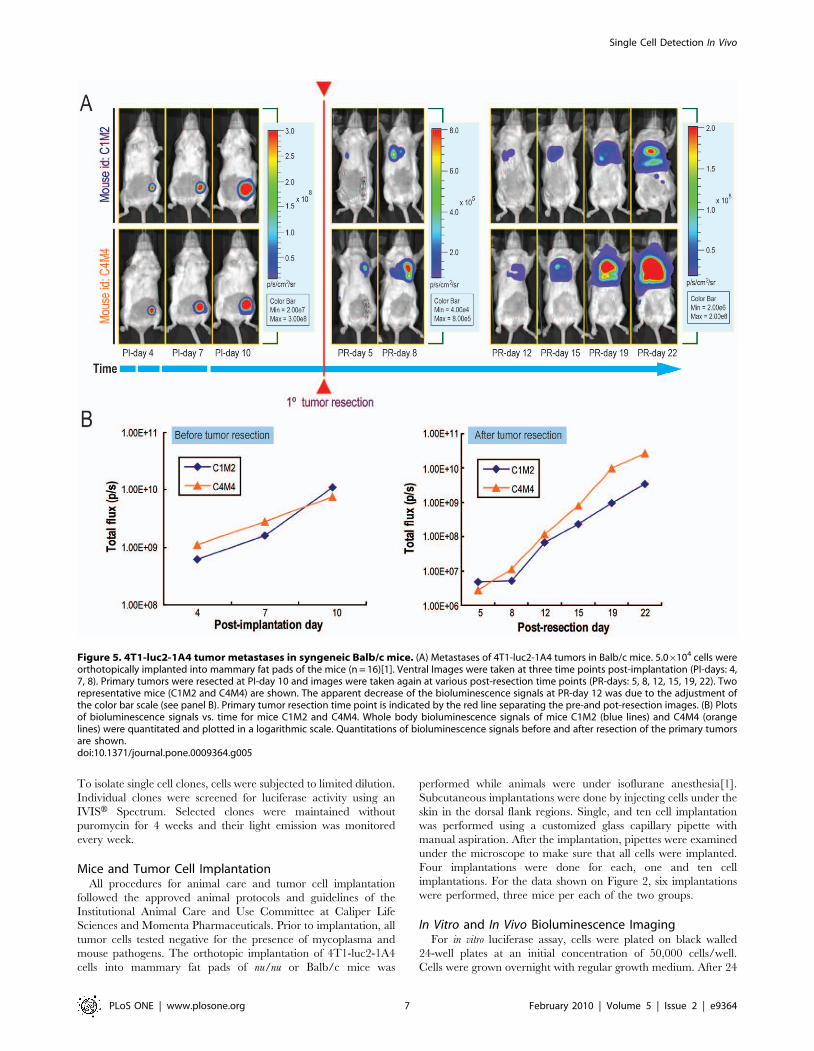
Figure 5. 4T1-luc2-1A4 tumor metastases in syngeneic Balb/c mice. (A) Metastases of 4T1-luc2-1A4 tumors in Balb/c mice. 5.06104 cells wereorthotopically implanted into mammary fat pads of the mice (n = 16)[1]. Ventral Images were taken at three time points post-implantation (PI-days: 4,7, 8). Primary tumors were resected at PI-day 10 and images were taken again at various post-resection time points (PR-days: 5, 8, 12, 15, 19, 22). Tworepresentative mice (C1M2 and C4M4) are shown. The apparent decrease of the bioluminescence signals at PR-day 12 was due to the adjustment ofthe color bar scale (see panel B). Primary tumor resection time point is indicated by the red line separating the pre-and pot-resection images. (B) Plotsof bioluminescence signals vs. time for mice C1M2 and C4M4. Whole body bioluminescence signals of mice C1M2 (blue lines) and C4M4 (orangelines) were quantitated and plotted in a logarithmic scale. Quantitations of bioluminescence signals before and after resection of the primary tumorsare shown.doi:10.1371/journal.pone.0009364.g005
Single Cell Detection In Vivo
PLoS ONE | www.plosone.org 7 February 2010 | Volume 5 | Issue 2 | e9364
hours, the regular medium was replaced with the D-luciferin
containing medium (150 mg/ml). Bioluminescence images were
taken immediately after adding the substrate into the cells using an
IVIS Spectrum. Light outputs were quantified using Living Image
3.0 (Caliper Life Sciences, Alameda, CA). Prior to the in vivo
imaging, the mice were anesthetized with isoflurane. D-luciferin
solution was then injected intraperitoneally (150 mg/kg). The
mice were imaged using an IVIS Spectrum. Bioluminescent
signals were quantified using Living Image 3.0 (Caliper Life
Sciences, Alameda, CA).
Histological AnalysesFemale nu/nu mice were inoculated with 56105 4T1-luc2-1A4
cells orthotopically into the abdominal mammary fat pad (n = 9).
At day 27 post-implantation, lung tissues were isolated and
analyzed histopathologically. Tissues were fixed and embedded in
paraffin. H&E staining was performed. Slides were examined by a
certified pathologist.
Supporting Information
Figure S1 (A) Generation of 4T1-luc2 cells. Mouse mammary
tumor 4T1 cells were transfected with a lentiviral vector containing
enhanced luciferase 2[18,31]. Puromycin resistant clones were
isolated and their luciferase expression was screened by biolumi-
nescence. Initial cloning generated 8 clones of 4T1-luc2. Luciferase
activity was measured using an IVIS Spectrum (Binning: med,
f stop: 1, exposure time: 1 sec). Total flux (photons/sec) was
quantified using Living Image software 3.0. Stability of luciferase
activities of the 4T1-luc2 clones were monitored for 4 weeks and
their light emission was measured weekly. All clones showed higher
than 3,000 photons/sec/cell of the light emission throughout the
test period. (B) Growth curves of the 4T1-luc2-C27 and the 4T1-
luc2-C38 clones vs. parental 4T1 cells. The cells were grown for 4
days in a regular growth medium without puromycin. The total
numbers of cells over time are plotted in a logarithmic scale. Both
cell lines showed similar growth patterns and doubling times. (C,D)
Growth of the 4T1-luc2-C26 and the 4T1-luc2-C36 clones vs.
parental 4T1 cells in the presence of D-luciferin. The cells were fed
with D-luciferin once a day (150 mg/ml/day, C) or twice a day
(300 mg/ml/day, D), respectively. The cells were harvested at each
time point and counted. Presence of excess of D-luciferin did not
affect the overall growth patterns of the 4T1-luc2 cells.
Found at: doi:10.1371/journal.pone.0009364.s001 (1.59 MB TIF)
Figure S2 (A) Limited dilution culture was performed with 4T1-
luc2-1A4 cells in four 96-well plates. Cells were grown for 10 days
and examined their luciferase expression by adding D-luciferin
into the culture media. Bioluminescent images were taken
immediately. Wells that did not show any luciferase activity did
not contain live cells.
Found at: doi:10.1371/journal.pone.0009364.s002 (5.36 MB TIF)
Figure S3 (A-D) The 4T1-luc2-C26 and the PC3M-luc-C6 cells
were subcutaneously implanted into flank regions of SCID-bg
mice. Equal numbers of cells for each cell line was implanted.
Bioluminescence images were taken 20 hrs post-implantation
using an IVIS Spectrum. Numbers of implanted cells are shown
on the inserts. Imaging conditions (A,B; FOV: B, binning: small, f
stop: 1, exposure time: 30 sec; C,D; FOV: B, binning: small, f stop:
1, exposure time: 5 min).
Found at: doi:10.1371/journal.pone.0009364.s003 (2.72 MB TIF)
Figure S4 (A, B) Bioluminescent signal of a single 4T1-luc2-1A4
cell in vivo. Female nu/nu mouse was implanted with a single 4T1-
luc2 cell subcutaneously in the dorsal region. Mouse was imaged
prior to D-luciferin injection (A). Ten minutes after the D-luciferin
injection, whole mouse image was taken (FOV; C, binning; small, f
stop; 1, exposure time; 5 min) (B). Dotted circle indicates the signal
from the implanted cell. (C) Whole mouse (nu/nu) image with
implanted ten 4T1-luc2-1A4 cells. The exact number of cells was
picked up by a glass capillary pipet and was injected into the back
of the mouse subcutaneously, through a skin incision. (D)
Magnified image of dotted area from panel C. Dotted circle
indicates the signal from 10 cells. Asterisk (*) indicates the skin
incision site.
Found at: doi:10.1371/journal.pone.0009364.s004 (3.57 MB TIF)
Acknowledgments
The authors thank Drs. Ning Zhang, Victor Ninov, Tamara Troy, Jay
Whalen, and Chaincy Kuo for their helpful discussions. The authors also
thank to Kshitij Modi and Minal Tapadia for proofreading the manuscript.
Author Contributions
Conceived and designed the experiments: JBK. Performed the experi-
ments: JBK KU AA SL EC AB RC AG ZL HZ TKK. Analyzed the data:
JBK EC BR HZ TKK PL. Contributed reagents/materials/analysis tools:
BR KC RC AG. Wrote the paper: JBK PL.
References
1. Jenkins DE, Oei Y, Hornig YS, Yu SF, Dusich J, et al. (2003) Bioluminescent
imaging (BLI) to improve and refine traditional murine models of tumor growth
and metastasis. Clin Exp Metastasis 20: 733–744.
2. Hirsch FR, Franklin WA, Gazdar AF, Bunn PA, Jr. (2001) Early detection of
lung cancer: clinical perspectives of recent advances in biology and radiology.
Clin Cancer Res 7: 5–22.
3. Holmgren L, O’Reilly MS, Folkman J (1995) Dormancy of micrometastases:
balanced proliferation and apoptosis in the presence of angiogenesis suppression.
Nat Med 1: 149–153.
4. Killion JJ, Radinsky R, Fidler IJ (1998) Orthotopic models are necessary to predict
therapy of transplantable tumors in mice. Cancer Metastasis Rev 17: 279–284.
5. Vaupel P, Kallinowski F, Okunieff P (1989) Blood flow, oxygen and nutrient
supply, and metabolic microenvironment of human tumors: a review. Cancer
Res 49: 6449–6465.
6. Sommer G, Agosti V, Ehlers I, Rossi F, Corbacioglu S, et al. (2003)
Gastrointestinal stromal tumors in a mouse model by targeted mutation of the
Kit receptor tyrosine kinase. Proc Natl Acad Sci U S A 100: 6706–6711.
7. Zheng M, Lu R, Che X, Li J, Zhou C, et al. (2006) Tyroservatide therapy for
tumor growth, invasion and metastasis of Lewis lung carcinoma and human lung
carcinoma A549. Oncology 70: 418–426.
8. Adam M, Bayer C, Henke J, Grosu A, Molls M, et al. (2008) Tirapazamine plus
cisplatin and irradiation in a mouse model: improved tumor control at the cost of
increased toxicity. J Cancer Res Clin Oncol 134: 137–146.
9. Troy T, Jekic-McMullen D, Sambucetti L, Rice B (2004) Quantitative
comparison of the sensitivity of detection of fluorescent and bioluminescent
reporters in animal models. Mol Imaging 3: 9–23.
10. Song H, Shahverdi K, Huso DL, Wang Y, Fox JJ, et al. (2008) An
immunotolerant HER-2/neu transgenic mouse model of metastatic breast
cancer. Clin Cancer Res 14: 6116–6124.
11. Roda A, Guardigli M, Pasini P, Mirasoli M (2003) Bioluminescence and
chemiluminescence in drug screening. Anal Bioanal Chem 377: 826–833.
12. Fomicheva EV, Turner II, Edwards TG, Hoff J, Arden E, et al. (2008)
Double oxygen-sensing vector system for robust hypoxia/ischemia-regulated
gene induction in cardiac muscle in vitro and in vivo. Mol Ther 16: 1594–
1601.
13. Cao YA, Wagers AJ, Beilhack A, Dusich J, Bachmann MH, et al. (2004) Shifting
foci of hematopoiesis during reconstitution from single stem cells. Proc Natl
Acad Sci U S A 101: 221–226.
14. Ray S, Paulmurugan R, Patel MR, Ahn BC, Wu L, et al. (2008) Noninvasive
imaging of therapeutic gene expression using a bidirectional transcriptional
amplification strategy. Mol Ther 16: 1848–1856.
15. Iyer M, Salazar FB, Lewis X, Zhang L, Carey M, et al. (2004) Noninvasive
imaging of enhanced prostate-specific gene expression using a two-step
transcriptional amplification-based lentivirus vector. Mol Ther 10: 545–552.
16. Promega (2007) pGL4 luciferase reporter vectors. Promega Technical Manual.
TM259.
Single Cell Detection In Vivo
PLoS ONE | www.plosone.org 8 February 2010 | Volume 5 | Issue 2 | e9364

17. Schorpp M, Jager R, Schellander K, Schenkel J, Wagner EF, et al. (1996) The
human ubiquitin C promoter directs high ubiquitous expression of transgenes inmice. Nucleic Acids Res 24: 1787–1788.
18. Zufferey R, Nagy D, Mandel RJ, Naldini L, Trono D (1997) Multiply attenuated
lentiviral vector achieves efficient gene delivery in vivo. Nat Biotechnol 15:871–875.
19. Pfeifer A, Kessler T, Silletti S, Cheresh DA, Verma IM (2000) Suppression ofangiogenesis by lentiviral delivery of PEX, a noncatalytic fragment of matrix
metalloproteinase 2. Proc Natl Acad Sci U S A 97: 12227–12232.
20. Scatena CD, Hepner MA, Oei YA, Dusich JM, Yu SF, et al. (2004) Imaging ofbioluminescent LNCaP-luc-M6 tumors: a new animal model for the study of
metastatic human prostate cancer. Prostate 59: 292–303.21. Uhrbom L, Nerio E, Holland EC (2004) Dissecting tumor maintenance
requirements using bioluminescence imaging of cell proliferation in a mouseglioma model. Nat Med 10: 1257–1260.
22. Zhang GJ, Safran M, Wei W, Sorensen E, Lassota P, et al. (2004)
Bioluminescent imaging of Cdk2 inhibition in vivo. Nat Med 10: 643–648.23. Brakenhielm E, Burton JB, Johnson M, Chavarria N, Morizono K, et al. (2007)
Modulating metastasis by a lymphangiogenic switch in prostate cancer.Int J Cancer 121: 2153–2161.
24. Rabinovich BA, Ye Y, Etto T, Chen JQ, Levitsky HI, et al. (2008) Visualizing
fewer than 10 mouse T cells with an enhanced firefly luciferase in
immunocompetent mouse models of cancer. Proc Natl Acad Sci U S A 105:
14342–14346.25. Kondo T, Setoguchi T, Taga T (2004) Persistence of a small subpopulation of
cancer stem-like cells in the C6 glioma cell line. Proc Natl Acad Sci U S A 101:
781–786.26. Dylla SJ, Beviglia L, Park IK, Chartier C, Raval J, et al. (2008) Colorectal cancer
stem cells are enriched in xenogeneic tumors following chemotherapy. PLoSONE 3: e2428.
27. Dalerba P, Dylla SJ, Park IK, Liu R, Wang X, et al. (2007) Phenotypic
characterization of human colorectal cancer stem cells. Proc Natl Acad Sci U S A104: 10158–10163.
28. Tao K, Fang M, Alroy J, Sahagian GG (2008) Imagable 4T1 model for the studyof late stage breast cancer. BMC Cancer 8: 228.
29. Gill DR, Smyth SE, Goddard CA, Pringle IA, Higgins CF, et al. (2001)Increased persistence of lung gene expression using plasmids containing the
ubiquitin C or elongation factor 1alpha promoter. Gene Ther 8: 1539–1546.
30. Kuo C, Coquoz O, Troy TL, Xu H, Rice BW (2007) Three-dimensionalreconstruction of in vivo bioluminescent sources based on multispectral imaging.
J Biomed Opt 12: 024007.31. Pfeifer A, Kessler T, Yang M, Baranov E, Kootstra N, et al. (2001) Transduction
of liver cells by lentiviral vectors: analysis in living animals by fluorescence
imaging. Mol Ther 3: 319–322.
Single Cell Detection In Vivo
PLoS ONE | www.plosone.org 9 February 2010 | Volume 5 | Issue 2 | e9364