Analysis of progenitor cell–scaffold combinations by in vivo non-invasive photonic imaging
11
Biomaterials 28 (2007) 2718–2728 Analysis of progenitor cell–scaffold combinations by in vivo non-invasive photonic imaging Irene Roma´n a , Marta Vilalta a , Julio Rodriguez a , Annette M. Matthies b , Samer Srouji c , Erella Livne d , Jeffrey A. Hubbell b , Nuria Rubio a , Jero´nimo Blanco a, a Cardiovascular Research Center (CSIC-ICCC), Hospital de Sant Pau, Barcelona 08025, Spain b Institute of Bioengineering and Institute of Chemical Sciences and Engineering, Ecole Polytechnique Fe´de´rale de Lausanne, CH-1015 Lausanne, Switzerland c Maxillofacial Surgery Department, Carmel Medical Center, Haifa, Israel d Faculty of Medicine, Technion-Israel Institute of Technology, Haifa, Israel Received 2 November 2006; accepted 2 February 2007 Available online 20 February 2007 Abstract Recent developments in stem cell research have promoted a flourishing of new biomaterials and scaffolds for tissue repair. However, there is a scarcity of procedures to monitor the performance of scaffold-stem cell combinations implanted in live animals, avoiding the inherent artefacts associated with in vitro assay conditions. We report the implementation of a procedure based on the use of the luciferase gene as a cell proliferation tracer to monitor, by in vivo non-invasive imaging, the performance of stem cell–biomaterial combinations used for tissue regeneration. In a model system using immunodepressed mice we show preference of a mouse embryonic mesenchymal cell line (C3H/10T1/2) for specific implantation sites and biomaterials during a prolonged in vivo growth period (3 months). Moreover, we analyzed the safety of implanted cells using a sensitive luminometric procedure and showed that the implanted cells did not spread to other organs. Our results demonstrate the utility of this simple and resource-saving procedure in the development and screening of biomaterials for tissue engineering. r 2007 Elsevier Ltd. All rights reserved. Keywords: In vivo imaging; Cell proliferation; Scaffold; Luciferase; Enhanced green fluorescent protein (EGFP) 1. Introduction The shortage of donor tissue and organs for transplants has promoted a large research and development effort aimed at generating alternative therapeutic solutions, for the millions of patients that suffer each year from organ failure [1]. There are multiple cell types with potential for tissue regeneration [2]. Autologous adult stem cells derived from specific organs, e.g. the bone marrow and fat, are capable of differentiating to adipose tissue, bone and cartilage and appear as ideal candidates for cell therapies [3–11], avoiding problems associated with immune rejection, pathogen transmission and ethical issues. Scaffolds [12] are three-dimensional delivery vehicles, providing physical, chemical and biological information that directs stem cell proliferation and differentiation towards the desired cell types and structural organizations [13]. Additionally, scaffolds should be non-toxic, non-inflammatory, non- immunogenic and should disappear once their function cesses to be required. In practice, scaffold design is an empirical process of trial and error directed at achieving a defined objective, that is, a well-structured and functional tissue. The scaffold designer must be able to analyze the capacity of materials already existing or designed with specific functionalities in mind to sustain cell implantation, proliferation and to direct appropriate cell differentiation [14,15]. Thus, the capacity to monitor in vivo the functional state, e.g. proliferation and differentiation, of cells seeded in scaffolds is of great importance for scaffold design. Photinus pyralis luciferase (Pluc) catalyzes the oxidation of luciferin in the presence of ATP and coenzyme A, ARTICLE IN PRESS www.elsevier.com/locate/biomaterials 0142-9612/$ - see front matter r 2007 Elsevier Ltd. All rights reserved. doi:10.1016/j.biomaterials.2007.02.011 Corresponding author. Tel.: +34935565905; fax: +34935565559. E-mail address: [email protected] (J. Blanco).
Transcript of Analysis of progenitor cell–scaffold combinations by in vivo non-invasive photonic imaging
ARTICLE IN PRESS
0142-9612/$ - se
doi:10.1016/j.bi
�CorrespondE-mail addr
Biomaterials 28 (2007) 2718–2728
www.elsevier.com/locate/biomaterials
Analysis of progenitor cell–scaffold combinations by in vivonon-invasive photonic imaging
Irene Romana, Marta Vilaltaa, Julio Rodrigueza, Annette M. Matthiesb, Samer Sroujic,Erella Livned, Jeffrey A. Hubbellb, Nuria Rubioa, Jeronimo Blancoa,�
aCardiovascular Research Center (CSIC-ICCC), Hospital de Sant Pau, Barcelona 08025, SpainbInstitute of Bioengineering and Institute of Chemical Sciences and Engineering, Ecole Polytechnique Federale de Lausanne, CH-1015 Lausanne, Switzerland
cMaxillofacial Surgery Department, Carmel Medical Center, Haifa, IsraeldFaculty of Medicine, Technion-Israel Institute of Technology, Haifa, Israel
Received 2 November 2006; accepted 2 February 2007
Available online 20 February 2007
Abstract
Recent developments in stem cell research have promoted a flourishing of new biomaterials and scaffolds for tissue repair. However,
there is a scarcity of procedures to monitor the performance of scaffold-stem cell combinations implanted in live animals, avoiding the
inherent artefacts associated with in vitro assay conditions. We report the implementation of a procedure based on the use of the
luciferase gene as a cell proliferation tracer to monitor, by in vivo non-invasive imaging, the performance of stem cell–biomaterial
combinations used for tissue regeneration. In a model system using immunodepressed mice we show preference of a mouse embryonic
mesenchymal cell line (C3H/10T1/2) for specific implantation sites and biomaterials during a prolonged in vivo growth period (3 months).
Moreover, we analyzed the safety of implanted cells using a sensitive luminometric procedure and showed that the implanted cells did not
spread to other organs. Our results demonstrate the utility of this simple and resource-saving procedure in the development and screening
of biomaterials for tissue engineering.
r 2007 Elsevier Ltd. All rights reserved.
Keywords: In vivo imaging; Cell proliferation; Scaffold; Luciferase; Enhanced green fluorescent protein (EGFP)
1. Introduction
The shortage of donor tissue and organs for transplantshas promoted a large research and development effortaimed at generating alternative therapeutic solutions, forthe millions of patients that suffer each year from organfailure [1].
There are multiple cell types with potential for tissueregeneration [2]. Autologous adult stem cells derived fromspecific organs, e.g. the bone marrow and fat, are capableof differentiating to adipose tissue, bone and cartilage andappear as ideal candidates for cell therapies [3–11],avoiding problems associated with immune rejection,pathogen transmission and ethical issues. Scaffolds [12]are three-dimensional delivery vehicles, providing physical,
e front matter r 2007 Elsevier Ltd. All rights reserved.
omaterials.2007.02.011
ing author. Tel.: +34935565905; fax: +34935565559.
ess: [email protected] (J. Blanco).
chemical and biological information that directs stem cellproliferation and differentiation towards the desired celltypes and structural organizations [13]. Additionally,scaffolds should be non-toxic, non-inflammatory, non-immunogenic and should disappear once their functioncesses to be required.In practice, scaffold design is an empirical process of
trial and error directed at achieving a defined objective,that is, a well-structured and functional tissue. The scaffolddesigner must be able to analyze the capacity of materialsalready existing or designed with specific functionalities inmind to sustain cell implantation, proliferation and todirect appropriate cell differentiation [14,15]. Thus, thecapacity to monitor in vivo the functional state, e.g.proliferation and differentiation, of cells seeded in scaffoldsis of great importance for scaffold design.
Photinus pyralis luciferase (Pluc) catalyzes the oxidationof luciferin in the presence of ATP and coenzyme A,
ARTICLE IN PRESSI. Roman et al. / Biomaterials 28 (2007) 2718–2728 2719
producing light and O2. Due to an almost completeabsence of endogenous photons in mammalian cells, exceptfor very low-intensity luminescence resulting from someredox reactions [16], the existence of highly sensitive lightmeasuring instruments allowing detection of the enzyme ata concentration of 1� 10�19mol/l and the lack of require-ment for post-translational modification, Pluc is a veryconvenient and quantifiable cell reporter [17].
Despite the apparent opacity of tissues, light can be usedto probe physiologic functions and structures at depths ofseveral millimeters [18,19]. These optical properties oftissues allow the generation of images of cells implanted inlive organisms. Light from genetically manipulated cellsexpressing Pluc has been used in the past to non-invasivelymonitor gene activity in tissues of small animals, such asmammalian embryos [20,21]. In larger animals such asmice, Pluc fused to the human immunodeficiency viruspromoter has been used to report on the activity of thepromoter transgene [22], to study the clearance rate of aPluc-expressing HeLa ascites tumor during antineoplasticdrug treatment [23], for non-invasive in vivo quantificationof Pluc-labeled tumor metastases [24], and for monitoringexpression of osteocalcin during bone formation [25].
In the present work we report the implementation of awell-defined assay platform, based on non-invasive ima-ging, to monitor the proliferation behavior of Plucexpressing cells seeded in biomaterial scaffolds implantedin live animals, which should be of general application inscaffold design and regenerative medicine.
2. Materials and methods
2.1. Retrovirus
Retroviral vector prEGFP–CMV–Pluc, used for cell labeling contains
the enhanced green fluorescent protein (EGFP) gene sequence under
control of the 50LTR and the Pluc gene coding region under control of the
cytomegalovirus (CMV) promoter. The Pluc gene was excised from the
pSP-luc+ vector (Promega Corporation, Madison, WI) and cloned into
the pRC/CMV vector (Invitrogen, San Diego, CA). To generate the vector
prEGFP–CMV–Pluc, the CMV promoter and the Pluc gene were inserted
in the pSFB91EGF vector (provided by Dr. C. Baum) [26].
2.2. Cell culture and viral transduction
Human embryonic kidney cells 293GPG (provided by Dr. D. Ory) [27]
were used for packaging of viral particles. The cells were grown in
Dulbecco’s Modified Eagle Media-high glucose (DMEM-hg) (Sigma,
Steinheim, Germany), 10% heat-inactivated fetal bovine serum (FBS)
(Sigma), 2mM L-glutamine (Sigma), 50 units/ml penicillin/streptomycin
(Sigma), 1 mg/ml tetracycline (Sigma), 2 mg/ml puromycin (Sigma)
and 0.3mg/ml G418 (Sigma). Cell cultures were trypsinized and plated
the evening prior to transfection. The following day, tetracycline was
removed and the cells, now 90–95% confluent, were transfected with the
prEGFP–CMV–Pluc construct using lipofectamine and plus reagent
(Invitrogen). The culture supernatants were collected every 24 h until
120 h and used to transduce the C3H/10T1/2 mouse embryonic cell line
(ATCC, Rockville, Maryland).
C3H/10T1/2 cells were grown in DMEM D7777 (Sigma) supplemented
with 1.5 g/L sodium bicarbonate (Sigma), 1% penicillin/streptomicin and
10% FBS and were plated at a density of 104 cells/well in 12 well plates the
day prior to transduction. For transduction, 1ml of the 48–96 h
supernatants supplemented with 100ml of protamine sulfate (Sigma)
50mg/ml was added to the cells and incubated for 8 h, after which the
media was replaced with fresh media and the cells were allowed to
continue growing. This process is repeated during a 3-day period. The
higher 6% EGFP expressing cells (C3H/10T1/2.Pluc) were selected by
FACS, expanded and used for seeding in the scaffolds.
2.3. Luciferase assays
Luciferase activity results in the generation of light in the green region
of the spectrum, wavelengths 500–650nm.
Light production capacity of C3H/10T1/2.Pluc cells was measured
using a standard curve generated with 10, 50, 250, 500 and 1000 lysed
C3H/10T1/2.Pluc cells in reporter lysis buffer (RLB) (Promega). To
determine luciferase activity, 100ml of luciferin (Promega) were added to
the cell lysates (20ml) and following a 2 s delay measured in a luminometer
(Berthold detection systems, Pforzheim, Germany) using a 10 s integration
period. Light measurements were expressed as relative light units (RLUs).
2.4. Seeding of scaffolds
Three materials were tested in the present study: a polyethylenglycol
(PEG) hydrogel cross-linked to a RGD peptide (hydrogel-1) [28], a
gelatine-glutaraldehyde hydrogel (hydrogel-2) [29] and calcium alginate
beads. To prepare hydrogel-1, 20 ml of PBS were added to a pre-made
7% PEG–RGD frozen aliquot (mix 1). In a different tube, 49.6 ml of
triethanolamine (Fluka, St.Gallen, Switzerland) 0.3M pH 8 were added to
a pre-made aliquot of lyophilized matrix metalloproteinase (MMP) cross-
linker and then mixed with 20 ml of medium containing 4� 105 C3H/10T1/
2.Pluc cells (enough for 4 implantations). Then 132ml of the re-suspendedPEG-RGD (mix 1) were added to the MMP cross linker mix. For
hydrogel-2, 200ml of medium containing 7� 105 cells (enough for 4
implantations) were poured drop wise over the upper surface of the pre-
made and lyophilized scaffold material, and placed for 45min in a 37 1C
CO2 incubator, after which 1ml of medium was added and cultivation
continued. To prepare alginate beads 3.5� 106 cells were suspended in
400ml of a 1.2% low-viscosity alginate (Sigma) solution in NaCl 0.15M.
The suspension was added drop wise through a 23-gauge needle to a
100mM CaCl2 solution, where the drops were allowed to gel for 10min.
The formed beads were then washed four times in NaCl 0.15M and once in
C3H/10T1/2 medium. Each bead contained approximately 8.5� 104 cells.
Two beads were implanted in each site. Cell seeding was done 5 days in
advance of the implantation for hydrogel-2 and alginate, or the same day
of implantation for hydrogel-1. C3H/10T1/2.Pluc cells without scaffold
(control) were trypsinized, suspended in media without FBS and 50 mlcontaining 1.5� 105 cells were inoculated per site.
2.5. Inoculation of scaffolds in nude mice
Six-week-old BALB/c homozygous nude (nu/nu) mice were purchased
from Charles-River (Wilmington, MA) and maintained in a specific
pathogen-free environment throughout the experiment. All animal-related
procedures were performed with the approval of the animal care
committee of the Cardiovascular Research Center and the Government
of Catalonia. Four implantations were performed symmetrically in each
animal: two subcutaneous (SC) on the back and one intramuscular (IM) in
each thigh. Each material was tested in 6 mice, each mouse receiving one
material in its left side and a different one in its right side. Cells without
scaffold were also injected SC and IM. Before scaffold implantation, the
animals were anesthetized by an intraperitoneal injection with 100mg/kg
ketamine (Merial, Duluth, GA) and 3.3mg/kg xilacine (Henry Schein,
Melville, NY) and immobilized. To implant hydrogel-1 the material
components were mixed with the cells, as described, and immediately 25 mlwere injected in each site. The mixture gels inside the animal within 10min.
To implant hydrogel-2 and alginate scaffolds, a puncture was made
ARTICLE IN PRESSI. Roman et al. / Biomaterials 28 (2007) 2718–27282720
through the mouse skin (SC) or skin plus thigh muscle (IM) using a 16G
needle and then, 30 ml of the gelled material was implanted using a syringe
fitted with a bevel ended pipette tip. Finally, the perforations were sealed
with 3M VetbondTM (3M Animal Care Products, St Paul, MN) surgical
glue. To implant no-scaffold controls, cells suspended in medium without
serum were directly injected in each site.
2.6. In vivo non-invasive imaging and image analysis
In vivo optical imaging of engrafted nude mice was performed as
described previously [30]. Mice were anesthetized and 50ml of luciferin
(16.7mg/ml in PBS) were injected in situ and images were acquired during
a 5min period, starting 5min post luciferin inoculation. For imaging, the
animals were placed at 247mm from the camera objective (HFP-Schneider
Xenon 0.95/25mm) using the maximal diaphragm aperture, in the
detection chamber of a high-efficiency ORCA-2BT Imaging System
(Hamamatsu Photonics, Hamamatsu City, Japan) provided with a
C4742-98-LWG-MOD camera fitted with a 512� 512 pixel, charge couple
device (CCD) storing 230.000e�/pixel, cooled at �80 1C. The CCD
responds to light of 300–900nm with a quantum yield of 90% for
wavelengths between 500 and 700 nm. Immediately after image acquisi-
tion, while the animal remained in the same position, a second image of
the animal was obtained using a white light source inside the detection
chamber. To increase detection sensitivity the reading noise of the
recorded signal was reduced by adding together the light events registered
by arrays of 8� 8 adjacent pixels (binning 8� 8) of the camera CCD. Mice
were imaged at days 0, 7, 14, 30, 45 and 90 post-implantation.
Quantification and analysis of photons recorded in images was done
using the Wasabi image analysis software (Hamamatsu Photonics). In
order to establish the correlation between the number of transplanted cells
and the emitted light, a standard curve was generated by grafting 5� 102,
103, 5� 103, 104, 5� 104, 105, 5� 105 C3H/10T1/2.Pluc cells suspended in
DMEM-hg in the thigh of nude mice. The animals were imaged the same
day of the injection as previously described.
Light measurements were expressed as photon counts (PHCs). Data is
represented as the number of PHCs versus number of grafted cells. The
slope of the linear regression curve is the number of in vivo PHCs per
transplanted cell. Color images were generated using an arbitrary color
palette representing standard light intensity levels (blue ¼ lowest; red-
highest). To calculate the number of PHCs from a selected area of interest,
the number of recorded PHCs is extracted from the image memory
and the average number of PHCs/pixel is calculated using the Wasabi
image analysis software (average PHCs/pixel). The same operation is
performed for an area of the mouse image memory containing no
implanted cells (average background PHCs/pixel). Net number of PHCs in
the area of interest ¼ [(average PHCs/pixel)�(average background PHCs/
pixel)]� (number of pixels in the area of interest).
2.6.1. Display of acquired images
There are important differences between the way data is stored in the
image memory for each pixel of the recording device, the CCD, and
the way in which such data is represented by the computer graphics in the
monitor. While the image memory can store 65535 different light levels
corresponding to the number of light events reaching the CCD’s pixels, the
computer graphics can only display 256 different gray or pseudo color
levels for each pixel. Thus, the printed images corresponding to memory
images that contain more light levels than the available computer display
levels will either be unable to represent low intensity levels, or conversely,
will represent well the low intensity levels but will be saturated for the
higher intensity levels. In the current work, we have decided to bias the
representation towards low intensity levels, which results in saturated high
intensities, red color in the scale.
2.7. Cell migration
To determine migration of cells implanted within scaffolds to other
organs, after the 3-month period of in vivo growth, two animals from each
test set (the ones producing most light at the implantation site) were
chosen. Target organs (brain, liver, spleen, lungs, hip bone and lymph
nodes) were harvested, homogenized and assayed to determine Pluc
activity using a very sensitive luminometric procedure as described [31],
capable of revealing the presence of 50–100 cells per organ.
2.8. Histology
At the end of the in vivo phase of the experiments, for each of the test
groups, one of the IM implantation zones was selected, harvested, washed
with PBS and after de-boning included in OCT. Sections of 5mm were
prepared using a cryostat (Leica, Wetzlar, Germany) and stained with
hematoxylin (Merck, Darmstadt, Germany) and eosin (Sigma).
2.9. Recovery of cells from implanted scaffolds
At the end of the 90-day in vivo growth period, a thigh muscle from one
mouse of each test group was harvested, washed with PBS and minced.
The tissue fragments were placed on a tissue culture plate and covered
with a thin layer of C3H/10T1/2 medium plus 2% penicillin/streptomicyn
and 1 mg/ml fungizone (Sigma). The following day fresh medium was
added and cultivation was continued until EGFP positive cells were
observed migrating out of the tissue fragments. Cells freed from the tissues
were trypsinized, seeded in fresh medium and cultivated until there were
enough cells for fluorescence intensity and Pluc activity determinations.
2.10. Statistical analysis
The average of net PHCs normalized to those of day 0 was used to
compare the behavior of the labeled cells seeded on the different scaffolds.
The data were analyzed using SPSS version 14 software using the General
Lineal Models (GLM) method. To evaluate the effect of the scaffold type
on the cell proliferation a two-way ANOVA was performed (significance
was assumed when po0.05).
3. Results
3.1. Light production by C3H/10T1/2.Pluc cells in vitro
To determine the amount of light generated by the C3H/10T1/2.Pluc cells in culture, Pluc activity was measured inlysates generated from predetermined numbers of cells.Fig. 1 shows a standard plot of light production, expressedas RLUs, versus the number of cells in the lysates. Theslope of the linear regression plot, the number of RLUsgenerated by a single cell, was 213 RLUs/cell.
3.2. Non-invasive detection of intramuscularly implanted
C3H/10T1/2.Pluc cells
Predetermined numbers of C3H/10T1/2.Pluc cells wereinoculated in the tights of nude mice and imaged asdescribed. The number of detected PHCs, extractedfrom the recorded images (Fig. 2a), was plotted versusthe number of inoculated cells (Fig. 2b), followingsubtraction of the background noise, from an image areadevoid of implanted cells. The data shows that a minimumnumber of 5000 cells were required for detection. More-over, the linear relationship between cell number andPHCs indicates that the intervening tissue has a linearquenching effect on transmitted light photons. The slope of

ARTICLE IN PRESS
5x10² 103 5x10³ 10
y = 23.4x -
R2 = 0
0
2000000
4000000
6000000
8000000
10000000
12000000
14000000
0 20000
Numbe
Photo
n C
ounts
a
b
Fig. 2. In vivo detection of C3H/10T1/2.Pluc cells. (a) 5� 102, 103, 5� 103, 104,
nude mice and directly imaged after addition of luciferin. (b) Photon counts (P
PHCs, versus the number of cells inoculated. The slope of the regression line
0
50.000
100.000
150.000
200.000
250.000
300.000
RL
Us
y = 213.14x –1221.5
R2 = 0.999
0 200 400 600 800 1000
Number of cells
Fig. 1. In vitro luminescence from C3H/10T1/2.Pluc cells. The graph
shows the light production capacity of 10, 50, 250, 500 and 1000 cells.
Light production is expressed as relative light units (RLUs). The slope of
the regression line is the number of RLUs/cell. R ¼ correlation coefficient.
I. Roman et al. / Biomaterials 28 (2007) 2718–2728 2721
the standard plot shows that the number of non-invasivelydetected PHCs/cell was 23.4.
3.3. Cell proliferation in vitro
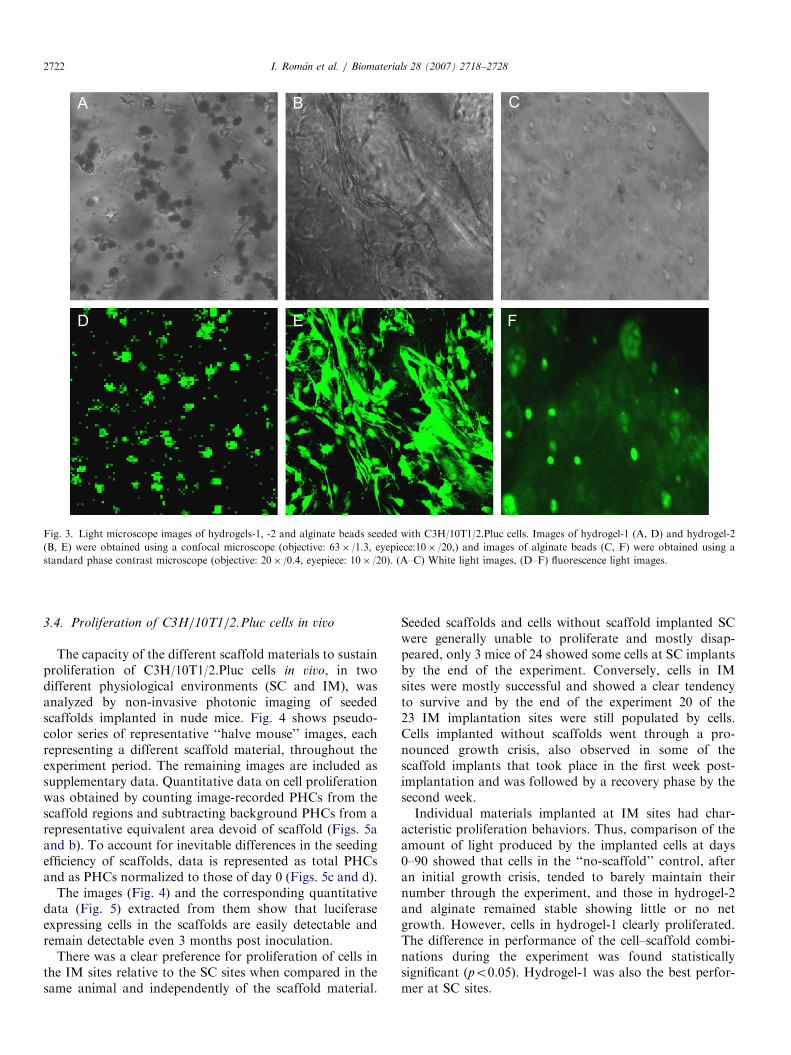
A fraction of the seeded scaffold was kept in culture andthe rest was implanted in nude mice. The morphology ofcells seeded in the scaffolds kept in culture was monitoredby light and fluorescence confocal microscopy, using theEGFP fluorescence (fluorescence microscopy excitationrange for EGFP was from 515 to 560 nm and emission wasat 590 nm) (Fig. 3). Cell morphology depended on the typeof scaffold, thus, while cells seeded in hydrogel-1 andalginate beads retained a round morphology, cells inhydrogel-2 adopted fibroblastic morphology a few hourspost seeding.Each scaffold material had a characteristic behavior
in vitro. Hydrogel-1 and alginate beads retained theirintegrity throughout a 4-month period while hydrogel-2disintegrated within 6–8 weeks.
5x1055x1044 105
35618
.9999
0 400000 600000
r of Inoculated Cells
5� 104, 105, 5� 105 C3H/10T1/2.Pluc cells were inoculated in the tights of
HCs) recorded in the images were plotted, after subtraction of background
is the number of PHCs/cell. R ¼ correlation coefficient.
ARTICLE IN PRESS
A
D E F
B C
Fig. 3. Light microscope images of hydrogels-1, -2 and alginate beads seeded with C3H/10T1/2.Pluc cells. Images of hydrogel-1 (A, D) and hydrogel-2
(B, E) were obtained using a confocal microscope (objective: 63� /1.3, eyepiece:10� /20,) and images of alginate beads (C, F) were obtained using a
standard phase contrast microscope (objective: 20� /0.4, eyepiece: 10� /20). (A–C) White light images, (D–F) fluorescence light images.
I. Roman et al. / Biomaterials 28 (2007) 2718–27282722
3.4. Proliferation of C3H/10T1/2.Pluc cells in vivo
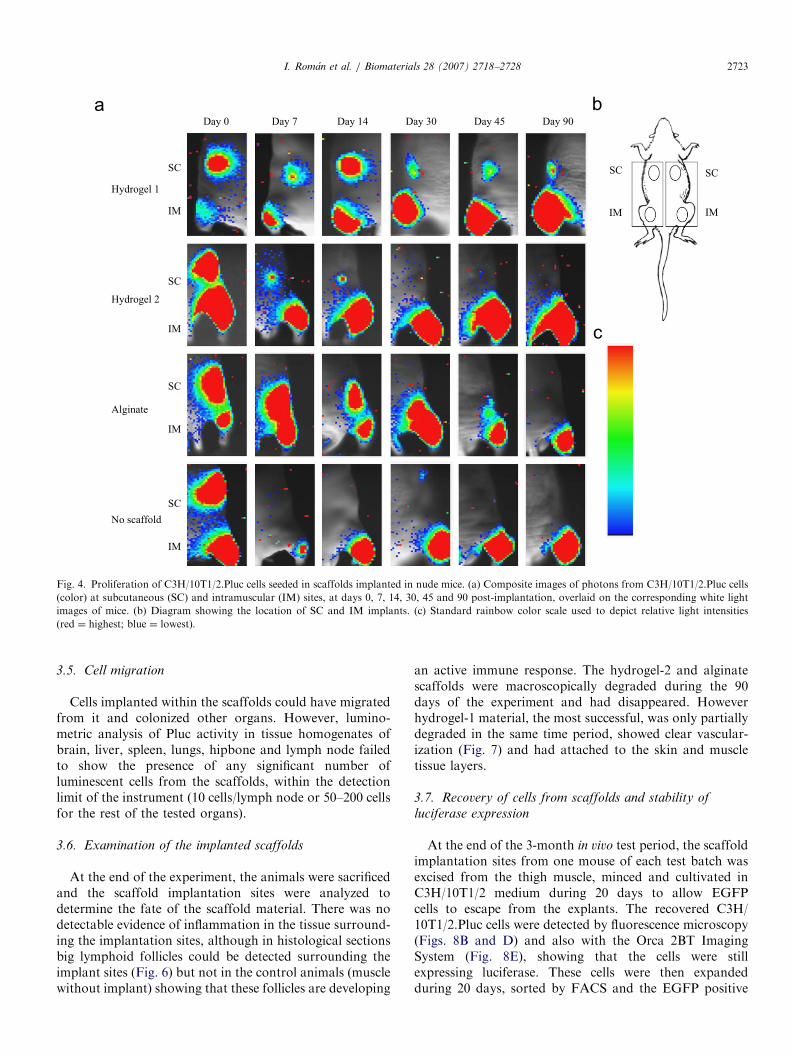
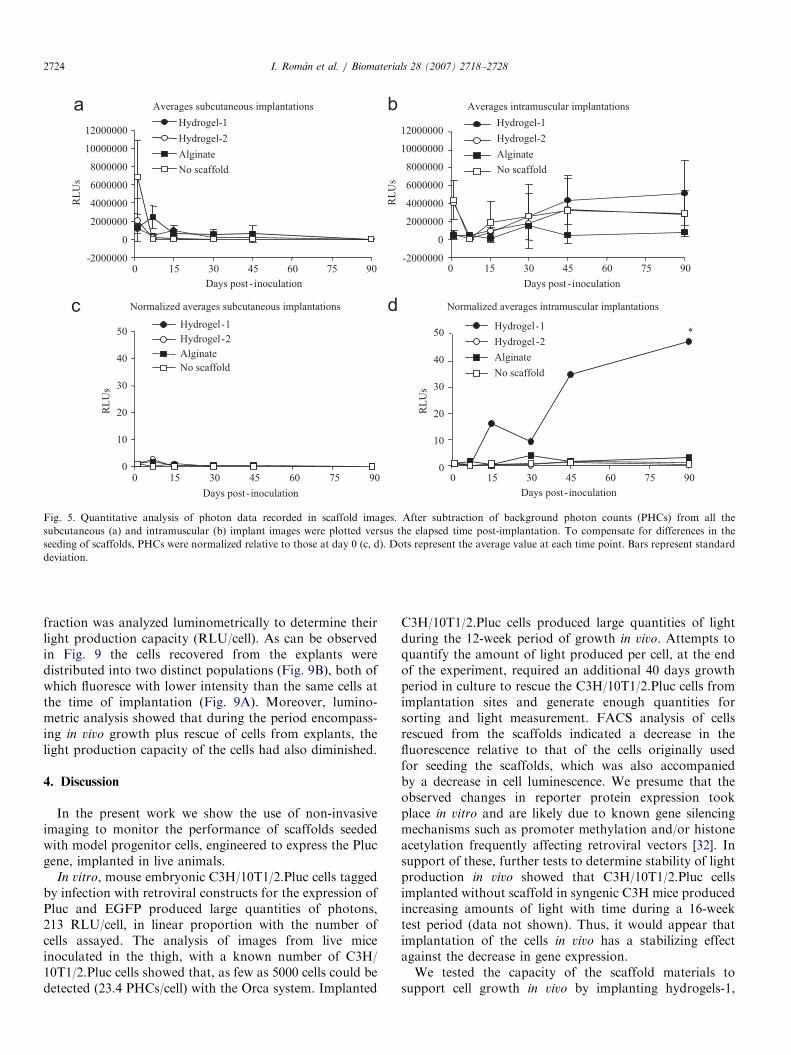
The capacity of the different scaffold materials to sustainproliferation of C3H/10T1/2.Pluc cells in vivo, in twodifferent physiological environments (SC and IM), wasanalyzed by non-invasive photonic imaging of seededscaffolds implanted in nude mice. Fig. 4 shows pseudo-color series of representative ‘‘halve mouse’’ images, eachrepresenting a different scaffold material, throughout theexperiment period. The remaining images are included assupplementary data. Quantitative data on cell proliferationwas obtained by counting image-recorded PHCs from thescaffold regions and subtracting background PHCs from arepresentative equivalent area devoid of scaffold (Figs. 5aand b). To account for inevitable differences in the seedingefficiency of scaffolds, data is represented as total PHCsand as PHCs normalized to those of day 0 (Figs. 5c and d).
The images (Fig. 4) and the corresponding quantitativedata (Fig. 5) extracted from them show that luciferaseexpressing cells in the scaffolds are easily detectable andremain detectable even 3 months post inoculation.
There was a clear preference for proliferation of cells inthe IM sites relative to the SC sites when compared in thesame animal and independently of the scaffold material.
Seeded scaffolds and cells without scaffold implanted SCwere generally unable to proliferate and mostly disap-peared, only 3 mice of 24 showed some cells at SC implantsby the end of the experiment. Conversely, cells in IMsites were mostly successful and showed a clear tendencyto survive and by the end of the experiment 20 of the23 IM implantation sites were still populated by cells.Cells implanted without scaffolds went through a pro-nounced growth crisis, also observed in some of thescaffold implants that took place in the first week post-implantation and was followed by a recovery phase by thesecond week.Individual materials implanted at IM sites had char-
acteristic proliferation behaviors. Thus, comparison of theamount of light produced by the implanted cells at days0–90 showed that cells in the ‘‘no-scaffold’’ control, afteran initial growth crisis, tended to barely maintain theirnumber through the experiment, and those in hydrogel-2and alginate remained stable showing little or no netgrowth. However, cells in hydrogel-1 clearly proliferated.The difference in performance of the cell–scaffold combi-nations during the experiment was found statisticallysignificant (po0.05). Hydrogel-1 was also the best perfor-mer at SC sites.
ARTICLE IN PRESS
Day 90
IMIM
SCSC
Alginate
Hydrogel 2
Hydrogel 1
No scaffold
SC
IM
SC
IM
SC
IM
SC
IM
Day 0 Day 14Day 7 Day 30 Day 45
a b
c
Fig. 4. Proliferation of C3H/10T1/2.Pluc cells seeded in scaffolds implanted in nude mice. (a) Composite images of photons from C3H/10T1/2.Pluc cells
(color) at subcutaneous (SC) and intramuscular (IM) sites, at days 0, 7, 14, 30, 45 and 90 post-implantation, overlaid on the corresponding white light
images of mice. (b) Diagram showing the location of SC and IM implants. (c) Standard rainbow color scale used to depict relative light intensities
(red ¼ highest; blue ¼ lowest).
I. Roman et al. / Biomaterials 28 (2007) 2718–2728 2723
3.5. Cell migration
Cells implanted within the scaffolds could have migratedfrom it and colonized other organs. However, lumino-metric analysis of Pluc activity in tissue homogenates ofbrain, liver, spleen, lungs, hipbone and lymph node failedto show the presence of any significant number ofluminescent cells from the scaffolds, within the detectionlimit of the instrument (10 cells/lymph node or 50–200 cellsfor the rest of the tested organs).
3.6. Examination of the implanted scaffolds
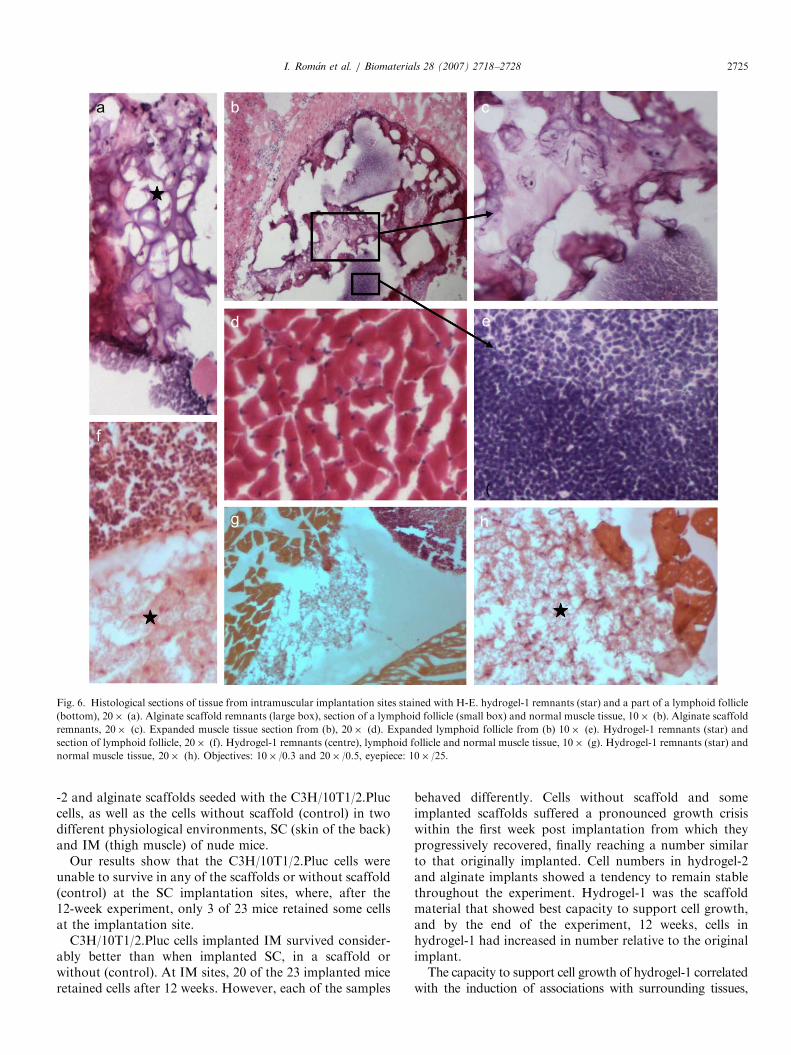
At the end of the experiment, the animals were sacrificedand the scaffold implantation sites were analyzed todetermine the fate of the scaffold material. There was nodetectable evidence of inflammation in the tissue surround-ing the implantation sites, although in histological sectionsbig lymphoid follicles could be detected surrounding theimplant sites (Fig. 6) but not in the control animals (musclewithout implant) showing that these follicles are developing
an active immune response. The hydrogel-2 and alginatescaffolds were macroscopically degraded during the 90days of the experiment and had disappeared. Howeverhydrogel-1 material, the most successful, was only partiallydegraded in the same time period, showed clear vascular-ization (Fig. 7) and had attached to the skin and muscletissue layers.
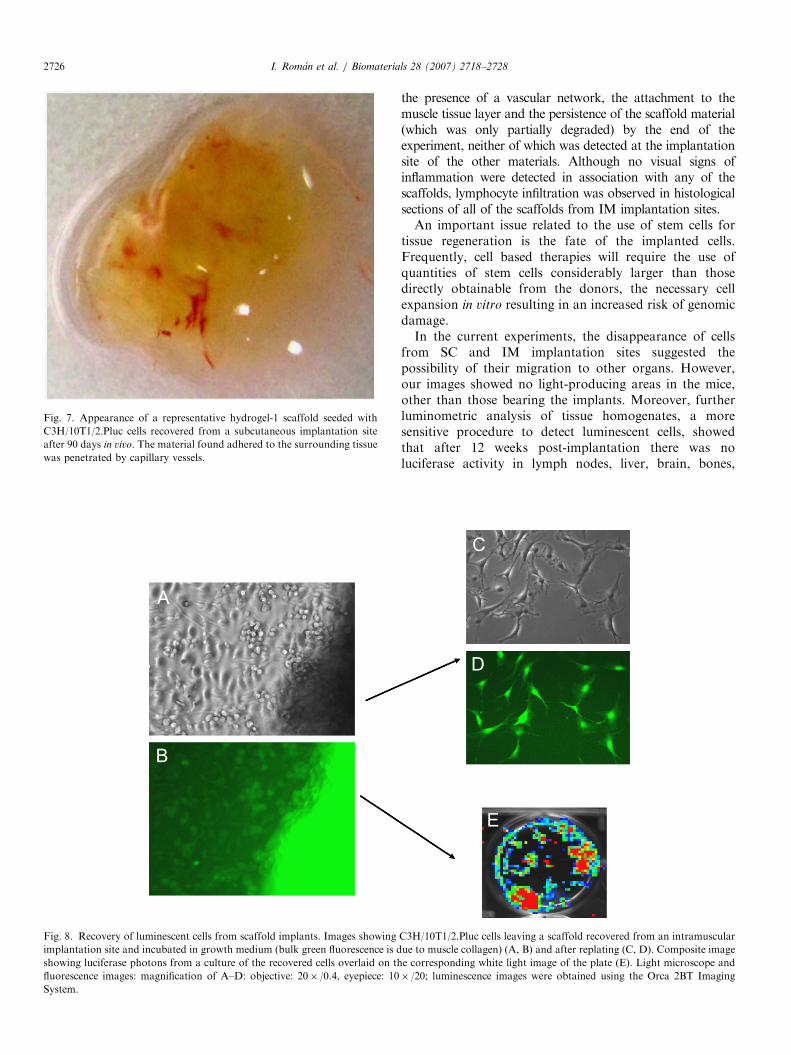
3.7. Recovery of cells from scaffolds and stability of
luciferase expression
At the end of the 3-month in vivo test period, the scaffoldimplantation sites from one mouse of each test batch wasexcised from the thigh muscle, minced and cultivated inC3H/10T1/2 medium during 20 days to allow EGFPcells to escape from the explants. The recovered C3H/10T1/2.Pluc cells were detected by fluorescence microscopy(Figs. 8B and D) and also with the Orca 2BT ImagingSystem (Fig. 8E), showing that the cells were stillexpressing luciferase. These cells were then expandedduring 20 days, sorted by FACS and the EGFP positive
ARTICLE IN PRESS
*
Averages subcutaneous implantations
-2000000
0
2000000
4000000
6000000
8000000
10000000
12000000
0 15 30 45 60 75 90
Days post -inoculation
0 15 30 45 60 75 90
Days post -inoculation
RL
Us
-2000000
0
2000000
4000000
6000000
8000000
10000000
12000000
RL
Us
Hydrogel-1
Hydrogel-2
Alginate
No scaffold
Hydrogel-1
Hydrogel-2
Alginate
No scaffold
Averages intramuscular implantations
Normalized averages subcutaneous implantations
0
10
20
30
40
50
0 15 30 45 60 75 90
Days post-inoculation
0 15 30 45 60 75 90
Days post-inoculation
RL
Us
0
10
20
30
40
50
RL
Us
Hydrogel-1
Hydrogel-2
Alginate
No scaffold
Hydrogel-1
Hydrogel-2
Alginate
No scaffold
Normalized averages intramuscular implantations
a b
dc
Fig. 5. Quantitative analysis of photon data recorded in scaffold images. After subtraction of background photon counts (PHCs) from all the
subcutaneous (a) and intramuscular (b) implant images were plotted versus the elapsed time post-implantation. To compensate for differences in the
seeding of scaffolds, PHCs were normalized relative to those at day 0 (c, d). Dots represent the average value at each time point. Bars represent standard
deviation.
I. Roman et al. / Biomaterials 28 (2007) 2718–27282724
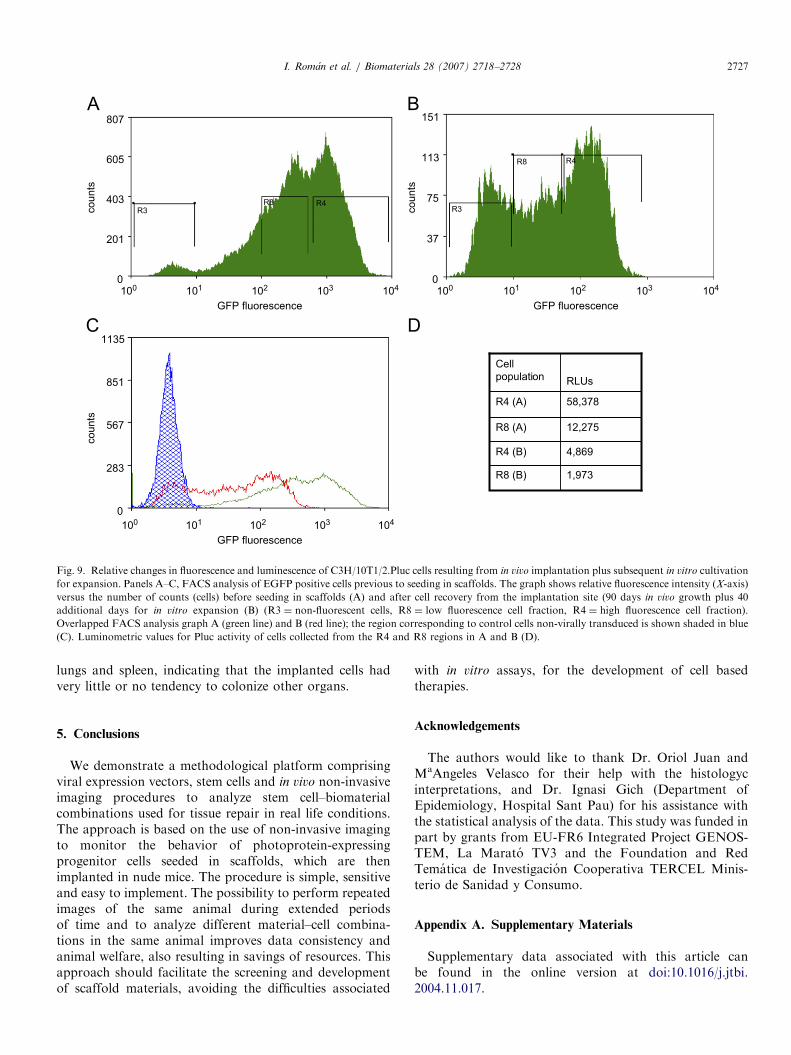
fraction was analyzed luminometrically to determine theirlight production capacity (RLU/cell). As can be observedin Fig. 9 the cells recovered from the explants weredistributed into two distinct populations (Fig. 9B), both ofwhich fluoresce with lower intensity than the same cells atthe time of implantation (Fig. 9A). Moreover, lumino-metric analysis showed that during the period encompass-ing in vivo growth plus rescue of cells from explants, thelight production capacity of the cells had also diminished.
4. Discussion
In the present work we show the use of non-invasiveimaging to monitor the performance of scaffolds seededwith model progenitor cells, engineered to express the Plucgene, implanted in live animals.
In vitro, mouse embryonic C3H/10T1/2.Pluc cells taggedby infection with retroviral constructs for the expression ofPluc and EGFP produced large quantities of photons,213 RLU/cell, in linear proportion with the number ofcells assayed. The analysis of images from live miceinoculated in the thigh, with a known number of C3H/10T1/2.Pluc cells showed that, as few as 5000 cells could bedetected (23.4 PHCs/cell) with the Orca system. Implanted
C3H/10T1/2.Pluc cells produced large quantities of lightduring the 12-week period of growth in vivo. Attempts toquantify the amount of light produced per cell, at the endof the experiment, required an additional 40 days growthperiod in culture to rescue the C3H/10T1/2.Pluc cells fromimplantation sites and generate enough quantities forsorting and light measurement. FACS analysis of cellsrescued from the scaffolds indicated a decrease in thefluorescence relative to that of the cells originally usedfor seeding the scaffolds, which was also accompaniedby a decrease in cell luminescence. We presume that theobserved changes in reporter protein expression tookplace in vitro and are likely due to known gene silencingmechanisms such as promoter methylation and/or histoneacetylation frequently affecting retroviral vectors [32]. Insupport of these, further tests to determine stability of lightproduction in vivo showed that C3H/10T1/2.Pluc cellsimplanted without scaffold in syngenic C3H mice producedincreasing amounts of light with time during a 16-weektest period (data not shown). Thus, it would appear thatimplantation of the cells in vivo has a stabilizing effectagainst the decrease in gene expression.We tested the capacity of the scaffold materials to
support cell growth in vivo by implanting hydrogels-1,
ARTICLE IN PRESS
a b
d
g
f
c
e
h
Fig. 6. Histological sections of tissue from intramuscular implantation sites stained with H-E. hydrogel-1 remnants (star) and a part of a lymphoid follicle
(bottom), 20� (a). Alginate scaffold remnants (large box), section of a lymphoid follicle (small box) and normal muscle tissue, 10� (b). Alginate scaffold
remnants, 20� (c). Expanded muscle tissue section from (b), 20� (d). Expanded lymphoid follicle from (b) 10� (e). Hydrogel-1 remnants (star) and
section of lymphoid follicle, 20� (f). Hydrogel-1 remnants (centre), lymphoid follicle and normal muscle tissue, 10� (g). Hydrogel-1 remnants (star) and
normal muscle tissue, 20� (h). Objectives: 10� /0.3 and 20� /0.5, eyepiece: 10� /25.
I. Roman et al. / Biomaterials 28 (2007) 2718–2728 2725
-2 and alginate scaffolds seeded with the C3H/10T1/2.Pluccells, as well as the cells without scaffold (control) in twodifferent physiological environments, SC (skin of the back)and IM (thigh muscle) of nude mice.
Our results show that the C3H/10T1/2.Pluc cells wereunable to survive in any of the scaffolds or without scaffold(control) at the SC implantation sites, where, after the12-week experiment, only 3 of 23 mice retained some cellsat the implantation site.
C3H/10T1/2.Pluc cells implanted IM survived consider-ably better than when implanted SC, in a scaffold orwithout (control). At IM sites, 20 of the 23 implanted miceretained cells after 12 weeks. However, each of the samples
behaved differently. Cells without scaffold and someimplanted scaffolds suffered a pronounced growth crisiswithin the first week post implantation from which theyprogressively recovered, finally reaching a number similarto that originally implanted. Cell numbers in hydrogel-2and alginate implants showed a tendency to remain stablethroughout the experiment. Hydrogel-1 was the scaffoldmaterial that showed best capacity to support cell growth,and by the end of the experiment, 12 weeks, cells inhydrogel-1 had increased in number relative to the originalimplant.The capacity to support cell growth of hydrogel-1 correlated
with the induction of associations with surrounding tissues,
ARTICLE IN PRESS
A
B
Fig. 8. Recovery of luminescent cells from scaffold implants. Images showing
implantation site and incubated in growth medium (bulk green fluorescence is d
showing luciferase photons from a culture of the recovered cells overlaid on th
fluorescence images: magnification of A–D: objective: 20� /0.4, eyepiece: 10
System.
Fig. 7. Appearance of a representative hydrogel-1 scaffold seeded with
C3H/10T1/2.Pluc cells recovered from a subcutaneous implantation site
after 90 days in vivo. The material found adhered to the surrounding tissue
was penetrated by capillary vessels.
I. Roman et al. / Biomaterials 28 (2007) 2718–27282726
the presence of a vascular network, the attachment to themuscle tissue layer and the persistence of the scaffold material(which was only partially degraded) by the end of theexperiment, neither of which was detected at the implantationsite of the other materials. Although no visual signs ofinflammation were detected in association with any of thescaffolds, lymphocyte infiltration was observed in histologicalsections of all of the scaffolds from IM implantation sites.An important issue related to the use of stem cells for
tissue regeneration is the fate of the implanted cells.Frequently, cell based therapies will require the use ofquantities of stem cells considerably larger than thosedirectly obtainable from the donors, the necessary cellexpansion in vitro resulting in an increased risk of genomicdamage.In the current experiments, the disappearance of cells
from SC and IM implantation sites suggested thepossibility of their migration to other organs. However,our images showed no light-producing areas in the mice,other than those bearing the implants. Moreover, furtherluminometric analysis of tissue homogenates, a moresensitive procedure to detect luminescent cells, showedthat after 12 weeks post-implantation there was noluciferase activity in lymph nodes, liver, brain, bones,
C
D
E
C3H/10T1/2.Pluc cells leaving a scaffold recovered from an intramuscular
ue to muscle collagen) (A, B) and after replating (C, D). Composite image
e corresponding white light image of the plate (E). Light microscope and
� /20; luminescence images were obtained using the Orca 2BT Imaging
ARTICLE IN PRESS
151
113
75
37
0100 101 102 103 104
GFP fluorescence
100 101 102 103 104
GFP fluorescence
100 101 102 103 104
GFP fluorescence
807
605
403R3
R8 R4R3
R8 R4
201
0
counts
counts
1135
851
567
283
0
counts
A
C D
B
4,869R4 (B)
1,973R8 (B)
12,275R8 (A)
58,378R4 (A)
RLUs
Cell
population
Fig. 9. Relative changes in fluorescence and luminescence of C3H/10T1/2.Pluc cells resulting from in vivo implantation plus subsequent in vitro cultivation
for expansion. Panels A–C, FACS analysis of EGFP positive cells previous to seeding in scaffolds. The graph shows relative fluorescence intensity (X-axis)
versus the number of counts (cells) before seeding in scaffolds (A) and after cell recovery from the implantation site (90 days in vivo growth plus 40
additional days for in vitro expansion (B) (R3 ¼ non-fluorescent cells, R8 ¼ low fluorescence cell fraction, R4 ¼ high fluorescence cell fraction).
Overlapped FACS analysis graph A (green line) and B (red line); the region corresponding to control cells non-virally transduced is shown shaded in blue
(C). Luminometric values for Pluc activity of cells collected from the R4 and R8 regions in A and B (D).
I. Roman et al. / Biomaterials 28 (2007) 2718–2728 2727
lungs and spleen, indicating that the implanted cells hadvery little or no tendency to colonize other organs.
5. Conclusions
We demonstrate a methodological platform comprisingviral expression vectors, stem cells and in vivo non-invasiveimaging procedures to analyze stem cell–biomaterialcombinations used for tissue repair in real life conditions.The approach is based on the use of non-invasive imagingto monitor the behavior of photoprotein-expressingprogenitor cells seeded in scaffolds, which are thenimplanted in nude mice. The procedure is simple, sensitiveand easy to implement. The possibility to perform repeatedimages of the same animal during extended periodsof time and to analyze different material–cell combina-tions in the same animal improves data consistency andanimal welfare, also resulting in savings of resources. Thisapproach should facilitate the screening and developmentof scaffold materials, avoiding the difficulties associated
with in vitro assays, for the development of cell basedtherapies.
Acknowledgements
The authors would like to thank Dr. Oriol Juan andMaAngeles Velasco for their help with the histologycinterpretations, and Dr. Ignasi Gich (Department ofEpidemiology, Hospital Sant Pau) for his assistance withthe statistical analysis of the data. This study was funded inpart by grants from EU-FR6 Integrated Project GENOS-TEM, La Marato TV3 and the Foundation and RedTematica de Investigacion Cooperativa TERCEL Minis-terio de Sanidad y Consumo.
Appendix A. Supplementary Materials
Supplementary data associated with this article canbe found in the online version at doi:10.1016/j.jtbi.2004.11.017.

ARTICLE IN PRESSI. Roman et al. / Biomaterials 28 (2007) 2718–27282728
References
[1] Langer R, Vacanti JP. Tissue engineering. Science 1993;260:920–6.
[2] Polak J, Hench L. Gene therapy progress and prospects: in tissue
engineering. Gene Ther 2005;12:1725–33.
[3] Pittenger MF, Mackay AM, Beck SC, Jaiswal RK, Douglas R,
Mosca JD, et al. Multilineage potential of adult human mesenchymal
stem cells. Science 1999;284:143–7.
[4] Caplan AI. Mesenchymal stem cells. J Orthop Res 1991;9:641–50.
[5] Prockop DJ. Marrow stromal cells as stem cells for nonhematopoietic
tissues. Science 1997;276:71–4.
[6] Ciapetti G, Ambrosio L, Marletta G, Baldini N, Giunti A. Human
bone marrow stromal cells: in vitro expansion and differentiation for
bone engineering. Biomaterials 2006;27:6150–60.
[7] Magne D, Vinatier C, Julien M, Weiss P, Guicheux J. Mesenchymal
stem cell therapy to rebuild cartilage. Trends Mol Med 2005;
11:519–26.
[8] Bianco P, Riminucci M, Gronthos S, Robey PG. Bone marrow
stromal stem cells: nature, biology, and potential applications. Stem
Cells 2001;19:180–92.
[9] Lange C, Schroeder J, Stute N, Lioznov MV, Zander AR. High-
potential human mesenchymal stem cells. Stem Cells Dev 2005;
14:70–80.
[10] Zuk PA, Zhu M, Mizuno H, Huang J, Futrell JW, Katz AJ, et al.
Multilineage cells from human adipose tissue: implications for cell-
based therapies. Tissue Eng 2001;7:211–28.
[11] Zheng B, Cao B, Li G, Huard J. Mouse adipose-derived stem cells
undergo multilineage differentiation in vitro but primarly osteogenic
and chondrogenic differentiation in vivo. Tissue Eng 2006;12:
1891–901.
[12] Griffith LG, Naughton G. Tissue engineering-current challenges and
expanding opportunities. Science 2002;295:1009–14.
[13] Niklason LE, Langer R. Prospects for organ and tissue replacement.
JAMA 2001;285:573–6.
[14] Rezwan K, Chen QZ, Blaker JJ, Boccaccini AR. Biodegradable and
bioactive porous polymer/inorganic composite scaffolds for bone
tissue engineering. Biomaterials 2006;27:3413–31.
[15] Karageorgiou V, Kaplan D. Porosity of 3D biomaterial scaffolds and
osteogenesis. Biomaterials 2005;26:5474–91.
[16] Lee H, Teng S, Chen H, Lo W, Sun Y, Lin T, et al. Imaging
human bone marrow stem cell morphogenesis in polyglycolic
acid scaffold by multiphoton microscopy. Tissue Eng 2006;12:
2835–41.
[17] Campbell A, Sala-Newby G. Bioluminescent and chemiluminescent
indicators for molecular signaling and function in living cells. In:
Mason WT, editor. Fluorescent and luminescent probes for
biological activity. New York: Academic Press; 1996. p. 58–82.
[18] Benaron DA, Cheong WF, Stevenson DK. Tissue optics. Science
1997;276:2002–3.
[19] Muller G, Chance B, Alfano R. Medical optical tomography:
functional imaging and monitoring. Bellingham, WA: SPIE Optical
Engineering Press; 1993.
[20] Matsumoto K, Anzai M, Nakagata N, Takahashi A, Takahashi Y,
Miyata K. Onset of paternal gene activation in early mouse embryos
fertilized with transgenic mouse sperm. Mol Reprod Dev 1994;39:
136–40.
[21] Thompson EM, Adenot P, Tsuji FI, Renard JP. Real time imaging of
transcriptional activity in live mouse preimplantation embryos using
a secreted luciferase. Proc Natl Acad Sci USA 1995;92:1317–21.
[22] Contag CH, Spilman SD, Contag PR, Oshiro M, Eames B, Dennery
P, et al. Visualizing gene expression in living mammals using a
bioluminescent reporter. Photochem Photobiol 1997;66:523–31.
[23] Sweeney TJ, Mailander V, Tucker AA, Olomu AB, Zhang W, Cao Y,
et al. Visualizing the kinetics of tumor-cell clearance in living animals.
Proc Natl Acad Sci USA 1999;96:12044–9.
[24] El Hilali N, Rubio N, Martinez-Villacampa M, Blanco J. Combined
noninvasive imaging and luminometric quantification of luciferase-
labeled human prostate tumors and metastases. Lab Invest 2002;
82:1563–71.
[25] de Boer J, van Blitterswijk C, Lowik C. Bioluminescent imaging:
emerging technology for non-invasive imaging of bone tissue
engineering. Biomaterials 2006;27:1851–8.
[26] Klump H, Schiedlmeier B, Vogt B, Ryan M, Ostertag W, Baum C.
Retroviral vector-mediated expression of HoxB4 in hematopoietic
cells using a novel coexpression strategy. Gene Ther 2001;8:811–7.
[27] Ory DS, Neugeboren BA, Mulligan RC. A stable human-derived
packaging cell line for production of high titer retrovirus/vesicular
stomatitis virus G pseudotypes. Proc Natl Acad Sci USA 1996;
93:11400–6.
[28] Lutolf MP, Lauer-Fields JL, Schmoekel HG, Metters AT, Weber FE,
Fields GB, et al. Synthetic matrix metalloproteinase-sensitive
hydrogels for the conduction of tissue regeneration: engineering
cell-invasion characteristics. Proc Natl Acad Sci USA 2003;100:
5413–8.
[29] Srouji S, Maurice S, Livne E. Microscopy analysis of bone marrow-
derived osteoprogenitor cells cultured on hydrogel 3-D scaffold.
Microsc Res Techn 2005;66:132–8.
[30] El Hilali N, Rubio N, Blanco J. Different effect of paclitaxel on
primary tumor mass, tumor cell contents, and metastases for four
experimental human prostate tumors expressing luciferase. Clin
Cancer Res 2005;11:1253–8.
[31] Rubio N, Villacampa MM, El Hilali N, Blanco J. Metastatic burden
in nude mice organs measured using prostate tumor PC-3 cells
expressing the luciferase gene as quantifiable tumor cell marker.
Prostate 2000;44:133–43.
[32] Krishnan M, Park JM, Cao F, Wang D, Paulmurugan R, Tseng JR,
et al. Effects of epigenetic modulation on reporter gene expression:
implications for stem cell imaging. FASEB J 2006;20:106–8.