Photobiology of Symbiodinium revisited: bio-physical and bio-optical signatures
Upload
independentCategory
view
3download
0
International journal of Biomedical Engineering and Science (IJBES), Vol. 2, No. 1, January 2015
11
IN-VIVO CHARACTERIZATION OF BREAST TISSUE
BY NON-INVASIVE BIO-IMPEDANCE
MEASUREMENTS ANALYSIS
Tarek M. Elnimr1, Moustafa M. Mohamed
2, Tarek Y. Aref
3, Fathi A. El-Hussiny
1,
Islam G. Ali4
1Department of Physics, Faculty of Science, University of Tanta, Tanta, Egypt
2Department of Medical Equipment Technology, Faculty of Allied Medical Sciences,
Pharos University in Alexandria, Egypt 3Department of Radiodiagnosis, Medical Research Institute, Alexandria University,
Egypt 4Department of Medical Biophysics, Medical Research Institute, Alexandria University,
Egypt
ABSTRACT
Biological tissues have complex electrical impedance related to the tissue dimension, the internal structure
and the arrangement of the constituent cells. Since different tissues have different conductivities and
permittivities, the electrical impedance can provide useful information based on heterogeneous tissue
structures, physiological states and functions. In vivo bio-impedance breast measurements proved to be a
dependable method where these measurements can be adopted to characterize breast tissue into normal
and abnormal by a developed normalized coefficient of variation (NCV) as a numerical criterion of the bio-
impedance measurements. In this study 26 breasts in 26 women have been scanned with a homemade
Electrical Bio-impedance System (EBS). Characteristic breast conductivity and permittivity measurements
emerged for Mammographically normal and abnormal cases. CV and NCV are calculated for each case,
and the value of NCVs greater than 1.00 corresponds to abnormalities, particularly tumours while NCVs
less than 1.00 correspond to normal cases. The most promising results of (NCV) for permittivity at 1 MHz,
it detects 73% of abnormal cases including 100% tumor cases while it detects 82% of normal cases. The
numerical criterion NCV of in-vivo bio-impedance measurements of the breast appears to be promising in
breast cancer screening.
KEYWORDS
Breast electrical conductivity, Breast electrical permittivity, Breast Examination, Breast tissue
classification, Electrical Bio-Impedance
1. INTRODUCTION
Early detection of breast tissue pathologies has always been in the centre of medical community
due to increasing sickness rate of breast cancer and mortality. Within the last 15 years breast
cancer in the structure of oncologic pathology has shifted from the fourth place to the first [1].
Every fifth woman dies due to breast cancer. Survival rate after treatments depends on the phase
of the oncologic process [2]. That is why early detection of cancer as well as other diseases of the
mammary gland is prerequisite to reduction of death-rate among women. Currently the gold
standard methods for detection of mammary glands pathologies are the radiography of mammary
International journal of Biomedical Engineering and Science (IJBES), Vol. 2, No. 1, January 2015
12
glands (Mammography) and Ultrasonography examination. Mammography works by projecting
x-rays through the breast tissue to produce an image on photographic film. Radiologists look
through two dimensional image of the radio-density of the breast that reveals the internal
structures and classify breast tissues using the American College of Radiology (ACR) system and
Breast Imaging for Reporting and Diagnosis System (BI-RADS). Although mammograms are the
present gold standard for breast cancer screening, (sensitivity - 71-87%; specificity - 38%), they
do have multiple shortcomings. First, since they cause cumulative x-ray exposure and they are
difficult to use with dense breast tissue (prominent in younger women), mammography is mainly
recommended for women over age 40 years old. Next, many women avoid mammograms since
they find the breast compression uncomfortable and in some instances painful. Finally, since
mammography has a high number of false positive results, many women must undergo the
psychological trauma, physical scarring, and financial hardship of unnecessary biopsies [3]. Self-
descriptiveness of Ultrasonic examination in differential diagnostics of malignant and benignant
growths is rather high (Sensitivity - 98%; specificity - 59%). But the diagnostics accuracy
depends on such factors as: the equipment model, user’s experience and professional skill, the
patient’s age, her hormonal status, type and stage of disease [4]. Utilization of other methods -
nuclear magnetic resonance, computed tomography scan, radionuclide diagnostics – can’t
consider always affordable due to high cost of examination. The abovementioned methods,
offering high degree of resolution, make it possible to obtain images of the mammary gland. But
inability to show changes of the gland structure in digital format doesn’t allow researchers and
doctors to evaluate the objective state of mammary glands. This is why a significant number of
experts involved in diagnostics, treatment and follow-up care of cancer patients as well as patients
suffering from other breast diseases, are faced with the task of discovering a new method for
identification of breast pathologies, which would differ from the other existing methods by
affordability, safety and level of information [5]. Instead of using above mentioned methods to
classify breast tissue and detect mammary gland malignancies, another possibility is to use
electricity to accomplish the same goal. The Electrical Bioimpedance of the breast is a non-
invasive technique used to differentiate malignancy based on the variation of electrical properties
presented by different tissues and cells [6]. The research goal of this paper is to investigate the
diagnostic capabilities of the non-invasive in-vivo electrical bio-impedance measurements of the
breast in the manner of numerical criteria.
2. EXPERIMENTAL METHODS
In this study 26 individual breasts in 26 women were scanned and investigated by a homemade
Electrical Bio-impedance System (EBS). All examinations done at Medical Research Institute,
Alexandria University, after all the volunteers completed the necessary consent forms. Before the
EBS exam, all the patients were classified by a radiologist using Mammography and
Ultrasonography. 11 cases were normal and 15 cases were abnormal including 5 cases with
malignant breast tumours, 3 cases with scar, 3 cases with cyst, 1 case with drained cyst, 2 cases
with fibrocystic changes, and 1 case with irregularities.
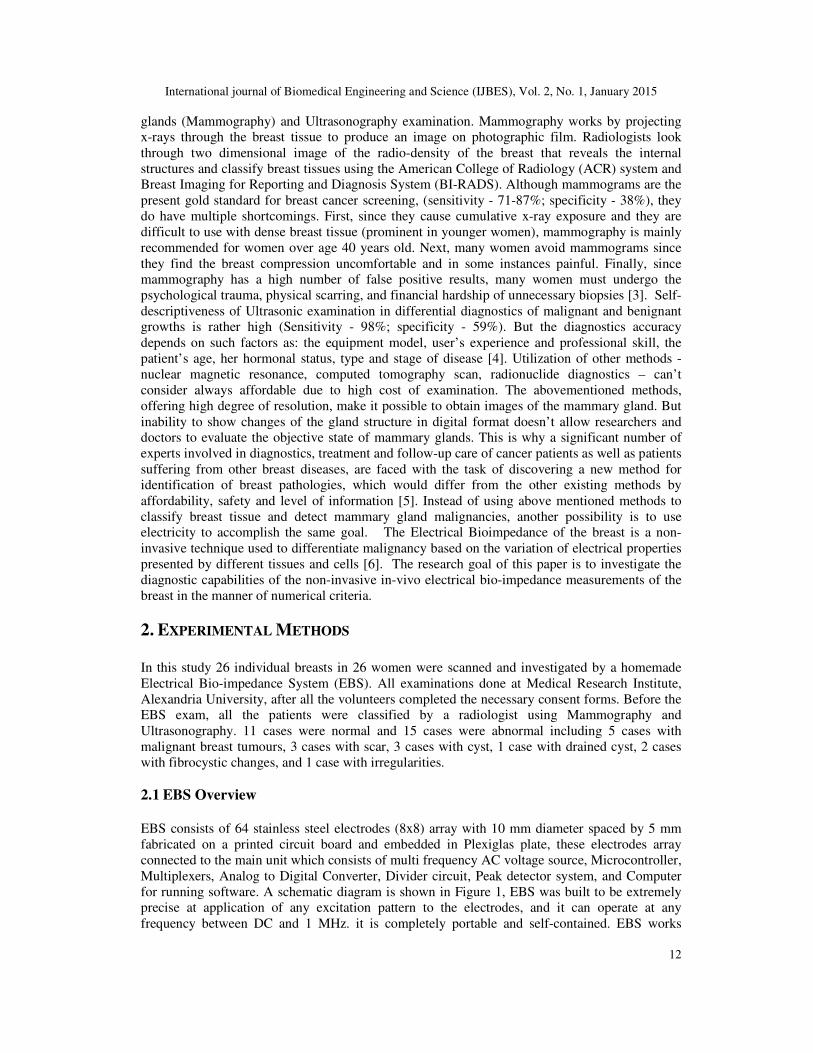
2.1 EBS Overview EBS consists of 64 stainless steel electrodes (8x8) array with 10 mm diameter spaced by 5 mm
fabricated on a printed circuit board and embedded in Plexiglas plate, these electrodes array
connected to the main unit which consists of multi frequency AC voltage source, Microcontroller,
Multiplexers, Analog to Digital Converter, Divider circuit, Peak detector system, and Computer
for running software. A schematic diagram is shown in Figure 1, EBS was built to be extremely
precise at application of any excitation pattern to the electrodes, and it can operate at any
frequency between DC and 1 MHz. it is completely portable and self-contained. EBS works
International journal of Biomedical Engineering and Science (IJBES), Vol. 2, No. 1, January 2015
13
through operation Sequences as follow, a designed Bio-image scanner V2.0 software was
developed using Microsoft Visual Basic .NET to control the hardware via the computers’ USB by
sending an asynchronous message to the data acquisition component in the main unit via USB
forcing it to start its operation. The data acquisition component is a microcontroller based system
that activates one of the multiplexers and send the selection data (for the channel selection within
the same multiplexer) to gain the access to one electrode while disabling the other 63 ones. The
analog voltage across the examined tissue that placed between selected electrode and reference
electrode is converted to the corresponding DC value using the AC/DC converter circuit. The DC
voltage is measured and then converted to a digital value using the 8-bit ADC converter module.
The data acquisition system responds with a stream of data (64 units) representing the data from
the electrode set. The software waits for this data stream to save in an ASCII-formatted text file
using the Microsoft Visual Basic .NET file system capabilities.
Figure 1. A schematic diagram for EBS hardware.
2.2. Safety Guidelines
The EBS intentionally passes electrical currents through the human body. Unlike defibrillation or
electric convulsive therapy, this injected current is not therapeutic, and it is only intended for
diagnostic purposes. By operating the EBS between 10 kHz and 1 MHz, we expect to avoid any
danger [7]. Since cell ion junctions only can open and close on the order of 1 millisecond, an
electronic signal significantly above 1 kHz (period of 1 ms) should not affect the cell’s ion flows,
thus avoiding neural or cardiac activation [8, 9]. By operating below a maximum RMS current
flow of 10 mA with 5 Vpp AC voltages, resistive heating is avoided simply because not enough
electric energy is being applied. The patient is electrically isolated standing on an insulating plate.
Also, the patient is not allowed to contact anything connected to any electrical outlets during the
exam. The isolation is important so no electric current can flow from an external source through
the patient to the EBS. Hence, currents enter and leave the body only in the electrode array plane.
2.3. Breast tissue scanning
The protocol for scanning the women breasts was simple. Patients stand on an isolating plate, the
electrode array level adjusted to allow one breast to be scanned and the breast under investigation
is placed between the 64 electrodes array and the reference electrode plates. It generally took
about five minutes to position the breast in the electrode array while three minutes were required
to acquire data at specific frequency. A typical EBS breast exam lasted from 5 to 10 minutes
depending how many scanning processes were taken. Measurements were taken at frequencies
10, 125, 525 kHz and 1 MHz using the excitation patterns RMS current 4 mA.
International journal of Biomedical Engineering and Science (IJBES), Vol. 2, No. 1, January 2015
14
3. RESULTS
For an attempt to quantitatively separate the scanned breasts into normal and abnormal categories,
the average and standard deviations were calculated for the conductivity and permittivity values
for each scanned breast. To minimize the effect of the edge artifacts, only the material properties
across the central 2/3 of all scanned area were used. Also, the coefficient of variation (CV) and
the normalized coefficient of variation (NCV) were calculated for the conductivity and
permittivity domains [10]. Equation 3.1 defines both CV and NCV.
( )
( )xavg
xstdCV =
,
normal
given
CV
CVNCV = … (1)
(X) Represents the distribution of material properties σ or ε in each scan. (NCV) is the ratio of the
coefficient of variation (CV) from a given patient to that of a patient diagnosed as normal. If
NCV greater than 1.00 the breast is diagnosed as abnormal.
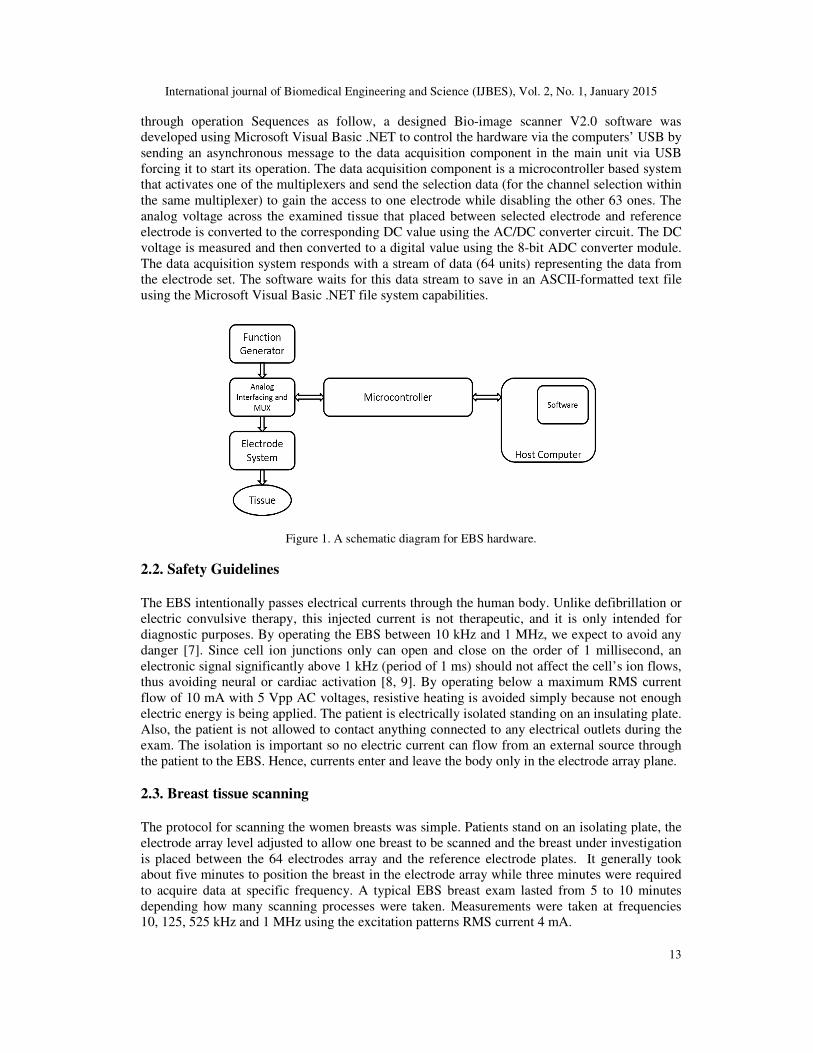
Figure (2) and figure (3) compares the averages and standard deviations of the conductivities and
permittivities at 125 kHz between the different groups. There is no apparent separation of tumour
cases.
Figure 2: Average conductivity σ at 125 kHz for the breasts from 26 patients. The blue portion of each bar
is the average, while the top red portion is the standard deviation for each case.
International journal of Biomedical Engineering and Science (IJBES), Vol. 2, No. 1, January 2015
15
Figure 3: Average Permittivity ε from the Bio-impedance scan at 125 kHz for the breasts from 26 patients.
The blue portion of each bar is the average, while the top red portion is the standard deviation for each case.
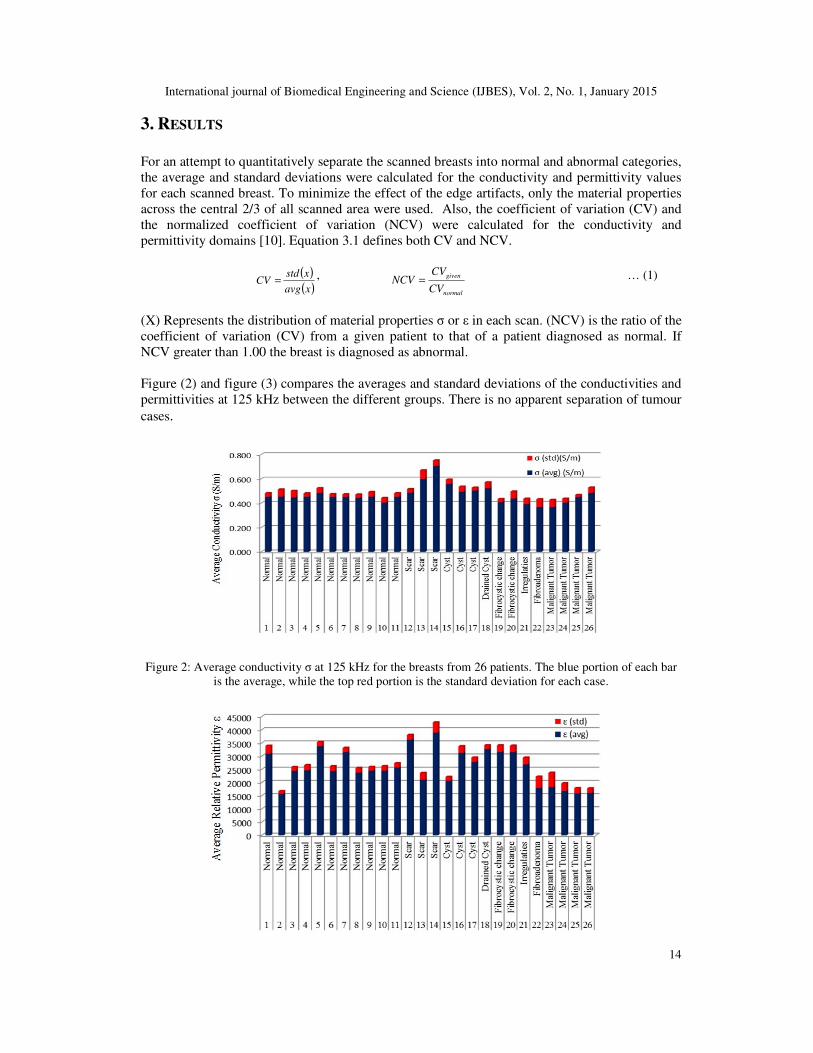
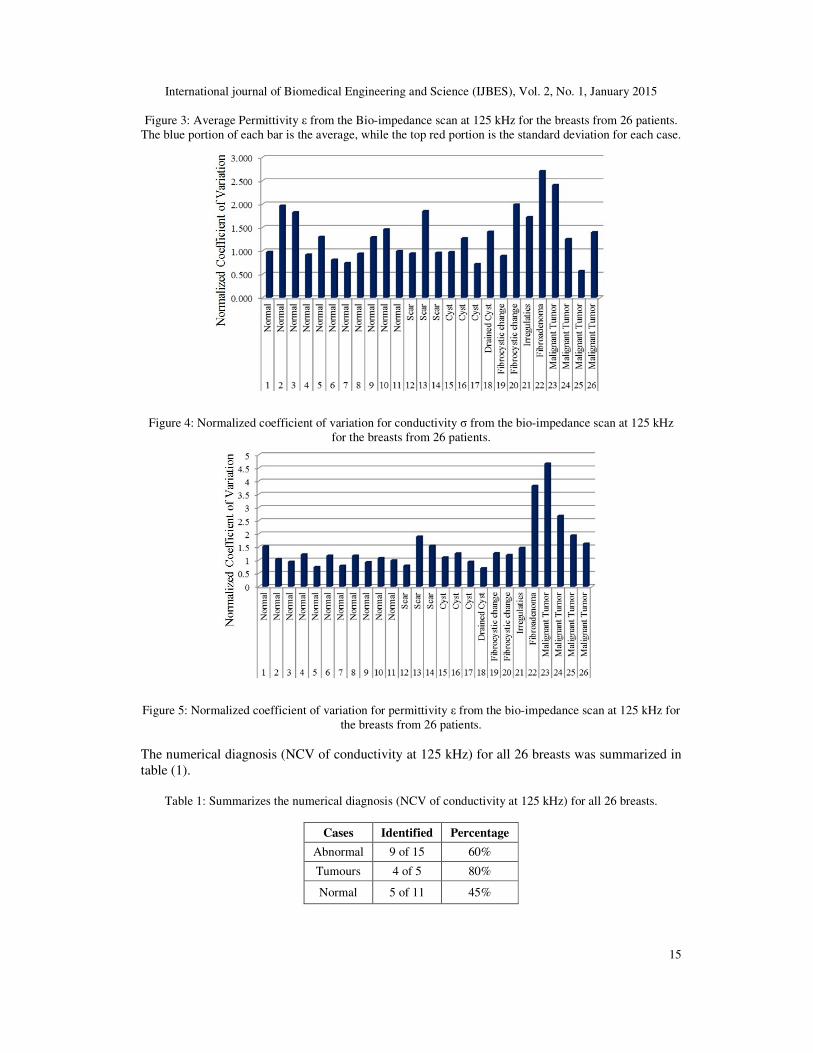
Figure 4: Normalized coefficient of variation for conductivity σ from the bio-impedance scan at 125 kHz
for the breasts from 26 patients.
Figure 5: Normalized coefficient of variation for permittivity ε from the bio-impedance scan at 125 kHz for
the breasts from 26 patients.
The numerical diagnosis (NCV of conductivity at 125 kHz) for all 26 breasts was summarized in
table (1).
Table 1: Summarizes the numerical diagnosis (NCV of conductivity at 125 kHz) for all 26 breasts.
Cases Identified Percentage
Abnormal 9 of 15 60%
Tumours 4 of 5 80%
Normal 5 of 11 45%
International journal of Biomedical Engineering and Science (IJBES), Vol. 2, No. 1, January 2015
16
The numerical diagnosis (NCV of permittivity at 125 kHz) for all 26 breasts was summarized in
table (2).
Table 2: Summarizes the numerical diagnosis (NCV of permittivity at 125 kHz) for all 26 breasts.
Cases Identified Percentage
Abnormal 12 of 15 80%
Tumours 5 of 5 100%
Normal 4 of 11 36%
To ascertain how well the NCV distinguishes tumours at other frequencies, the entire analysis
was repeated at 10 kHz, 525 kHz, and 1 MHz Since the NCV for permittivity decisively separates
more tumour cases than the NCV for conductivity, only the permittivity cases will be considered.
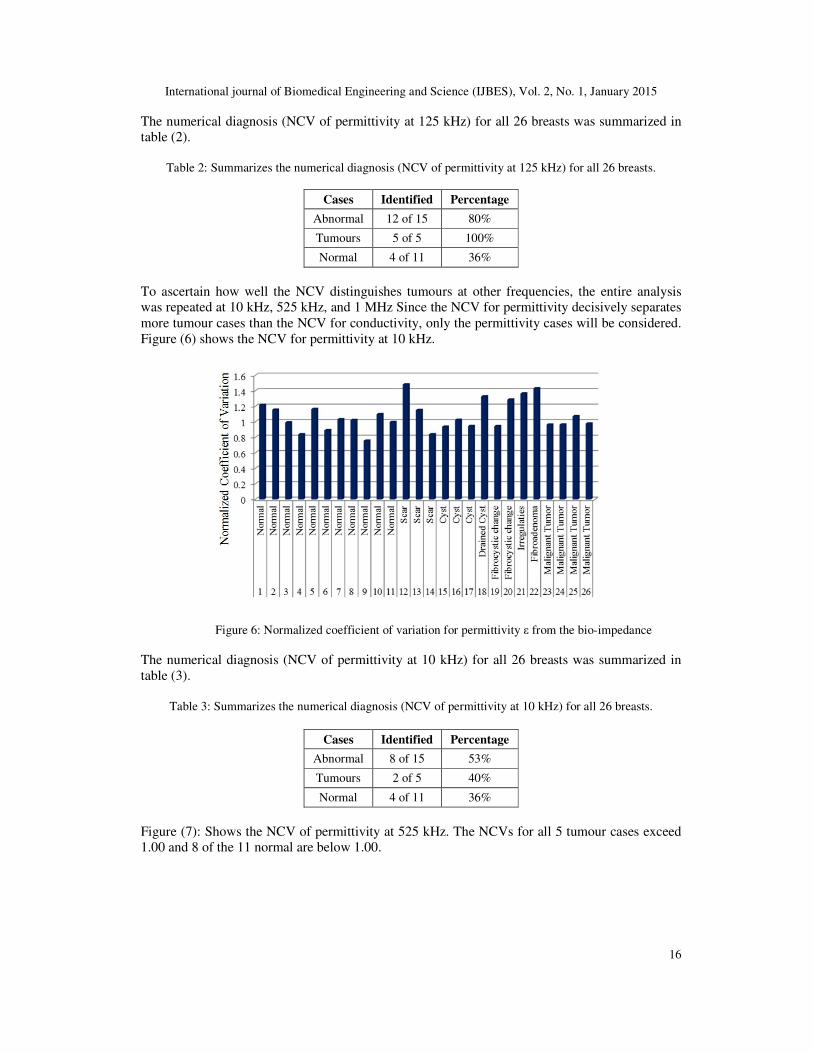
Figure (6) shows the NCV for permittivity at 10 kHz.
Figure 6: Normalized coefficient of variation for permittivity ε from the bio-impedance
The numerical diagnosis (NCV of permittivity at 10 kHz) for all 26 breasts was summarized in
table (3).
Table 3: Summarizes the numerical diagnosis (NCV of permittivity at 10 kHz) for all 26 breasts.
Cases Identified Percentage
Abnormal 8 of 15 53%
Tumours 2 of 5 40%
Normal 4 of 11 36%
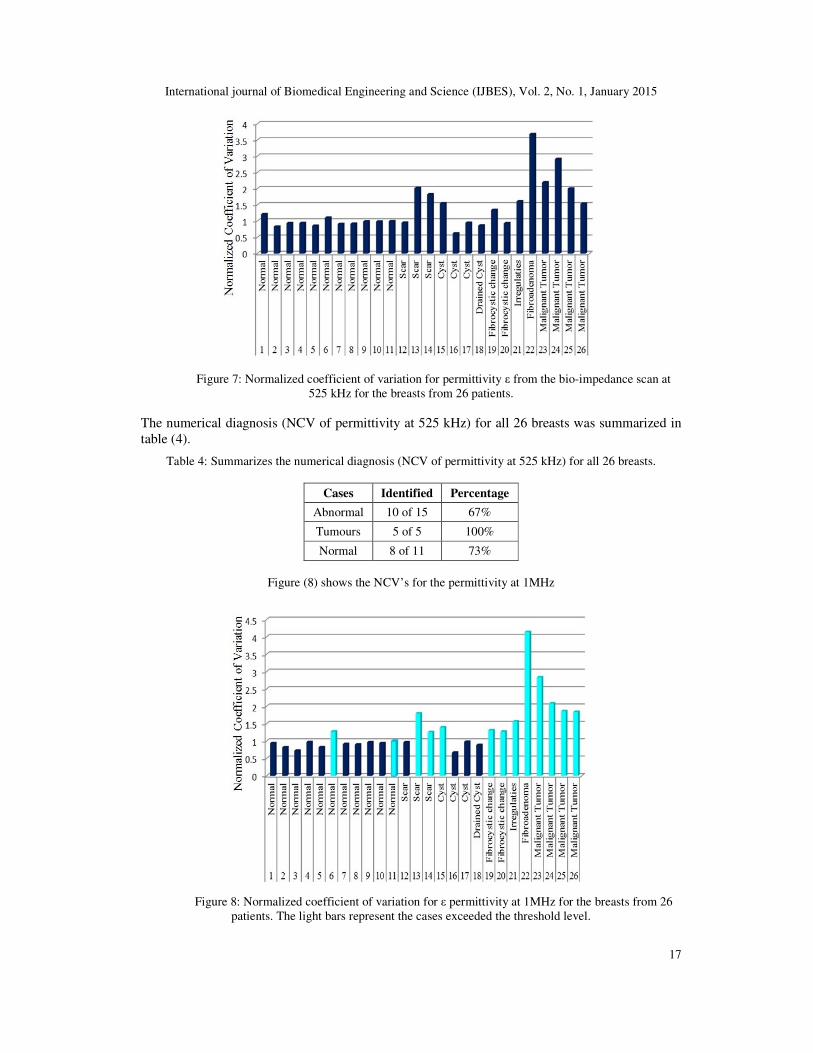
Figure (7): Shows the NCV of permittivity at 525 kHz. The NCVs for all 5 tumour cases exceed
1.00 and 8 of the 11 normal are below 1.00.
International journal of Biomedical Engineering and Science (IJBES), Vol. 2, No. 1, January 2015
17
Figure 7: Normalized coefficient of variation for permittivity ε from the bio-impedance scan at
525 kHz for the breasts from 26 patients.
The numerical diagnosis (NCV of permittivity at 525 kHz) for all 26 breasts was summarized in
table (4).
Table 4: Summarizes the numerical diagnosis (NCV of permittivity at 525 kHz) for all 26 breasts.
Cases Identified Percentage
Abnormal 10 of 15 67%
Tumours 5 of 5 100%
Normal 8 of 11 73%
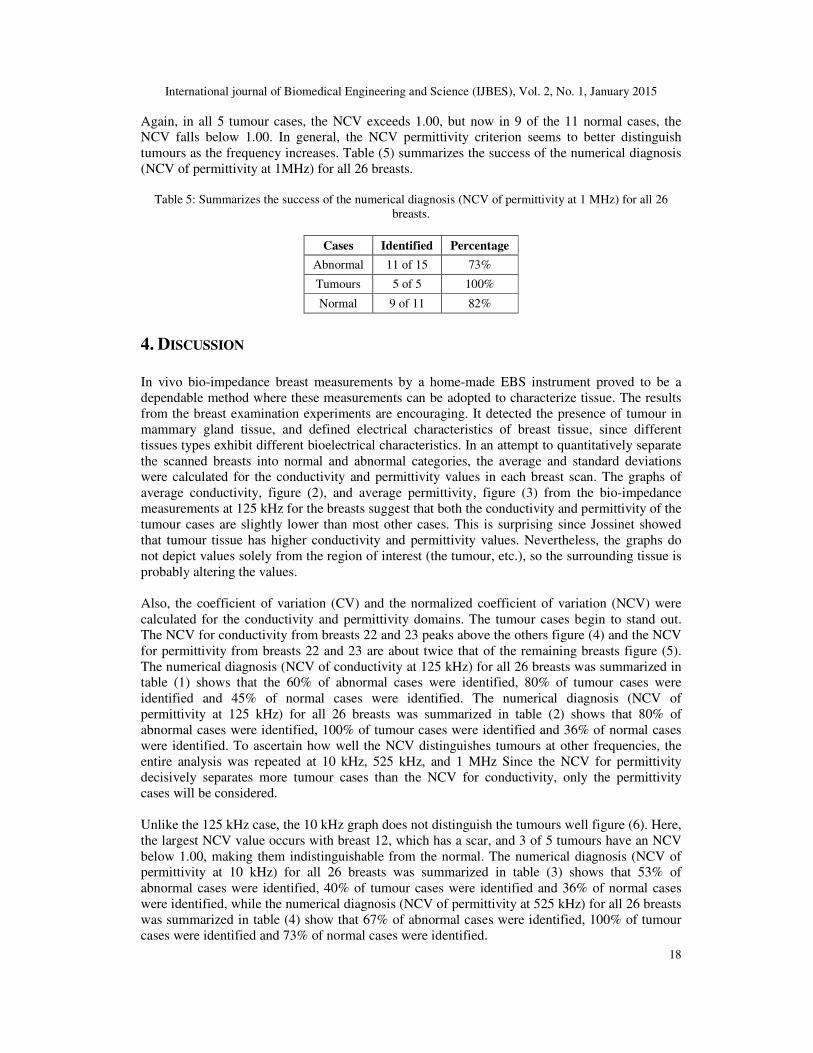
Figure (8) shows the NCV’s for the permittivity at 1MHz
Figure 8: Normalized coefficient of variation for ε permittivity at 1MHz for the breasts from 26
patients. The light bars represent the cases exceeded the threshold level.
International journal of Biomedical Engineering and Science (IJBES), Vol. 2, No. 1, January 2015
18
Again, in all 5 tumour cases, the NCV exceeds 1.00, but now in 9 of the 11 normal cases, the
NCV falls below 1.00. In general, the NCV permittivity criterion seems to better distinguish
tumours as the frequency increases. Table (5) summarizes the success of the numerical diagnosis
(NCV of permittivity at 1MHz) for all 26 breasts.
Table 5: Summarizes the success of the numerical diagnosis (NCV of permittivity at 1 MHz) for all 26
breasts.
Cases Identified Percentage
Abnormal 11 of 15 73%
Tumours 5 of 5 100%
Normal 9 of 11 82%
4. DISCUSSION
In vivo bio-impedance breast measurements by a home-made EBS instrument proved to be a
dependable method where these measurements can be adopted to characterize tissue. The results
from the breast examination experiments are encouraging. It detected the presence of tumour in
mammary gland tissue, and defined electrical characteristics of breast tissue, since different
tissues types exhibit different bioelectrical characteristics. In an attempt to quantitatively separate
the scanned breasts into normal and abnormal categories, the average and standard deviations
were calculated for the conductivity and permittivity values in each breast scan. The graphs of
average conductivity, figure (2), and average permittivity, figure (3) from the bio-impedance
measurements at 125 kHz for the breasts suggest that both the conductivity and permittivity of the
tumour cases are slightly lower than most other cases. This is surprising since Jossinet showed
that tumour tissue has higher conductivity and permittivity values. Nevertheless, the graphs do
not depict values solely from the region of interest (the tumour, etc.), so the surrounding tissue is
probably altering the values.
Also, the coefficient of variation (CV) and the normalized coefficient of variation (NCV) were
calculated for the conductivity and permittivity domains. The tumour cases begin to stand out.
The NCV for conductivity from breasts 22 and 23 peaks above the others figure (4) and the NCV
for permittivity from breasts 22 and 23 are about twice that of the remaining breasts figure (5).
The numerical diagnosis (NCV of conductivity at 125 kHz) for all 26 breasts was summarized in
table (1) shows that the 60% of abnormal cases were identified, 80% of tumour cases were
identified and 45% of normal cases were identified. The numerical diagnosis (NCV of
permittivity at 125 kHz) for all 26 breasts was summarized in table (2) shows that 80% of
abnormal cases were identified, 100% of tumour cases were identified and 36% of normal cases
were identified. To ascertain how well the NCV distinguishes tumours at other frequencies, the
entire analysis was repeated at 10 kHz, 525 kHz, and 1 MHz Since the NCV for permittivity
decisively separates more tumour cases than the NCV for conductivity, only the permittivity
cases will be considered.
Unlike the 125 kHz case, the 10 kHz graph does not distinguish the tumours well figure (6). Here,
the largest NCV value occurs with breast 12, which has a scar, and 3 of 5 tumours have an NCV
below 1.00, making them indistinguishable from the normal. The numerical diagnosis (NCV of
permittivity at 10 kHz) for all 26 breasts was summarized in table (3) shows that 53% of
abnormal cases were identified, 40% of tumour cases were identified and 36% of normal cases
were identified, while the numerical diagnosis (NCV of permittivity at 525 kHz) for all 26 breasts
was summarized in table (4) show that 67% of abnormal cases were identified, 100% of tumour
cases were identified and 73% of normal cases were identified.
International journal of Biomedical Engineering and Science (IJBES), Vol. 2, No. 1, January 2015
19
Again, for NCV of permittivity at 1MHz, figure (8), all 5 tumour cases have NCV value exceeds
1.00, but now in 9 of the 11 normal cases, the NCV falls below 1.00. In general, the NCV
permittivity criterion seems to better distinguish tumours as the frequency increases. Table (5)
summarizes the success of the numerical diagnosis (NCV of permittivity at 1MHz) for all 26
breasts the table shows that 73% of abnormal cases were identified, 100% of tumour cases were
identified and 82% of normal cases were identified.
5. CONCLUSIONS
Throughout this paper, there has been a progression of experiments from the construction of the
EBS device to the breast examination studies. The goal is to make a meaningful contribution to
electrical bio-impedance measurements for the breast by developing a numerical criterion that
fully employ the multi-frequency measurements to classify and diagnose the breasts tissue. The
results from the breast scan experiments are encouraging and the most promising numerical
parameter is the normalized coefficient of variation (NCV) for permittivity at 1 MHz NCVs
greater than 1.00 corresponds to abnormalities, particularly tumours while NCVs less than 1.00
correspond to normal cases. Using numerical method, the EBS measurements best distinguish
tumours above 125 kHz. At higher frequencies, more current flows through the intracellular
compartment. Rapidly dividing tumour cells usually have larger nuclei than normal cells, so the
higher frequencies may be highlighting this difference. The numerical method is able to
distinguishing tumours from other abnormalities. In the NCV permittivity graphs at 525 and
1MHz, several of the tumour cases had noticeably higher peaks than the other abnormalities.
Although this study is promising, clearly a larger patient population needs to be tested in order to
give statistical significance to the results. EBS system has not been tested on a very large patient
pool nor have all the suspicious cases been confirmed with biopsies. This all can certainly change
over time.
REFERENCES
[1] Korotkova M. Karpov A., (2007) The technique of estimation of the electroimpedance image of the
matmnary gland. XIII international conference on electrical bio-impedance. Graz, Austria.
[2] Sotskova N. Karpov A. Korotkova D. Sentcha, (2007) A. Particularities of the electroimpedance
images in different forms of infiltrative breast cancer. XIII international conference on electrical
bioimpedance. Graz, Austria.
[3] Heywang öbrunner S.H. Hacker A. Sedlacek S., (2011) Advantages and Disadvantages of
Mammography Screening, Breast Care, 6:P199–207.
[4] Mary F. Dillon, Arnold D. K. Hill. Cecily M. Quinn, Ann O'Doherty, Enda W. McDermott, Niall
O'Higgins, (2005), The Accuracy of Ultrasound, Stereotactic, and Clinical Core Biopsies in the
Diagnosis of Breast Cancer, With an Analysis of False-Negative Cases, Ann Surg., 242(5): 701–707.
[5] Carol H. Lee, et al, (2010) Breast Cancer Screening with Imaging: Recommendations from the
Society of Breast Imaging and the ACR on the Use of Mammography, Breast MRI, Breast
Ultrasound, and Other Technologies for the Detection of Clinically Occult Breast Cancer, Journal of
the American College of Radiology, Vol. 7, P 18–27.
[6] Bodenstein, Marc, David, Matthias, Markstaller, Klaus, (2009) Principles of electrical impedance
tomography and its clinical application, Vol. 37 - Issue 2 - pp 713-724.
[7] BH Brown, (2003) Electrical impedance tomography (EIT): a review, Vol. 27, No. 3, PP 97-108.
[8] Breast Cancer Detection Demonstration Project (BCDDP) (1985), J. Reproductive Medicine, 30:45, P
1-459.
[9] Celia Byrne, Catherine Schairer, John Wolfe, Navin Parekh, Martine Salane,, Louise A. Brinton,
Robert Hoover and Robert Haile, (1995) Mammographic Features and Breast Cancer Risk: Effects
with Time, Age, and Menopause Status. JNCI J Natl Cancer Inst., 87(21): 1622-1629.
International journal of Biomedical Engineering and Science (IJBES), Vol. 2, No. 1, January 2015
20
[10] Osterman KS, Kerner TE, Williams DB , Hartov A, Poplack SP , Paulsen KD., (2000) Multifrequency
Electrical Impedance Imaging: Preliminary in Vivo Experience in Breast. J. Phys. Meas, 21(1), P 99 -
109.
Copyright © 2022 FDOKUMEN